Abstract
Does a high school student’s family characteristics and ethnicity affect their rate of suspension? Racial disparities in suspension rates are well documented and two conflicting explanations are prevalent in previous literature. The first attributes the gap to differences in socioeconomic status and a student’s situation. The other suggests that institutional factors cause this disparity. This research examines the effect of demographic variables on punishment outcomes using the Education Longitudinal Study of 2002 (a survey study by the National Center for Education Statistics) as a data source and Oaxaca decompositions as a method of data analysis. The final data used consisted of 6,136 students with 77% White and 23% Black or Hispanic. The Blinder-Oaxaca decomposition was able to split the difference between the suspension rate of these two groups into explained and unexplained portions. The total White-minority suspension gap is -6.52 percentage points. The results show that the family characteristics or endowments account for -1.71 percentage points of this gap, the interaction component contributes +1.06 percentage points, and the remaining -5.87 percentage points fall into the coefficients component that is not explained by the measured characteristics. Family characteristics account for only a very small part of the suspension gap, a finding more similar to institutional explanations rather than socioeconomic ones. Future research should incorporate school level variables to further decompose this disparity.
Keywords: school suspension; racial disparities; Blinder–Oaxaca decomposition; family characteristics; discipline gap; institutional discrimination.
Introduction
In the USA, roughly 5.4% of students experience suspension. When examined more closely, specifically regarding Black students, 15.2% of Black students were suspended. On the other hand, only 3.0% of White students were suspended1. There is a difference of over 10% of students who get suspended between the Black vs White communities.
This disparity has led to two different explanations throughout various works of literature. One view argues that racial gaps in suspension are simply a reflection of differences between students in different socioeconomic statuses. On the other hand, a contrasting view argues that even after accounting for the potential differences in socioeconomic status and background, the gap in the suspension rate is not fully explained.
A growing literature in economics studies how suspensions affect children’s lives. Suspension has been linked to future problems such as disapproval of the school environment and the worsening of a student’s grades2. Finally, this study found that suspension directly leads to future misconduct. Overall, studies conclude that one-time punishments such as suspensions also lead to an increase in the chances of future punishments. Since there are many documented consequences in a student’s life due to suspensions, it is important to identify the source of these disparities. Since there is a gap between the suspension rates of Black and White students, some may conclude that this is due to other circumstances, referred to in this paper as Family Characteristics. However, Black or multiracial Black elementary school children have been shown to be more likely to be suspended or receive detentions even when factors like socioeconomic status were controlled1. This is consistent with the explanation of institutional discrimination. It suggests that even when accounting for socioeconomic status, Black or Hispanic students face a higher risk of suspension, indicating that there may be factors beyond family background. This paper further explores this area. While it doesn’t identify the cause of the suspension gap, it attempts to explain the suspension gap by including more variables and using a different method.
Does a student’s family characteristics and ethnicity affect their rate of suspension? In this case, family characteristics refer to a student’s life at home including variables such as income, parental structure, and number of siblings (defined more thoroughly in the data section) Answering this question will connect directly to the explanations of the discipline gap. If the suspension gap found can be fully explained by family characteristics, it will support the explanation that the suspension gap between Black or Hispanic students and White students is a product of socioeconomic and background differences. It is interesting to note that Hispanic students have lower income on average3. When looking in the context of students in high school, specifically their disciplinary record, there is a disparity within the number of Black and Hispanic students who get suspended when compared to White students. This paper controls for these family characteristics when investigating the suspension gap between Black/Hispanic students and White students.
Using the Blinder-Oaxaca decomposition method4, a statistical method for distinguishing the explained and unexplained portions of a statistical outcome, this study investigates factors that contribute to suspensions. This method also decomposes the factors that contribute to suspensions of White versus Black and Hispanic students into unexplained and explained where the unexplained portion highlights the part of the gap that is not explained by the situation of the students.
By decomposing the suspension gap into explained and unexplained portions, the paper will serve as evidence for one of the competing theories regarding racial disparities in suspensions
The results of the decompositions show that the observed suspension gap between the two groups cannot be explained by the differences in the observed family characteristics. Specifically, of the -6.52 percentage-point gap in suspension rate, only -1.71 percentage points of that gap is attributable to the measured family characteristics (endowments), and 1.06 percentage points reflects the interaction between family characteristics and coefficients. The coefficients component alone accounts for -5.87 percentage points of the gap, which is not explained by the measured family characteristics. This means that the same family characteristics are associated with higher suspension probabilities for Black and Hispanic students than for White students. This paper does not allow for a causal conclusion, however, it supports the institutional explanation for the suspension gap rather than the socioeconomic one.
This paper is organized as follows. In the Literature Review, I review the literature on inequality between White and non-White students in school settings along with information surrounding suspension. In the data section, I briefly present the data, including categories and the source. In the Methodology section, I introduce Oaxaca decompositions and how they were implemented into my analysis. Next, in the Results section, I summarize the results of my data analysis. In the Discussion section, I discuss my results and their implications. In the Limitations section, I address constraints of the data and method that affect how the results should be interpreted. In the Policy Implications section, I discuss what the findings do and do not support for future policy decisions. Finally, in the Conclusion section, I conclude with a summary of my results.
Literature Review
Racial Disparities in Discipline
To understand the suspension gap between these two groups of people, it is important to review prior research in this field. This section examines evidence about the suspension gap and two competing explanations.
Research has consistently shown that Black and Hispanic students have received suspensions at higher rates when accounting for their share of the school population. One study drew on the Fragile Families and Child Well-being Study, a group of approximately 5000 urban families, and finds that Black male students were suspended at significantly higher rates than White male students5. Furthermore, it was discovered that this difference in suspension rates still appeared after utilizing many different controls for family background. The authors found that differential treatment accounted for 46% of the Black and White suspension gap while only 9% could be attributed to differences in behavior. This suggests that other factors, beyond student conduct may contribute to racial disparities.
Nationally representative data from the Civil Rights Data Collection has been used to replicate and extend this pattern6. Their statistical analysis demonstrates that there are different proportions of suspensions for Black and Hispanic Students which has remained the case over decades of school years. This indicates that policies which were meant to target these inequalities did little to nothing to alleviate the disparities in suspension rates when comparing Black and Hispanic students to White students.
This belief is reinforced at the state levels by using Ohio proficiency data in a slightly different experiment7. They found that the disparities in suspension rates and other school issued punishments lead to different amounts of academic harm, measured through grades, on Black and White students. Overall, Black students were seen to experience greater academic harm than White students issued the same punishment. These results support the idea that racial disparities are consistent over different states, studies, and data sources.
Absenteeism is detrimental to student success and one study analyzed over 1.1 million students in North Carolina and found that American Indian, Black, Hispanic, and other multiracial students were, in proportion to their percent of the student body, more chronically absent than other students8. What was interesting to note is that after controlling for socioeconomic status, language status, and other possibly confounding variables, Black and Hispanic students were less likely to be chronically absent than White students. This hints that racial statistics may reflect a socioeconomic divide rather than simply racial differences.
Socioeconomic Status and Discipline
Socioeconomic status consists of a large group of variables and can serve as a predictor of discipline. Students whose parents had lower levels of education were more likely to have experienced suspension in a survey of 2539 high school students9. They found that this socioeconomic status effect remained statistically significant even after controlling for the student’s own reflections on their behavior and academic achievement. Other studies follow this pattern10. This study used data from 2536 high school students and analyzed it using a regression framework. They allowed variables such as race, gender, and free lunch eligibility to explain the differences found. They found that students with a low socioeconomic status were significantly more likely to receive referrals and suspensions independent of race or gender. This means that socioeconomic status and disciplinary action in schools are not simply dependent on race.
Another study adds another layer to the analysis by linking administrative data to neighborhood socioeconomic status indicators11. They found that schools in communities with an overall lower socioeconomic status were forced to give out suspensions at a higher rate than schools in communities with a higher socioeconomic status. They even controlled for academic performance at these schools. This means that the connection between socioeconomic status and discipline could have something to do with the environment that the institution is a part of. In this case, different socioeconomic status of the school’s environment leads to different results. It means that a student’s socioeconomic status can affect their disciplinary record through their family’s knowledge and means and also through the type of schools that these students can attend.
A different study used 10-year data and a method to control for many external variables, and found that on average, students received more punishments in the years where their families’ socioeconomic status had declined compared to years prior12. This study’s findings suggest that changes in socioeconomic status are usually right before changes in a student’s behavior. While this study does sample students getting into trouble broadly, it directly implies that economic decline for a family can result in measurable and statistically significant changes in a student’s behavior in that same year.
Connection Between Family Characteristics to Discipline Differences
Many studies have discussed the mechanisms where family socioeconomic status connects to disciplinary differences between groups. A direct account argues that low income students are more often assigned to schools that use harsher disciplinary methods5. Examples include schools with zero-tolerance policies or schools with worse teacher-student ratios. This results in family socioeconomic status affecting the discipline that a student receives due to the school selection process which matches families with worse socioeconomic status with worse schools. This is consistent with other findings such as a later study that implies that by only controlling for an individual’s socioeconomic status, one may underestimate the total effect of the socioeconomic situation that the family is in11.
Teacher perception also plays an important role in how disciplinary action affects students. Teacher biases and cultural assumptions about student behavior affect racial and socioeconomic disparities in particular how disciplinary actions are identified and carried out7. This is different from how school selection affects student’s disciplinary results and so it cannot be controlled for by controlling by school. This mechanism was tested and showed that racial gaps in absenteeism disappeared when socioeconomic controls were introduced8. This suggests that some of the patterns that were attributed to race may instead reflect socioeconomic status.
Academic outcomes and the justice department
Discipline which is imposed more on certain groups extends more than simply disrupting education. 15 waves of data from the National Longitudinal Survey of Youth from 1997 were used to find that receiving even one suspension drastically increased the odds of incarceration during young adulthood13. Repeated suspensions did not appear to give a proportionally large increase with each added suspension. This indicates that the first suspension is the most important and it serves as a sort of tipping point often leading students into lives of crime. This stresses the importance of the first suspension and was the driving factor behind this research using the category ever suspended as part of its analysis.
Teacher Institutional Mechanisms in Disciplinary Decisions
Research points to mechanisms that could explain the unexplained part of the suspension gap. In experiments, teachers were more likely to label the behavior of a Black student as a pattern and recommend more disciplinary measures after a second infraction even when these were identical to those committed by White students.14 This is consistent with earlier findings that used real disciplinary records. It found Black students were not referred to the office for objective infractions. However, they were significantly more likely to be reported for subjective ones like defiance.15 The identity of the adult in charge of the discipline is also seen to matter. A large data study found that Black students with same-race teachers received discipline at consistently lower rates than those taught by teachers of a different race.16 Taken together, these findings demonstrate that part of the suspension gap may be due to the way that adults and teachers respond to the student. This gap has been seen to be difficult to close as an experimental study of a large school district found that restorative justice programs did result in an overall decline in suspensions, but the racial gap in discipline was still mostly unchanged.17 This indicates that some potentially beneficial reforms could fail to address the issue.
Data
Now that the theoretical debate in literature has been explored, this section describes the data and variables used in the analysis. It explains the source and the decisions made.
The data is from the Education Longitudinal Study of 2002. This study was a nationally administered longitudinal study conducted by the National Center for Education Statistics. This study started by monitoring students in 10th grade during 2002. The goal was to monitor their academic progress through post secondary school and into the workforce. This process included follow-ups when students were in 12th grade (2004), a second in 2006, and a final one in 2012. The two main focuses of this study were the following questions:
- What are students’ trajectories from the beginning of high school into post secondary education, the workforce, and beyond?
- What are the different patterns of college access and persistence that occur in the years following high school completion
The ELS data set uses a stratified, two-stage cluster sampling design where schools are the sampling unit and students are held within schools. This being said, certain subgroups like Black and Hispanic students were intentionally over sampled. This means that they appear in the dataset at a higher rate than in the US student population. The Oaxaca decomposition used in this paper which was implemented via the Oaxaca package in R,18 does not account for these population proportion differences. This is a known constraint of the Oaxaca package and means that the estimates provided should be interpreted with regards to the sample rather than the population. This is further discussed in the limitations section.
The ELS:2002 dataset does contain some school level variables; however, this study focuses on student-level characteristics. Although school-level variables have been identified as important to this research, these explanatory variables were left out because this analysis chooses to separate family characteristics from school-level factors5. Thus, to include them would mix the two types of variables that this paper is supposed to separate.
This study was conducted through a multistage sampling and surveying process. This study has many different variables that are used in all parts of the analysis. Variables include the following which will be referred to as family characteristics from now on.
- Ever suspended
- Household income (log-transformed)
- Mother has a college degree
- Father has a college degree
- Mother’s Age when Student was Born
- Mother’s job type
- Father’s job type
- Number of siblings
- Has at least one male guardian
- Has at least one female guardian
- Is Black or Hispanic
From raw data to cleaned data, some people had to be removed from the data as they had incomplete information. The following table shows the percent missing from the raw data.
| Variable | White | Black and Hispanic |
| Missing Household Income | 24.22% | 34.86% |
| Missing Mom College | 18.24% | 35.61% |
| Missing Dad College | 20.03% | 41.68% |
| Missing Mother’s Birth Age | 11.20% | 17.11% |
| Missing Mother’s Job | 0.00% | 0.00% |
| Missing Father’s Job | 0.00% | 0.00% |
| Missing Siblings | 11.39% | 15.20% |
| Missing Has Male Guardian | 11.37% | 15.27% |
| Missing Has Female Guardian | 11.32% | 15.15% |
| Missing Ever Suspended | 4.75% | 5.99% |
| Missing Is Black or Hispanic | 0.00% | 0.00% |
These variables were chosen because they summarize the basic dimensions of socioeconomic status identified throughout various works of literature. They aim to measure a student’s family characteristics through income, parents, family structure, and more.
These categories were encoded as follows. Ever suspended is coded as 1 if the student was ever suspended at least once and 0 otherwise. Household Income is the natural logarithm of one plus total family income; Total income = Employment Income + Other Income. Mom College and Dad College are 1 if the mother and father completed at least one year of college, 0 otherwise. Mother Birth Age is the mother’s age when the student was born. Mother Job and Father Job are indexes of the occupation, coded 0 = no occupation, 1 = blue-collar occupation and 2 = white-collar occupation; in the original dataset, job codes 2, 3, 4, 5, 7, 8, 12, 15 and 16 fall in blue-collar employment, whereas 1, 6, 9, 10, 11, 13 and 14 fall in white-collar employment. Siblings is the number of siblings. Has Male Guardian is 1 if there is at least one male guardian present and 0 otherwise. Has Female Guardian is 1 if there is at least one female guardian present and 0 otherwise. The Oaxaca decomposition group variable is Black or Hispanic is 1 for Black and Hispanic students, and 0 for White students; the analysis excluded American Indians and mixed-race students. All Hispanic categories were collapsed prior to the construction of this group variable.
These variables are not just background traits. These variables can serve as proxies to understand the resources, knowledge, and background surrounding the student’s life19. Bourdieu explains that families with higher incomes and greater parental education possess more knowledge through various forms such as communication, self advocacy, and other skills. He names these advantages under the umbrella term cultural capital. Bourdieu explains three forms of cultural capital. Embodied cultural capital is the knowledge, skills, and way of speaking that are absorbed through various upbringings. Objectified cultural capital is physical goods such as instruments and books. Institutionalized cultural capital consists of formal credentials like degrees or diplomas. Students from lower socioeconomic statuses may have less cultural capital, thus not granting them the advantage that more well equipped students have. It is argued that schools actively reproduce social hierarchies20. Thus, in this context, by measuring the family characteristics, which serve as representations of one’s socioeconomic status, they also represent the social hierarchies that are developed in schools. Viewing family characteristics in this way changes them from neutral controls into markers that represent their position within society. The gaps between White students and Black and Hispanic students with regard to income, education, and occupation reflect historical structural inequalities instead of individual differences21. The endowments component should be interpreted as capturing most of the accumulated effects of social inheritance instead of an individual’s family traits.
After applying all data cleaning criteria, the final analytic sample consisted of 6,136 students, drawn from an initial sample of 16,197. Of the final sample, 4,733 students (77.0%) were White and 1,403 students (23.0%) were Black or Hispanic.
| Group | N | % of Final Sample |
| Initial sample | 16,197 | — |
| Final sample (after cleaning) | 6,136 | 100% |
| White | 4,733 | 77.0% |
| Black or Hispanic | 1,403 | 23.0% |
| Variable | Overall | White | Black/HS |
| Ever Suspended | 0.064 | 0.049 | 0.114 |
| Log Total Income | 9.498 | 9.604 | 9.140 |
| Mother College | 0.126 | 0.139 | 0.081 |
| Father College | 0.196 | 0.223 | 0.105 |
| Mother’s Age when Student was Born | 28.311 | 28.640 | 27.200 |
| Mother Job Index | 1.674 | 1.734 | 1.474 |
| Father Job Index | 1.532 | 1.587 | 1.348 |
| Siblings | 0.452 | 0.377 | 0.704 |
| Has Male Guardian | 0.310 | 0.297 | 0.353 |
| Has Female Guardian | 0.369 | 0.332 | 0.498 |
Notes: Table reports mean values. Black/HS includes Black and Hispanic students. Income is logged.
This binary variable contrasting Black and Hispanic students with White students is a constraint of the Oaxaca decomposition as it limits the discussion to two groups. This groups Black and Hispanic students together as one, with no distinction within the analysis. However, this grouping is defensible due to the fact that both Black and Hispanic students face increased suspension rates in comparison to White students. In addition, two papers indicate that both Black and Hispanic students tend to get punished more often than White students for subjective violations22,23. These include non-concrete actions such as disrespect or disruptions. Another justification for this choice is that splitting the sample size of 6136 students into separate categories for Black and Hispanic students would result in extremely small groups of Black students and small groups of Hispanic students when compared to the sample size of the White students in the study. This can threaten the reliability of the analysis as even together, Black and Hispanic students only make up 23% of the students in the analysis24.
It is important to state that race in this paper is not a fixed category. It is a socially constructed one. Sociologists have argued that racial categories are produced through history, politics, and institutional processes rather than natural divisions25. In reference to school discipline, this matters because the variable “Is Black or Hispanic” captures race as the social meaning that institutions and individuals attach to their racial identity. This shapes how students are treated. Race in this dataset is likely correlated with unmeasured structural inequality like residential inequality, under-resourced schools, and poverty in neighborhoods. These are not accounted for in the model or the data. In addition, students have different perspectives on authority, so students from different backgrounds may have been taught to respect or disrespect authority with greater frequency. This could disadvantage students from certain backgrounds26. These reasons explain that the binary race indicator used is actually a proxy for social processes that are too complicated to be included.
Methodology
Blinder-Oaxaca Decomposition
Now that the data is defined, this section introduces the Blinder-Oaxaca decomposition and explains why it is well suited to the task of decomposing the gap between the two groups.
The method of Blinder-Oaxaca decomposition is a well suited method for this research27 because it allows for explanatory variables to help split the perceived suspension gap into two different parts. The first part is the portion of the suspension gap that can be explained by the explanatory variables. The other part is the unexplained portion, which cannot be explained by the explanatory variables. This is especially useful for this research because it reinforces one of the theories of the two commonly seen in previous research. Those conflicting theories are that differences in socioeconomic status lead to the suspension gap and that institutional issues lead to the suspension gap. Alternative methods, like regression, would not be able to decompose the gap into these components in the same way.
Oaxaca decomposition, also known as the Blinder-Oaxaca decomposition, is a statistical method that is used to explain differences from statistical averages. It uses statistical methods to determine how much of the difference seen within a data set is explained by measurable characteristics. It does this through a step by step process.
We can denote the difference of the means between two groups,  and
and  as
as  where
where  is the mean of group and
  is the mean of group .
For this research paper, a 3-fold decomposition is performed. This means that the gap seen between the two groups can be split into 3 different groups: endowments, coefficients, and interactions
In a linear regression the outcome  where
where  represents the variables and
  represents the effect of each variable.
This means that we can express  as
as
By rearranging our equation algebraically, we are left with the following expression of
The endowments term is the contribution of differences in explanatory variables across the different groups and the coefficients term is the part that is due to group differences in the coefficients. Finally, the interaction group accounts for the differences in the two groups that occur in the explanatory variables and coefficients at the same time.
Multiple Regression Framework
The model for the probability of a child being ever suspended is represented by the following linear probability model:
where  is a binary indicator equal to 1 if student
  was ever suspended and 0 otherwise,
  is a vector of household characteristics including household income, parental education, parental occupation, number of siblings, and guardian presence,
  is the corresponding vector of coefficients,
  is the intercept, and
  is the error term.
Equation [eq2] is estimated separately for White students, Black/Hispanic students, and the pooled sample; the resulting group-specific coefficients form the basis of the threefold Blinder–Oaxaca decomposition described in Equation [eq1].
Results
This section shows the output of the decomposition starting with raw suspension rates and then splitting the gap into endowments, coefficients, and interactions.
After running the Oaxaca decomposition method, the following results were given:
| White students | Black or Hispanic students | Difference | |
| Students who have been suspended | 231 | 160 | 71 |
| Sample size | 4733 | 1403 | 3330 |
| Probability of suspension | 4.88% | 11.40% | -6.52% |
The raw suspension gap of 6.52% between White students (4.88%) and Black or Hispanic students (11.40%) is consistent with national patterns documented in prior research. Black or Hispanic students are suspended at roughly 2.3 times the rate of White students. This gap is then decomposed to find out how much of the difference is attributable to the differences in family characteristics captured in this analysis.
These results show that from the data set, 4.88% of White students were suspended while 11.40% of Black or Hispanic students were suspended. Finally, the difference between these two percentages is the probability of suspension gap of  6.52%. In the next step, this gap will be decomposed into the portion explained by the family characteristics measured in the model and the portion of the gap that is unexplained by these family characteristics.
In order to interpret the results of the Oaxaca decomposition, the results of the threefold Oaxaca decomposition must be examined.
| endowments | -0.0171** |
| (0.0067) | |
| coefficients | -0.0587*** |
| (0.0095) | |
| interaction | 0.0106 |
| (0.0073) |
The suspension gap is defined as the White suspension rate minus the Black/Hispanic suspension rate. This means that a negative component widens the observed gap. In other words, a negative component increases Black/Hispanic suspension probabilities higher relative to White. On the other hand, a positive component narrows the gap. Since the endowments and coefficients are negative, they widen the gap, while the interaction component is positive meaning that it partially offsets the gap.
These results connect to the theoretical debate between the two explanations for the suspension gap. The endowments component of -1.71% indicates that differences in family characteristics that are measured between the two groups contribute towards the gap rather than against it, but this accounts for only about 26.2% of the total gap. This provides very little evidence to support the theory that socioeconomic disparities account for suspension rate disparities. The coefficients component of -5.87% represents that the same family characteristics are associated with a 5.87% difference in suspension rate between the two groups, accounting for approximately 90.0% of the total suspension gap on its own. According to the results, income, parental education, family structure, and the rest of the measured characteristics are not able to explain the suspension gap. This pattern is similar to the institutional explanation; however, the lack of explanation could also be due to omitted variables not captured in the model.
These results suggest that of the percentage difference of -6.52%, -1.71% is due to the differences in the characteristics (income, siblings, etc.) of the students. Approximately -5.87% can be attributed to differences in the coefficients, and 1.06% can be accounted for by the interactions of the two.
The next step is to investigate the contributions of individual variables to both the endowments and coefficients components of the decomposition. The detailed coefficient plots are provided below.
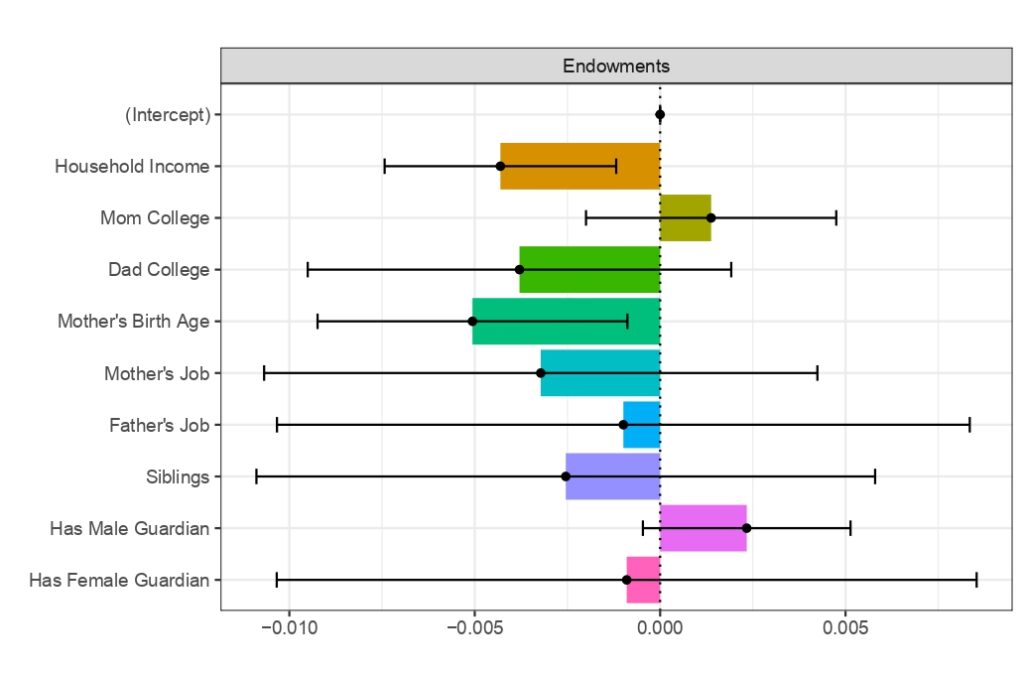
Variable-specific contributions to the endowments (explained) component of the threefold Blinder–Oaxaca decomposition of the White–Black/Hispanic suspension-rate gap. Each bar represents the contribution of a single explanatory variable to the portion of the gap attributable to differences in observed family characteristics between groups. Horizontal error bars represent 95% confidence intervals. Estimates whose confidence intervals include zero are not statistically significant.
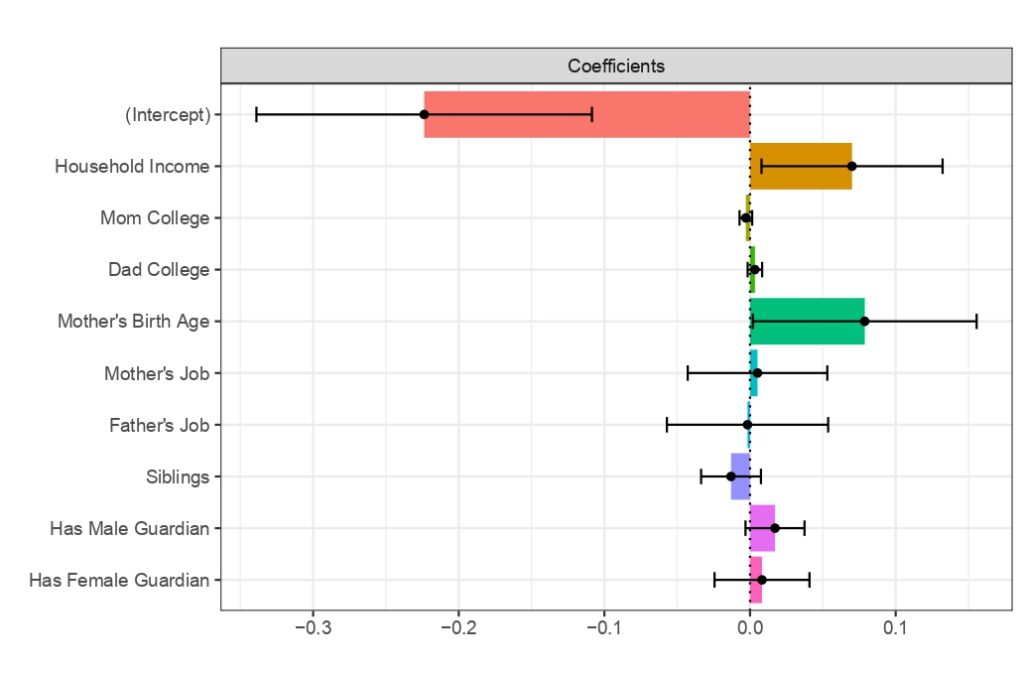
Variable-specific contributions to the coefficients (unexplained) component of the threefold Blinder–Oaxaca decomposition of the White–Black/Hispanic suspension-rate gap. The coefficients component measures differences in how the same observed characteristics are associated with suspension across groups. Horizontal error bars represent 95% confidence intervals.
The endowments decomposition indicates that household income is the only statistically significant contributor to the explained portion of the suspension gap, while all other variables have confidence intervals that include zero (see Figure 1). This is shown due to the fact that the error bars representing 95% confidence intervals overlap with 0, meaning that their values are not statistically significant.
The results indicate that the differences seen in the suspension rates between the two groups: White vs. Black and Hispanic students are not fully explained by the family characteristics used in this model. Because of this, the source of the remaining gap cannot be determined by this analysis.
The twofold decomposition further separates the unexplained portion into contributions from each explanatory variable. The complete decomposition is reported below. The decomposition separates the total difference into explained and unexplained components. The explained component represents the portion of the gap attributable to differences in observable characteristics. Some of these characteristics include parental education, household income, and family structure. The unexplained component captures the gap that is not accounted for by these characteristics. Although the unexplained component cannot identify the cause of the suspension gap, it could reflect differences in school characteristics that were not accounted for in the model.
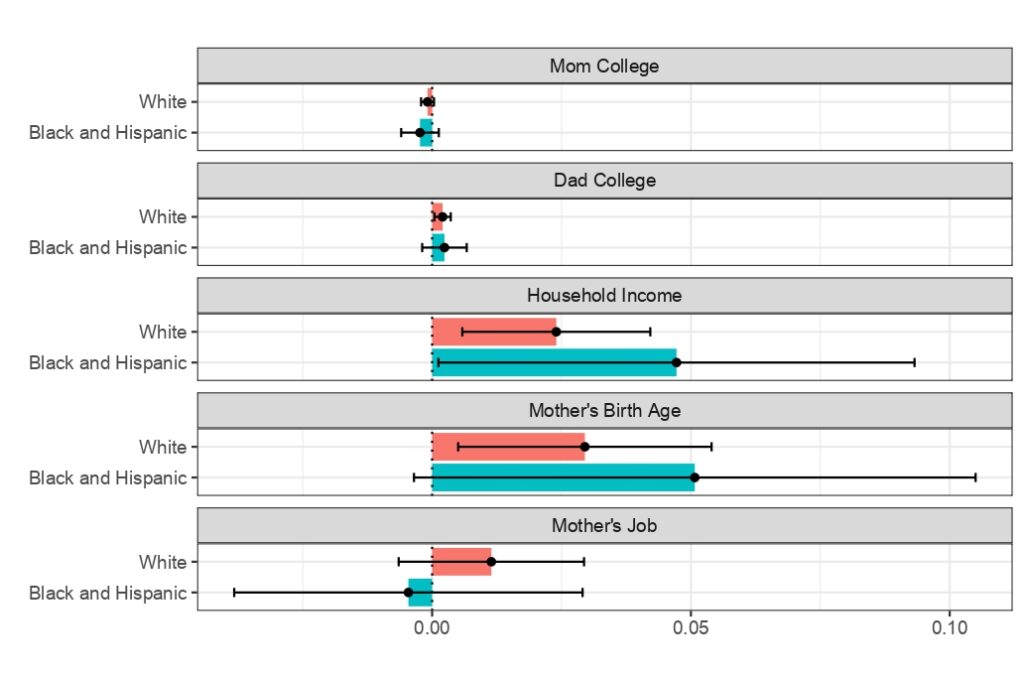
Variable-level decomposition of the unexplained component from the twofold Blinder–Oaxaca decomposition (Part I). Bars show the estimated contributions of each explanatory variable for White students and Black/Hispanic students to the unexplained portion of the suspension-rate gap. Horizontal error bars represent 95% confidence intervals. Confidence intervals overlapping zero indicate that the estimated contribution is not statistically significant.
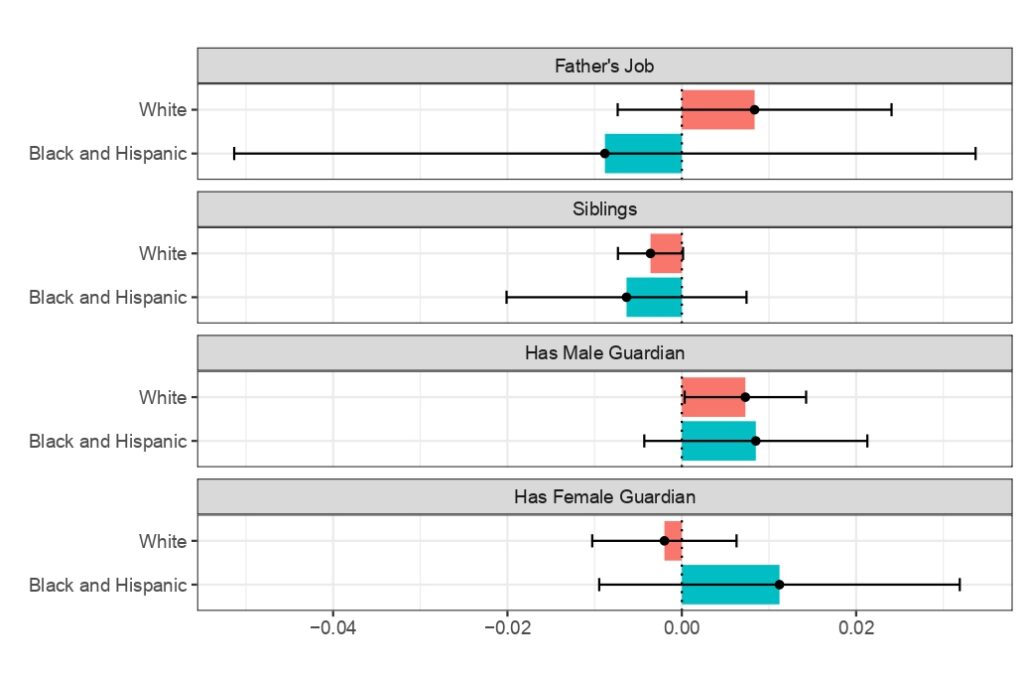
Continuation of the variable-level decomposition of the unexplained component from the twofold Blinder–Oaxaca decomposition. Horizontal error bars represent 95% confidence intervals. The unexplained component represents the portion of the suspension-rate gap that remains after accounting for the observed family characteristics included in the model; it should not be interpreted as identifying a specific causal mechanism.
Together, the endowments and coefficients results show a consistent picture. Differences in family characteristics between the two groups can only explain a very small portion of the suspension gap. In addition, the coefficients results show that the same family characteristics are associated with different suspension probabilities across groups. This is central to the paper as it suggests that closing the suspension gap through the family socioeconomic characteristics measured in this paper would not be enough. It also suggests that the factors driving the majority of the gap are not accounted for in this paper. It is uncertain whether those factors represent institutional discrimination, behavioral differences, school level differences, or other factors.
Discussion
Building on the decomposition results, this section frames the findings within the two competing explanations for the suspension gap.
The study illustrates a major disparity in suspension rates between Black or Hispanic students and White students. The study indicates that 11.40% of Black/Hispanic students have been suspended while only 4.88% of White students have been suspended. This makes the percent difference -6.52%. The Oaxaca decomposition then revealed that -1.71 percentage points of this gap were due to differences in observable characteristics, +1.06 percentage points reflect the interaction component, and -5.87 percentage points of the gap are attributable to the coefficients component, meaning that the same observable student characteristics are associated with substantially higher suspension probabilities for Black and Hispanic students than for White students in the model. Overall, these findings indicate that the family characteristics metric only accounts for a small portion of the measured suspension gap. The -5.87% unexplained portion may reflect variables that were left out of the model and not captured in this analysis.
These results can be taken into the context of other papers; many of which indicate that suspensions, or other disciplinary actions can result in a significantly increased chance of similar future punishments. This means that if individuals who are Black or Hispanic are suspended due to factors not captured by the set of family characteristics that were included in this model, this could have implications for students’ outcomes later in life13. This paper cannot confirm that link directly. While the unidentified factors that cause the unexplained portion of the suspension gap could result in a change of the trajectory of a teenager’s life, the paper cannot show this link either.
Limitations
One important limitation of this method of analysis is the possibility of omitted variables and the bias that they could cause. This model contains a good set of family characteristics; however, there likely exist other unobserved determinants of suspension that were not captured in the decomposition. Some examples of this could include prior academic performance or school disciplinary policies. These, along with many more could be associated with suspension and are also related to race and socioeconomic status. The exclusion of these variables from the analysis means that if they were included, it is possible that they could explain the suspension gap between the White and minority children. This in turn means that by omitting these variables, caution must be exerted when interpreting the results. Although the factors chosen could not explain the suspension gap, it is possible that other factors exist that do explain the White-minority suspension gap.
A related limitation relates to endogeneity. Some of the variables included in the model such as household income and parental occupation, could be correlated with unobserved determinants of the suspension gap. For example, racism or discrimination – unobserved in the data – can limit income for Black and Hispanic families and also play a role in explaining the White-minority children suspension gap. In this situation, using household income as an explanatory variable for the suspension gap may absorb some of the discrimination. This would mean that the endowments component, or the explained portion of the White-minority suspension gap, may actually underestimate the true disadvantages faced.
The results of Blinder-Oaxaca decomposition are to be interpreted descriptively, as it is not a causal strategy. It cannot determine whether family characteristics cause suspension outcomes. It also cannot establish whether the unexplained gap represents differential treatment as it is difficult to account for every variable that could cause a suspension rate difference. This means that the coefficients component should be simply thought of as a residual rather than evidence of anything else such as bias.
Additionally, ELS:2002 uses a stratified, two-stage cluster sample with schools as the sampling unit. This means that the data over samples certain minorities in order to have enough data points in the survey. For example, more private school students were sampled in proportion to other students in the sample as opposed to the actual proportions in real life. In an ideal situation, analysis would include sampling weights and account for within-school clustering to produce design-consistent standard errors. The Oaxaca decomposition framework used here does not weight these values, creating a constraint. As a result, standard errors reported in this paper should be interpreted with caution. However, since there is a large sample size and the magnitude of the unexplained coefficient gap (5.87%), the core findings are not likely to be caused completely based on this limitation.
Although studies indicate that the first suspension is the most pivotal in affecting the trajectory of a teenager, the fact remains that a 1 day suspension is different from a 10 day one and a suspension for fighting is different from a suspension for tardiness13. This analysis does not distinguish between types of suspension, severity, or school context. The dependent variable is simply whether a student has ever been suspended. Future research with access to infraction-level data could allow for a more accurate characterization of where in the disciplinary process most of the unexplained gap appears.
A further limitation is that the analysis does not include institutional level variables. Some of these variables could include teacher demographics, urban schools vs rural schools, discipline policies, etc. Although prior research identifies these variables as important to suspension disparities, they were left out as this paper serves to split the factors that affect the suspension gap into family characteristics and school-level characteristics5. This paper tests if family characteristics alone account for the suspension gap between Black/Hispanic students and White students. This means that the unexplained portion could reflect differences in school-level variables. However, since the unexplained portion is unexplained, it should be strictly interpreted as the portion of the gap that is unexplained. It does not indicate what the cause of the remaining difference is. While it is important to note that there is still an unexplained portion of the suspension gap, a limitation of this paper is that this unexplained portion cannot be identified further. Future research should expand this analysis to incorporate school-level variables.
Since the outcome variable is binary, the linear probability model can generate probabilities that are not in the 0 – 1 range. This produces errors. While this does not bias the decomposition, it means the coefficient estimates should not be interpreted as marginal effects in the same way they would be in a properly non-linear model.
Policy Implications
This section considers what the findings suggest for future research and policy. This study’s findings provide several implications for future research and eventual policy changes. The results from the analysis performed using Oaxaca decompositions explain that a significant portion of the suspension gap between Black and Hispanic students vs White students cannot be explained by family characteristics. This means that policies that are aimed towards reducing disparities in family characteristics such as socioeconomic status, may not be sufficient to close the observed suspension gap.
Prior research finds that factors that are on the school level, rather than the family level, also contribute to suspension disparities. For example, factors such as policy design, teacher-student ratios, and zero-tolerance policies have been identified as contributors to suspension disparities5,23. For this reason, it would be helpful for policymakers to investigate whether school and district level factors are able to explain the suspension gap between these two groups of students. This research can also be combined with family level characteristics in order to explain more of the gap.
This paper is unable to identify the source of the suspension gap between these two groups which means that it cannot suggest policy solutions. However, this paper serves as evidence that creating policies to fight family level disparities such as socioeconomic status will not necessarily eliminate the suspension gap between these two groups. Further research into the suspension gap is needed in order to create specific policy recommendations to fix disparities.
Conclusion
Overall, the result of the Oaxaca decompositions shows that the suspension rate gap between White and Black/Hispanic students cannot fully be explained by family characteristics. Some future studies could be done to explore other variables surrounding student’s lives. For example, another study could be done using variables like grade point averages and other measures of academic performance. There are many possible variables that could contribute to a suspension gap between White and Black/Hispanic students. It is almost impossible to cover all of them, so there are many other studies that could be done using the same data with different subsets of variables. These findings may have implications for future policies regarding education and research. The unexplained portion of the suspension rate gap is a significant finding. The unexplained portion of the suspension rate gap is an area for future research. The sources of this gap remain unidentified. When teenagers get into trouble, it often sets them on a path for future trouble, highlighting the importance of further research into the sources of these disparities13.
References
- M. C. Fadus, E. A. Valadez, B. E. Bryant, A. M. Garcia, B. Neelon, R. L. Tomko, L. M. Squeglia. Racial disparities in elementary school disciplinary actions: findings from the ABCD study. Journal of the American Academy of Child & Adolescent Psychiatry. Vol. 60, pg. 998-1009, 2021. [↩] [↩]
- L. Liu. The unintended consequence of school suspension: how school suspension impacted future grades and misconduct. Children and Youth Services Review. Vol. 164, pg. 107871, 2024. [↩]
- M. Zhan. Assets and liabilities, race/ethnicity, and children’s college education. Children and Youth Services Review. Vol. 33, pg. 2168-2175, 2011, https://doi.org/10.1016/j.childyouth.2011.06.024. [↩]
- R. Oaxaca. Male-female wage differentials in urban labor markets. International Economic Review. pg. 693-709, 1973. [↩]
- J. Owens, S. S. McLanahan. Unpacking the drivers of racial disparities in school suspension and expulsion. Social Forces. Vol. 98, pg. 1548-1577, 2020. [↩] [↩] [↩] [↩] [↩]
- M. Gopalan, S. Asson, M. Cattell Jr., E. Frankenberg. Historical patterns and trends in racial/ethnic disproportionality in school discipline in the United States. Socius: Sociological Research for a Dynamic World. Vol. 10, 2024, https://doi.org/10.1177/23780231241285105. [↩]
- C. B. Yaluma, A. P. Little, M. B. Leonard. Estimating the impact of expulsions, suspensions, and arrests on average school proficiency rates in Ohio using fixed effects. Educational Policy. Vol. 36, pg. 1731-1758, 2022. [↩] [↩]
- J. E. Ford, N. Triplett. E(race)ing inequities: the state of racial equity in North Carolina public schools. https://www.ednc.org/eraceing-inequities-the-state-of-racial-equity-in-north-carolina-public-schools/, 2019. [↩] [↩]
- M. L. Mizel, J. N. V. Miles, E. R. Pedersen, J. S. Tucker, B. A. Ewing, E. J. D’Amico. To educate or to incarcerate: factors in disproportionality in school discipline. Children and Youth Services Review. Vol. 70, pg. 102-111, 2016, https://doi.org/10.1016/j.childyouth.2016.09.009. [↩]
- D. Bryant, A. Wilson. Factors potentially influencing discipline referral and suspensions at an affiliated charter high school. Journal of Educational Research and Practice. Vol. 10, pg. 119-128, 2020, https://doi.org/10.5590/JERAP.2020.10.1.08. [↩]
- J. C. Taylor, M. J. Zuber, D. S. Shoup. Assessing the odds of exclusionary discipline: an exploration of the racial, socioeconomic, and spatial disparities in high school discipline. Journal of Education. 2026, https://doi.org/10.1177/00220574251343913. [↩] [↩]
- R. Rekker, D. Pardini, L. Keijsers, S. Branje, R. Loeber, W. Meeus. Moving in and out of poverty: the within-individual association between socioeconomic status and juvenile delinquency. PLOS ONE. Vol. 10, pg. e0136461, 2015, https://doi.org/10.1371/journal.pone.0136461. [↩]
- P. Hemez, J. J. Brent, T. J. Mowen. Exploring the school-to-prison pipeline: how school suspensions influence incarceration during young adulthood. Youth Violence and Juvenile Justice. Vol. 18, pg. 235-255, 2020. [↩] [↩] [↩] [↩]
- J. A. Okonofua, J. L. Eberhardt. Two strikes: race and the disciplining of young students. Psychological Science. Vol. 26, pg. 617-624, 2015, https://doi.org/10.1177/0956797615570365. [↩]
- R. J. Skiba, R. S. Michael, A. C. Nardo, R. L. Peterson. The color of discipline: sources of racial and gender disproportionality in school punishment. The Urban Review. Vol. 34, pg. 317-342, 2002, https://doi.org/10.1023/A:1021320817372. [↩]
- C. A. Lindsay, C. M. D. Hart. Exposure to same-race teachers and student disciplinary outcomes for Black students in North Carolina. Educational Evaluation and Policy Analysis. Vol. 39, pg. 485-510, 2017, https://doi.org/10.3102/0162373717693109. [↩]
- M. Davison, A. M. Penner, E. K. Penner. Restorative for all? Racial disproportionality and school discipline under restorative justice. American Educational Research Journal. Vol. 59, pg. 687-718, 2022, https://doi.org/10.3102/00028312211062613. [↩]
- M. Hlavac. oaxaca: Blinder-Oaxaca decomposition in R. Available at SSRN 2528391, 2014. [↩]
- P. Bourdieu. The forms of capital. In: J. G. Richardson, editor. Handbook of theory and research for the sociology of education, pg. 241-258. Greenwood Press, New York, 1986. [↩]
- P. Bourdieu, J.-C. Passeron. Reproduction in education, society and culture. Sage Publications, London, 1977. [↩]
- D. S. Massey, N. A. Denton. American apartheid: segregation and the making of the underclass. Harvard University Press, 1993. [↩]
- M. Gopalan, A. A. Nelson. Understanding the racial discipline gap in schools. AERA Open. Vol. 5, pg. 1-26, 2019, https://doi.org/10.1177/2332858419844613. [↩]
- R. O. Welsh, S. Little. The school discipline dilemma: a comprehensive review of disparities and alternative approaches. Review of Educational Research. Vol. 88, pg. 752-794, 2018, https://doi.org/10.3102/0034654318791582. [↩] [↩]
- I. A. Lubin, C. Singh. Impact of broad categorization on statistical results: how underrepresented minority designation can mask the struggles of both Asian American and African American students. Physical Review Physics Education Research. Vol. 17, pg. 010113, 2021, https://doi.org/10.1103/PhysRevPhysEducRes.17.010113. [↩]
- M. Omi, H. Winant. Racial formation in the United States: from the 1960s to the 1990s. Routledge, 2nd edition, 1994. [↩]
- G. Ladson-Billings. Toward a theory of culturally relevant pedagogy. American Educational Research Journal. Vol. 32, pg. 465-491, 1995, https://doi.org/10.3102/00028312032003465. [↩]
- B. Jann. The Blinder-Oaxaca decomposition for linear regression models. The Stata Journal. Vol. 8, pg. 453-479, 2008. [↩]