

Abstract
Background/Objective: Anime streaming sites collect user data to enhance advertisements and recommendations. While digital platforms can easily collect large amounts of passive interaction data, other explicit user data – such as voluntary ratings or sensitive demographic profiles – are scarcer and harder to collect. In this study, we hypothesized that collecting age and gender was unnecessary because distinct user archetypes derived from scarce ratings could be identified just as well through passive engagement behaviors.
Methods: To test this, we developed a feature engineering pipeline utilizing individual user rating variance and relative average difference between a user’s ratings and the average rating for each show to discover distinct personality archetypes. Using the MyAnimeList dataset, we utilized k-means clustering to identify three user archetypes based on ratings: “Low score/high variance,” “Average score/variance,” and “High score/low variance.” Then, we evaluated the accuracy of the decision tree, random forest, XGBoost and LightGBM classifiers using 10-fold cross-validation to predict archetypes based on age, gender, and user behavioral features.
Results: Experimental results showed that random forest and LightGBM achieved the highest predictive accuracy. Feature ablation analysis showed that the classifiers after removing age and gender features were statistically equivalent to the models with all features.
Conclusions: These results supported our hypothesis that for MyAnimeList, viewer identities could be identified just as well exclusively through passive behavior, and that age and gender are not necessary for categorizing a user’s personality archetypes.
Keywords: User privacy, Behavioral analytics, Anime viewer analysis, Machine learning, Feature engineering, K-means clustering.
Introduction
Background and Problem Statement
The anime industry is experiencing a surge in popularity internationally. In the US, nearly 54% of Gen Z identifies themselves as anime fans1. Anime platforms employ recommendation algorithms to promote content based on large volumes of user data they collect – much of it to predict user archetypes, the accuracy of which is vital to their business model2. However, modern recommenders increasingly face a tension between accuracy and user privacy3.
Three types of features can be collected from user data:
- Passive engagement features can be systematically collected at low costs4,5;
- Explicit ratings are scarce because they involve costly surveys that many users ignore;
- Demographic features such as gender or age were heavily used in early recommenders6,7, but are raising major bias and privacy concerns8,9,10.
In this study, we hypothesized that a user’s critical archetype discovered from explicit user ratings is defined almost entirely through their passive behavior rather than age and gender. To test the hypothesis, we employed a two-stage clustering-classification machine learning pipeline, to first discover and label user archetypes from ratings through clustering, then build classification models to test if removing age and gender significantly harms the predictive accuracy of the models from both passive behavior and demographics.
Approach and Findings
We used Kaggle’s public MyAnimeList dataset as our data source11. After filtering the data to ensure consistency and proper focus on the users of interest, we engineered two features – user rating variance and average relative difference to anime averages – to establish user critical archetypes. The clustering analysis with k-means discovered three user archetypes – “Low score/high variance,” “Average score/variance,” and “High score/low variance.”12. We also performed Gaussian Mixture Models (GMM) with k=4 to confirm the robustness of our conclusion13.
With these clusters, we employed classification models – decision tree, random forest, XGBoost and LightGBM – to establish the accuracy baseline with both demographic (age and gender) and passive behavioral user features14,15,16,17. Of the models, random forest and LightGBM performed the best, for both using the three classes with k-means and the four classes with GMM. Statistical tests showed that the random forest is statistically significantly better than XGBoost, decision tree, and the two baseline classifiers Majority (always predicts the majority class) and Stratified (randomly predicts one of the classes in proportion to their actual distribution). An ablation study showed that the random forest and LightGBM classifiers are statistically equivalent (margin=0.02) after removing age and gender for all cases tested. These results supported our hypothesis that for the MyAnimeList data set, passive behavioral features shape anime viewer archetypes from ratings, rather than age and gender.
| Study | Dataset size | Platform / data source | Clustering method(s) | Features included | Classification / recommendation method(s) | Evaluation metrics | Reported results |
| Tarigan and Wijaya, 2025 | Not specified | MyAnimeList anime-level data | k-means clustering | User ratings, popularity, genres, and themes | Content segmentation for personalized recommendations; no user-archetype classifier | WCSS, Silhouette Score | Identified anime groups: 1) popular but lower-rated; 2) moderately popular well-rated; and 3) niche critically acclaimed. |
| Bhattacharya and Florez-Arango, 2025 | 155 physical activity apps | Mobile health app ratings with MARS dimensions | k-means clustering | Engagement, functionality, aesthetics, information, and user ratings | GAM, k-nearest neighbors, random forest, XGBoost, and support vector regression | Predictive accuracy, MAE, and R-squared | Improved accuracy to 88.64% with MAE=0.27. |
| This study | 101,579 users after cleaning | MyAnimeList cleaned user and anime data | k-means with k=3; GMM with k=4 | Rating variance and average relative difference for clustering; passive engagement features plus age and gender for classification. | Decision tree, random forest, XGBoost, and LightGBM | For clustering – WCSS, Silhouette Score and ARI; for classification – balanced accuracy, macro F1 | Removing age and gender produced statistically equivalent classifiers across the tested clustering settings. |
Related Work and Recent Literature
Similar work exists in literature. A prior study also applied k-means to the MyAnimeList dataset18. But their focus was to segment anime with similar genres, themes, and popularity, rather than focusing on anime viewer archetypes as our case. Another study identified user segments based on their ratings19. Their work similarly found three user groups: critical, lenient, and engagement. But our research has two key differences: 1) our focus was on anime viewers ratings, while their application was physical activity apps using mobile app rating scale (MARS); and 2) our main focus was to test whether user demographic features is informative, while their focus was to use clustering to improve predictive models (Table 1).
Recommender relies on data sources that capture user behaviors and preferences20. Recent literature emphasizes the growing importance of explainable machine learning and transparency in recommender systems21,22,23. In parallel, the increasing focus on user privacy has driven a surge in privacy-preserving frameworks24,25,26,27. Beyond recommendation systems, related efforts in user behavioral modeling demonstrate that user archetypes can be uncovered directly from passive interaction data without collecting user privacy information28. Modern recommenders also use advanced architectures to learn transparent, interpretable user segments29,30,31,32.
Contributions
Our work provides technical and practical contributions. The clustering-classification pipeline provides a useful framework to derive user archetypes and then classify them based on user features. Our ablation study empirically proved that for MyAnimelist, age and gender are not important for building user archetype classifiers. The practical implications of our results are that sensitive demographic features might not be necessary, which reduces privacy overhead and concerns.
| Abbreviation / Term | Definition | Context in Study |
| MAL | MyAnimeList | The public anime tracking dataset from Kaggle used for all experiments. |
| Vu | User Rating Variance | Engineered metric measuring the spread of scores given by user u. |
| Du | Average Relative Difference | Engineered metric measuring user u’s average deviation from global anime mean ratings. |
| k-means | k-means Clustering | Clustering algorithm used as the primary method to discover 3 user archetypes. |
| GMM | Gaussian Mixture Model | Probabilistic clustering method applied with k=4 as a robustness check. |
| WCSS | Within-Cluster Sum of Squares | Metric used to assess cluster compactness in elbow analysis. |
| BIC | Bayesian Information Criterion | Model selection criteria used to evaluate the fit for GMM. |
| ARI | Adjusted Rand Index | Metric used to evaluate clustering stability across perturbations. |
| DT | Decision Tree | Supervised tree classifier. |
| RF | Random Forest | Ensemble tree classifier. |
| XGBoost | Extreme Gradient Boosting | Gradient-boosted decision tree algorithm. |
| LightGBM | Light Gradient Boosting Machine | Fast, distributed gradient boosting framework. |
| BA | Balanced Accuracy | Average of recall across all classes that accounts for class imbalance. |
| Macro F1 | Macro F1-Score | Mean of F1-scores from each class. |
| TOST | Two One-Sided Tests | Statistical equivalence testing framework (margin = 0.02, alpha = 0.05). |
| 10-Fold CV | 10-Fold Cross-Validation | Cross-validation procedure preventing data leakage across cluster assignment and training. |
Methods
A summary of notations, algorithms, and abbreviations used throughout this study is provided in Table 2. The pipeline of the entire process-data preparation, feature engineering and clustering analysis, classification, ablation study, statistical verification-is illustrated in Figure 1.
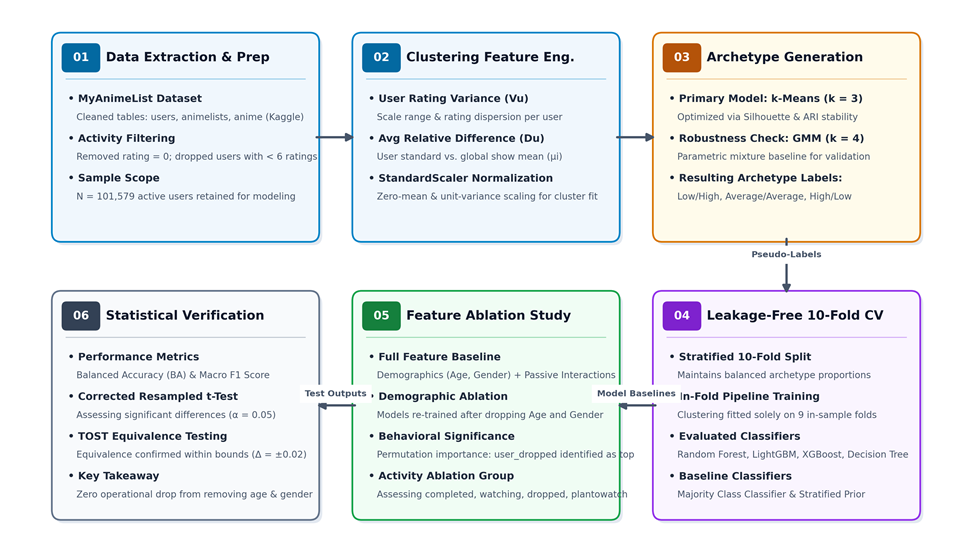
Data source
Our data source was the MyAnimeList (MAL) data set from Kaggle. There are three versions: 1) the original version contains all raw data; 2) the filtered version contains users who have birth date, location and gender filled; and 3) the cleaned version filtered out invalid values, such as users with impossibly large numbers of episodes. For our purposes, the cleaned version was chosen, specifically the animelists_cleaned.csv, anime_cleaned.csv, and users_cleaned.csv files. We additionally filtered the data to include only users with six or more ratings and excluded ‘0’ ratings, which represents unknown ratings.
Clustering analysis
Two features were engineered from the user ratings for the clustering analysis. The user rating variance (Vu) was defined as:
(1) 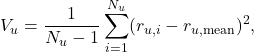
where
 represents the rating variance of user
 ,
 is the total number of ratings of user ,
 is the specific rating given by user to anime
 , and
 is the mean of all ratings by that user. The average relative difference (
 ) was defined as:
(2) 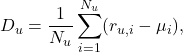
where
 represents the global mean rating for anime .
Both features were normalized using the StandardScaler from the Scikit-Learn library (v1.6.1)33. The KMeans class from the Scikit-Learn library (v1.6.1) was employed for the clustering analysis12,33. The default k-means++ initialization method was employed with a fixed random_state=42 to ensure reproducibility34. A value of k=3 was selected as a trade-off between granularity, interpretability and stability. The rest of the parameters were kept as default.
To test the robustness of our pipeline, we also applied the GaussianMixture method from the Scikit-Learn library (v1.6.1) with k=4, and the resulting labels were employed in the classification ablation analysisto validate our main conclusion.
Classification
The classifiers were built using the DecisionTreeClassifier and RandomForestClassifier from the Scikit-Learn library (v1.6.1), the XGBClassifier from the xgboost python package, and the LGBMClassifier from the LightGBM python package14,15,16,17,33. The discovered labels from the clustering analysis were merged into the users_cleaned.csv file, which contains user features. We kept only the passive engagement features and demographic features for classification. The data set for classification contained 101,579 unique users after further data cleaning. Since our classifiers take numerical values as inputs, gender was transformed using the LabelEncoder class from the SciKit-Learn library (v1.6.1)33.
All four classification models were evaluated using 10-fold cross-validation via the StratifiedKFold class from the Scikit-Learn library (v1.6.1)33,35. To avoid data leakage, the clustering analysis was incorporated into the cross-validation process. To be specific, in each fold, the out-of-sample fold was first labeled using the clustering method trained from the in-sample 9 folds, then evaluated using the classifiers trained from the training set. To ensure a fair comparison, the shared parameters of the classifiers were kept the same – max_depth=12 and random_state=42 for all four, and n_estimators=200 for random forest, XGBoost and LightGBM. In addition, because the class labels were imbalanced, the weights for each class label were enforced to be the same for all classifiers to encourage more balanced models.
Computational Environment and Reproducibility Specifications
Our implementation was executed in Python 3.13.15 within a Google Colab Linux x86_64 environment (Kernel 6.6.122+ with Glibc 2.35; 2 CPU hardware runtime with Intel Xeon CPU 2.20GHz; 12.67 GB of RAM). The software stacks are scikit-learn (v1.6.1), xgboost (v3.4.1), lightgbm (v4.6.0), pandas (v2.2.3), and numpy (v2.1.3).
To ensure reproducibility, a constant seed of random_state=42 was enforced across 10-fold cross-validation (StratifiedKFold), cluster initializations, and decision tree splitting algorithms. To prevent data leakage, features were normalized with StandardScaler and fitted strictly on the 9 in-sample folds in each split and used out-of-sample to transform and label the validation fold.
For clustering, k-means was initialized with init=k-means++, n_init=10, max_iter=300, and tol=1e-4, and Gaussian Mixture Models were executed with covariance_type=full, n_init=1, max_iter=100, and tol=1e-3. For classification, maximum tree depth was max_depth=12 for all four classifiers (DecisionTreeClassifier, RandomForestClassifier, XGBClassifier, and LGBMClassifier), and ensemble models incorporated n_estimators=200. We enforced balanced class weighting across all classifiers.
Results
Clustering analysis
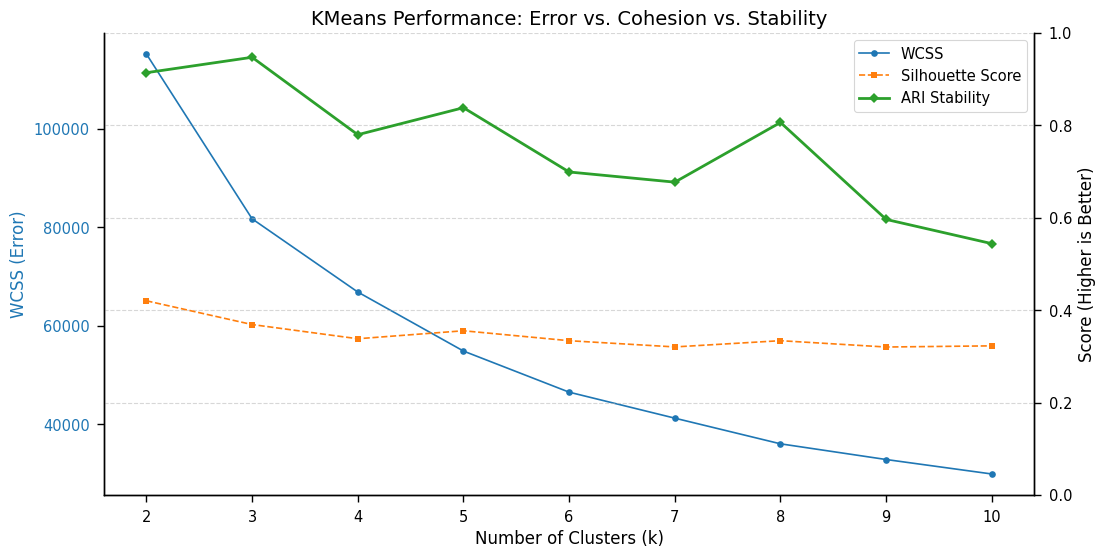
We applied k-means clustering to discover natural user archetypes. We engineered two features for the clustering analysis: 1) user rating variance (Vu) measures how much of the rating scale 1-10 the user utilizes – higher variances are expected for more critical users; and 2) average relative difference (Du) compares the user’s scores to each show’s average ratings to determine how high their standards are – a lower average difference is expected for a more critical user. This step establishes the labels for classification in the next step. The clustering analysis allowed us to discover user archetypes that go beyond simple heuristics, such as using the median of the engineered features to separate users into archetypes. We utilized the Elbow, Silhouette and ARI methods to decide the number of clusters, which suggested that the number of clusters k = 3 provided the highest stability with a reasonable balance between granularity and interpretability (Figure 2)36,37,38.
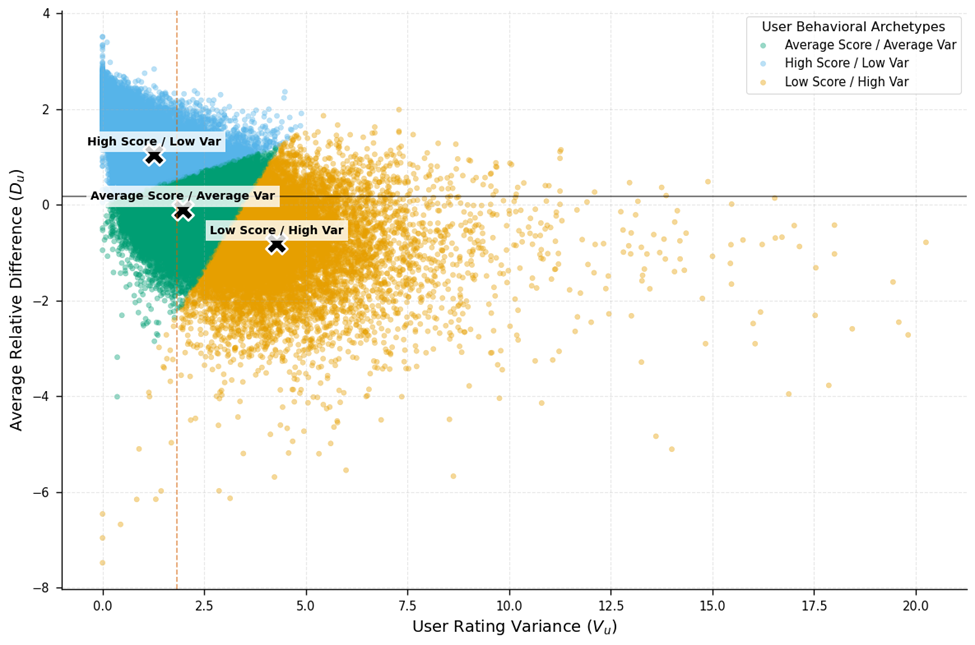
We named the three clusters based on their centroids:
- “Low score/high variance” represented users that used a wide rating range with high quality bars, meaning a high user rating variance (Vu = 4.29) and low average relative difference (Du = -0.81);
- “Average score/variance” represents common users who typically align with the crowd, with moderate user rating variance (Vu = 1.98) and near-zero average relative difference (Du = -0.1);
- “High score/low variance” represents anime enthusiasts who tend to give high ratings regardless of the quality, with the lowest user rating variance (Vu = 1.26) and the highest average relative difference (Du = 1.04) (Figure 3).
| clustering | classifier | BA | Macro F1 | t-test p (BA) | Tost p (BA) | t-test p (F1) | Tost p (F1) |
| k-means | Majority | 33.33%±0.00% | 0.2258±0.0020 | <0.0001 | 1 | <0.0001 | 1 |
| k-means | Stratified | 33.07%±0.32% | 0.3307±0.0032 | <0.0001 | 1 | <0.0001 | 1 |
| k-means | DT | 48.14%±0.29% | 0.4426±0.0061 | <0.0001 | 0.998 | <0.0001 | 0.9981 |
| k-means | XGBoost | 43.98%±0.48% | 0.4369±0.0064 | <0.0001 | 1 | <0.0001 | 1 |
| k-means | LightGBM | 51.58%±0.4% | 0.4667±0.0032 | 0.009 | <0.0001 | <0.0001 | <0.0001 |
| k-means | RF | 51.11%±0.49% | 0.4767±0.0032 | NA | NA | NA | NA |
| GMM | Majority | 25%±0.00% | 0.1726±0.0026 | <0.0001 | 1 | <0.0001 | 1 |
| GMM | Stratified | 25.08%±0.24% | 0.2508±0.0023 | <0.0001 | 1 | <0.0001 | 1 |
| GMM | DT | 38.66%±0.82% | 0.3138±0.0053 | <0.0001 | 0.9421 | <0.0001 | 1 |
| GMM | XGBoost | 31.05%±0.44% | 0.3061±0.0053 | <0.0001 | 1 | <0.0001 | 1 |
| GMM | LightGBM | 42.73%±0.63% | 0.3399±0.0048 | 0.0003 | 0.1222 | <0.0001 | 0.6288 |
| GMM | RF | 41.09%±0.77% | 0.3608±0.0060 | NA | NA | NA | NA |
Since the clustering results feed the labels to the following classification step, we chose k = 3 with the highest stability for k-means. To further confirm that our conclusion works consistently with different clustering methods, we also applied the Gaussian Mixture Model to our data, with k = 4. The choice is a tradeoff among BIC, Silhouette and ARI, which is the optimal choice by BIC from objective knee detection, with reasonable Silhouette and ARI. For this method, we did not choose k = 2 with the highest ARI, because it shows the worst BIC (Table 3).
Classification established accuracy baseline
We trained four classifiers to establish the accuracy baseline – decision tree, random forest, XGBoost and LightGBM using both demographic (age and gender) and engagement features. In addition, we established two baseline classifiers: Majority always predicts the majority class, and Stratified predicts each class with an equal probability. We removed irrelevant features such as username and access rank (the “scrape order” of a user’s data). We also removed the mean score to ensure model integrity, because it is an input to our engineered features Du and Vu for clustering. We also dropped the location feature because it is very noisy, due to the lack of regulation or uniformity for the format. For example, users could type in meaningless strings as locations with no restriction. Additionally, the original birthdays were dates separated by dashes (e.g. 1996-02-04) which could not be used to directly train models that required numeric values. We subtracted 2026-01-01 by their birthdates, then saving results in terms of the total number of months each user has lived.
We evaluated the classifiers with two metrics: balanced accuracy (BA) and macro F139. We employed two statistical tests to compare the classifiers: the corrected resampled t-test and two one-sided tests (TOST) with margin=0.02, both with a significance level of 0.0540,41,42. With no-leakage 10-fold cross-validation, we observed that the random forest (RF) model significantly outperformed Majority, Stratified, decision tree (DT) and XGBoost by both metrics and statistical tests (t-test p<0.05; TOST p>0.05), with labels discovered by both k-means and GMM. However, the results are inconclusive that random forest is significantly different from LightGBM: with labels from k-means, the two classifiers are statistically significantly different but equivalent; with labels from GMM, LightGBM achieved significantly better BA, but significantly worse macro F1. From the observed results, we chose both random forest and LightGBM as the classifiers for the ablation study (Table 4).
| clustering | classifier | BA | Macro F1 | t-test p (BA) | TOST p (BA) | t-test p (F1) | Tost p (F1) |
| k-means | Majority | 33.33%±0.00% | 0.2258±0.0020 | <0.0001 | 1 | <0.0001 | 1 |
| k-means | Stratified | 33.07%±0.32% | 0.3307±0.0032 | <0.0001 | 1 | <0.0001 | 1 |
| k-means | DT | 48.14%±0.29% | 0.4426±0.0061 | <0.0001 | 0.998 | <0.0001 | 0.9981 |
| k-means | XGBoost | 43.98%±0.48% | 0.4369±0.0064 | <0.0001 | 1 | <0.0001 | 1 |
| k-means | LightGBM | 51.58%±0.4% | 0.4667±0.0032 | 0.009 | <0.0001 | <0.0001 | <0.0001 |
| k-means | RF | 51.11%±0.49% | 0.4767±0.0032 | NA | NA | NA | NA |
| GMM | Majority | 25%±0.00% | 0.1726±0.0026 | <0.0001 | 1 | <0.0001 | 1 |
| GMM | Stratified | 25.08%±0.24% | 0.2508±0.0023 | <0.0001 | 1 | <0.0001 | 1 |
| GMM | DT | 38.66%±0.82% | 0.3138±0.0053 | <0.0001 | 0.9421 | <0.0001 | 1 |
| GMM | XGBoost | 31.05%±0.44% | 0.3061±0.0053 | <0.0001 | 1 | <0.0001 | 1 |
| GMM | LightGBM | 42.73%±0.63% | 0.3399±0.0048 | 0.0003 | 0.1222 | <0.0001 | 0.6288 |
| GMM | RF | 41.09%±0.77% | 0.3608±0.0060 | NA | NA | NA | NA |
We report more detailed metrics from the random forest model using labels from k-means (Table 5 and Table 6). The results showed that although with performance disparity across the class labels, random forest makes meaningful predictions for all classes. It achieved the highest F1 for the High score/low variance class, which has the second highest support. Although RF performed the worst for the Low score/high variance minority class, it achieved better accuracy than the two baselines. Compared to Majority or Stratified, who outperform random forest on the majority class (F1 score 0.68 ± 0.01 and 0.51 ± 0.01 respectively), but could not learn meaningful patterns for the other two classes (random forest F1: 0.38 ± 0.01, VS Majority F1: 0.00 ± 0.00 and Stratified F1: 0.15 ± 0.01).
| Recall Low score/high variance | Recall Average score/variance | Recall High score/low variance | |
| True Low score/high variance | 51.32% ± 1.22% | 31.30% ± 1.14% | 17.38% ± 0.85% |
| True Average score/variance | 28.08% ± 0.50% | 40.48% ± 0.65% | 31.45% ± 0.67% |
| True High score/low variance | 11.86% ± 0.57% | 26.60% ± 1.22% | 61.54% ± 1.11% |
| True Low score/high variance | 0.00% ± 0.00% | 100.00% ± 0.00% | 0.00% ± 0.00% |
| True Average score/variance | 0.00% ± 0.00% | 100.00% ± 0.00% | 0.00% ± 0.00% |
| True High score/low variance | 0.00% ± 0.00% | 100.00% ± 0.00% | 0.00% ± 0.00% |
| True Low score/high variance | 15.35% ± 0.66% | 51.20% ± 1.04% | 33.45% ± 0.81% |
| True Average score/variance | 15.63% ± 0.49% | 51.13% ± 0.56% | 33.25% ± 0.91% |
| True High score/low variance | 15.27% ± 0.92% | 51.54% ± 0.70% | 33.19% ± 1.01% |
| Clustering | Classifier | BA | F1 | t-test p (BA) | Tost p (BA) | t-test p (F1) | Tost p (F1) |
| k-means | RF | 51.11%±0.49% | 0.4767±0.0032 | NA | NA | NA | NA |
| k-means | RF ablated | 50.96%±0.5% | 0.4781±0.0038 | 0.2664 | < 0.0001 | 0.2377 | < 0.0001 |
| k-means | LightGBM | 51.58%±0.4% | 0.4667±0.0032 | NA | NA | NA | NA |
| k-means | LightGBM ablated | 51.55%±0.46% | 0.4666±0.0038 | 0.7644 | < 0.0001 | 0.9036 | < 0.0001 |
| GMM | RF | 41.09%±0.77% | 0.3608±0.0060 | NA | NA | NA | NA |
| GMM | RF ablated | 40.83%±0.66% | 0.3585±0.0055 | 0.012 | < 0.0001 | 0.0159 | < 0.0001 |
| GMM | LightGBM | 42.73%±0.63% | 0.3399±0.0048 | NA | NA | NA | NA |
| GMM | LightGBM ablated | 42.49%±0.66% | 0.3350±0.0052 | 0.1564 | < 0.0001 | 0.0056 | < 0.0001 |
Model accuracy remained after removing age and gender
To test our hypothesis that user archetypes are mainly decided by their passive behavioral features, we re-trained the random forest and LightGBM models after ablating age and gender, for labels discovered from both k-means (k=3) and GMM (k=4). We evaluated the models using balanced accuracy (BA) and macro F1. With k-means discovered labels, both the corrected resampled t-test and TOST (margin=0.02) test showed that ablation insignificantly affected accuracy. With GMM discovered labels, the corrected resampled t-test showed a significant difference with ablation for random forest on balanced accuracy and macro F1. A significant difference was also shown for the macro F1 of LightGBM. On the contrary, the TOST test (margin=0.02) showed that the ablated classifiers were equivalent for all cases. With the above results, we concluded that ablating age and gender yielded classifiers with equivalent balanced accuracy and macro F1 (Table 7).
| Clustering | Classifier | BA | F1 | t-test p (BA) | TOST p (BA) | t-test p (F1) | TOST p (F1) |
| k-means | RF | 51.11%±0.49% | 0.4767±0.0032 | NA | NA | NA | NA |
| k-means | RF ablated | 50.96%±0.5% | 0.4781±0.0038 | 0.2664 | < 0.0001 | 0.2377 | < 0.0001 |
| k-means | LightGBM | 51.58%±0.4% | 0.4667±0.0032 | NA | NA | NA | NA |
| k-means | LightGBM ablated | 51.55%±0.46% | 0.4666±0.0038 | 0.7644 | < 0.0001 | 0.9036 | < 0.0001 |
| GMM | RF | 41.09%±0.77% | 0.3608±0.0060 | NA | NA | NA | NA |
| GMM | RF ablated | 40.83%±0.66% | 0.3585±0.0055 | 0.012 | < 0.0001 | 0.0159 | < 0.0001 |
| GMM | LightGBM | 42.73%±0.63% | 0.3399±0.0048 | NA | NA | NA | NA |
| GMM | LightGBM ablated | 42.49%±0.66% | 0.3350±0.0052 | 0.1564 | < 0.0001 | 0.0056 | < 0.0001 |
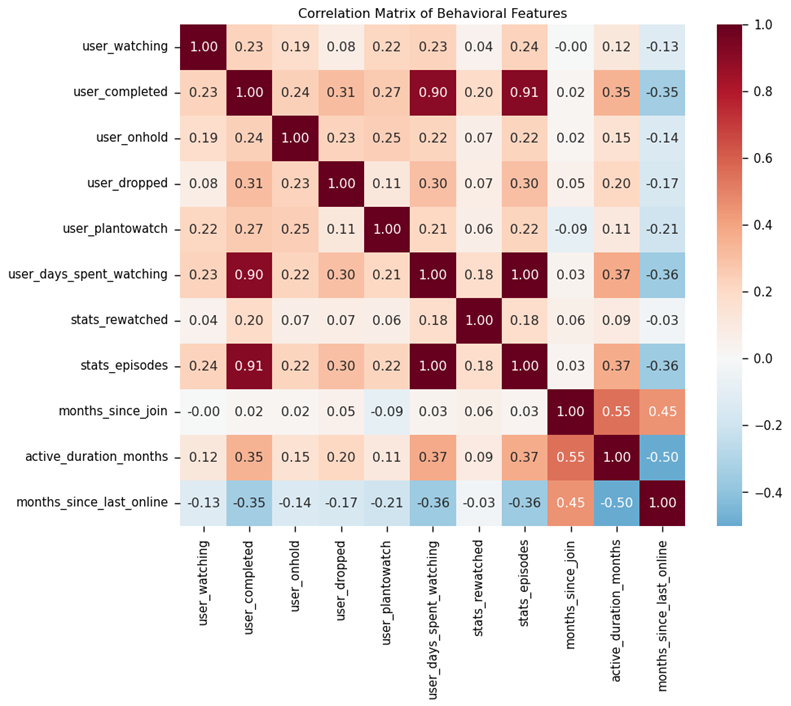
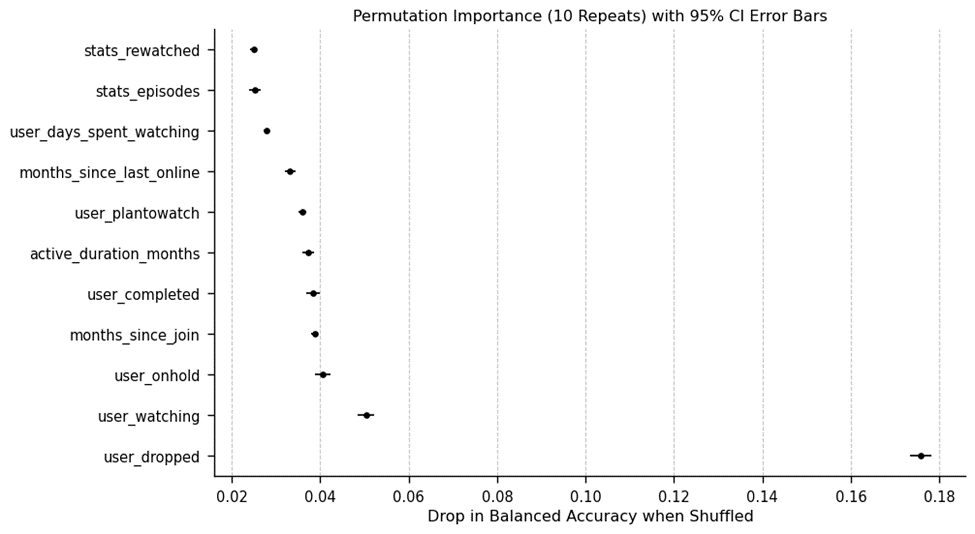
We employed the random forest model with k-means labels to study the importance of the behavioral features involved. The Gini method showed that drop rates (user_dropped) were the most important feature43. To validate this result, we reported the correlation matrix of all behavioral features, which showed that user_dropped has moderate correlations with user_completed (0.31), stats_episodes (0.30), and user_days_spent_watching (0.30), but not highly correlated to other features (Figure 4). We ran permutation importance on the held-out folds, which also showed that user_dropped was the most important feature with importance=0.1758±0.001, which was much higher than the second most important feature user_watching (importance=0.0503±0.0009) (Figure 5)44. To further validate this observation, we compared ablating user_dropped to ablating the activity feature group (user_completed, user_dropped, user_watching, user_plantowatch, stats_episodes, user_days_spent_watching). The results showed that ablating user_dropped reduced the balanced accuracy by 0.0653, and ablating the activity feature group reduced the balanced accuracy by 0.0889. With the above results, we concluded that user_dropped is the most important feature among all behavioral features we tested for classifying the user archetypes we discovered.
Discussion
Restatement of Findings
The results suggest that user archetypes from rating behaviors are primarily driven by passive engagement features rather than age and gender. Clustering analysis helped us identify three archetypes. The feature ablation experiment based on the random forest model showed that removing age and gender resulted in only a marginal and statistically insignificant decrease in accuracy, which supported our hypothesis that passive behavior is the primary predictor of user archetypes from ratings. This suggests that recommendation systems and advertising algorithms in streaming sites should focus primarily on passive user engagement rather than age and gender when explicit user ratings are not available. Terminating the collection of age and gender from users not only benefits public perception for a streaming service but also reduces the privacy overhead and the expenses spent on data collection.
Alternative interpretations of the clustering result
Although we interpreted the discovered clusters as user archetypes (e.g., lenient enthusiasts versus experienced users with high quality bars), other alternative mechanisms may account for these results. The “High score/low variance” cluster may represent anime viewers who mainly consume highly rated titles or specific genres they favor, rather than rookie viewers who are lenient. Users who follow the platform recommendations that are tailored to their tastes or primarily read titles that are highly ranked are more likely to give higher ratings. The “Low score/high variance” cluster could represent logging bias rather than having high quality bars. Users in this cluster might have higher motivation to report lower ratings when they dislike a title.
Production Considerations
In a production environment, this work can serve as an upstream module to feed user archetypes to downstream recommenders, which can tailor recommendations to user archetypes. For example, collaborative filtering thresholds can be adjusted higher for “Low score/high variance” users and lower for “High score/low variance” users. In practice, our work supported that user archetypes can be predicted with passive engagement features in real time, instead of relying on demographic features that require user consent, such as age and gender.
Periodic updates are required to capture temporal shifts in user behavior. A novice user might be classified as a “High score/low variance” user when they just got started, but might transition into a “Low score/high variance” user with more experience. To maintain the accuracy of the system, the classifiers need to be retrained with a given schedule (for example, on a weekly or monthly schedule). In addition, a production system shall also monitor metrics for data distribution changes and refresh the classifiers when certain conditions are triggered.
Limitations and Future Work
There are several limitations to this study. Our data set and features depend entirely on MyAnimeList. The conclusions may not generalize to other streaming services due to the lack of external validation. After excluding the invalid ‘0’ ratings that are not possible on the website, we also filtered out users that had rated less than 6 shows to ensure that the target demographic not only includes more impactful users but also users with the ability to accurately rate shows through comparison. The 6-ratings rule filtered out 4,817 out of the 106,396 total users, which represents 4.53% of the total user base. Although only a moderate percentage of users were dropped from the study, our conclusion shall be interpreted as being valid for more engaged users because of this limitation.
Because archetype ground truth does not exist in our data set. Our classifiers rely on the labels from the clustering analysis, which is subject to uncertainty itself. This may contribute to the moderate classification accuracy. Our most accurate models (random forest and LightGBM) achieved a balanced accuracy of around 51%. Although it is better than the 33% balanced accuracy of a random classifier, this accuracy is low for a modern classifier. The low accuracy suggests that classification models need better predictors in addition to the behavioral features collected by MyAnimeList. However, the classifier with only user interaction features can be useful in certain real applications. For example, to address the cold-start problem in a recommendation system with privacy awareness, such a classifier can provide a statistically significantly better starting point than the random baseline for the system.
Our study only relied on the prediction models’ ability to predict user archetypes, which is only one of the many important pieces for advertisement and recommendation algorithms. Conclusions about other important pieces of information like correlations between specific shows and user personal preferences cannot be drawn from our study. Lastly, while we determined that age and gender are demographic features that can be removed, other demographic features such as location were not properly tested due to lack of access, so conclusions on demographic features in general can only be drawn by extrapolating the trend seen in those two to cover other demographic features in general.
While the MyAnimeList data set collects user features that reflect temporal properties (months_since_join, active_duration_months, months_since_last_online, user_days_spent_watching), it only provides aggregated user histories rather than temporal logs. As a result, evaluating the temporal stability of user archetypes is beyond the scope of the available data.
In this paper, our scope was limited to user archetype analysis for anime. Future work will include applying the methodology to more types of analysis for more applications, which could be more impactful to the online ecosystem. Furthermore, the clustering and classification analysis in this study can benefit from improved feature collection and engineering, which would make our analysis more useful for real-world applications. Lastly, including more demographic features in the feature ablation study could further strengthen our conclusion, or help identify the demographic or other types of sensitive features that are necessary to collect.
Conclusion
User privacy has been an important topic with the prevalence of online activities. Anime platforms often collect user data for analysis to improve their systems, many of which cause privacy concerns. For example, the collection of age and gender is often under strict scrutiny. In this study, we hypothesized that user archetypes discovered from ratings can be predicted by their interactions with the platforms.
Empirical Findings
We tested our hypothesis using the MyAnimeList data set. By utilizing machine learning concepts – clustering and classification, we identified three distinct user archetypes and then trained models to classify anime viewers into the identified archetypes. A feature ablation study with the most accurate models showed that the predictive accuracy was not harmed after removing age and gender, which supported our hypothesis. The results showed that age and gender are not necessary for analyzing user archetypes, therefore eliminating the need for anime platforms to collect such features for the relevant applications.
Broader Speculative Implications
These empirical results suggest broader potential implications for recommendation systems. If the findings generalize beyond the MyAnimeList users, the collection of certain explicit demographic features such as age and gender may be unnecessary for learning user archetypes. An example of such an application is the cold-start problem for early-stage recommendations. With this premise, modern recommenders can reduce privacy compliance overhead and build trust with privacy-aware systems without sacrificing accuracy. These potential benefits remain speculative until large scale external validations are conducted across more use cases.
Appendix
The source code is available on Github at https://github.com/KadenLu/Kaden-s-Individual-Project/tree/main.
References
- National Research Group, Crunchyroll. How anime became a worldwide cultural force. National Research Group. 2026, https://view.ceros.com/nrgmr/crunchyroll-global-state-of-anime/p/1. [↩]
- F. Ricci, L. Rokach, B. Shapira. Recommender systems: introduction and challenges. Recommender systems handbook. Pg. 1-34, 2015, https://doi.org/10.1007/978-1-4899-7637-6_1. [↩]
- S. Zuboff. The age of surveillance capitalism: the fight for a human future at the new frontier of power. PublicAffairs, 2019, https://www.publicaffairsbooks.com/titles/shoshana-zuboff/the-age-of-surveillance-capitalism/9781610395694/. [↩]
- C. A. Gomez-Uribe, N. Hunt. The Netflix recommender system: algorithms, business value, and innovation. ACM Transactions on Management Information Systems. Vol. 6, pg. 1-19, 2015, https://doi.org/10.1145/2843948. [↩]
- P. Covington, J. Adams, E. Sargin. Deep neural networks for YouTube recommendations. Proceedings of the 10th ACM Conference on Recommender Systems. Pg. 191-198, 2016, https://doi.org/10.1145/2959100.2959190. [↩]
- J. Bobadilla, F. Ortega, A. Hernando, A. Gutiérrez. Recommender systems survey. Knowledge-Based Systems. Vol. 46, pg. 109-132, 2013, https://doi.org/10.1016/j.knosys.2013.03.012. [↩]
- A. M. Rashid, I. Albert, D. Cosley, S. K. Lam, S. M. McNee, J. A. Konstan, J. Riedl. Getting to know you: learning new user preferences in recommender systems. Proceedings of the 7th International Conference on Intelligent User Interfaces. Pg. 127-134, 2002, https://doi.org/10.1145/502716.502737. [↩]
- N. Mehrabi, F. Morstatter, N. Saxena, K. Lerman, A. Galstyan. A survey on bias and fairness in machine learning. ACM Computing Surveys. Vol. 54, pg. 1-35, 2021, https://doi.org/10.1145/3457607. [↩]
- C. Dwork, M. Hardt, T. Pitassi, O. Reingold, R. Zemel. Fairness through awareness. Proceedings of the 3rd Innovations in Theoretical Computer Science Conference. Pg. 214-226, 2012, https://doi.org/10.1145/2090236.2090255. [↩]
- S. U. Noble. Searching for protections from search engines. Algorithms of oppression: How search engines reinforce racism. Pg. 119-133, 2018, https://doi.org/10.18574/nyu/9781479833641.003.0008. [↩]
- M. Račinský. MyAnimeList dataset. Kaggle. 2022, https://doi.org/10.34740/KAGGLE/DSV/45582. [↩]
- J. MacQueen. Some methods for classification and analysis of multivariate observations. Proceedings of the Fifth Berkeley Symposium on Mathematical Statistics and Probability. Vol. 5, pg. 281-297, 1967, https://zbmath.org/?q=an:0214.46201. [↩] [↩]
- D. A. Reynolds. Gaussian mixture models. Encyclopedia of biometrics. Pg. 659-663, 2009, https://doi.org/10.1007/978-0-387-73003-5_196. [↩]
- J. R. Quinlan. Induction of decision trees. Machine Learning. Vol. 1, pg. 81-106, 1986, https://doi.org/10.1007/BF00116251. [↩] [↩]
- L. Breiman. Random forests. Machine Learning. Vol. 45, pg. 5-32, 2001, https://doi.org/10.1023/A:1010933404324. [↩] [↩]
- T. Chen, C. Guestrin. XGBoost: a scalable tree boosting system. Proceedings of the 22nd ACM SIGKDD International Conference on Knowledge Discovery and Data Mining. Pg. 785-794, 2016, https://doi.org/10.1145/2939672.2939785. [↩] [↩]
- G. Ke, Q. Meng, T. Finley, T. Wang, W. Chen, W. Ma, Q. Ye, T. Liu. LightGBM: a highly efficient gradient boosting decision tree. Advances in Neural Information Processing Systems. Vol. 30, pg. 3146-3154, 2017, https://papers.nips.cc/paper/6907-lightgbm-a-highly-efficient-gradient-boosting-decision-tree. [↩] [↩]
- R. E. Tarigan, Y. S. Wijaya. Anime segmentation based on user preferences: applying clustering to identify groups of anime with similar genres, themes, and popularity. International Journal for Applied Information Management. Vol. 5, pg. 43-57, 2025, https://doi.org/10.47738/ijaim.v5i1.99. [↩]
- A. Bhattacharya, J. F. Florez-Arango. Cluster-based predictive modeling of user ratings for physical activity apps using mobile app rating scale (MARS) dimensions: model development and validation. JMIR Mhealth Uhealth. Vol. 13, pg. e70987, 2025, https://doi.org/10.2196/70987. [↩]
- Y. H. Alfaifi. Recommender systems applications: data sources, features, and challenges. Information. Vol. 15, pg. 660, 2024, https://doi.org/10.3390/info15100660. [↩]
- J. Govea, R. Gutierrez, W. Villegas-Ch. Transparency and precision in the age of AI: evaluation of explainability-enhanced recommendation systems. Frontiers in Artificial Intelligence. Vol. 7, pg. 1410790, 2024, https://doi.org/10.3389/frai.2024.1410790. [↩]
- S. Vijayaraghavan, P. Mohapatra. Stability of explainable recommendation. Proceedings of the 17th ACM Conference on Recommender Systems. Pg. 947-954, 2023, https://doi.org/10.1145/3604915.3608853. [↩]
- A. Said. On explaining recommendations with Large Language Models: a review. Frontiers in Big Data. Vol. 7, pg. 1505284, 2025, https://doi.org/10.3389/fdata.2024.1505284. [↩]
- T. Yanagi, S. Ikeda, N. Sukegawa, Y. Takano. Privacy-preserving recommender system using the data collaboration analysis for distributed datasets. PLOS ONE. Vol. 20, pg. e0319954, 2025, https://doi.org/10.1371/journal.pone.0319954. [↩]
- S. Wu, F. Sun, W. Zhang, X. Xie, B. Cui. Graph neural networks in recommender systems: a survey. ACM Computing Surveys. Vol. 55, pg. 1-37, 2022, https://doi.org/10.1145/3535101. [↩]
- C. Gao, Y. Zheng, N. Li, Y. Li, Y. Qin, J. Piao, Y. Quan, J. Chang, D. Jin, X. He, Y. Li. A survey of graph neural networks for recommender systems: challenges, methods, and directions. ACM Transactions on Recommender Systems. Vol. 1, pg. 1-51, 2023, https://doi.org/10.1145/3568022. [↩]
- M. Kusner, J. Gardner, R. Garnett, K. Weinberger. Differentially private Bayesian optimization. International Conference on Machine Learning. Vol. 37, pg. 918-927, 2015, https://proceedings.mlr.press/v37/kusnera15.html. [↩]
- T. Feng, S. Narayanan. Modeling Behavioral Consistency in Large-Scale Wearable Recordings of Human Bio-Behavioral Signals. IEEE International Conference on Acoustics, Speech and Signal Processing (ICASSP), pg. 1011-1015, 2020, https://doi.org/10.1109/ICASSP40776.2020.9054493. [↩]
- Q. Ma, X. Ren, C. Huang. XRec: large language models for explainable recommendation. Findings of the Association for Computational Linguistics: EMNLP 2024. Vol. 1, pg. 391-402, 2024, https://doi.org/10.48550/arXiv.2406.02377. [↩]
- M. Yang, M. Zhu, Y. Wang, L. Chen, Y. Zhao, X. Wang, C. Huang, X. Zheng, J. Yin. Fine-tuning large language model based explainable recommendation with explainable quality reward. Proceedings of the AAAI Conference on Artificial Intelligence. Vol. 38, pg. 9250-9259, 2024, https://doi.org/10.1609/aaai.v38i8.28777. [↩]
- X. Zhang, J. Zhang, H. Wang. PGRC: an explainable recommendation method enhanced by knowledge graph and reinforcement learning. Data Technologies and Applications. Vol. 59, pg. 670-695, 2025, https://doi.org/10.1108/DTA-05-2024-0556. [↩]
- X. He, K. Deng, X. Wang, Y. Li, Y. Zhang, M. Wang. LightGCN: simplifying and powering graph convolution network for recommendation. Proceedings of the 43rd International ACM SIGIR Conference on Research and Development in Information Retrieval. Pg. 639-648, 2020, https://doi.org/10.1145/3397271.3401063. [↩]
- F. Pedregosa, G. Varoquaux, A. Gramfort, V. Michel, B. Thirion, O. Grisel, M. Blondel, P. Prettenhofer, R. Weiss, V. Dubourg, J. Vanderplas, A. Passos, D. Cournapeau, M. Brucher, M. Perrot, É. Duchesnay. Scikit-learn: machine learning in Python. Journal of Machine Learning Research. Vol. 12, pg. 2825-2830, 2011, https://jmlr.csail.mit.edu/papers/v12/pedregosa11a.html. [↩] [↩] [↩] [↩] [↩]
- D. Arthur, S. Vassilvitskii. k-means++: the advantages of careful seeding. Proceedings of the Eighteenth Annual ACM-SIAM Symposium on Discrete Algorithms. Pg. 1027-1035, 2007, https://dl.acm.org/doi/10.5555/1283383.1283494. [↩]
- M. Stone. Cross-validatory choice and assessment of statistical predictions. Journal of the Royal Statistical Society: Series B (Methodological). Vol. 36, pg. 111-147, 1974, https://doi.org/10.1111/j.2517-6161.1974.tb00994.x. [↩]
- T. M. Kodinariya, P. R. Makwana. Review on determining number of cluster in k-means clustering. International Journal of Advance Research in Computer Science and Management Studies. Vol. 1, pg. 90-95, 2013, https://ijarcsms.com/docs/paper/volume1/issue6/V1I6-0015.pdf. [↩]
- P. J. Rousseeuw. Silhouettes: a graphical aid to the interpretation and validation of cluster analysis. Journal of Computational and Applied Mathematics. Vol. 20, pg. 53-65, 1987, https://doi.org/10.1016/0377-0427(87)90125-7. [↩]
- L. Hubert, P. Arabie. Comparing partitions. Journal of Classification. Vol. 2, pg. 193-218, 1985, https://doi.org/10.1007/BF01908075. [↩]
- C. J. van Rijsbergen. Evaluation. Information retrieval. Pg. 142-183, 1979, https://dl.acm.org/doi/10.5555/539927. [↩]
- C. Nadeau, Y. Bengio. Inference for the generalization error. Machine Learning. Vol. 52, pg. 239-281, 2003, https://doi.org/10.1023/A:1024068626366. [↩]
- D. Lakens. Equivalence testing for psychological research: a tutorial. Advances in Methods and Practices in Psychological Science. Vol. 1, pg. 259-269, 2018, https://doi.org/10.1177/2515245918770963. [↩]
- D. J. Schuirmann. A comparison of the two one-sided tests procedure and the power approach for assessing the equivalence of average bioavailability. Journal of Pharmacokinetics and Biopharmaceutics. Vol. 15, pg. 657-680, 1987, https://doi.org/10.1007/BF01068419. [↩]
- L. Breiman, J. H. Friedman, R. A. Olshen, C. J. Stone. Classification and regression trees. Wadsworth, 1984, https://doi.org/10.1201/9781315139470. [↩]
- A. Altmann, L. Toloşi, O. Sander, T. Lengauer. Permutation importance: a corrected feature importance measure. Bioinformatics. Vol. 26, pg. 1340-1347, 2010, https://doi.org/10.1093/bioinformatics/btq134. [↩]