
Abstract
Lung adenocarcinoma (LUAD) and lung squamous cell carcinoma (LUSC) are the two most common subtypes of non-small cell lung cancer. Accurate subtype classification is important for both accurate diagnosis and treatment determination. However, distinguishing between the two subtypes can be difficult, especially in small or morphologically ambiguous specimens. This study evaluated whether pathway-level transcriptomic features can differentiate LUAD and LUSC using machine learning. RNA-sequencing data from The Cancer Genome Atlas were analyzed using single-sample GSEA (ssGSEA) to generate pathway activity scores. Then, multiple machine learning models (linear classifiers, tree-based methods, and ensemble models) were evaluated using nested cross-validation and an independent held-out test set on datasets to distinguish between tumor vs. normal classification and LUAD vs. LUSC classification. For tumor vs. normal classification, repeated nested cross-validation achieved an AUC of 0.983 ± 0.035 and balanced accuracy of 0.989 ± 0.022. For LUAD vs. LUSC classification, repeated nested cross-validation achieved an AUC of 0.948 ± 0.023 and balanced accuracy of 0.912 ± 0.028. External validation supported these promising results, with AUC remaining high, although balanced accuracy decreased to 0.756. Overall, this study supports pathway-based machine learning as a useful framework for cancer classification and subtype analysis, though larger data diversity and sample size is needed before claiming clinical utility.
Keywords: LUAD, LUSC, Lung Cancer, Machine Learning, GSEA, ssGSEA, Cancer, Early Diagnosis
Introduction
Lung adenocarcinoma (LUAD) is the most common subtype of non-small-cell lung cancer (NSCLC), representing 45% of cases1. However, the disease often goes undetected until advanced stages because early symptoms are nonspecific2,3. In addition, current screening programs are generally limited to only high-risk populations2,4. This delayed detection contributes to a poor prognosis2,3,5. In fact, one surgical series reported 5-year survival of 85% for pathologic stage IA and 11% for stage IV5. Early identification is therefore important for reducing lung-cancer mortality4. Circulating tumor-derived biomarkers can also be less sensitive in early-stage disease; for example, plasma EGFR mutation detection showed substantially lower sensitivity in early-stage than advanced-stage NSCLC in one study6.
Lung squamous cell carcinoma (LUSC) is another major NSCLC subtype with distinct molecular characteristics7. Distinguishing LUAD from LUSC is crucial for determining the correct steps for treatment8,9. Treatment selection can also involve subtype-specific safety considerations10. However, this classification can be difficult, especially in small-biopsy or cytology specimens9,11,12.
While both are NSCLC subtypes, LUAD and LUSC have distinct gene expression profiles7,13,14.
Current Methods of Disease Identification
LUAD and LUSC are most commonly detected through the use of histopathology9,15. While it is considered the gold standard of NSCLC classification, small biopsy samples may incompletely represent the true heterogeneity of tumors because only limited tumor material is available for analysis16. Unfortunately, indiscernible morphologies can complicate LUAD/LUSC classification9,11,12. Because of this issue, molecular indicators, such as known alterations in EGFR, ALK, and KRAS, can also be investigated17. The frequencies of particular oncogenic alterations can vary with factors such as smoking history, sex, and race/ethnicity18,19. Other circulating biomarkers, like microRNAs, autoantibodies, and circulating tumor DNA, have also been investigated20,21. However, their sensitivity can decrease in early-stage cancer, potentially because less tumor-derived material is present in circulation2,6,22.
Gene Set Enrichment Analysis (GSEA)
Gene Set Enrichment Analysis, or GSEA, is a technique introduced by Subramanian et al. that was a critical conceptual shift: instead of focusing on individual genes, GSEA adopts a pathway-level analysis23. This technique is more consistent with cancer biology because tumor behavior is often affected by pathway dysregulation rather than individual gene changes23,24. Pathway-level analysis also reduces the dimensionality of noisy gene-expression datasets23,25. Both Xie et al. and Li et al. used immune-related gene sets or signatures to characterize LUAD and LUSC26,27. Their analyses were primarily focused on immune-related features, leaving other biologically relevant processes less explored26,27.
Artificial Intelligence for Biomarker Analysis
Artificial intelligence, or AI, and machine learning have emerged as tools that can analyze high-dimensional omics data and contribute to early detection21,28,29. However, their performance depends heavily on the structure of the features that they analyze25,28. Chen and Dhahbi used machine learning-based feature selection to identify a panel of genes distinguishing LUAD from LUSC13. More generally, gene-level molecular signatures can be sensitive to the choice of feature-selection method, which may affect their accuracy and interpretability30. A recent gene-level transcriptomic study by Wu et al. trained a 10-gene model using TCGA LUAD/LUSC RNA-seq and evaluated it across four external gene-expression cohorts; the best-performing random-forest model reported a mean accuracy of 0.69231.
Overall, across biomarker discovery, pathway analysis, and machine learning, few studies have integrated transcriptomic features with broad pathway-level scoring to classify early-stage LUAD vs. LUSC. High-dimensional gene-level data can make feature stability and interpretation more difficult25,30. Therefore, addressing this would require an organizing principle that relies instead on pathway-level representations. Such representations align more closely with the fact that cancer relies on many different systems working together to progress, rather than one individual gene. Prior LUAD/LUSC pathway-focused studies cited here have largely emphasized immune-related features26,27. By using RNA-seq pathway enrichment, this study aims to evaluate whether a pathway-based framework can improve both the accuracy and interpretability of early-stage NSCLC classification.
Overall, this study aims to answer the following: how can pathway-level RNA-Seq biomarkers be used to accurately distinguish between matched adjacent non-tumor lung tissue, early-stage lung adenocarcinoma and lung squamous cell carcinoma using machine-learning classification models? It was hypothesized that if pathway activity scores derived from RNA-seq (ssGSEA) are used to train machine learning algorithms, they will be able to classify LUAD, LUSC, and matched non-tumor samples with high accuracy and strong discrimination.
Methods
Dataset Building
Open-access RNA-seq data for TCGA-LUAD and TCGA-LUSC was obtained from the National Cancer Institute Genomic Data Commons (GDC), with primary tumors being restricted to stage 1 disease only. All available GDC samples labeled Solid Tissue Normal were retained during retrieval so prespecified tumor-versus-normal cohorts could be constructed from one fixed score table 32; in this study, these samples were treated as the non-tumor comparison tissue, or “normal”.
The final TCGA pathway-score table contained 621 samples from 565 patients: 273 LUAD primary tumors, 238 LUSC primary tumors, 59 LUAD-project Solid Tissue Normal samples, and 51 LUSC-project Solid Tissue Normal samples. The primary tumor-versus-normal task used 112 samples from 56 patients, with one Stage I primary tumor and one matched normal sample per patient. The subtype task used all 511 strict Stage I primary tumors, with one tumor sample per patient. This data was used as the internal dataset, to train and test machine learning models for NSCLC classification (Table 1).
All methodology was performed computationally on publicly available data to allow for analysis of these large-scale patient datasets. Additionally, the study utilized the practice of de-identification, where personally identifiable information was removed from patient data, ensuring ethical integrity by protecting patient privacy.
| TCGA Cohort | GSE81089 Cohort | |||||||
| Gender | Male | Female | Male | Female | ||||
| 308 | 257 | 96 | 103 | |||||
| Ethnicity and Race | African American | White | Asian | Hispanic/Latino | African American | White | Asian | Hispanic/Latino |
| 49 | 383 | 111 | 8 | N/A | ||||
| Age Group | 40-49 | 50-59 | 60-69 | 70-80+ | ≤70 years | >70 years | ||
| 20 | 83 | 102 | 112 | 120 | 79 | |||
RNA-seq Processing and ssGSEA
GDC STAR-Counts files were processed using the tpm_unstranded expression column. This column represents “transcripts per million,” an RNA-seq measure that normalizes read abundance for transcript length and scales values relative to total transcript abundance within a sample33. Gene identifiers were standardized to nomenclature gene symbols (HGNC), and duplicate symbols were combined34.
To characterize pathway activity at the individual sample level and produce scores to be used in machine learning pipelines, single-sample GSEA (ssGSEA) was performed. Unlike traditional GSEA, ssGSEA computes pathway activity scores for individual samples rather than at the group level. This is beneficial for generating scores based on individual samples, which is more applicable to clinical settings where diagnosis occurs at the individual patient level. Single-sample pathway scores were generated with GSEApy using all 50 MSigDB Hallmark gene sets35,36. For each sample, genes were ranked based on their expression levels, and ssGSEA measured whether the genes belonging to a pathway tended to appear toward the top or bottom of the ranked list. A higher pathway score indicates greater relative enrichment of that pathway within the sample.
Before machine learning, the 50 pathway scores for each individual sample were converted to z-scores by subtracting that sample’s mean pathway score and dividing by its standard deviation across the 50 pathways. This was done because raw ssGSEA scores can be different in their overall scale between datasets, which can make it more difficult for a model trained on one dataset to be applied to another. Importantly, ssGSEA was performed before the machine-learning pipeline because each sample is standardized using only its own 50 pathway scores, without using information from other patients or values calculated from the full cohort. Generating these scores before machine learning therefore does not allow data leakage, which could skew the results.
The ssGSEA scoring used rank-based sample normalization, rank-based correlation normalization, a weight of 0.25, a minimum gene-set size of 10 and a maximum size of 500. ssGSEA works by looking at the expression pattern of genes within a single sample and asking whether the genes belonging to a specific pathway tend to appear toward the top or bottom of that sample’s ranked gene list. Rank-based normalization was therefore used so that pathway scores depended mainly on the relative ordering of genes inside each sample. Rank-based correlation normalization was also used so that this ranked information was retained during enrichment-score calculation.
A weight of 0.25 gave some more influence to genes with stronger ranked expression, while still allowing the score to reflect the pathway as a whole rather than only a few highly expressed genes. Gene sets were required to contain at least 10 genes so that pathway scores would not be based on very small groups of genes, and the maximum size of 500 prevented larger gene sets from heavily influencing the entire analysis.
Machine Learning Pipeline
The formatted ssGSEA file output containing the generated scores was used for downstream machine learning analysis. The goal of this section is mainly to determine whether the pathway scores obtained could help with tumor vs. normal classification along with subtype discrimination between LUSC and LUAD. Using the enrichment scores, two files were created: the first one, “task1,” contained Stage-I tumor and normal samples from the same patients for classification between those two samples. The second file was named “task2,” and contained information from Stage-I primary tumor samples for patients with LUAD vs. patients with LUSC.
Once these files were created, four different models were trained on the data: Logistic Regression and Support Vector Machine (linear), and Random Forest and Extra Trees (tree-based). The linear models were used to determine whether pathway-level features could produce easily and linearly separable classes, and the tree-based models were utilized to see the opposite, whether data was more based on nonlinear relationships. Logistic Regression was selected as the confirmatory model, or the model used to verify the hypothesis, before final testing because of its interpretability.
For every task, a locked test set was generated using StratifiedGroupKFold, where each patient’s IDs served as groups. This patient ID grouping prevented patients from appearing in both training and testing sets, which decreases the likelihood of data leakage. The model development phase utilized repeated nested cross-validation of the remaining dataset, with five outer folds for assessment and three inner folds for pathway selection and hyperparameter tuning, as well as ten repetitions using random seeds.
Pathways were selected inside the training folds by ANOVA SelectKBest, with sizes being either 3, 5, 7, or 10 pathways. This number, along with hyperparameter tuning, was selected using ROC-AUC scores throughout the inner cross validation loop. Additionally, a StandardScaler was used on the linear models in the training fold to prevent large numbers from influencing the analysis, therefore preventing data leakage (Table 2). Since class imbalance affected samples in Task 2 datasets, it was combated with stratified patient-splitting and balanced class weights. Finally, model validation utilized several metrics: ROC-AUC, balanced accuracy, accuracy, sensitivity, specificity, precision, and F1 scores, calculated once on the locked test set.
| Model | Hyperparameter Value |
| Logistic Regression | Solver = liblinear; C = 0.1, 1.0, 10.0; class weight = balanced; maximum iterations = 5,000 |
| Support Vector Machine | Kernel = linear; C = 0.1, 1.0, 10.0; class weight = balanced |
| Random Forest | Number of trees = 100; maximum depth = unrestricted or 8 |
| Extra Trees | Number of trees = 120; maximum depth = unrestricted or 8 |
Finally, external validation was conducted using RNA-seq data from GSE81089, a cohort of patients surgically treated at Uppsala University Hospital in Uppsala, Sweden37,38, which included both NSCLC cases and adjacent normal lung tissue. For ssGSEA, the same scoring and z-score calculation process was used to create the machine learning dataset. Then, the machine learning pipeline created previously was applied, with the same pathways, hyperparameters, StandardScaler, and 0.5 classification threshold. This was done to test whether the model works on the new data without letting the new data itself influence the model. The final TCGA-selected pathway subset, StandardScaler parameters, model hyperparameters, Logistic Regression coefficients, and classification threshold of 0.5 were all kept exactly as learned from TCGA.
Results
ssGSEA Pathway Activity
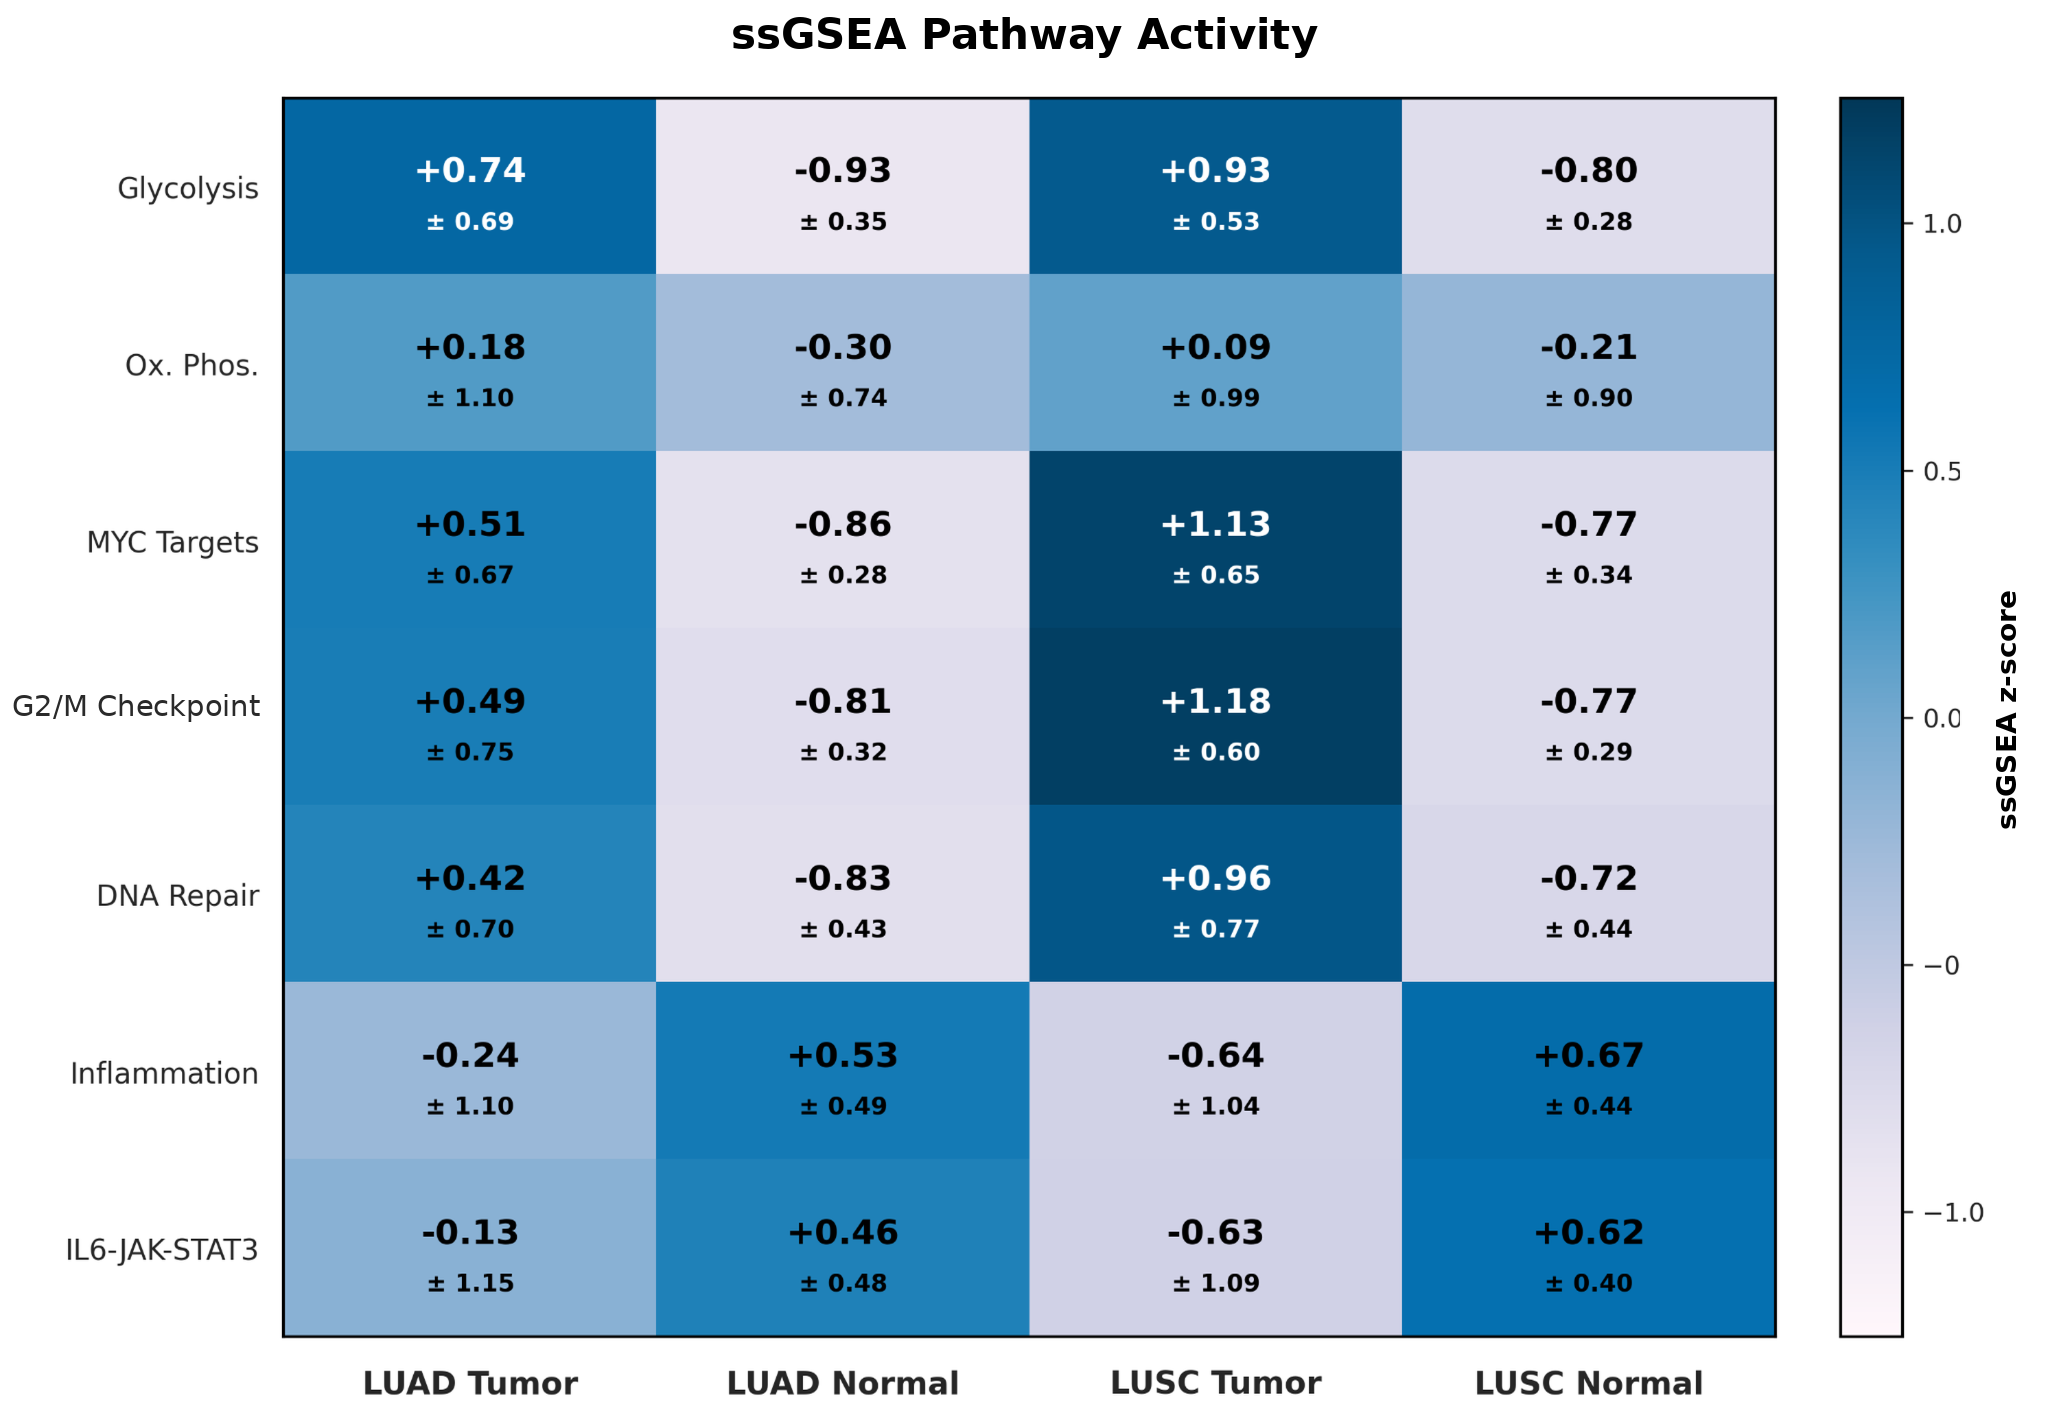
ssGSEA was used to generate individual pathway scores across all 50 Hallmark pathways. Higher ssGSEA scores indicate that the genes belonging to a pathway tend to be more highly ranked within that sample, while lower scores indicate relatively lower pathway activity. Overall, the strongest tumor-vs.-normal differences were seen in pathways related to metabolism, proliferation, and DNA maintenance. In both LUAD and LUSC, Glycolysis, MYC Targets, G2/M Checkpoint, and DNA Repair showed higher average pathway activity in tumor tissue than in normal tissue. For example, Glycolysis increased from -0.93 ± 0.35 in LUAD normal tissue to 0.74 ± 0.69 in LUAD tumors. The difference was similarly strong in LUSC, where Glycolysis increased from -0.80 ± 0.28 in normal tissue to +0.93 ± 0.53 in tumors. Also, LUSC showed high tumor activity for MYC Targets and G2/M Checkpoint, with average scores of 1.13 ± 0.65 and 1.18 ± 0.60, respectively (Figure 1).
In contrast, the inflammatory pathways showed the opposite tumor-vs.-normal pattern. Inflammatory Response and IL6-JAK-STAT3 were both lower on average in tumor tissue than in the corresponding normal tissue for LUAD and LUSC. For example, Inflammatory Response decreased from 0.53 ± 0.49 in LUAD normal tissue to -0.24 ± 1.10 in LUAD tumors, and LUSC decreased from 0.67 ± 0.44 to -0.64 ± 1.04. However, the larger standard deviations for the tumor inflammatory scores also indicate that this activity varied between individual tumors. (Figure 1).
Interestingly, LUAD and LUSC tumors showed more subtle differences in their activity. LUSC had higher average activity in the proliferation-related pathways, especially MYC Targets, G2/M Checkpoint, and DNA Repair. In contrast, LUAD showed higher inflammatory pathway activity than LUSC (Figure 1). However, the overlap and variability between the two tumor subtypes were much greater than the differences observed between tumor and normal tissue. This suggests that separating cancerous tissue from non-tumor tissue is biologically easier than distinguishing between the two closely related NSCLC subtypes.
Principal Component Analysis
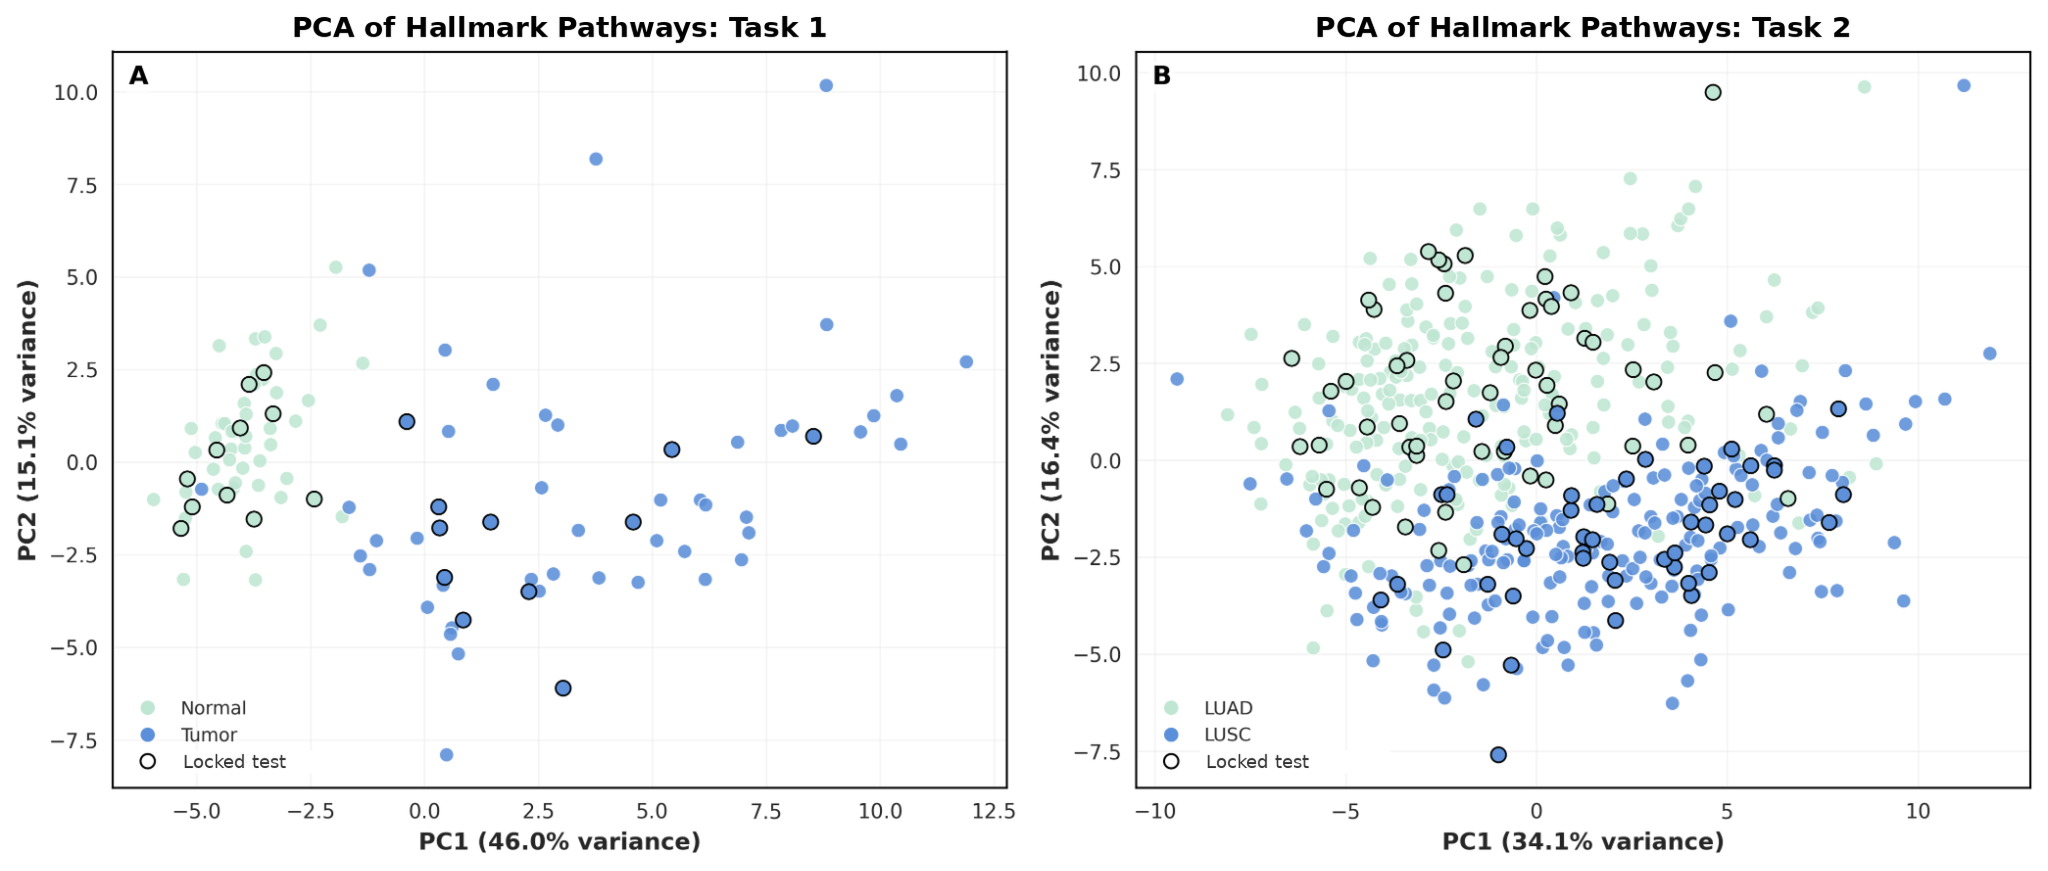
Principal Component Analysis (PCA) is a dimensionality reduction technique which transforms multiple features into unrelated components and reveals the structure of pathway enrichment data with predicted classifier performance. The PCA overall showed a much clearer separation for Task 1 than for Task 2. In the tumor vs. normal analysis, PC1 explained 46.0% of the pathway-space variance and PC2 explained 15.1%, for 61.1% combined. This means that the first two PCA axes shown in the figure capture 61.1% of the overall differences in pathway activity between the samples, so most of the major variation can be seen in the plot. Normal samples formed a compact group toward the negative side of PC1, while most tumor samples were located to the positive side. The locked-test samples followed the same pattern even though the PCA was fit only on the development data (Figure 2A), which is consistent with the strong tumor vs normal results and that a broad difference between the two tissues were already present in pathway data.
In contrast, the LUAD vs. LUSC PCA showed much more overlap. PC1 explained 34.1% of the variance and PC2 explained 16.4%, for 50.5% combined. This means that the two axes shown in the figure capture only half of the overall variation in pathway activity. LUAD samples were more concentrated toward the upper-left region, while LUSC samples appeared more often toward the lower and right regions. However, a large central area contained samples from both subtypes, including locked-test tumors (Figure 2B). This helps explain why Task 2 had lower classification metrics than Task 1: the subtype pathway profiles were different enough to produce separation, but not different enough to form two completely distinct groups.
Internal Classification Performance
| Task | ROC AUC | Balanced accuracy |
|---|---|---|
| Task 1 repeated nested CV | 0.983 ± 0.035 | 0.989 ± 0.022 |
| Task 1 frozen locked test | 1.000 | 1.000 |
| Task 2 repeated nested CV | 0.948 ± 0.023 | 0.912 ± 0.028 |
| Task 2 frozen locked test | 0.985 | 0.923 |
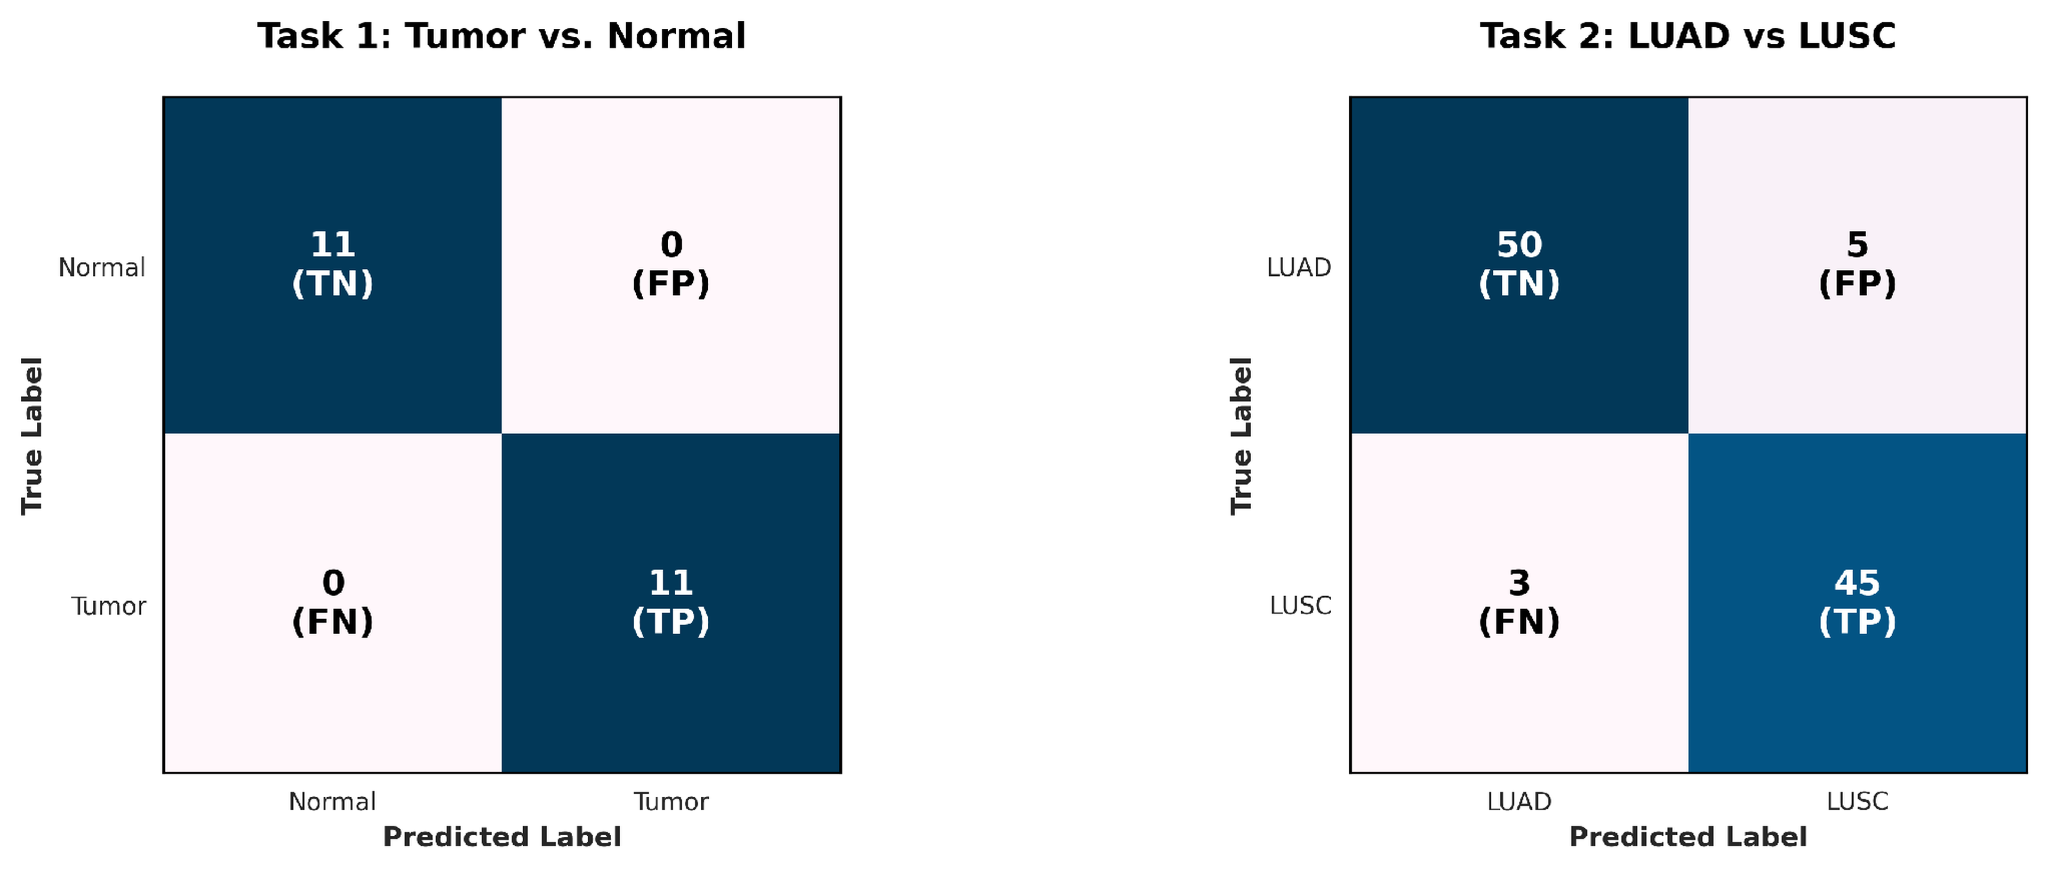
For task 1, the nested cross-validation resulted in an ROC-AUC of 0.983 ± 0.035 and balanced accuracy of 0.989 ± 0.022 (Table 3). After all model development was completed, the locked Logistic Regression model was tested once on the 22 locked samples from 11 matched patients, and all samples were classified correctly, resulting in an AUC, balanced accuracy, sensitivity, specificity, and overall accuracy of 1.000. Although this result is very strong, since the locked test is still small, there was some variability and uncertainty in results, which could limit its interpretability. Specifically, the 95% Wilson interval for accuracy was 0.851-1.000, while the sensitivity and specificity intervals were each 0.741-1.000.
A secondary analysis used both matched and non-matched normal samples to see whether the strong results were limited to only matched classes. The result, using 568 samples from 512 patients, produced an AUC of 0.998 ± 0.004 and balanced accuracy of 0.984 ± 0.012. The final locked test achieved an AUC of 1.000, balanced accuracy of 0.971, and overall accuracy of 94.7%. This result shows that the performance was strong even outside the most adjacent cases.
To check if Task 1 was only learning differences specific to one TCGA project, the model was trained on TCGA-LUAD and tested on TCGA-LUSC, and vice versa. This resulted in an AUC of 0.971 and balanced accuracy of 0.982 and an AUC of 0.996 and balanced accuracy of 0.948, respectively. This suggests that the tumor vs. normal signal was present in both histologies and was not restricted to one TCGA project.
Meanwhile, Task 2 produced strong but less complete classification on this dataset. Nested cross-validation achieved a mean ROC AUC of 0.948 ± 0.023 and balanced accuracy of 0.912 ± 0.028. The final Logistic Regression model achieved an AUC of 0.985, balanced accuracy of 0.923, and overall accuracy of 92.2% on 103 locked tumors. It correctly classified 50 of 55 LUAD tumors and 45 of 48 LUSC tumors, and sensitivity was 93.8% and specificity for LUAD was 90.9%. The 95% Wilson interval for overall accuracy was 0.854-0.960, with sensitivity from 0.832-0.979 and specificity from 0.804-0.961.
The difference between the two tasks are most likely connected to the PCA results and ssGSEA analysis. Tumor and normal tissue were separated strongly because cancer development changes many broad biological programs at once, and only a few pathways are needed to make a strong distinction. LUAD and LUSC, however, are both NSCLC lung tumors and therefore share many of those same pathways. Their similarities caused more subtle differences in ssGSEA scores compared to tumor vs. normal and the classes to be less separable on PCA plots.
Logistic Regression Pathways
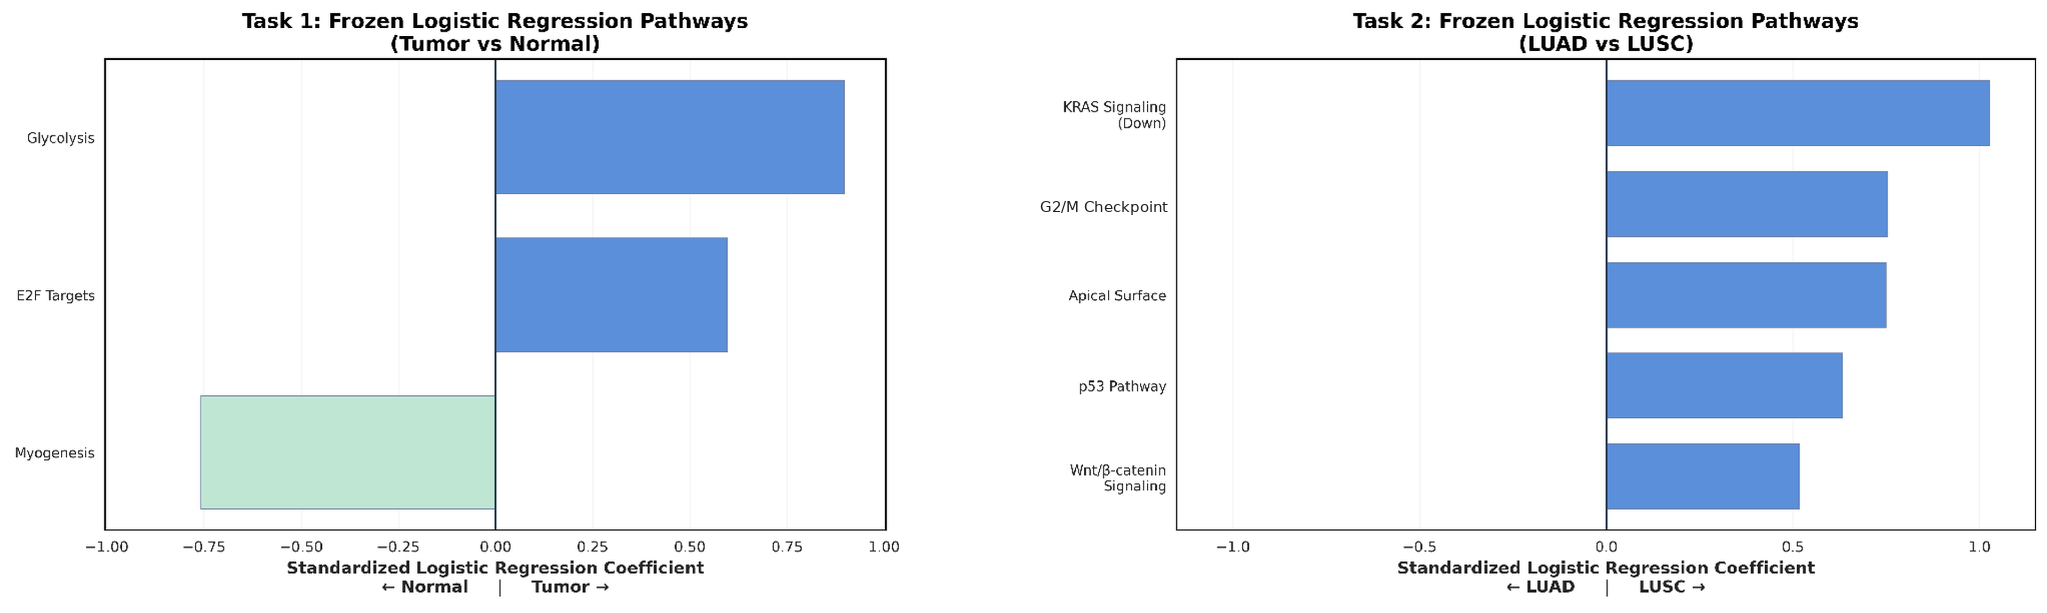
The distinction between tumor and normal samples in Task 1 was most dominated by pathways related to proliferation and metabolism, or processes which control cell growth and energy use. Specifically, Glycolysis showed the strongest positive standardized coefficient, followed by E2F Targets (Figure 4A). Importantly, the positive sign indicates that higher relative activity in these pathways shifts the model toward the first phenotype, or tumor samples, as opposed to normal tissue. Glycolysis is closely related to the altered metabolism commonly seen in cancer cells, while E2F Targets are involved in regulation of the cell cycle through the CDK-RB-E2F pathway24,39. Conversely, Myogenesis presented with a negative coefficient, meaning that higher relative activity in this pathway shifted the model toward normal tissue rather than tumor.
However, the key distinction between LUAD and LUSC was present across a wider combination of pathways. LUSC predictions were associated with higher relative values for KRAS Signaling Down, G2/M Checkpoint, Apical Surface, p53 Pathway, and Wnt/beta-catenin Signaling (Figure 4B). These pathways represent several different biological processes, including epithelial organization, cell-cycle regulation, KRAS-related transcription, cellular stress responses, and developmental signaling instead of a few specific ones like tumor vs. normal35. Interestingly, all five pathways had positive coefficients, meaning that higher normalized pathway values predicted LUSC rather than LUAD.
For Task 2, KRAS Signaling Down and G2/M Checkpoint were the strongest contributors to the LUSC prediction, followed by Apical Surface. The contribution of G2/M Checkpoint is consistent with differences in cell-cycle regulation between the two tumor subtypes, since this pathway helps control whether cells with damaged or incompletely replicated DNA proceed into cell division (Figure 4B). Similarly, KRAS-related signaling is important in lung cancer biology because changes in this pathway can influence cell growth and proliferation. Apical Surface reflects differences in epithelial structure and organization, while the p53 and Wnt/beta-catenin pathways are involved in cellular stress responses, growth, and differentiation35.
The wider range of pathways needed for Task 2 could also explain why LUAD-vs-LUSC classification was more difficult than tumor vs. normal classification. LUAD and LUSC are both lung tumors and share many of the same cancer-related processes, so the model had to use smaller differences to distinguish between them. This is also aligned with the overlap seen in the Task 2 PCA, since it showcases that the classes were not easily separable.
Model Comparison and ROC Analysis
Four machine-learning models were compared within the development data: Logistic Regression, linear Support Vector Machine (SVM), Random Forest, and Extra Trees. The goal of this comparison was to determine whether a more complex nonlinear model was necessary to separate the pathway profiles. AUC measures how well a model ranks the two classes across all possible thresholds, with 1.0 representing perfect separation and 0.5 representing random guessing. Importantly, the differences between the four models were small. This suggests that the pathway data already contained a relatively clear structure and that a complex nonlinear algorithm did not provide a major advantage. Because Logistic Regression performed similarly while also producing directly interpretable coefficients, it remained the final confirmatory model.
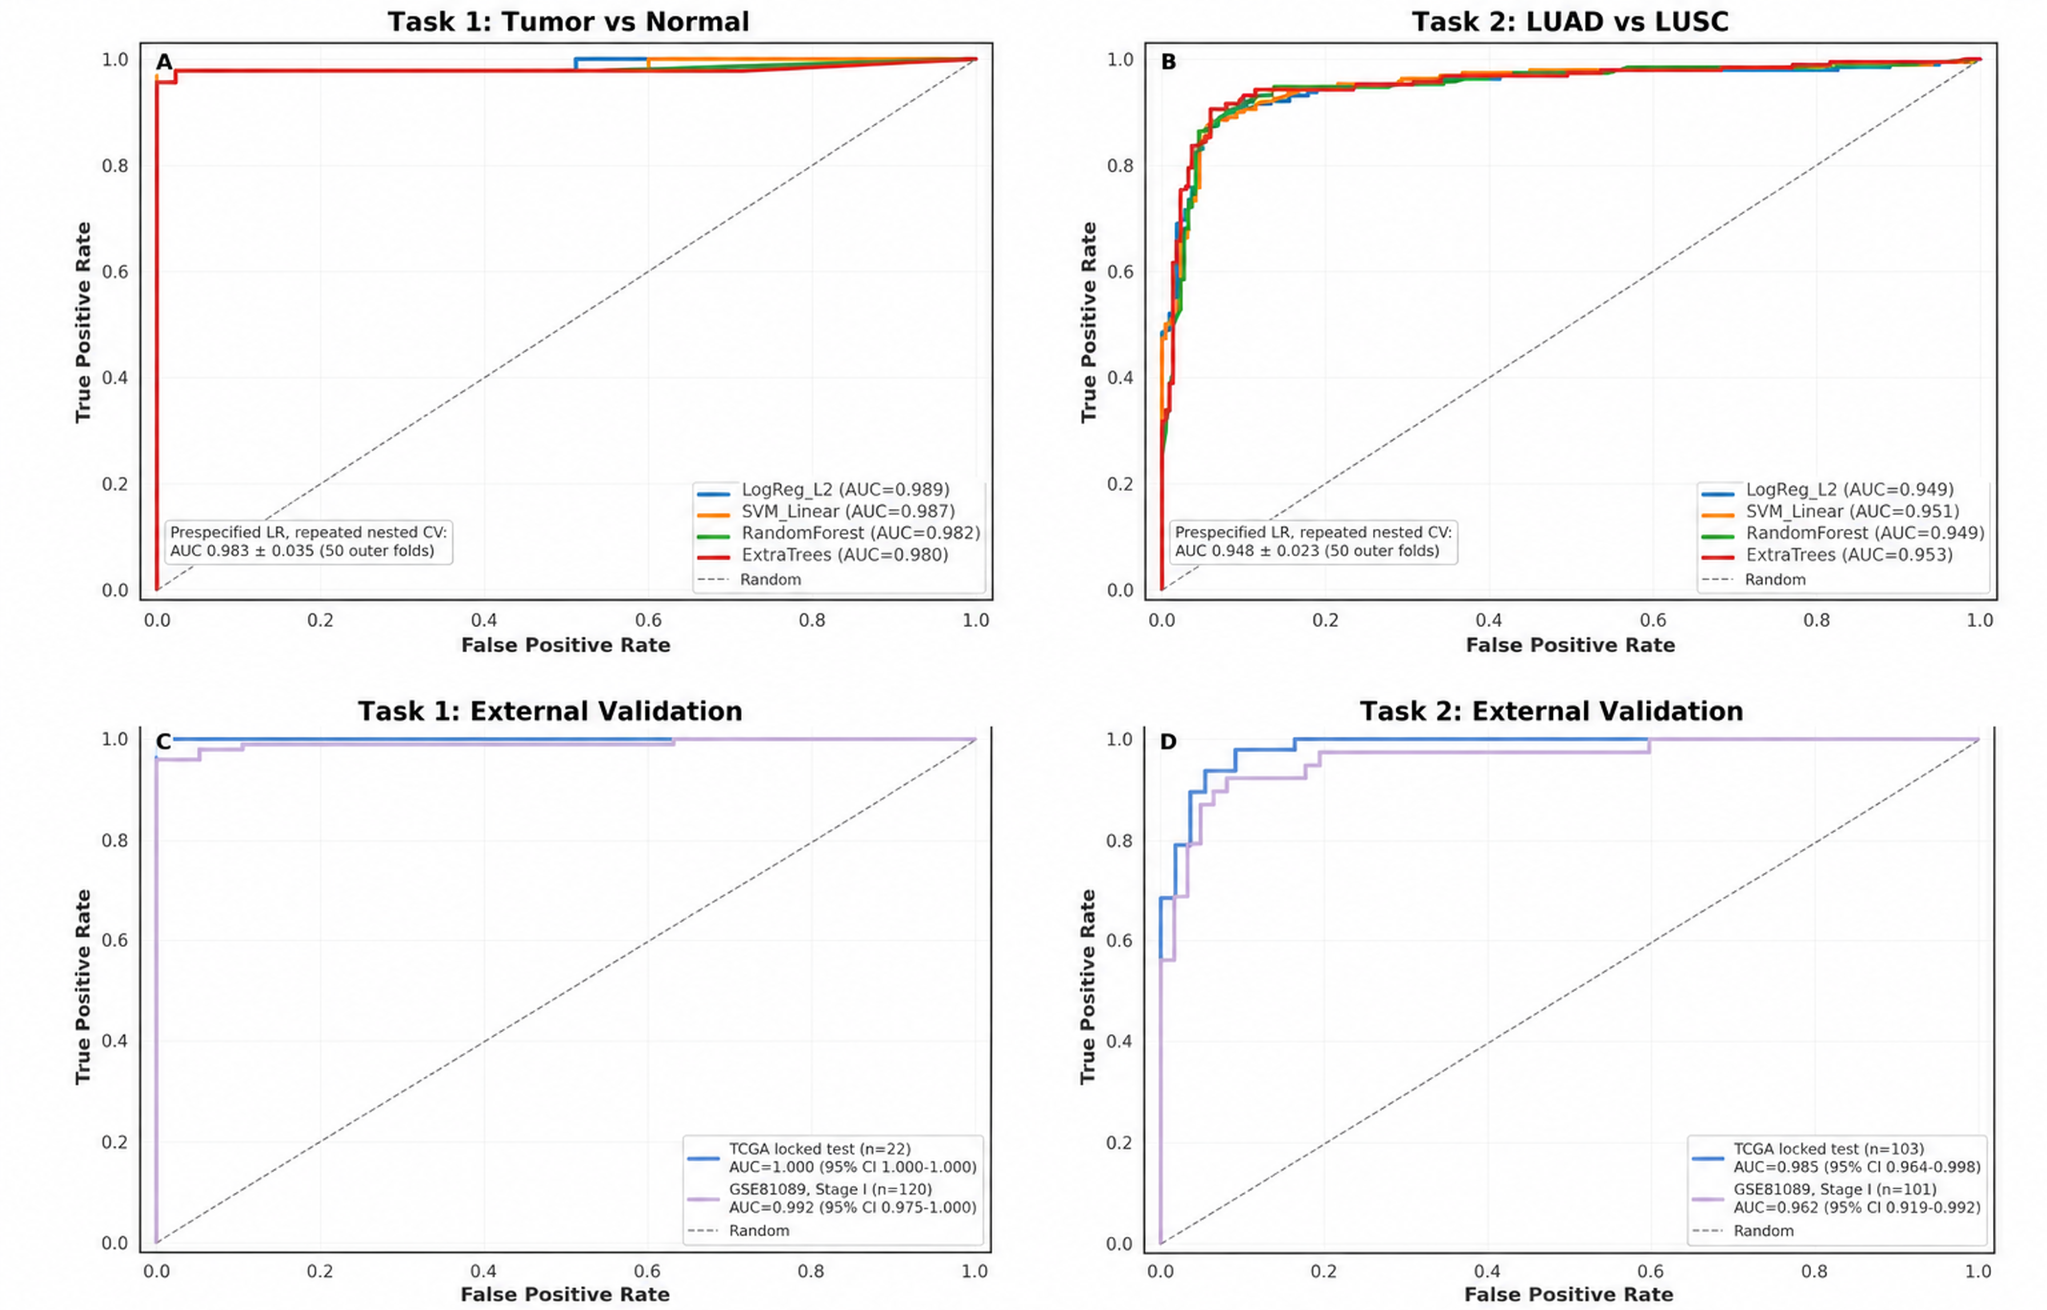
For Task 1 external validation, the TCGA locked-test AUC was 1.000 and the strict Stage I GSE81089 AUC was 0.992 (Figure 5C). For Task 2, the corresponding AUCs were 0.985 internally and 0.962 externally (Figure 5D). The similarity of these AUC values shows that the models preserved strong ranking ability in the independent cohort. However, as shown by the external confusion results, a high AUC did not automatically mean that the same 0.5 threshold worked equally well for both subtypes.
External Validation Results
| Metric | Tumor vs. normal | LUAD vs. LUSC |
|---|---|---|
| Samples | 120 | 101 |
| Patients | 108 | 101 |
| AUC | 0.992 | 0.962 |
| Balanced accuracy | 0.980 | 0.756 |
| Sensitivity | 0.960 | 0.513 |
| Specificity | 1.000 | 1.000 |
External validation was used to determine whether the final TCGA models could still perform on an independent dataset without being retrained. GSE81089 was processed using the same pipeline as detailed in the methods with the probability threshold remaining fixed at 0.5. For Stage I tumor vs. normal classification, the model achieved an AUC of 0.992 ( 0.975-1.000), average precision of 0.999, balanced accuracy of 0.980, and overall accuracy of 96.7% (Figure 5C). All 19 normal samples were classified correctly, while 97 of 101 tumors were detected, producing 96.0% (0.920-0.990) sensitivity and 100% specificity (Table 4). These results strongly support the first part of the research question because the tumor vs. normal pathway signal stayed accurate in an external Stage I tissue cohort.
For Stage I LUAD vs. LUSC classification, the model still achieved a high AUC of 0.962 and average precision of 0.952 and showed that LUSC tumors generally received higher subtype scores than LUAD tumors (Figure 5D). However, the fixed 0.5 threshold did not transfer as well as the overall ranking: all 62 LUAD tumors were classified correctly, but only 20 of 39 LUSC tumors crossed the threshold and were classified as LUSC. This resulted in 81.2% overall accuracy, balanced accuracy of 0.756, LUSC sensitivity of 0.513, and LUAD specificity of 1.000. Therefore, the external data still contained a strong LUAD vs. LUSC pathway signal, but the exact decision cutoff learned from TCGA was less sensitive to LUSC in GSE81089, causing a drop in results (Table 4).
Misclassified Subtype Cases
The eight Task 2 errors included five LUAD tumors that were predicted as LUSC and three LUSC tumors that were predicted as LUAD. When these cases were placed in the PCA space, some appeared in the central region where LUAD and LUSC overlap, while others were positioned closer to the edge of one subtype distribution. This means that the errors occurred in samples whose overall pathway profiles were less clearly separated; there was not a region where the model consistently failed.
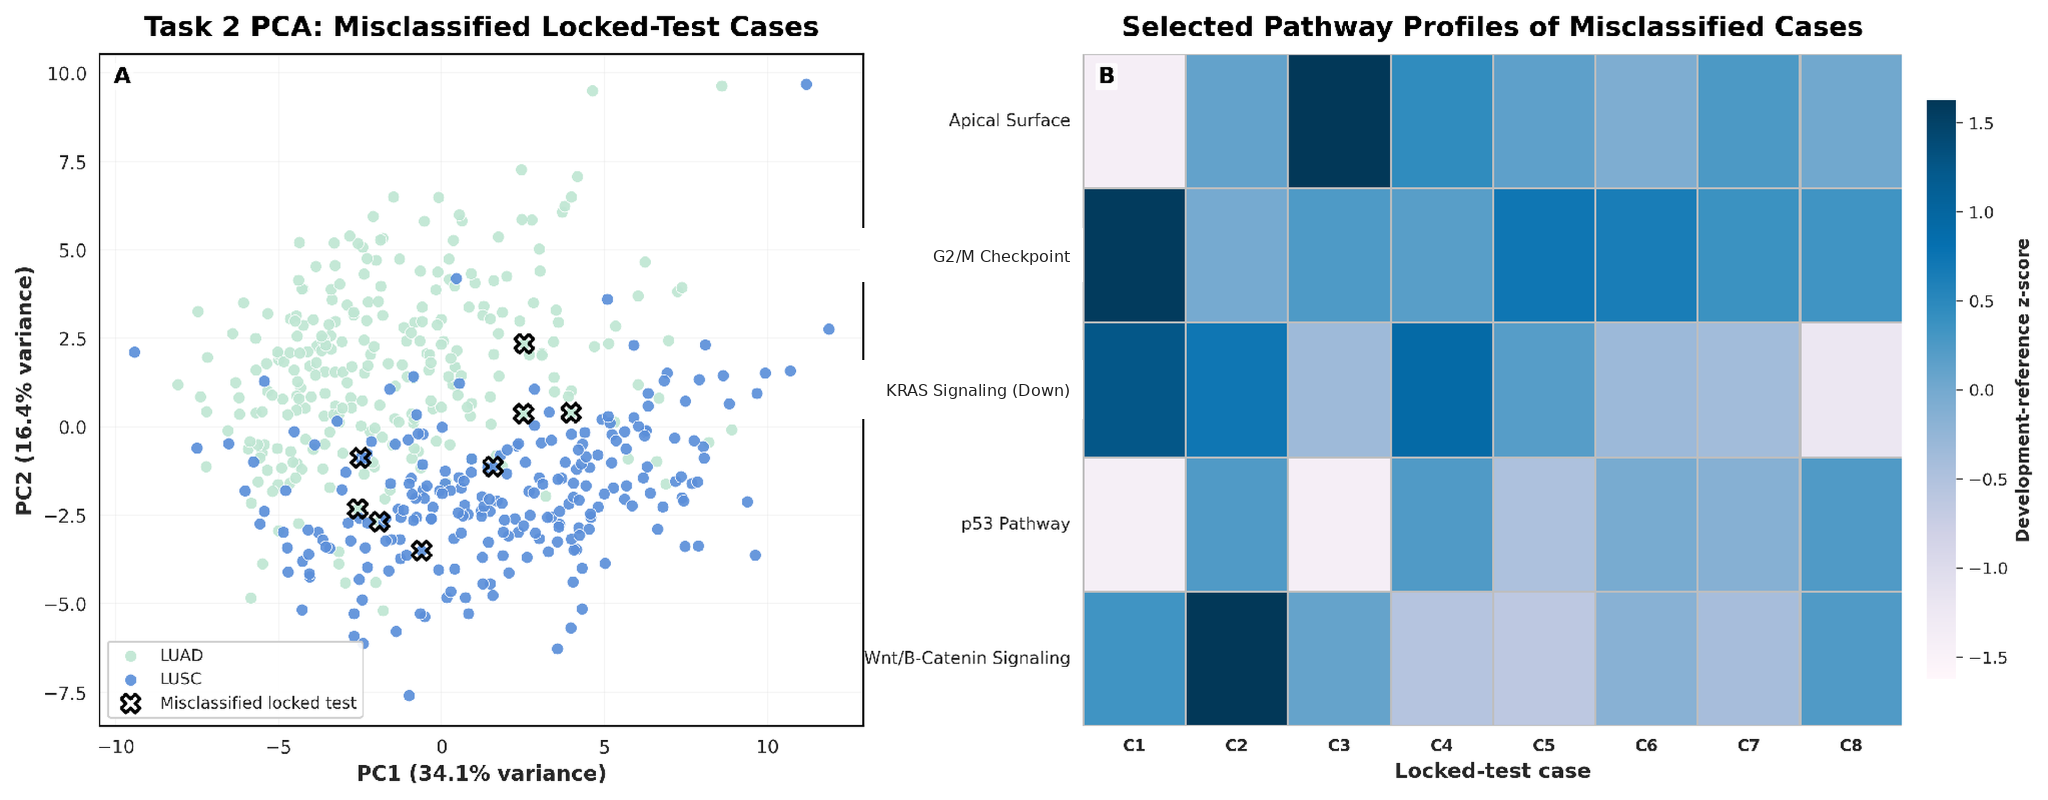
Some cases had relatively high G2/M Checkpoint and KRAS Signaling Down values, while others were more strongly characterized by Apical Surface or Wnt/beta-catenin differences. p53 Pathway activity also varied across the cases (Figure 6B). Therefore, there was no single abnormal pathway that explained all eight errors. Therefore, this group can be described as a heterogeneous cluster of difficult classifications, that may be fixed with training the model on more diverse data.
Discussion
These results indicate that pathway-level RNA-seq scores can be used to distinguish Stage I tumor from normal lung tissue and LUAD from LUSC, supporting the main hypothesis that pathway activity can provide a biologically interpretable representation for lung cancer tissue classification. For Task 1, the repeated nested-CV AUC was 0.983 ± 0.035 and balanced accuracy was 0.989 ± 0.022 and was trained on three pathways (E2F Targets, Glycolysis, and Myogenesis). This is higher compared to the gene-level baseline, or Wu et al.’s study using only genes for classification31. Additionally, the fact that a small pathway set could produce these strong results also supports the idea that the model is capturing coordinated biological actions. However, the locked test contained only 11 matched patients, so the accuracy should still be interpreted with the 95% interval of 0.851-1.000, and a larger set is needed to make more definite claims. The independent GSE81089 results achieved an AUC of 0.992 and balanced accuracy of 0.980. All 19 adjacent normal samples were classified correctly and 97 of 101 tumors were detected. This shows that the tumor vs. normal pathway pattern was not limited to TCGA.
Task 2 was more challenging overall: nested cross-validation resulted in an AUC of 0.948 ± 0.023 and balanced accuracy of 0.912 ± 0.028, and the frozen model achieved an AUC of 0.985 and balanced accuracy of 0.923 on 103 locked tumors after being trained on data relating to Apical Surface, G2/M Checkpoint, KRAS Signaling Down, p53 Pathway, and Wnt/beta-catenin Signaling. While Chen and Dhahbi required a 17-gene panel to achieve 92.9% classification accuracy, this model was able to achieve a similarly strong result with only five features13. This suggests that pathway aggregation may provide a more interpretable version of LUAD-LUSC differences. External subtype validation showed the same overall idea, but showed a decrease in balanced accuracy to 0.756 because only 20 of 39 LUSC tumors were classified as LUSC at the fixed 0.5 threshold, while all 62 LUAD tumors were classified correctly. This means the exact probability cutoff for LUAD vs. LUSC discrimination did not transfer as well. Therefore, the current threshold is not ready for clinical utility.
Implications
These results may help address the fact that gene-expression datasets contain thousands of individual measurements, which can make it difficult to identify the biological patterns that could separate cancer types. The pathway-based approach could be a way to organize this information and allow the machine-learning model to be interpreted by whether processes contribute to a prediction. The results therefore suggest that useful predictive information can be represented at the pathway level in a form that is both lower-dimensional and biologically interpretable.
The potential impacts of these results are promising, but need further validation. The strong tissue-classification results warrant additional testing of pathway scores as candidate molecular features in independent, clinically matched cohorts. It is important to highlight, however, that machine learning should not be standalone. There are inherent biases with computational prediction that must be verified with other, experimental methods. Instead, a possible future role could be as molecular support for existing histopathology, where pathway-level information may provide an additional source of evidence when morphology is uncertain. The current study used retrospective tissue RNA-seq from patients with known pathology and the subtype model was not tested specifically on indeterminate small biopsies, which are the clinical situations where additional molecular information may be most useful.
Limitations
This study has several limitations in its dataset and methodology. The Task 1 locked test was small, containing only 22 samples from 11 matched patients with a 95% accuracy interval range from 0.851-1.000. Therefore, the estimate should not be interpreted as the exact performance expected in a larger population, and additional cohorts besides the GSE81089 should also be tested to validate the results.
Additionally, methylation data overall resulted in weak signals from the GSEA pipeline presented in this study. This pipeline utilized a three step process. Illumina EPIC array data was processed from raw IDAT files into probe-level β values and then M values40. Next, CpG probes were mapped to genes using the hg38 EPIC annotation, averaged to create gene-level methylation profiles. Once the mapping was complete, data was written into GCT and CLS format for GSEA. Unfortunately, genes were sparse between the pathway and ranked list, and no meaningful information or enrichment score was generated from analysis. The methylation-derived features were not used for ssGSEA or machine learning analysis.
These results may have represented limitations in applying an analysis framework that was developed primarily for gene-expression data to methylation measurements. Methylation effects often occur at specific regulatory regions, like CpG islands41,42, that may not be captured effectively from broad Hallmark pathways. Relatively few of the genes in the methylation-derived ranked list overlapped with the Hallmark gene sets which were used in the study.
Additionally, the fact that only Hallmark gene sets were used for analysis may have limited statistical power and may not capture all subtype-specific biological mechanisms. In addition, with any machine learning algorithm, many measures such as cross-validation and group-safe splitting were taken to reduce the risk of overfitting. Results were also verified by external validation, but the drop in performance between the internal and external dataset indicates that more diverse and balanced data is required to ensure the model is generalizable to multiple cohorts. There is still always a chance of overfitting, which may have inflated the results. Importantly, while associations align with prior literature, the study does not, nor is it meant to, establish causal relationships between pathways and tumor subtypes.
Future Work
Future work should first test the same pipeline in another independent cohort to determine whether the strong tumor vs. normal performance and the subtype ranking seen in GSE81089 are consistent across another dataset type. Once this is conducted, testing the model directly in more ambiguous lung samples could help refine NSCLC subtyping where morphology and immunohistochemistry currently struggle. Another future direction could be to determine whether the same pathway signals can be measured from a non-tissue source, namely cell-free RNA. This would be useful for early and non-invasive detection of NSCLC, as it does not rely on biopsies for analysis. Additionally, since the methylation analysis was unsuccessful for this study, future work could test other ways to represent methylation or add a more multi-omics feature to the current model, to see whether it improves the LUAD vs. LUSC classification.
Overall, the pathway-based machine learning approach offers a compact and biologically interpretable representation of RNA-seq data for Stage I lung tissue classification.
References
- Centers for Disease Control and Prevention. Types of lung cancer. https://www.cdc.gov/united-states-cancer-statistics/publications/lung-cancer-types.html. 2025. [↩]
- E. J. Ostrin, D. Sidransky, A. Spira, S. M. Hanash. Biomarkers for lung cancer screening and detection. Cancer Epidemiology, Biomarkers & Prevention. Vol. 29, pg. 2411–2415, 2020, https://doi.org/10.1158/1055-9965.EPI-20-0865. [↩] [↩] [↩] [↩]
- A. Suhail, C. E. Crocker, B. Das, J. I. Payne, D. Manos. Initial presentation of lung cancer in the emergency department: a descriptive analysis. CMAJ Open. Vol. 7, pg. E117–E123, 2019, https://doi.org/10.9778/cmajo.20180061. [↩] [↩]
- U.S. Preventive Services Task Force. Screening for lung cancer: US Preventive Services Task Force recommendation statement. JAMA. Vol. 325, pg. 962–970, 2021, https://doi.org/10.1001/jama.2021.1117. [↩] [↩]
- G. Lyons, S. Quadrelli, C. Silva, K. Vera, A. Iotti, J. Venditti, J. Chertcoff, D. Chimondeguy. Analysis of survival in 400 surgically resected non-small cell lung carcinomas: towards a redefinition of the T factor. Journal of Thoracic Oncology. Vol. 3, pg. 989–993, 2008, https://doi.org/10.1097/JTO.0b013e3181838b19. [↩] [↩]
- X. Zhao, R.-B. Han, J. Zhao, J. Wang, F. Yang, W. Zhong, L. Zhang, L.-Y. Li, M.-Z. Wang. Comparison of epidermal growth factor receptor mutation statuses in tissue and plasma in stage I–IV non-small cell lung cancer patients. Respiration. Vol. 85, pg. 119–125, 2013, https://doi.org/10.1159/000338790. [↩] [↩]
- The Cancer Genome Atlas Research Network. Comprehensive genomic characterization of squamous cell lung cancers. Nature. Vol. 489, pg. 519–525, 2012, https://doi.org/10.1038/nature11404. [↩] [↩]
- Z. Zang, D. A. Dorward, K. E. Quiohilag, A. D. J. Wood, J. R. Hopgood, A. R. Akram, Q. Wang. Label-free pathological subtyping of non-small cell lung cancer using deep classification and virtual immunohistochemical staining. npj Digital Medicine. Vol. 9, pg. 438, 2026, https://doi.org/10.1038/s41746-026-02557-x. [↩]
- W. D. Travis, E. Brambilla, M. Noguchi, A. G. Nicholson, K. Geisinger, Y. Yatabe, Y. Ishikawa, I. Wistuba, D. B. Flieder, W. Franklin, A. Gazdar, P. S. Hasleton, D. W. Henderson, K. M. Kerr, I. Petersen, V. Roggli, E. Thunnissen, M. Tsao. Diagnosis of lung cancer in small biopsies and cytology: implications of the 2011 IASLC/ATS/ERS classification. Archives of Pathology & Laboratory Medicine. Vol. 137, pg. 668–684, 2013, https://doi.org/10.5858/arpa.2012-0263-RA. [↩] [↩] [↩] [↩]
- M. Reck, F. Barlesi, L. Crino, C. I. Henschke, D. Isla, S. Stiebeler, D. R. Spigel. Predicting and managing the risk of pulmonary haemorrhage in patients with NSCLC treated with bevacizumab: a consensus report from a panel of experts. Annals of Oncology. Vol. 23, pg. 1111–1120, 2012, https://doi.org/10.1093/annonc/mdr463. [↩]
- M. F. Zakowski, N. Rekhtman, M. Auger, C. N. Booth, B. Crothers, M. Ghofrani, W. Khalbuss, R. Laucirica, A. T. Moriarty, Z. L. Tabatabai, G. A. Barkan. Morphologic accuracy in differentiating primary lung adenocarcinoma from squamous cell carcinoma in cytology specimens. Archives of Pathology & Laboratory Medicine. Vol. 140, pg. 1116–1120, 2016, https://doi.org/10.5858/arpa.2015-0316-OA. [↩] [↩]
- L. J. Layfield, L. Pearson, B. S. Walker, S. K. White, R. L. Schmidt. Diagnostic accuracy of fine-needle aspiration cytology for discrimination of squamous cell carcinoma from adenocarcinoma in non-small cell lung cancer: a systematic review and meta-analysis. Acta Cytologica. Vol. 62, pg. 318–326, 2018, https://doi.org/10.1159/000493942. [↩] [↩]
- J. W. Chen, J. M. Dhahbi. Lung adenocarcinoma and lung squamous cell carcinoma cancer classification, biomarker identification, and gene expression analysis using overlapping feature selection methods. Scientific Reports. Vol. 11, pg. 13323, 2021, https://doi.org/10.1038/s41598-021-92725-8. [↩] [↩] [↩]
- The Cancer Genome Atlas Research Network. Comprehensive molecular profiling of lung adenocarcinoma. Nature. Vol. 511, pg. 543–550, 2014, https://doi.org/10.1038/nature13385. [↩]
- L. Osmani, F. Askin, E. Gabrielson, Q. K. Li. Current WHO guidelines and the critical role of immunohistochemical markers in the subclassification of non-small cell lung carcinoma (NSCLC): moving from targeted therapy to immunotherapy. Seminars in Cancer Biology. Vol. 52, pg. 103–109, 2018, https://doi.org/10.1016/j.semcancer.2017.11.019. [↩]
- T. Kolb, S. Müller, P. Möller, T. F. E. Barth, R. Marienfeld. Molecular heterogeneity in histomorphologic subtypes of lung adeno carcinoma represents a challenge for treatment decision. Neoplasia. Vol. 49, pg. 100955, 2024, https://doi.org/10.1016/j.neo.2023.100955. [↩]
- V. Kanchustambham, S. Sharma. Lung adenocarcinoma. StatPearls [Internet]. StatPearls Publishing, 2026. https://www.ncbi.nlm.nih.gov/books/NBK519578/. [↩]
- S. Dogan, R. Shen, D. C. Ang, M. L. Johnson, S. P. D’Angelo, P. K. Paik, E. B. Brzostowski, G. J. Riely, M. G. Kris, M. F. Zakowski, M. Ladanyi. Molecular epidemiology of EGFR and KRAS mutations in 3,026 lung adenocarcinomas: higher susceptibility of women to smoking-related KRAS-mutant cancers. Clinical Cancer Research. Vol. 18, pg. 6169–6177, 2012, https://doi.org/10.1158/1078-0432.CCR-11-3265. [↩]
- N. Yamaguchi, P. A. VanderLaan, E. Folch, D. H. Boucher, H. M. Canepa, M. S. Kent, S. P. Gangadharan, A. Majid, O. N. Kocher, M. A. Goldstein, M. S. Huberman, D. B. Costa. Smoking status and self-reported race affect the frequency of clinically relevant oncogenic alterations in non-small-cell lung cancers at a United States-based academic medical practice. Lung Cancer. Vol. 82, pg. 31–37, 2013, https://doi.org/10.1016/j.lungcan.2013.07.013. [↩]
- E. Dama, T. Colangelo, E. Fina, M. Cremonesi, M. Kallikourdis, G. Veronesi, R. Cuttano, F. Bianchi. Biomarkers and lung cancer early detection: state of the art. Cancers. Vol. 13, pg. 3919, 2021, https://doi.org/10.3390/cancers13153919. [↩]
- Z. Gandhi, P. Gurram, B. Amgai, S. P. Lekkala, A. Lokhandwala, S. Manne, A. Mohammed, H. Koshiya, N. Dewaswala, R. Desai, H. Bhopalwala, S. Ganti, S. Surani. Artificial intelligence and lung cancer: impact on improving patient outcomes. Cancers. Vol. 15, pg. 5236, 2023, https://doi.org/10.3390/cancers15215236. [↩] [↩]
- F. Moretti, P. D’Antona, E. Finardi, M. Barbetta, L. Dominioni, A. Poli, E. Gini, D. M. Noonan, A. Imperatori, N. Rotolo, M. Cattoni, P. Campomenosi. Systematic review and critique of circulating miRNAs as biomarkers of stage I–II non-small cell lung cancer. Oncotarget. Vol. 8, pg. 94980–94996, 2017, https://doi.org/10.18632/oncotarget.21739. [↩]
- A. Subramanian, P. Tamayo, V. K. Mootha, S. Mukherjee, B. L. Ebert, M. A. Gillette, A. Paulovich, S. L. Pomeroy, T. R. Golub, E. S. Lander, J. P. Mesirov. Gene set enrichment analysis: a knowledge-based approach for interpreting genome-wide expression profiles. Proceedings of the National Academy of Sciences. Vol. 102, pg. 15545–15550, 2005, https://doi.org/10.1073/pnas.0506580102. [↩] [↩] [↩]
- D. Hanahan. Hallmarks of cancer: new dimensions. Cancer Discovery. Vol. 12, pg. 31–46, 2022, https://doi.org/10.1158/2159-8290.CD-21-1059. [↩] [↩]
- R. Clarke, H. W. Ressom, A. Wang, J. Xuan, M. C. Liu, E. A. Gehan, Y. Wang. The properties of high-dimensional data spaces: implications for exploring gene and protein expression data. Nature Reviews Cancer. Vol. 8, pg. 37–49, 2008, https://doi.org/10.1038/nrc2294. [↩] [↩] [↩]
- X. Xie, G. Chen, W. Song. Analysis of immune subtypes in non-small-cell lung cancer based on TCGA database. Medicine. Vol. 102, pg. e33686, 2023, https://doi.org/10.1097/MD.0000000000033686. [↩] [↩] [↩]
- N. Li, J. Wang, X. Zhan. Identification of immune-related gene signatures in lung adenocarcinoma and lung squamous cell carcinoma. Frontiers in Immunology. Vol. 12, pg. 752643, 2021, https://doi.org/10.3389/fimmu.2021.752643. [↩] [↩] [↩]
- D. Bzdok, M. Krzywinski, N. Altman. Machine learning: supervised methods. Nature Methods. Vol. 15, pg. 5–6, 2018, https://doi.org/10.1038/nmeth.4551. [↩] [↩]
- Y. Xie, W.-Y. Meng, R.-Z. Li, Y.-W. Wang, X. Qian, C. Chan, Z.-F. Yu, X.-X. Fan, H.-D. Pan, C. Xie, Q.-B. Wu, P.-Y. Yan, L. Liu, Y.-J. Tang, X.-J. Yao, M.-F. Wang, E. L.-H. Leung. Early lung cancer diagnostic biomarker discovery by machine learning methods. Translational Oncology. Vol. 14, pg. 100907, 2021, https://doi.org/10.1016/j.tranon.2020.100907. [↩]
- A.-C. Haury, P. Gestraud, J.-P. Vert. The influence of feature selection methods on accuracy, stability and interpretability of molecular signatures. PLoS ONE. Vol. 6, pg. e28210, 2011, https://doi.org/10.1371/journal.pone.0028210. [↩] [↩]
- D. Wu, C. Liu, L. Zhan, M. Liang, Q. Li, Q. Lian. Integrative single-cell and spatial transcriptomics analysis reveals a baicalein-responsive 10-gene signature for non-small cell lung cancer. Translational Oncology. Vol. 70, pg. 102853, 2026, https://doi.org/10.1016/j.tranon.2026.102853. [↩] [↩]
- National Cancer Institute Genomic Data Commons. Sample type codes. https://gdc.cancer.gov/resources-tcga-users/tcga-code-tables/sample-type-codes. n.d. [↩]
- Y. Zhao, M.-C. Li, M. M. Konate, L. Chen, B. Das, C. Karlovich, P. M. Williams, J. Evrard, J. H. Doroshow, L. M. McShane. TPM, FPKM, or normalized counts? A comparative study of quantification measures for the analysis of RNA-seq data from the NCI patient-derived models repository. Journal of Translational Medicine. Vol. 19, pg. 269, 2021, https://doi.org/10.1186/s12967-021-02936-w. [↩]
- A. Conesa, P. Madrigal, S. Tarazona, D. Gomez-Cabrero, A. Cervera, A. McPherson, M. W. Szcześniak, D. J. Gaffney, L. L. Elo, X. Zhang, A. Mortazavi. A survey of best practices for RNA-seq data analysis. Genome Biology. Vol. 17, pg. 13, 2016, https://doi.org/10.1186/s13059-016-0881-8. [↩]
- A. Liberzon, C. Birger, H. Thorvaldsdottir, M. Ghandi, J. P. Mesirov, P. Tamayo. The Molecular Signatures Database Hallmark gene set collection. Cell Systems. Vol. 1, pg. 417–425, 2015, https://doi.org/10.1016/j.cels.2015.12.004. [↩] [↩] [↩]
- D. A. Barbie, P. Tamayo, J. S. Boehm, S. Y. Kim, S. E. Moody, I. F. Dunn, A. C. Schinzel, P. Sandy, E. Meylan, C. Scholl, S. Fröhling, E. M. Chan, M. L. Sos, K. Michel, C. Mermel, S. J. Silver, B. A. Weir, J. H. Reiling, Q. Sheng, P. B. Gupta, R. C. Wadlow, H. Le, S. Hoersch, B. S. Wittner, S. Ramaswamy, D. M. Livingston, D. M. Sabatini, M. Meyerson, R. K. Thomas, E. S. Lander, J. P. Mesirov, D. E. Root, D. G. Gilliland, T. Jacks, W. C. Hahn. Systematic RNA interference reveals that oncogenic KRAS-driven cancers require TBK1. Nature. Vol. 462, pg. 108–112, 2009, https://doi.org/10.1038/nature08460. [↩]
- D. Djureinovic, B. M. Hallström, M. Horie, J. S. M. Mattsson, L. La Fleur, L. Fagerberg, H. Brunnström, C. Lindskog, K. Madjar, J. Rahnenführer, S. Ekman, E. Ståhle, H. Koyi, E. Brandén, K. Edlund, J. G. Hengstler, M. Lambe, A. Saito, J. Botling, F. Pontén, M. Uhlén, P. Micke. Profiling cancer testis antigens in non-small-cell lung cancer. JCI Insight. Vol. 1, pg. e86837, 2016, https://doi.org/10.1172/jci.insight.86837. [↩]
- National Center for Biotechnology Information. Gene Expression Omnibus accession GSE81089. https://www.ncbi.nlm.nih.gov/geo/query/acc.cgi?acc=GSE81089. 2016. [↩]
- L. N. Kent, G. Leone. The broken cycle: E2F dysfunction in cancer. Nature Reviews Cancer. Vol. 19, pg. 326–338, 2019, https://doi.org/10.1038/s41568-019-0143-7. [↩]
- P. Du, X. Zhang, C.-C. Huang, N. Jafari, W. A. Kibbe, L. Hou, S. M. Lin. Comparison of beta-value and M-value methods for quantifying methylation levels by microarray analysis. BMC Bioinformatics. Vol. 11, pg. 587, 2010, https://doi.org/10.1186/1471-2105-11-587. [↩]
- P. H. Hoang, M. T. Landi. DNA methylation in lung cancer: mechanisms and associations with histological subtypes, molecular alterations, and major epidemiological factors. Cancers. Vol. 14, pg. 961, 2022, https://doi.org/10.3390/cancers14040961. [↩]
- D. Jjingo, A. B. Conley, S. V. Yi, V. V. Lunyak, I. K. Jordan. On the presence and role of human gene-body DNA methylation. Oncotarget. Vol. 3, pg. 462–474, 2012, https://doi.org/10.18632/oncotarget.497. [↩]