
Abstract
In employer-employee relationships in professional basketball, teams seek to balance player compensation with on-court performance outcomes. This study examines the ‘efficient wage’ hypothesis in the National Basketball Association (NBA) by analyzing the relationship between team salary expenditures and team-level performance outcomes in terms of points per game, field goal percentage, and win percentage. The results show that higher team salaries are associated with greater offensive output, measured by points scored, but do not exhibit a statistically significant relationship with shooting efficiency or win percentage once pace of play is accounted for. Salary and performance data from Spotrac.com, nba.com, and basketball-reference.com, were combined at the season and team level to analyze the relationship using linear regression analysis. Because team performance can be defined using many different metrics, the results are limited to a small set of commonly used performance measures. The study contributes to the literature by focusing on team-level NBA data from the modern 2011–2023 era.
Keywords: Basketball, National Basketball Association, Salary Cap, Luxury Tax, Payroll
Introduction
The creation of the National Basketball Association in 1949 provided basketball players with an avenue to pursue their dreams. Throughout many years, the league has fostered a community of talented players, avid fans, devout coaching staff, and a true passion for the sport in all of those people. Regardless of how an individual interacts with the NBA, of chief importance is still the performance of their favorite team or even favorite player. People want their teams to be able to spend money on the top-level athletes in order to advance their teams. Consequently, there are noticeably more fans of large market teams like the New York Knicks and Boston Celtics. However, smaller teams and their fans pushed for more competitive balance throughout the league, leading to the implementation of the salary cap and luxury tax. Many studies exist with variety in their commentary on the effectiveness of the salary cap. For example, Fort and Quirk (1995)1 argue that the salary cap increases competitive balance whereas Totty and Owens (2011)2 find the complete opposite. Despite these conflicting studies, the basis of a salary cap still uses the assumption that more money brings stronger teams. Determining the true impact of paying high salaries will confirm or challenge that assumption, which is what this paper aims to do.
An empirical analysis was conducted by using performance statistics from various sources and data on total team salaries from the 2011 to 2023 NBA seasons. Correlations and linear regressions with possessions per game as the control variable were performed and utilized to analyze how the team salary affects team performance. Relevant literature explores topics of pay versus performance as in Simmons and Berri (2011)3 and Stiroh (2007)4, though only focuses on the individual athlete. These papers discuss player performance in regards to pay dispersion and multi-year contracts respectively, and both papers utilize data prior to 2009 for their research. This paper, on the other hand, investigates how the importance of money in terms of the team performance changes over the more recent time frame from 2011-2023. In other words, does the salary of a team positively or negatively change its overall performance in the league?
Literature Review
This study is informed by two primary bodies of literature. The first examines the effects of salary cap and luxury tax policies on competitive balance in professional sports leagues, particularly the National Basketball Association (NBA). The second explores the relationship between compensation and performance, primarily at the individual player level. Together, these literatures provide important theoretical foundations while also revealing gaps that motivate the present analysis.
The NBA was the first major North American professional sports league to implement a salary cap, beginning in the 1984–1985 season, with the stated objective of promoting competitive balance. The underlying rationale for such policies is that unrestricted spending by wealthier franchises allows them to acquire disproportionate talent advantages, thereby reducing parity and fan interest. By limiting team payrolls, salary caps are intended to equalize purchasing power and foster a more competitive league environment.
Empirical evidence on the effectiveness of salary caps, however, remains mixed. Fort and Quirk (1995)5 argue that salary caps can enhance competitive balance when they are strictly enforced, emphasizing that such policies may also shift surplus from players to teams. In contrast, Totty and Owens (2011)2 find that the NBA salary cap reduced competitive balance when measured by the dispersion of team win percentages, observing greater variance between top- and bottom-performing teams following the cap’s implementation. These conflicting findings highlight the sensitivity of competitive balance conclusions to both measurement choices and institutional assumptions.
Additional studies further complicate the evaluation of payroll constraints. Vrooman (2000)6 contends that salary caps may contribute to imbalance by allowing leagues to maximize profits while talent sorts across teams based on non-financial factors such as market size or championship prospects. Similarly, Szymanski (2003)7 argues that caps may fail to achieve parity if smaller-market teams do not fully utilize available payroll space. In response to these limitations, Totty and Owens (2011)8 and others emphasize revenue-sharing mechanisms as a potentially more effective tool for promoting balance.
The NBA’s soft salary cap structure, which permits numerous exceptions, led to the introduction of a luxury tax in 2001 as an additional constraint on excessive spending. Louchheim (2018)9 finds evidence of improved parity during the 2003–2012 period, though also notes that sustained luxury tax payments are associated with renewed talent concentration. Dietl et al. (2010)10 similarly conclude that luxury taxes can enhance competitive balance within a game-theoretic framework. Collectively, this literature suggests that policy outcomes depend critically on enforcement, metric selection, and broader league context11,12,13,14,15. Importantly, many of these studies rely on data from earlier eras, limiting their applicability to the modern NBA.
A second strand of research investigates the relationship between compensation and performance, primarily at the player level. While existing research shows that individual pay-performance relationships have been widely studied, there is substantially less evidence linking aggregate team salary to team-level outcomes. Simmons and Berri (2011) distinguish between justified and unjustified pay inequality in the NBA, finding that productivity-based disparities are associated with improved performance, consistent with tournament theory. In contrast, unjustified inequality does not consistently reduce output, suggesting that equal pay structures do not necessarily enhance performance.
Related studies highlight the difficulty of causal interpretation in pay-performance relationships. Stiroh (2007)4 finds that player performance improves prior to contract renewal and declines afterward, implying that compensation may reflect past performance rather than induce sustained effort. Evidence from other leagues is similarly mixed: Hall et al. (2002)16 and Shorin (2017)17 document positive associations between payroll and performance across major U.S. sports leagues, while Gasparetto & Thadeu (2012)18 find a relationship between wages and scoring in Brazilian football. Variation across sports and time periods underscores the importance of examining the NBA specifically in the contemporary era.
While prior studies show that salary allocation correlates with team performance across leagues19,20,21, their reliance on observational data and average treatment effects limits causal inference and may obscure heterogeneity across teams and seasons. More broadly, much of the existing literature predates substantial changes to the NBA’s collective bargaining framework and does not directly assess team-level spending in the modern institutional environment.
Since the early 2010s, the NBA has adopted increasingly complex payroll mechanisms, including graduated luxury taxes, repeater penalties, and multiple salary “aprons”22,23. These changes have altered the strategic tradeoffs teams face when allocating payroll resources. As a result, it remains unclear whether higher team salary expenditures in the modern NBA translate into improved offensive efficiency, increased scoring output, or greater competitive success.
This study addresses that gap by analyzing team-season data from 2011 to 2023, focusing explicitly on team-level salary expenditures and multiple performance metrics. Total base salaries are used as the primary measure of team spending to reduce endogeneity arising from performance-based bonuses and to avoid distortions associated with contract structures designed to manipulate salary cap accounting. By focusing on base salaries, the analysis facilitates more consistent comparisons across teams and seasons, while providing a foundation for future research on alternative compensation measures and contract structures.
Methodology
This study employs a quantitative research design using team-level data from the National Basketball Association (NBA) spanning the 2011–2012 through 2023–2024 regular seasons. Salary and performance data were obtained from multiple sources, including Spotrac, Basketball-Reference, and the official NBA statistics website. Player base salary data from Spotrac was aggregated to calculate total team base salary for each of the 30 NBA teams in each season. Performance statistics, including points per game, field goal percentage, and possessions per game, were obtained from Basketball-Reference, while team win percentage and standings information were sourced from NBA.com. All data were recorded at the team-season level.
The dataset consists of annual observations aggregated by team and season, yielding a panel structure. To analyze the relationship between team salary expenditures and performance outcomes, the data were examined using correlation analysis and ordinary least squares (OLS) regression. To account for league-wide time trends and avoid spurious correlations driven by common upward movements in salaries and offensive output over time, regressions were estimated separately for each season, effectively incorporating time fixed effects. Team fixed effects were not included, allowing for cross-sectional variation in performance outcomes across teams within each season.
Team performance was measured using three commonly employed metrics: points per game (PPG), field goal percentage (FG%), and win percentage. The above metrics were selected because they capture broad factors of team quality. Points per game represents the average number of points scored per game over the course of an entire regular season, serving as a season-level measure of offensive output. Field goal percentage captures shooting efficiency and is comparable across eras, while win percentage reflects overall competitive success. Total team base salary was used as the primary independent variable in all analyses. All regressions include possessions per game as a control variable to account for differences in pace of play across teams. Formally, the baseline regression is shown in Equation (1) below:
yit=β1,tSalaryit+β2,tPaceit+β0,t+εit
where i indexes teams, t indexes seasons, yit represents the team-season performance outcome of interest (points per game, field goal percentage, or win percentage), Salaryit denotes total team base salary, Paceit represents average possessions per game when applicable, and εit is the error term. The coefficient β1,t captures the association between team salary expenditures and performance outcomes in season t.
Statistical significance was evaluated using conventional p-value thresholds. The analysis does not attempt to estimate causal effects; instead, it identifies associations between salary expenditures and performance outcomes. It is also possible that other factors such as injuries, coaching changes, and roster continuity may influence results, but they are not explicitly accounted for in this study.
Results
This section presents the empirical findings of the study. The results are organized into three parts. First, descriptive trends in league-wide performance and salary levels are presented. Second, correlation analyses between team salary and performance metrics are reported. Third, linear regression results are summarized to evaluate the strength and statistical significance of the observed relationships. Interpretation and broader implications are reserved for the Discussion section.
Descriptive Trends in Salary and Performance
Across the 2011–2012 through 2023–2024 NBA seasons, both offensive output and team salary expenditures increased substantially. Average points per game rose steadily, alongside increased three-point shooting, reflecting a league-wide shift toward perimeter-oriented offenses (Figure 1). Over the same period, inflation-adjusted team salary expenditures more than doubled (Figure 2). These parallel trends motivate the use of season-specific regression analyses to avoid spurious correlations driven by common time trends.
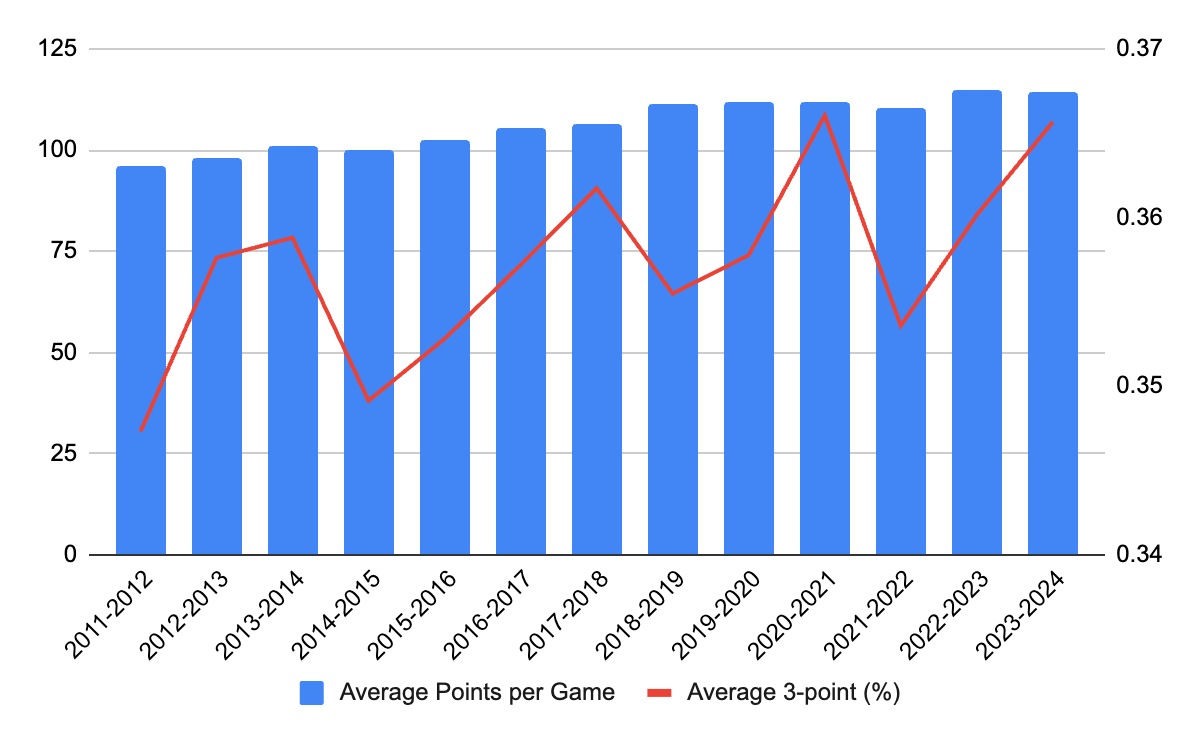
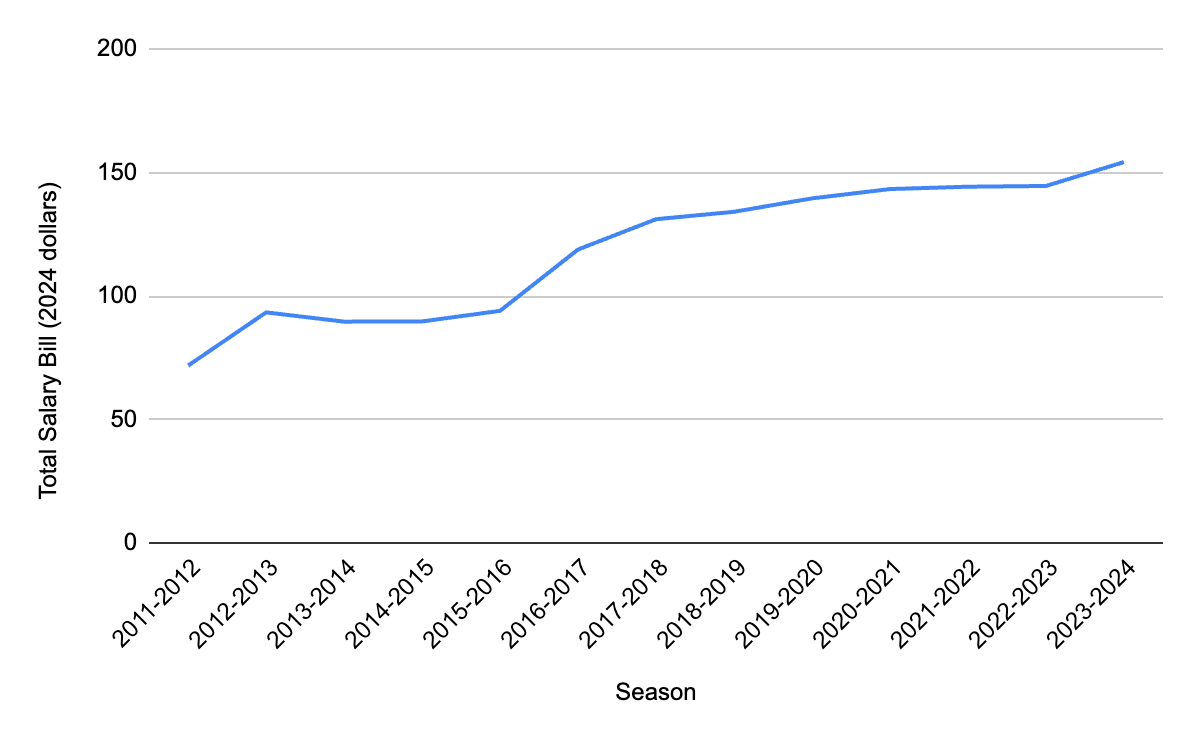
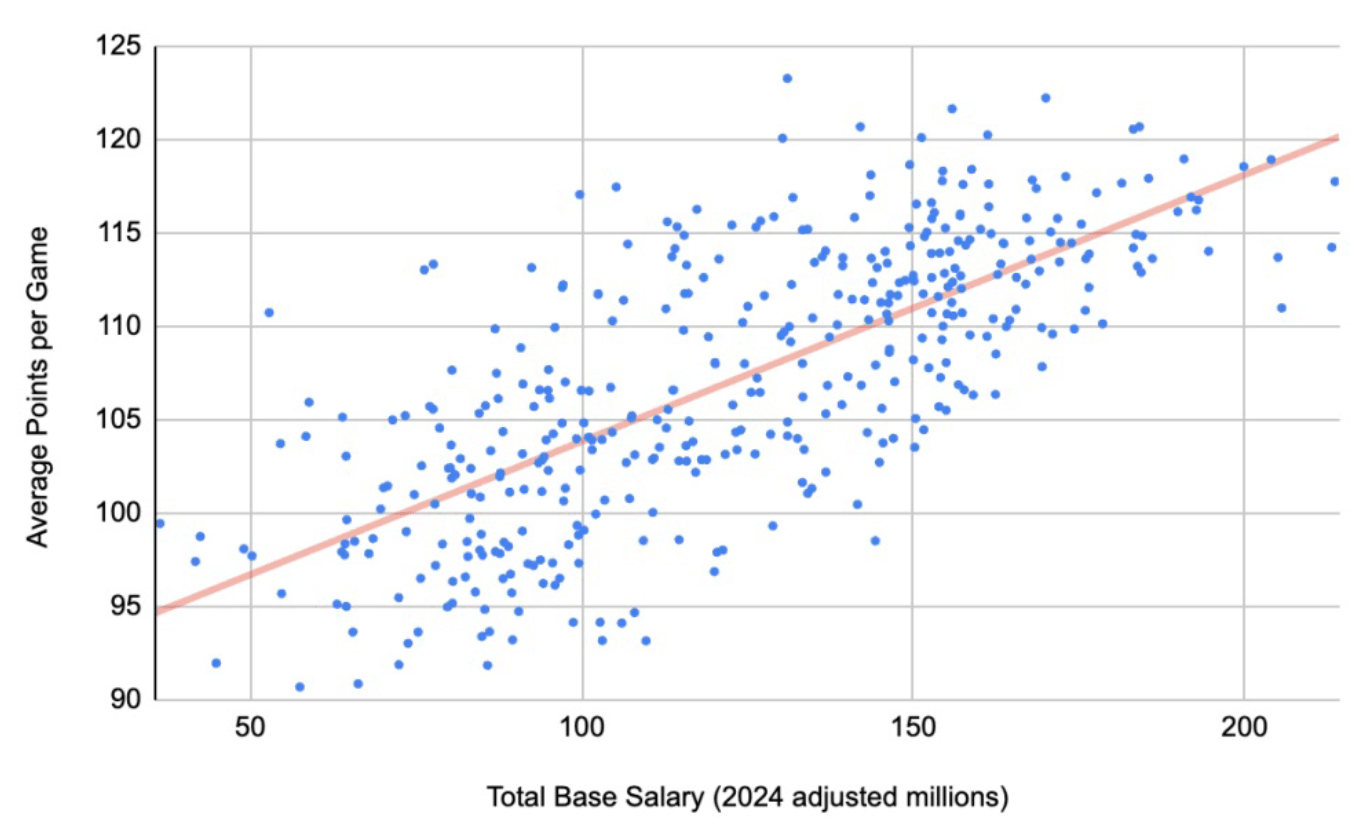
Figure 3 presents a cross-sectional scatterplot of average points per game and total team salary, illustrating a positive association alongside substantial dispersion across teams. Teams with similar payrolls often display markedly different scoring outputs, highlighting the limitations of salary alone as an explanatory variable.
Correlation Between Salary and Performance Metrics
To examine the association between team salary and performance, Pearson correlation coefficients were calculated for each season between total base salary and performance measures, along with corresponding two-tailed p-values. Statistical significance is assessed at the 10%, 5%, and 1% levels, as indicated in Table 1.
| Correlations with Total Base Salary | ||||||||
| Season | Corr. PPG | PPG P-Value | PPG Significance | Corr. FG% | FG% P-Value | FG% Significance | Win% | Win% P-Value |
| 2011-12 | -0.2019 | 0.2846 | 0.1112 | 0.5586 | 0.0800 | 0.6745 | ||
| 2012-13 | -0.1106 | 0.5606 | 0.1259 | 0.5075 | 0.1904 | 0.3135 | ||
| 2013-14 | 0.1332 | 0.4828 | 0.3539 | 0.0551 | * | 0.0888 | 0.6407 | |
| 2014-15 | 0.4148 | 0.0227 | ** | 0.4069 | 0.0256 | ** | -0.2033 | 0.2813 |
| 2015-16 | 0.4272 | 0.0186 | ** | 0.4112 | 0.0240 | ** | -0.0793 | 0.6769 |
| 2016-17 | 0.0832 | 0.6621 | 0.1256 | 0.5084 | 0.2781 | 0.1368 | ||
| 2017-18 | 0.5600 | 0.0013 | *** | 0.5310 | 0.0025 | *** | -0.1863 | 0.3244 |
| 2018-19 | 0.2760 | 0.1399 | 0.3225 | 0.0822 | * | 0.0857 | 0.6527 | |
| 2019-20 | 0.0996 | 0.6005 | 0.2176 | 0.2481 | 0.0986 | 0.6044 | ||
| 2020-21 | 0.6126 | 0.0003 | *** | 0.5070 | 0.0042 | *** | -0.0799 | 0.6748 |
| 2021-22 | 0.4374 | 0.0156 | ** | 0.6061 | 0.0004 | *** | -0.2618 | 0.1622 |
| 2022-23 | 0.3867 | 0.0348 | ** | 0.4520 | 0.0122 | ** | -0.0422 | 0.8248 |
| 2023-24 | 0.3571 | 0.0527 | * | 0.3268 | 0.0779 | * | 0.0361 | 0.8498 |
Statistical Significance * = 10% Level , ** = 5% Level , *** = 1% Level
Win% was not statistically significant across any season for conventional p-value thresholds and thus excluded from the table above.
Correlations between total base salary and points per game are positive in sign in most seasons, particularly from the mid-2010s onward; however, statistical significance is not uniform across years. Several seasons exhibit statistically significant positive correlations at conventional levels, while others show weaker associations that are not statistically distinguishable from zero. This pattern suggests that higher-spending teams often, but not consistently, score more on average, with the strength of the relationship varying over time.
Correlations between salary and field goal percentage are also predominantly positive, with moderate to relatively strong correlations observed in multiple seasons. As with points per game, statistical significance varies across years, indicating that the association between payroll size and shooting efficiency is sensitive to season-specific conditions. Importantly, these correlations are descriptive and do not account for differences in pace of play, a limitation addressed in the regression analysis that follows.
Notable deviations occur in the 2016–2017 and 2019–2020 seasons, during which correlations between salary and both points per game and field goal percentage weaken substantially and are not statistically significant. The 2019–2020 season coincides with disruptions related to the COVID-19 pandemic, including a shortened schedule and altered playing conditions. The 2016–2017 deviation may reflect changes in payroll concentration following the introduction of designated veteran contracts, which increased salary dispersion without necessarily yielding proportional performance gains.
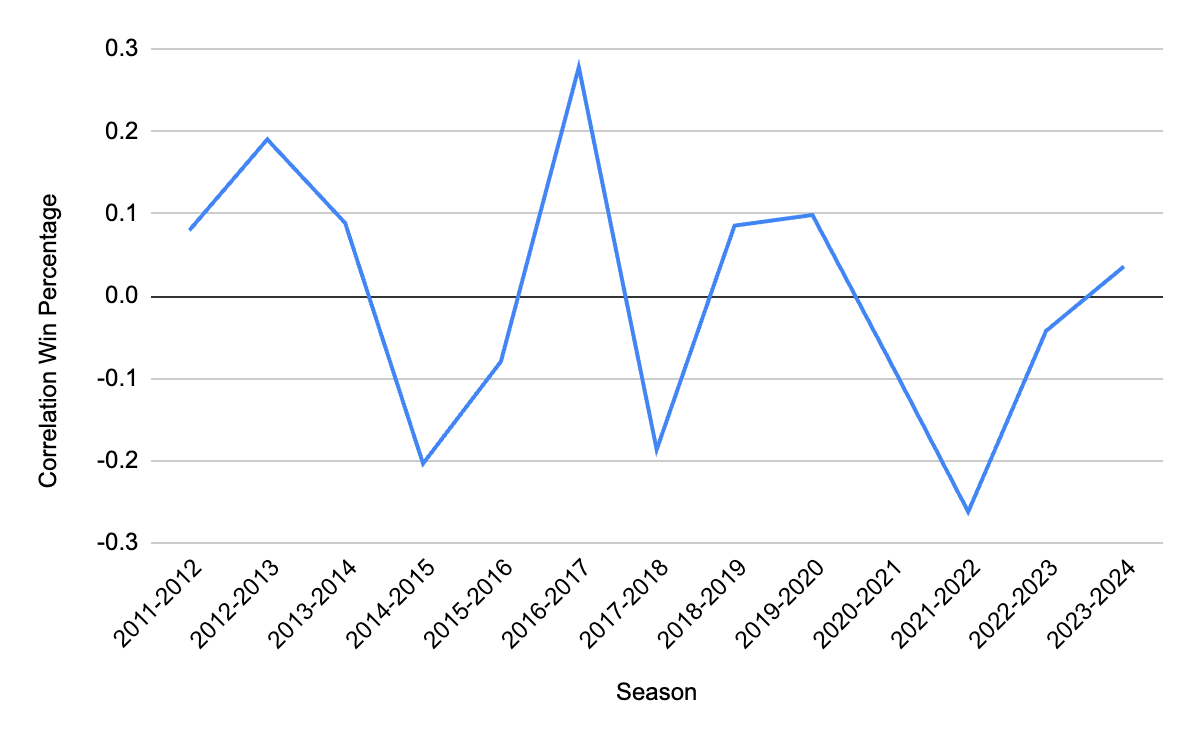
In contrast, the relationship between total base salary and win percentage is neither stable nor statistically significant across seasons (Figure 4). Correlation coefficients fluctuate in both magnitude and sign, and in all seasons fail to reach conventional levels of statistical significance, indicating no reliable linear association between payroll size and winning outcomes. Corresponding R² values (Table 2) are consistently low, suggesting that salary alone explains little of the variation in team success and underscoring the importance of omitted factors such as defensive performance, injuries, roster balance, and coaching quality.
| R2 Values for Performance Measures | |||
| Season | r2 PPG | r2 FG% | r2 Win% |
| 2011-12 | 0.0408 | 0.0124 | 0.0064 |
| 2012-13 | 0.0122 | 0.0158 | 0.0363 |
| 2013-14 | 0.0178 | 0.1252 | 0.0079 |
| 2014-15 | 0.1720 | 0.1656 | 0.0413 |
| 2015-16 | 0.1825 | 0.1691 | 0.0063 |
| 2016-17 | 0.0069 | 0.0158 | 0.0773 |
| 2017-18 | 0.3136 | 0.2820 | 0.0347 |
| 2018-19 | 0.0762 | 0.1040 | 0.0073 |
| 2019-20 | 0.0099 | 0.0473 | 0.0097 |
| 2020-21 | 0.3752 | 0.2570 | 0.0064 |
| 2021-22 | 0.1913 | 0.3674 | 0.0685 |
| 2022-23 | 0.1495 | 0.2043 | 0.0018 |
| 2023-24 | 0.1275 | 0.1068 | 0.0013 |
Table 2 reports season-specific R² values from the regression analysis, indicating the proportion of variance in each performance metric explained by total team base salary. Across seasons, R² values are generally higher for points per game and field goal percentage than for win percentage, suggesting that salary explains a larger share of variation in offensive output and efficiency than in overall competitive success.
Regression Analysis
To assess whether the observed correlations persist after accounting for linear relationships and pace effects, ordinary least squares regressions were estimated separately for each season. This approach mitigates concerns about spurious regression arising from pooled time-series data with common upward trends. Because basketball outcomes are fundamentally possession-based, performance metrics that do not account for pace can produce misleading comparisons24. Accordingly, all regression models in this study control for possessions to isolate the relationship between salary and on-court outcomes.
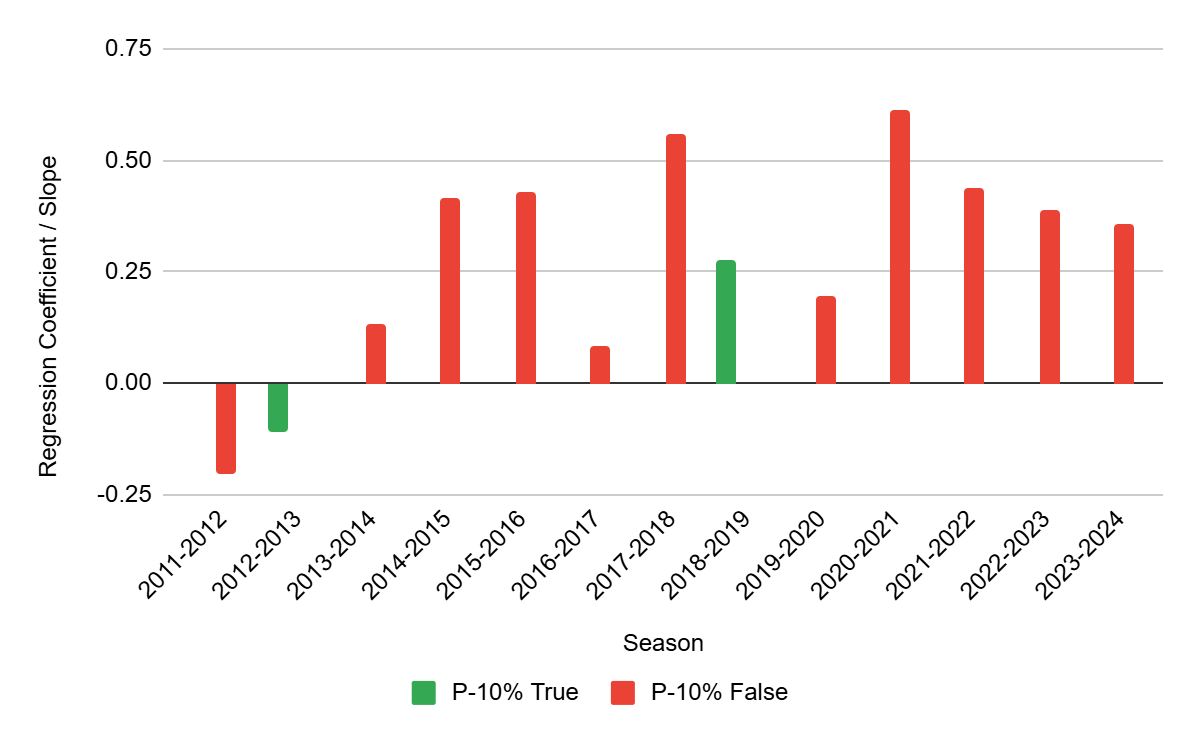
Salary and Points per Game
After controlling for pace using possessions per game, total team salary exhibits a positive and statistically significant association with points per game in nearly all seasons from 2011–2012 through 2023–2024 (Figure 5). Estimated salary coefficients are significant at conventional p-value thresholds in all but the 2020–2021 season, indicating a robust relationship between higher payrolls and greater scoring output conditional on tempo. The exception coincides with pandemic-related disruptions that likely reduced the stability of performance relationships. Overall, these results indicate that team salary is a strong predictor of offensive volume once pace of play is accounted for.
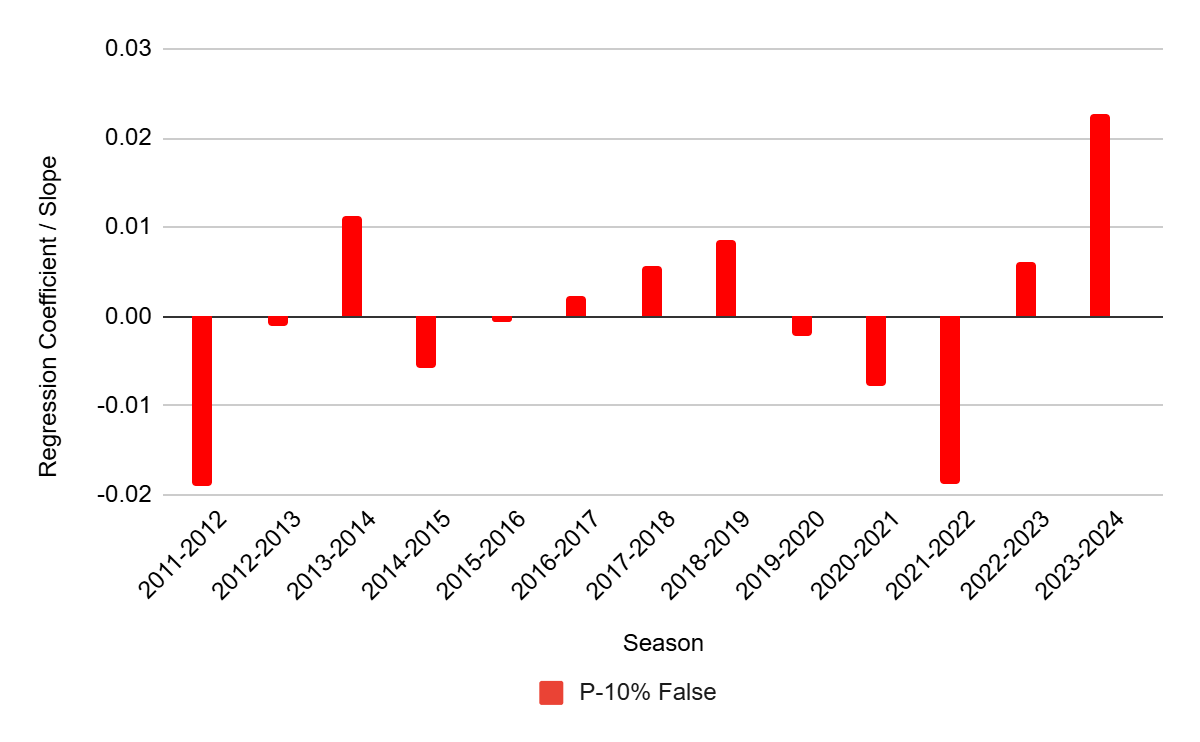
Salary and Field Goal Percentage
When shooting efficiency is measured using field goal percentage and possessions per game are included as a control, the relationship between team salary and efficiency weakens substantially (Figure 6). Although estimated salary coefficients are often positive in sign, the majority are not statistically significant at conventional levels. Moreover, coefficient magnitudes vary across seasons, indicating an unstable association. These findings suggest that once differences in pace are accounted for, higher payrolls do not reliably translate into improved shooting efficiency.
Salary and Win Percentage
Regressions using win percentage as the dependent variable yield inconsistent and largely statistically insignificant results across seasons (Figure 7). Salary coefficients fluctuate in both direction and magnitude, and no persistent relationship emerges, even after controlling for pace. These results indicate that higher payrolls do not systematically translate into greater competitive success as measured by wins.
Summary of Findings
Overall, the results indicate that total team salary is positively and consistently associated with offensive output measured by points per game, even after accounting for pace of play. In contrast, team salary does not exhibit a stable or statistically significant relationship with shooting efficiency or win percentage across seasons. These findings suggest that higher payrolls are linked to increased scoring volume but do not guarantee improved efficiency or superior competitive outcomes. A deeper interpretation of these results and their implications is provided in the Discussion section.
Discussion
This study examined the relationship between total team salary expenditures and multiple measures of team performance in the National Basketball Association (NBA) from the 2011–2012 through 2023–2024 seasons. The patterns suggest that payroll size primarily influences offensive volume rather than efficiency or competitive success, highlighting the distinction between scoring production and winning in a salary-capped league. This section interprets these findings in the context of existing literature and discusses their implications, limitations, and directions for future research.
Salary, Offensive Volume, and Efficiency
One of the most robust findings of this study is the positive and statistically significant association between team salary expenditures and offensive volume, measured by points per game, even after controlling for pace of play. Higher payrolls are associated with greater scoring output, likely reflecting deeper rotations and more offensively capable lineups. In contrast, once pace is accounted for, salary does not exhibit a stable or statistically significant relationship with shooting efficiency, measured by field goal percentage. These findings highlight the importance of distinguishing between volume-based performance metrics and efficiency-based outcomes when evaluating the relationship between payroll and performance.
Why Salary Does Not Reliably Predict Wins
Perhaps the most notable result of this study is the absence of a consistent relationship between team salary and win percentage. Even in seasons where salary is associated with higher scoring output, increased payrolls do not systematically translate into greater competitive success, underscoring the multifaceted nature of winning in professional basketball. This finding also mirrors team-level payroll studies in other professional sports leagues, including Major League Baseball and the English Premier League25,26. Team success depends on factors beyond offense, including defensive performance, coaching quality, injuries, and roster cohesion, which are not explicitly modeled in this study. Another possible explanation for the insignificance of win percentage regressions with base salaries is that if both teams are collectively spending more on base salaries, only one team will end up winning. Additionally, the results are consistent with diminishing marginal returns to salary expenditure, where additional spending yields smaller competitive gains in a league constrained by salary caps and luxury taxes.
Interpretation and Causality Limitations
The results of this paper show that in the more recent years in the NBA after the significant changes to the Collective Bargaining Agreement in 2011 and 2017, salary expenditures do not correlate to win percentage or field goal percentage in terms of team performance. The only positive relationship found in the more modern time period of 2011-2023 is between base salary and points scored. While strong results were found for points scored, it is important to emphasize that the associations identified in this study should not be interpreted as causal effects. In the NBA, player salaries are often determined by prior performance, reputation, and long-term expectations of productivity. As a result, higher performance may precede higher compensation rather than result from it. Observed relationships between salary and performance may therefore reflect selection effects rather than incentive-driven responses.
Establishing causal links would require more advanced econometric approaches, such as instrumental variable techniques or natural experiments, which are beyond the scope of this analysis. Consequently, the findings should be interpreted as descriptive relationships rather than evidence of direct causal mechanisms.
Implications and Directions for Future Research
The findings of this study offer several implications for both league policy and team management. While higher payrolls are associated with increased scoring output, they do not guarantee improvements in efficiency or competitive success. This suggests that salary caps and luxury taxes may play an important role in limiting excessive disparities in spending without necessarily undermining competitive balance.
From a managerial perspective, the results emphasize the importance of efficient resource allocation rather than payroll size alone. Teams may achieve better outcomes by optimizing roster construction, player roles, and strategic fit rather than by simply increasing salary expenditures.
Several limitations should be acknowledged. The analysis focuses on a limited set of offensive performance metrics and does not incorporate defensive indicators or additional control variables such as market size or playoff participation. Future research could extend this framework by incorporating advanced efficiency metrics, examining non-linear salary effects, segmenting teams by salary cap thresholds or luxury tax aprons, and exploring how salary-performance relationships evolve across changes in collective bargaining agreements.
Conclusion
This study examined whether higher team salary expenditures in the modern NBA are associated with improved team performance, using team-level data from the 2011–2023 seasons. By distinguishing between offensive output, shooting efficiency, and competitive success, and by accounting for differences in pace of play, the analysis provides a more nuanced assessment of how payroll relates to performance in a salary-capped league. The results indicate that while higher payrolls are consistently associated with greater scoring output, measured by points per game, they do not exhibit a stable or statistically significant relationship with shooting efficiency or win percentage once pace is controlled for. This pattern highlights an important distinction between volume-based performance metrics and outcomes that more directly reflect competitive success, suggesting that financial investment influences how much teams score but does not reliably translate into improved efficiency or winning outcomes in the NBA’s current institutional environment.
This study contributes to the literature by focusing on team-level salary expenditures in the modern NBA era and by distinguishing between volume-based performance metrics, efficiency-based outcomes, and competitive success. These results challenge Shorin (2017) by finding that increased payroll spending does not correlate with higher win percentage—a stark difference in Shorin’s findings of a positive relationship between the two in the NBA. These results also show that unlike the correlation between salary and win percentage in the MLB, there is no such significant relationship in the NBA16. However, several limitations remain in this study. The analysis is restricted to a limited set of offensive performance measures and does not incorporate defensive metrics or additional institutional and team-level controls. Moreover, the findings reflect associations rather than causal relationships, as salaries may reflect past performance rather than induce future improvements.
Future research could extend these results by incorporating advanced efficiency and defensive metrics, examining non-linear salary effects, and analyzing how salary-performance relationships vary across salary cap thresholds or collective bargaining agreement regimes. A large change to the CBA, which introduced a new “second apron” luxury tax, took place in 2023, encouraging further research to investigate whether changes in the CBA impact the correlations and relationships between base salaries and team performance. More in-depth research can also be done with a focus on separating teams based off of different salary cap amounts to see the variance in results, for example with data at the hard versus soft cap. In addition to this, incorporating player-level metrics and narrowing down on only non-rookie contracts provide an opportunity for future research to obtain unique results. Such extensions would provide further insight into how financial investment interacts with institutional constraints to shape team performance in professional sports leagues.
References
- Fort, R., & Quirk, J. (1995). “Cross-Subsidization, Incentives, and Outcomes in Professional Team Sports Leagues.” Journal of Economic Literature, 33(3), 1265–1299. www.jstor.org/stable/2729122 [↩]
- Totty, E. S., & Owens, M. F. (2011). Salary caps and competitive balance in professional sports leagues. Journal for Economic Educators, 11(2), 45-56.www.researchgate.net/publication/227458677_Salary_Caps_and_Competitive_Balance_in_Professional_Sports_Leagues [↩] [↩]
- Simmons, R., & Berri, D. J. (2011). Mixing the princes and the paupers: Pay and performance in the National Basketball Association. Labour Economics, 18(3), 381-388. https://doi.org/10.1016/j.labeco.2010.11.012 [↩]
- Stiroh, K. J. (2007). Playing for Keeps: Pay and Performance in the NBA. Economic Inquiry, 45(1), 145-161. https://www.researchgate.net/publication/4755154_Playing_for_Keeps_Pay_and_Performance_in_the_NBA [↩] [↩]
- Fort, R., & Quirk, J. (1995). “Cross-Subsidization, Incentives, and Outcomes in Professional Team Sports Leagues.” Journal of Economic Literature, 33(3), 1265–1299. www.jstor.org/stable/2729122 [↩]
- Vrooman, J. (2000). “The Economics of American Sports Leagues.” Scottish Journal of Political Economy, 47(4), 364–398. https://doi.org/10.1111/1467-9485.00169 [↩]
- Szymanski, S. (2003). “The Economic Design of Sporting Contests.” Journal of Economic Literature, 41(4), 1137–1187. https://doi.org/10.1257/002205103771800004 [↩]
- Totty, E. S., & Owens, M. F. (2011). Salary caps and competitive balance in professional sports leagues. Journal for Economic Educators, 11(2), 45-56. www.researchgate.net/publication/227458677_Salary_Caps_and_Competitive_Balance_in_Professional_Sports_Leagues [↩]
- Louchheim, B. (2018). Luxury Tax and Competitive Balance in the NBA Luxury Tax and Competitive Balance in the NBA. https://creativematter.skidmore.edu/cgi/viewcontent.cgi?article=1091&context=econ_studt_schol [↩]
- Dietl, H. M., Lang, M., & Werner, S. (2010). The effect of luxury taxes on competitive balance, club profits, and social welfare in sports leagues. International Journal of Sport Finance, 5(1), 41-51. https://doi.org/10.5167/uzh-34515 [↩]
- Humphreys, B. R. (2002). Alternative Measures of Competitive Balance in Sports Leagues. Journal of Sports Economics, 3(2), 133–148. https://doi.org/10.1177/152700250200300203 [↩]
- Kesenne, S. (2007). “Does a Win Bonus Help to Increase Profit or Wins in Professional Team Sports?” International Journal of Sport Finance, 2(3), 142–148. https://doi.org/10.1177/155862350700200303 [↩]
- Sanderson, A. R., & Siegfried, J. J. (2003). Thinking about Competitive Balance. Journal of Sports Economics, 4(4), 255–279. https://doi.org/10.1177/1527002503257321 [↩]
- Zimbalist, A. (2010). Reflections on Salary Shares and Salary Caps. Journal of Sports Economics, 11(1), 17–28. https://doi.org/10.1177/1527002509354890 [↩]
- Winston, W. L., Nestler, S., & Pelechrinis, K. (2022). Mathletics : How Gamblers, Managers, and Fans Use Mathematics in Sports. Princeton University Press [↩]
- Hall, S., Szymanski, S., & Zimbalist, A. S. (2002). Testing causality between team performance and payroll: The cases of Major League Baseball and English soccer. Journal of sports economics, 3(2), 149-168. https://www.researchgate.net/publication/227351010_Testing_Causality_Between_Team_Performance_and_Payroll_The_Cases_of_Major_League_Baseball_and_English_Soccer [↩] [↩]
- Shorin, G., Arcidiacono, P., & Kimbrough, K. (2017). Team Payroll versus Performance in Professional Sports: Is Increased Spending Associated with Greater Success? https://sites.duke.edu/djepapers/files/2017/06/grantshorin-dje.pdf [↩]
- Gasparetto T. & Thadeu, M. (2012). Relationship between Wages and Sports Performance. The Empirical Economics Letters, 11(9), 943–949. https://www.researchgate.net/publication/272160764_Relationship_between_Wages_and_Sports_Performance [↩]
- Katayama, H., & Nuch, H. (2011). A game-level analysis of salary dispersion and team performance in the national basketball association. Applied Economics, 43(10), 1193–1207. https://doi.org/10.1080/00036840802600335 [↩]
- Annala, C. N., & Winfree, J. (2011). Salary distribution and team performance in Major League Baseball. Sport Management Review, 14(2), 167–175. https://doi.org/10.1016/j.smr.2010.08.002 [↩]
- Gao, J. (2017). Exploring the Impacts of Salary Allocation on Team Performance. ResearchGate; unknown. https://www.researchgate.net/publication/326697184_Exploring_the_Impacts_of_Salary_Allocation_on_Team_Performance [↩]
- NBPA. (2019). CBA – National Basketball Players Association. Nbpa.com. https://nbpa.com/cba [↩]
- Coon, L. (2023). Cbafaq.com. http://www.cbafaq.com/salarycap17.htm# [↩]
- Oliver, D. (2011). Basketball on Paper. Potomac Books, Inc [↩]
- Lu, X., Matthews, J., Wang, M., & Zhuang, H. (2018). Team payroll, pitcher and hitter payrolls and team performance: Evidence from the U.S. Major League Baseball. Economics and Business Letters, 7(2), 62. https://doi.org/10.17811/ebl.7.2.2018.62-69 [↩]
- Traugutt, A. & Morton, J. (2024) “Salary Disparity and Team Performance: An Empirical Analysis of the English Premier League,” Journal of Applied Sport Management, 16(2). https://doi.org/10.7290/jasm16sktj [↩]


