
Abstract
Background/Objective: Coronary artery disease (CAD) is a major subtype of cardiovascular disease (CVD), the leading cause of mortality in the United States. CAD commonly results from atherosclerotic plaque and can be evaluated with resting measurements and exercise findings. We hypothesized that selected exercise features would show strong associations with recorded obstructive CAD. We also compared cholesterol by age among women with recorded obstructive CAD.
Methods: We analyzed all 303 records from the official Cleveland dataset. Features were summarized with means, standard deviations, and percentages. Welch two-sample t-tests, point-biserial correlations, and Hedges’ g were computed for continuous features, and Pearson chi-squared tests and Cramér’s V for categorical features. Classification was assessed with ROC-AUC, bootstrap confidence intervals, multivariable logistic regression, and five-fold stratified cross-validation.
Results: Exercise features were strongly associated with recorded obstructive CAD. ROC analysis showed greater discrimination for exercise features (mean AUC*=0.716). Resting blood pressure and resting ECG were significant in univariate analyses, but no resting parameter remained significant in the full multivariable model. Among women with recorded obstructive CAD, mean cholesterol was higher below age 55 (323.00 mg/dL, n=2) than at age 55 or older (272.09 mg/dL, n=23). This difference was not statistically significant (Mann–Whitney U p=0.20; Welch t-test p=0.135).
Conclusions: Selected exercise features showed strong associations. The second hypothesis was not statistically supported.
Keywords: Obstructive CAD, exercise, resting, association, total cholesterol, age.
Introduction
Background and Context
Cardiovascular disease (CVD) remains a leading cause of death in the United States and encompasses conditions affecting the heart and vasculature (arteries). This includes conditions like coronary artery disease (CAD), cerebrovascular disease, heart failure, arrhythmias, and peripheral arterial disease1. In this article, we focus on CAD, also called coronary artery disease or ischemic heart disease, which commonly involves atherosclerotic narrowing of the coronary arteries and may restrict blood flow. Coronary atherosclerosis is the process where cholesterol-rich plaques accumulate and progress within coronary arterial walls, which can narrow the vessel lumen and impair blood flow2. Atherosclerosis is a major cause of CAD. The narrowing of coronary arteries reduces oxygenated blood flow and can create an imbalance between oxygen supply and demand. This imbalance becomes especially potent during physical exertion due to increased oxygen demand3. CAD risk can be evaluated using resting measures such as blood pressure, electrocardiogram (ECG), fasting blood sugar, and total serum cholesterol while exercise stress metrics evaluate physiological responses under stress. Resting risk assessment and exercise testing provide related but distinct clinical information, with each approach having different strengths and limitations3,4,5,6. In this study, we analyze the Cleveland dataset to evaluate the association of selected resting and exercise features with obstructive CAD.
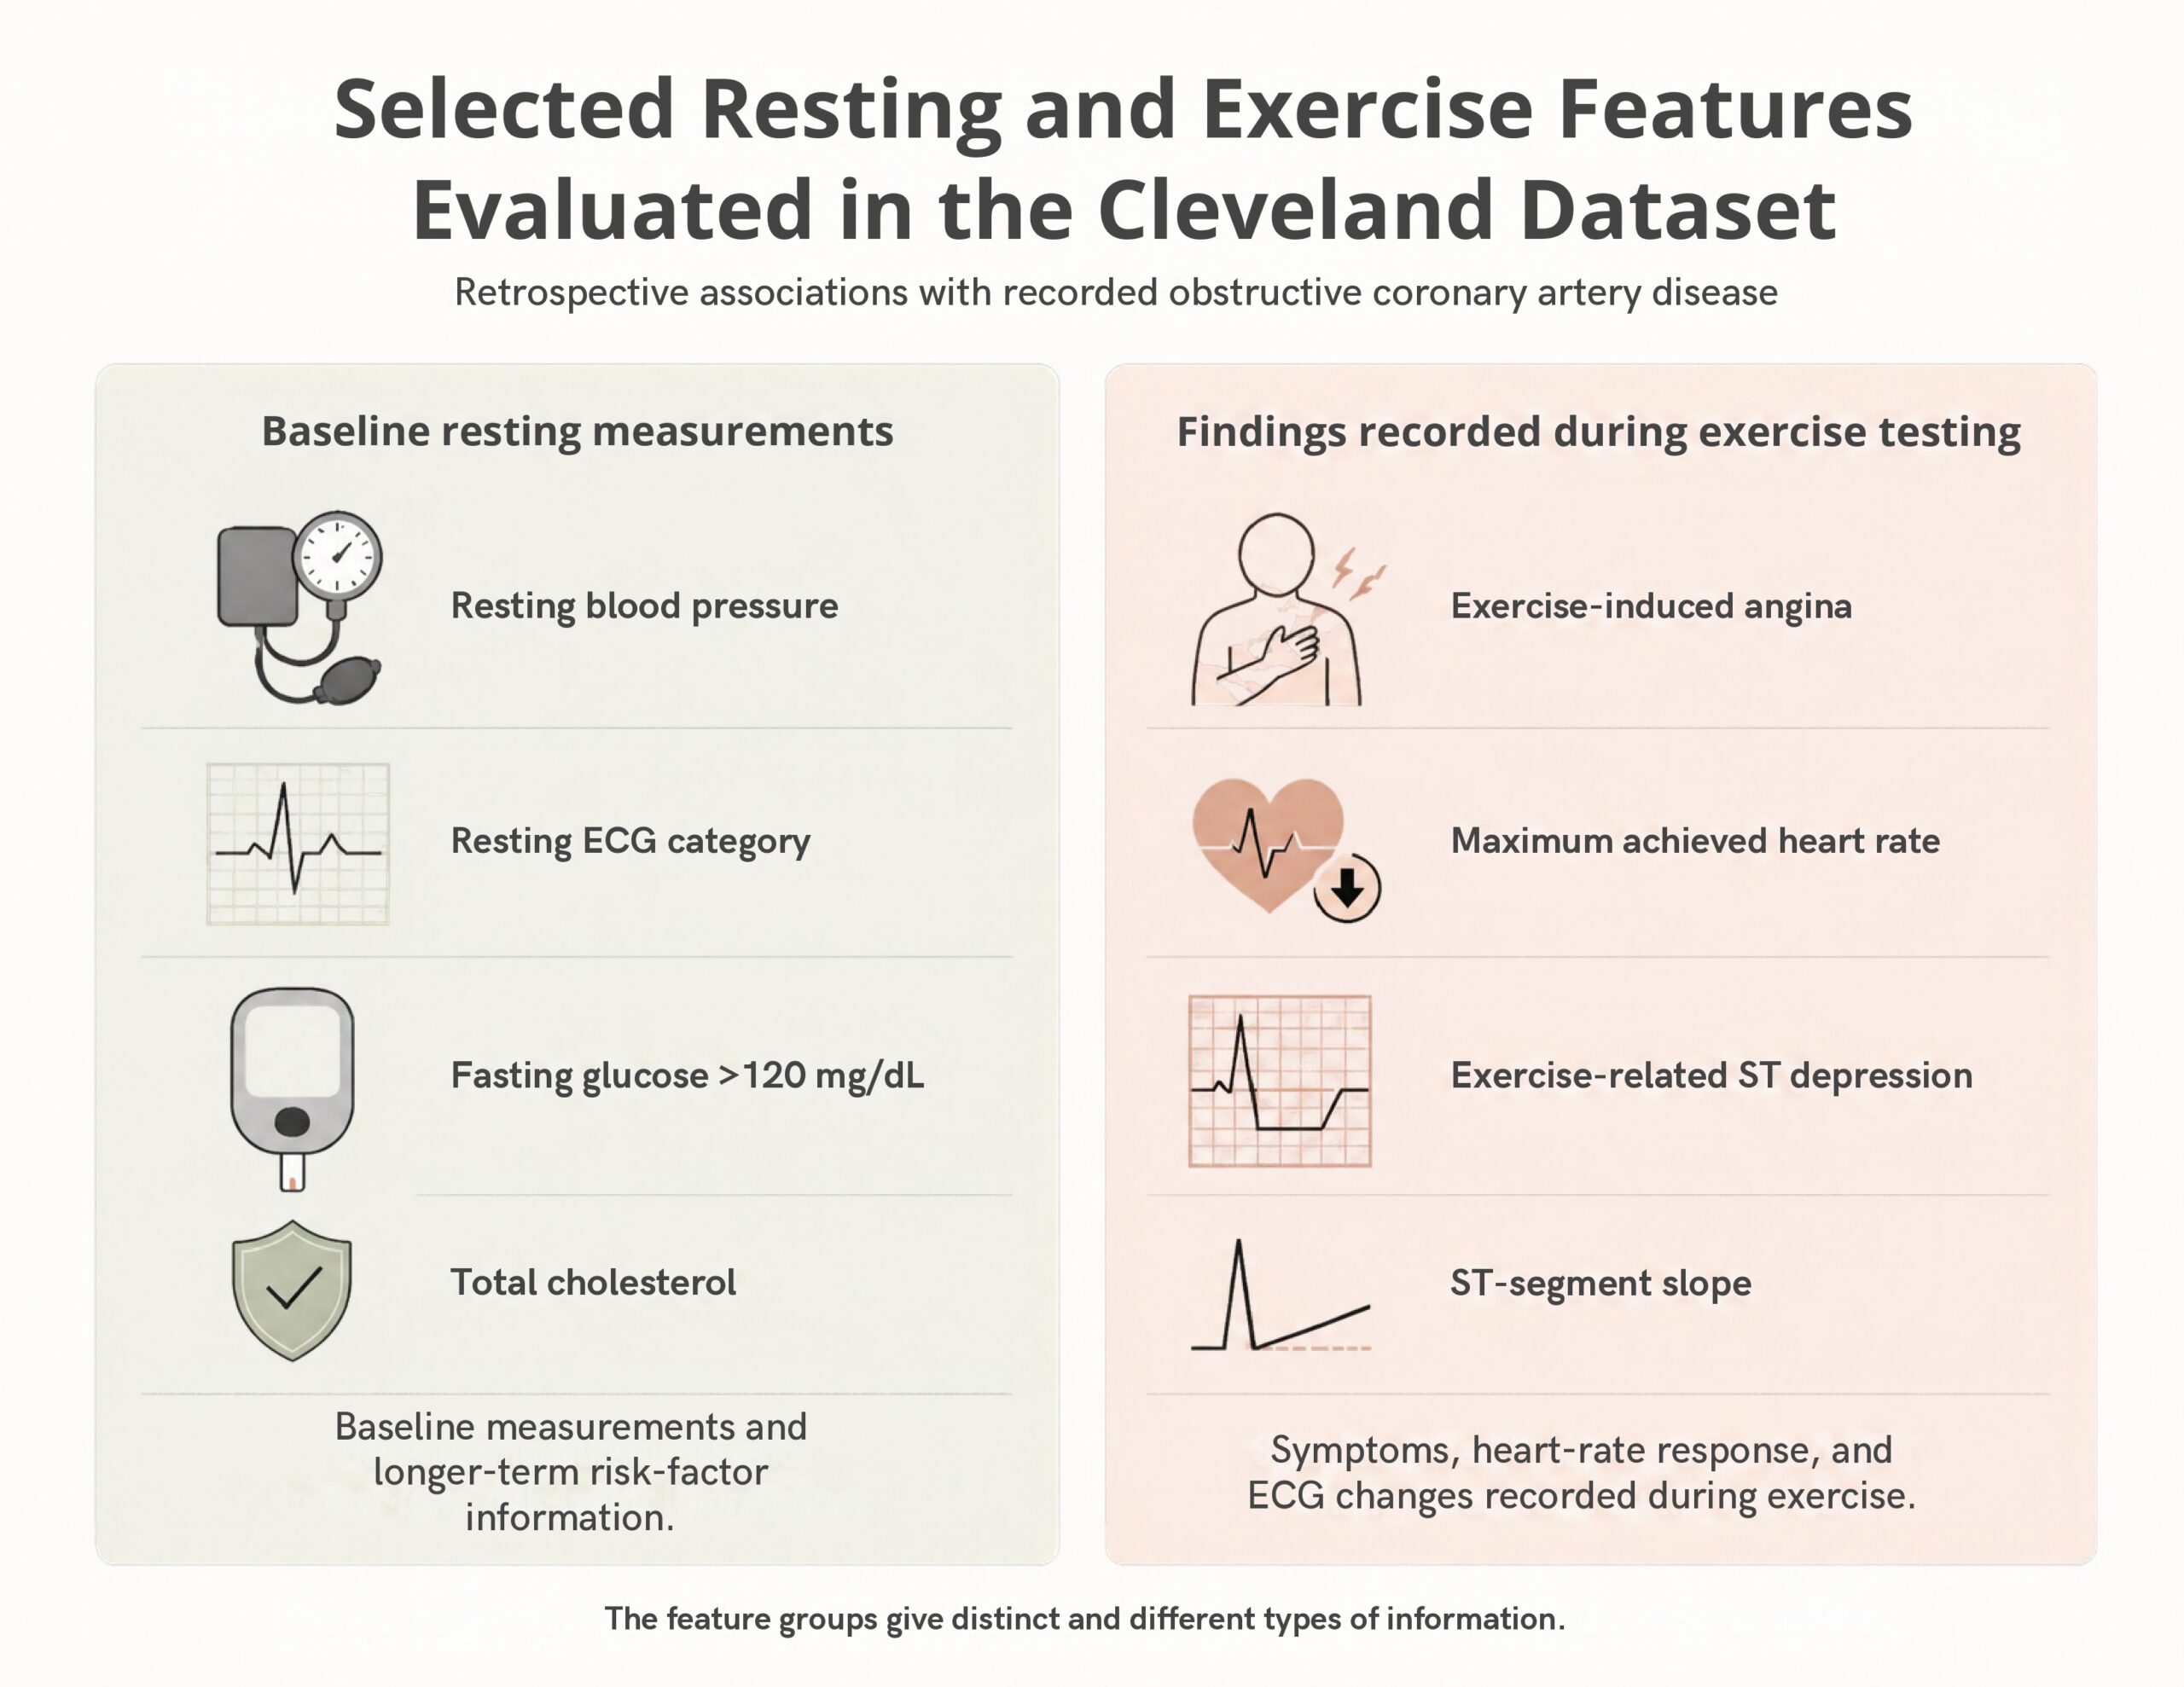
Among the chosen resting features were resting blood pressure, resting Electrocardiogram (ECG), fasting blood sugar, and total cholesterol values. Blood pressure is the pressure exerted by circulating blood against arterial walls. Arterial blood pressure is commonly reflected by systolic and diastolic components. Systolic and diastolic blood pressure are influenced by arterial stiffness, vascular resistance, and vascular recoil7. An increased blood pressure increases the cardiac workload and is associated with negative cardiac outcomes8. In patients with atherosclerosis, this increased workload may contribute to oxygen supply and demand imbalances3. A resting electrocardiogram (ECG) is a non-invasive test that records electrical activity of the heart. Resting ECG abnormalities may be associated with cardiovascular disease profiles, although they are not specific for obstructive CAD9,10. Higher fasting blood glucose, another resting feature, is used in the identification of prediabetes and diabetes11. Diabetes is associated with vascular injury, atherosclerosis and increased obstructive CAD risk12. Total cholesterol reflects cholesterol carried in multiple lipoprotein forms, such as Low-Density Lipoprotein (LDL-C), Very-Low-Density Lipoprotein (VLDL-C), and High-Density Lipoprotein (HDL-C)13,14. Elevated LDL cholesterol has a causal role in atherosclerosis of the coronary vessels which leads to obstructive CAD over time13,14.
The chosen exercise features were exercise induced angina, ST slope, ST depression (oldpeak) and maximum achieved heart rate. The exercise parameters evaluate cardiac performance under physiological stress3,6. Exercise induced angina is chest pain or pressure induced by physical exertion. In obstructive CAD, exercise induced angina can be caused when the oxygen demand to the heart cannot be met with an increased blood flow due to narrowing of coronary vessels by atherosclerosis3. ST depression (oldpeak) and ST slope are ECG features recorded during physical exercise and can be associated with obstructive CAD. These features are obtained from the ECG and describe changes in the ST-segment due to exercise6,15,16,17. Finally, maximum achieved heart rate gives information about the cardiovascular response to exercise and is generally lower in patients with obstructive CAD18,19. Thus, this relationship is multifactorial, and maximum achieved heart rate should not be interpreted as a direct measure of coronary obstruction19,20,21.
Problem Statement and Rationale
Our research statistically quantifies the association of recorded obstructive CAD with resting (blood pressure, resting ECG, fasting blood sugar, and total cholesterol) and exercise features (angina, ST slope, oldpeak, and maximum heart rate). Pathophysiologically, the selected resting parameters reflect more long-term risk factor burden, whereas the selected exercise parameters capture physiological responses during exercise testing, including findings that may be associated with inducible ischemia3,5,6. Although both these categories provide different types of information, quantifying this distinction numerically helps clarify their individual strengths and limitations5,6,22. The present study quantifies these expected relationships in the Cleveland medical records dataset. Because the selected feature groups measure different physiological information, their comparison evaluates performance only within this dataset and does not show the superiority of exercise features over resting features. Additionally, we statistically explored if women younger than 55 diagnosed with obstructive CAD had a higher serum cholesterol compared to women aged 55 or older.
Significance and Purpose
The exercise and resting feature groups used for this study evaluate fundamentally non-equivalent physiological constructs3,5. As noted above, each feature can reflect a resting risk factor or may indirectly imply physiological changes associated with ischemia. Quantitatively understanding the associations of the features helps clarify their descriptive and predictive utility in this dataset22,23,24,25. Also, it is important to note that the comparative statistical performance highlights their distinct diagnostic utility rather than establishing the simple clinical superiority of exercise testing over baseline resting risk assessment5,6,26.
Objectives
The primary objective of this retrospective study was to quantitatively evaluate and compare specific clinical features from the Cleveland Heart Disease dataset to test two core hypotheses (1) resting and exercise features provide distinct information, with the four selected exercise features hypothesized to show strong statistical association with recorded obstructive CAD, and (2) explore whether women younger than 55 with recorded obstructive CAD exhibit higher serum total cholesterol levels compared to women aged 55 or older with recorded obstructive CAD. Our study outlines and quantitatively explores the information provided by the resting and exercise features. It also provides a detailed statistical and machine learning evaluation (using ROC curves, chi-squared tests, Welch t-tests, Cramér’s V, multivariable logistic regression, and cross-validation) on the widely used Cleveland dataset. Further, it explores the relationship between age and total cholesterol among women with recorded obstructive CAD27,28,29,30. The study evaluates associations consistent with established cardiovascular principles rather than proposing a new biological mechanism.
Scope and Limitations
We used an existing public dataset for this work and inferred statistical associations between the disease outcomes and clinically measured features. Study limitations included the fact that no new primary patient data was used, and the detailed cholesterol breakdown (LDL cholesterol, HDL cholesterol, VLDL cholesterol, and triglycerides) was not assessed as this information was not available with the dataset. The dataset also only had 303 records, which limited the scope of our analysis. Additionally, measurement of estrogen and menopause status were not available and thus could not be analyzed31,32.
Methodology Overview
The analysis combined descriptive statistics, univariate association tests, ROC analysis, and logistic-regression models. Classification performance was evaluated using pooled out-of-fold predictions from shuffled five-fold stratified cross-validation.
Methods
Research Design
This study employed an observational retrospective analysis using the Cleveland Heart Disease dataset obtained from the UCI Machine Learning Repository32,33. The dataset contains 303 patient records; variables included demographic, resting clinical measurements, and exercise stress-test information along with target values for defining disease and no-disease criteria. For the purposes of this investigation, a specific subset of 8 clinical features were categorized into two primary groups: exercise derived variables (maximum heart rate achieved, exercise induced angina, ST depression (oldpeak), and ST slope) and resting variables (resting blood pressure, resting electrocardiogram results, serum cholesterol, and fasting blood sugar). For regression, all continuous features were standardized within the analysis or training folds to allow for direct comparison of statistical relationships across variables measured on different scales. The study did not measure incident disease or future risk.
Variables and Measurement
The Cleveland dataset contained target values ranging from 0 to 4. Target 0 was coded as no obstructive CAD (<50% diameter narrowing), while targets 1–4 were combined as recorded obstructive CAD (greater than 50% narrowing in at least one major coronary vessel), giving 164 and 139 records, respectively32,33. The obstructive-CAD outcome target variable was treated as binary, and continuous predictors were maintained in their numerical form. No patients were excluded because the selected variables, age, sex, and target had no missing values, and no artificial resampling or class balancing techniques were applied. The file contained no duplicated complete rows. The unused ca (coronary angiography) and thal (thallium) variables contained four and two missing values, respectively. Data preprocessing was conducted at each cross-validation training fold to prevent data leakage. Continuous variables were standardized and missing values were replaced using the feature median. Categorical variables were dummy-encoded, and since categorical variables do not have a median, missing values were replaced with the most commonly occurring category. Although the final feature set contained no missing data, these imputation steps were preserved to maintain the integrity of the prespecified pipeline.
The eight prespecified features were resting blood pressure (mm Hg), resting ECG category, total cholesterol (mg/dL), fasting blood sugar greater than 120 mg/dL, maximum achieved heart rate (beats/min), exercise-induced angina, exercise-related ST depression (oldpeak), and ST slope. Electrocardiogram (ECG) findings were represented using categorical dummy coding to prevent the model from assuming arbitrary numerical spacing or ordinal relationships among distinct clinical categories. To avoid assuming arbitrary numeric order or equal distance between categorical values, two ECG variables were converted into sets of binary indicator (dummy) variables for the regression model.
Resting ECG was coded into three categories: normal (used as the reference category), ST–T wave abnormalities, and probable or definite left-ventricular hypertrophy (LVH). The LVH category represents the label assigned to Code 2 in the UCI Heart Disease dataset based on Estes’ ECG criteria rather than an independently confirmed clinical diagnosis32. ST segment slope was coded into three categories based on slope direction during peak exercise: upsloping (reference category), flat, and downsloping. Dummy coding makes sure that the model evaluates each slope category independently without implying an ordinal or linear numerical relationship across the three states.
Data Collection
The official processed Cleveland data file (.csv; DOI 10.24432/C52P4X) was downloaded from the UCI Machine Learning Repository.
Procedure
Data processing and statistical analyses were conducted using Python 3.12.13 within a Jupyter Notebook environment. pandas 2.2.3 was used for data manipulation and NumPy 2.3.5 for numerical computation34, SciPy 1.17.0 for statistical testing and unpenalized inferential logistic regression35, scikit-learn 1.8.0 for receiver operating characteristic (ROC) curve analysis36, and Matplotlib 3.10.8 and seaborn 0.13.2 for figures. The complete set of tests in data analysis is explained in the next section.
Data Analysis
Descriptive, univariate, and multivariate analyses were conducted on the resting and exercise features as explained below. For the descriptive analysis, continuous features were summarized using group means and sample standard deviations, while categorical features were summarized using counts and within-group percentages.
Categorical and continuous features were treated separately for univariate analysis. Associations between categorical features and recorded obstructive CAD were tested using Pearson chi-squared tests. Cramér’s V was calculated to quantify categorical association strength beyond statistical significance. Degrees of freedom, observed and expected counts, and minimum expected cell counts were reported. Because the resting-ECG table contained an expected count below 5, its Pearson chi-squared result was interpreted cautiously and checked using a Monte Carlo sensitivity test that was fixed margin with 100,000 simulated tables and random seed 42. The Monte Carlo p-value used the plus-one correction.
Continuous features were compared between the obstructive-CAD and no-obstructive-CAD groups using Welch independent two-sample t-tests for significance. Hedges’ g was calculated as the standardized mean difference between the disease and no-disease groups, and its uncertainty was estimated using 5,000 bootstrap samples. In addition, Point-biserial correlation coefficients (rpb) were calculated to measure the direction and strength of association between each continuous feature and binary recorded obstructive-CAD status. Statistical significance was evaluated using an alpha threshold of 0.05.
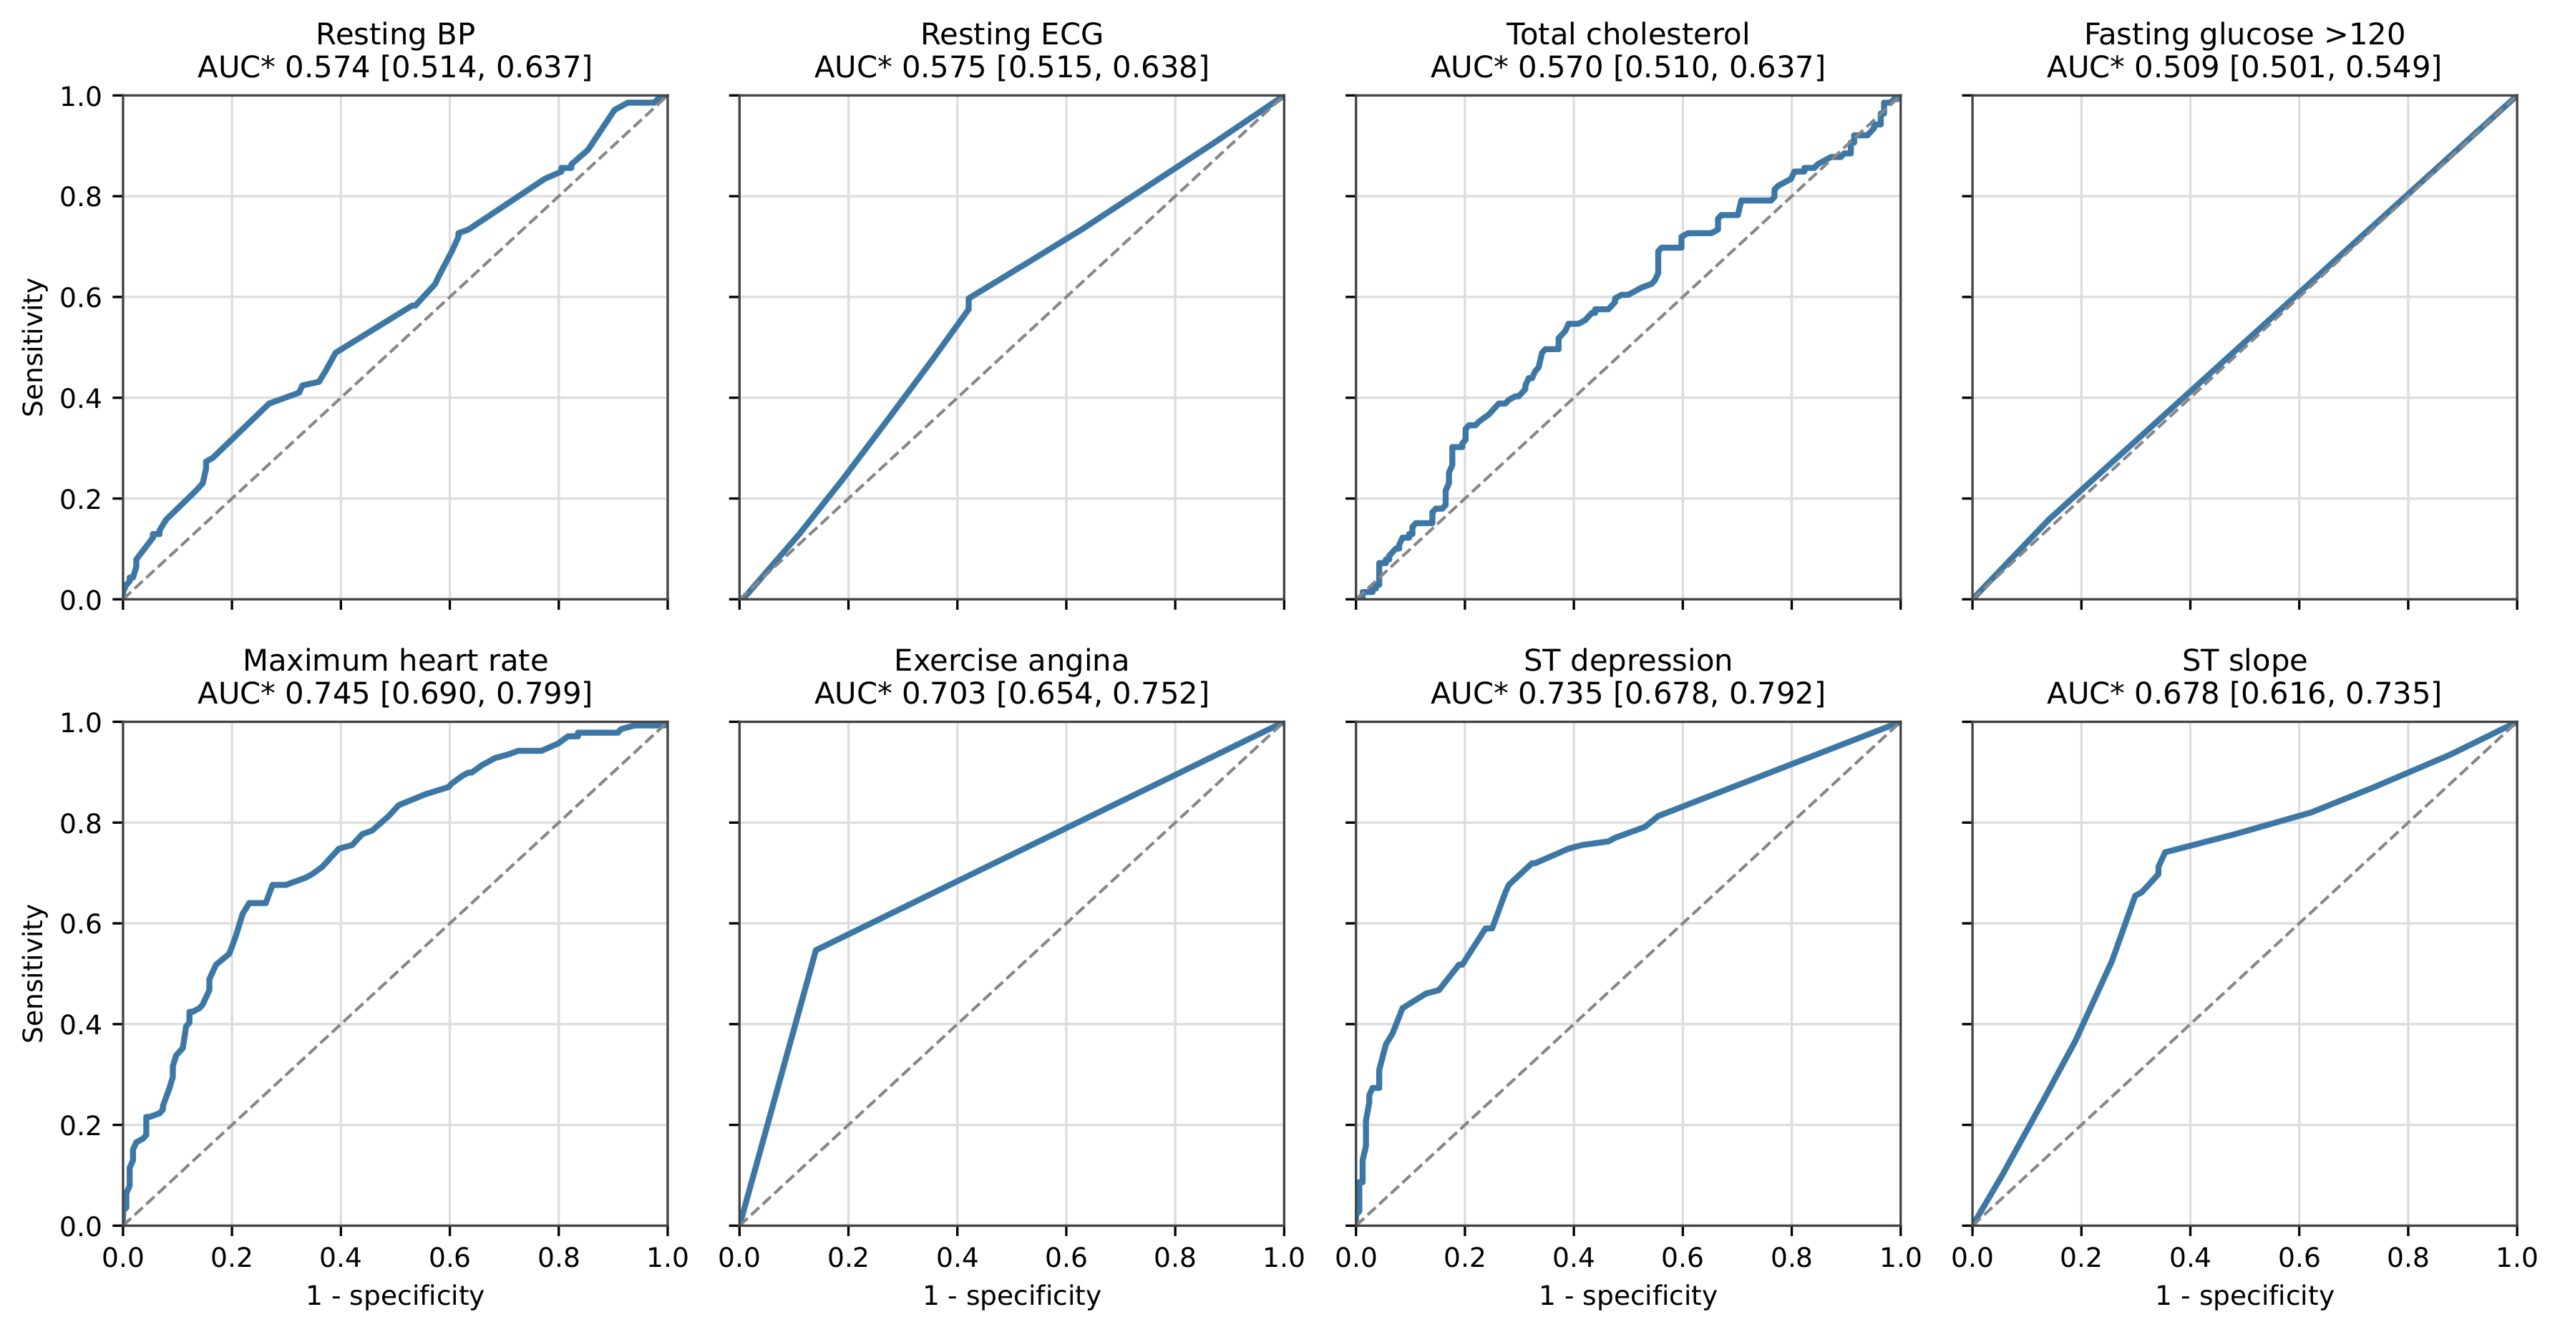
ROC analysis was used to examine the individual classification performance of each feature. An AUC of 0.5 represented no discrimination and an AUC of 1.0 represented perfect discrimination. For continuous and binary features, AUC*=max(AUC, 1−AUC) was applied consistently so that discrimination strength could be described independently of association direction. Maximum heart rate was negated for plotting because its raw obstructive-CAD-positive AUC was below 0.5, while the disease labels remained unchanged.
For multivariate analysis, a full unpenalized logistic-regression model was fitted to all 303 records using the exercise and resting predictors to estimate conditional associations. Separate L2-regularized classification models were constructed using exercise-only and resting-only features. Finally, age and sex were also combined with exercise and resting features in the classification models.
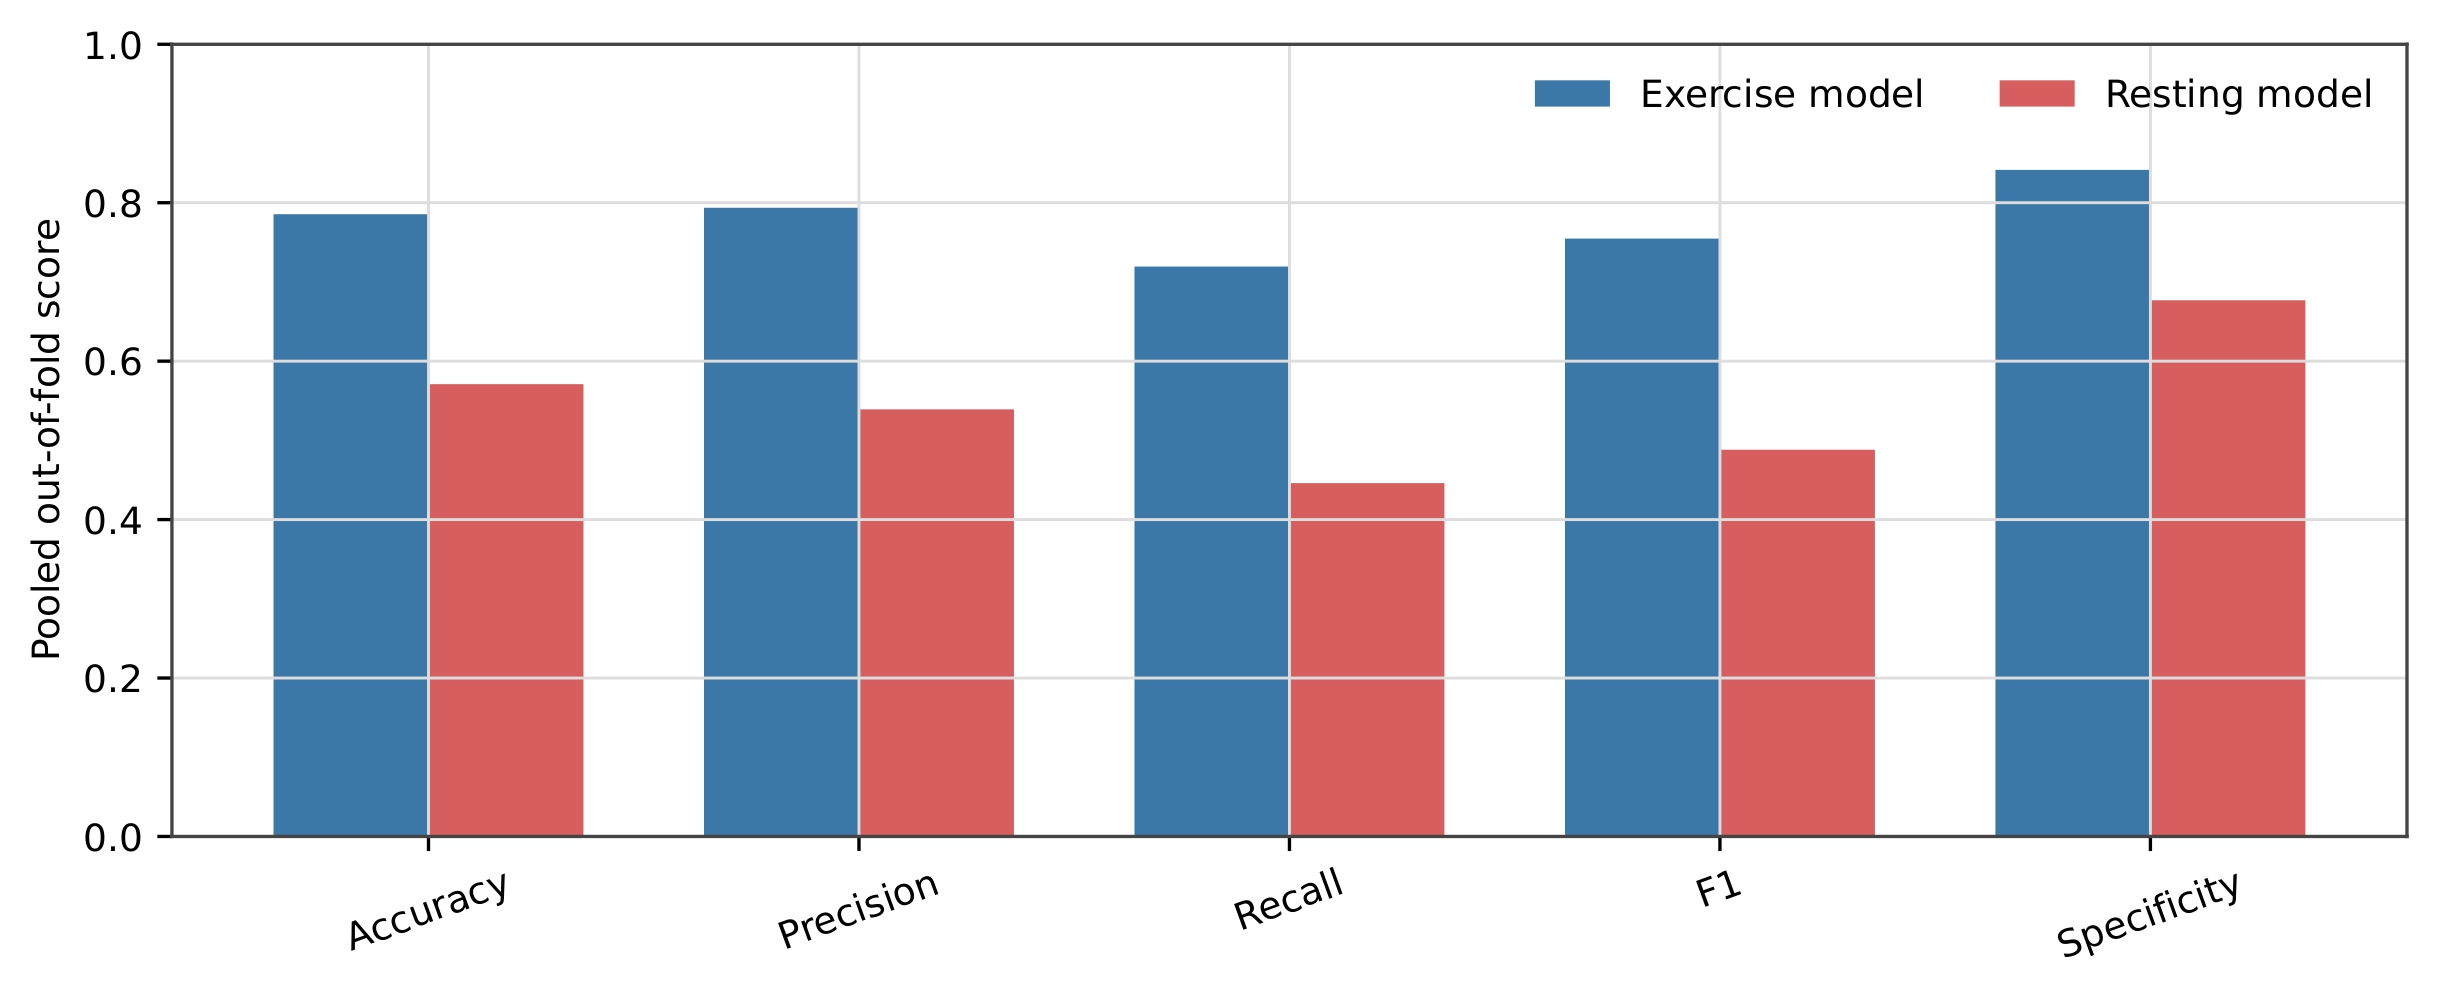
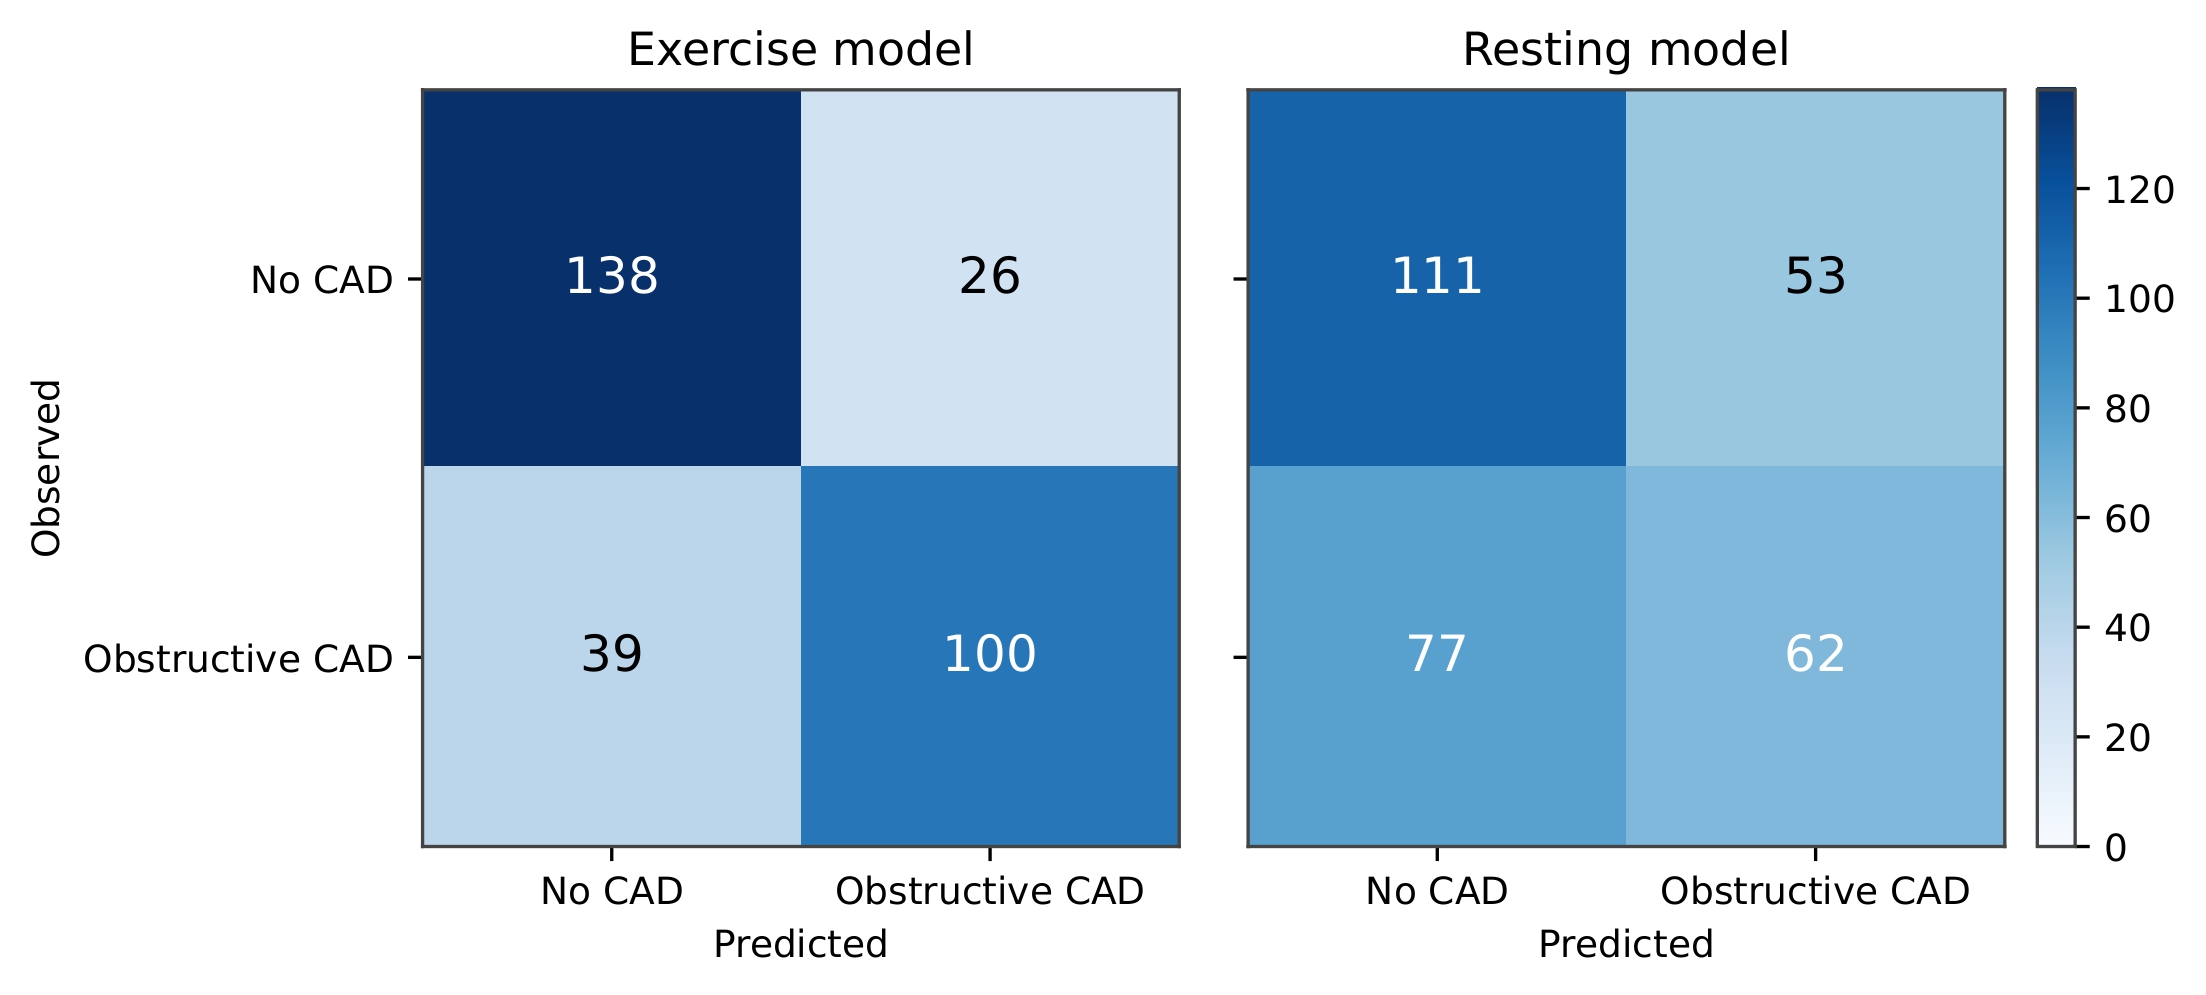
One main evaluation strategy was used for all classification-model results: shuffled five-fold stratified cross-validation across all 303 records. StratifiedKFold used five folds, shuffling, and random seed 42. In each fold, model preprocessing was fitted only on the four training folds and then applied to the held-out fold. Predictions from the five held-out folds were pooled so that every record received one out-of-fold prediction. All reported classification metrics and confusion matrices were calculated from these 303 pooled out-of-fold predictions. Consequently, Figures 6 and 7 represent pooled cross-validation results rather than a single clinical test dataset.
All the logistic regression classifiers used L2 regularization, C=1.0, the liblinear solver, a maximum of 1,000 iterations, random seed 42, and a classification threshold of 0.50. Model performance was evaluated using accuracy, precision, recall, F1 score, specificity, AUROC, bootstrap 95% confidence intervals, and confusion matrices.
For the full unpenalized inferential model, continuous predictors were standardized over the analysis dataset, so their coefficients and odds ratios represent a one-standard-deviation increase rather than a one-unit increase. Resting ECG and ST slope were dummy-coded using normal ECG and upsloping ST slope as their respective reference groups. Regression coefficients, standard errors, odds ratios, 95% confidence intervals, and p-values were calculated, and model convergence was confirmed before interpretation. These inferential estimates were not presented as cross-validated performance metrics or causal effects.
For Hypothesis 2, total cholesterol was analyzed among the 25 women with recorded obstructive CAD. Women younger than 55 years were compared with women aged 55 years or older, and the two women exactly age 55 were included in the older group. These were age groups rather than measured menopausal categories because menopausal status and estrogen were not recorded. Group differences were evaluated using an exact Mann–Whitney U test and a Welch independent two-sample t-test. Pearson correlation was used to assess the direction of the age–cholesterol relationship among women with recorded obstructive CAD.
Ethical Considerations
This secondary analysis used a public, de-identified dataset and involved no participant contact or new data collection.
Individual-Feature ROC Analysis
For the multicategory resting-ECG and ST-slope features, individual-feature discrimination was estimated using pooled out-of-fold probabilities from separate dummy-coded logistic-regression models. Each model used the same shuffled five-fold stratified cross-validation assignments, with preprocessing fitted within each training fold. These probabilities, rather than the original UCI category numbers, were used to calculate AUROC and bootstrap confidence intervals. AUC confidence intervals and the paired difference between mean exercise and resting AUC* values were estimated using 5,000 stratified patient-level bootstrap resamples with random seed 42.
Results
Hypothesis #1:
The final analysis included all 303 records, comprising 164 patients without recorded obstructive coronary artery disease (CAD) and 139 patients with recorded obstructive CAD. First, the features were classified into either categorical or continuous, depending on their measurement scales and the UCI documentation. The descriptive analysis performed included means and sample standard deviations for continuous features, and counts and within-group percentages for categorical.
Descriptive Statistics (Resting Features)
The two continuous resting parameters used were resting blood pressure and total cholesterol. Mean resting blood pressure was 129.25 ± 16.20 mm Hg in patients without recorded obstructive CAD and 134.57 ± 18.77 mm Hg in patients with recorded obstructive CAD. Mean total cholesterol was 242.64 ± 53.46 mg/dL in the no-disease group and 251.47 ± 49.49 mg/dL in the disease group.
The two categorical resting parameters were resting ECG and fasting glucose above 120 mg/dL. Among patients without recorded obstructive CAD, 95 of 164 patients (57.93%) had a normal resting ECG, 1 patient (0.61%) had an ST–T wave abnormality, and 68 patients (41.46%) had UCI resting-ECG code 2. Among patients with recorded obstructive CAD, 56 of 139 patients (40.29%) had a normal resting ECG, 3 patients (2.16%) had an ST–T wave abnormality, and 80 patients (57.55%) had UCI code 2. Code 2 represents probable or definite left ventricular hypertrophy by Estes’ ECG criteria in the UCI documentation and does not represent a separately confirmed clinical diagnosis. Fasting glucose above 120 mg/dL was present in 23 patients without recorded obstructive CAD (14.02%) and 22 patients with recorded obstructive CAD (15.83%). The remaining 141 patients without disease (85.98%) and 117 patients with disease (84.17%) had fasting glucose at or below 120 mg/dL.
Descriptive Statistics (Exercise Features)
The two continuous exercise features were maximum achieved heart rate and exercise-related ST depression. Mean maximum heart rate was 158.38 ± 19.20 beats/min in patients without recorded obstructive CAD and 139.26 ± 22.59 beats/min in patients with recorded obstructive CAD. Mean ST depression was 0.59 ± 0.78 in the no-disease group and 1.57 ± 1.30 in the disease group.
The two categorical exercise features were exercise-induced angina and ST slope. Exercise-induced angina was absent in 141 patients without recorded obstructive CAD (85.98%) and present in 23 patients (14.02%). In the disease group, exercise-induced angina was absent in 63 patients (45.32%) and present in 76 patients (54.68%). Among patients without recorded obstructive CAD, 106 patients (64.63%) had an upsloping ST segment, 49 patients (29.88%) had a flat slope, and 9 patients (5.49%) had a downsloping slope. Among patients with recorded obstructive CAD, 36 patients (25.90%) had an upsloping slope, 91 patients (65.47%) had a flat slope, and 12 patients (8.63%) had a downsloping slope.
| Feature set | Feature | No obstructive CAD mean ± SD | Recorded obstructive CAD mean ± SD |
| Resting | Resting blood pressure (mm Hg) | 129.25 ± 16.20 | 134.57 ± 18.77 |
| Resting | Total cholesterol (mg/dL) | 242.64 ± 53.46 | 251.47 ± 49.49 |
| Exercise | Maximum heart rate (beats/min) | 158.38 ± 19.20 | 139.26 ± 22.59 |
| Exercise | ST depression | 0.59 ± 0.78 | 1.57 ± 1.30 |
Values are means ± sample standard deviations. Group sizes were 164 without and 139 with recorded obstructive CAD.
| Feature set | Feature/category | No obstructive CAD Observed (Expected) | Recorded obstructive CAD Observed (Expected) |
| Resting | Resting ECG: normal | 95 (81.73) | 56 (69.27) |
| Resting | Resting ECG: ST–T abnormality | 1 (2.17) | 3 (1.83) |
| Resting | Resting ECG: UCI code 2 | 68 (80.11) | 80 (67.89) |
| Resting | Fasting glucose ≤120 mg/dL | 141 (139.64) | 117 (118.36) |
| Resting | Fasting glucose >120 mg/dL | 23 (24.36) | 22 (20.64) |
| Exercise | Exercise-induced angina: absent | 141 (110.42) | 63 (93.58) |
| Exercise | Exercise-induced angina: present | 23 (53.58) | 76 (45.42) |
| Exercise | ST slope: upsloping | 106 (76.86) | 36 (65.14) |
| Exercise | ST slope: flat | 49 (75.78) | 91 (64.22) |
| Exercise | ST slope: downsloping | 9 (11.37) | 12 (9.63) |
UCI resting-ECG code 2 denotes probable or definite left-ventricular hypertrophy by Estes’ ECG criteria in the repository documentation; it is not a separately confirmed diagnosis.
Overall, the descriptive separation between disease groups was substantially larger for the selected exercise features, particularly maximum heart rate, ST depression, exercise-induced angina, and ST slope. The differences for the selected resting parameters were generally smaller.
Univariate Analyses (Continuous Exercise Features)
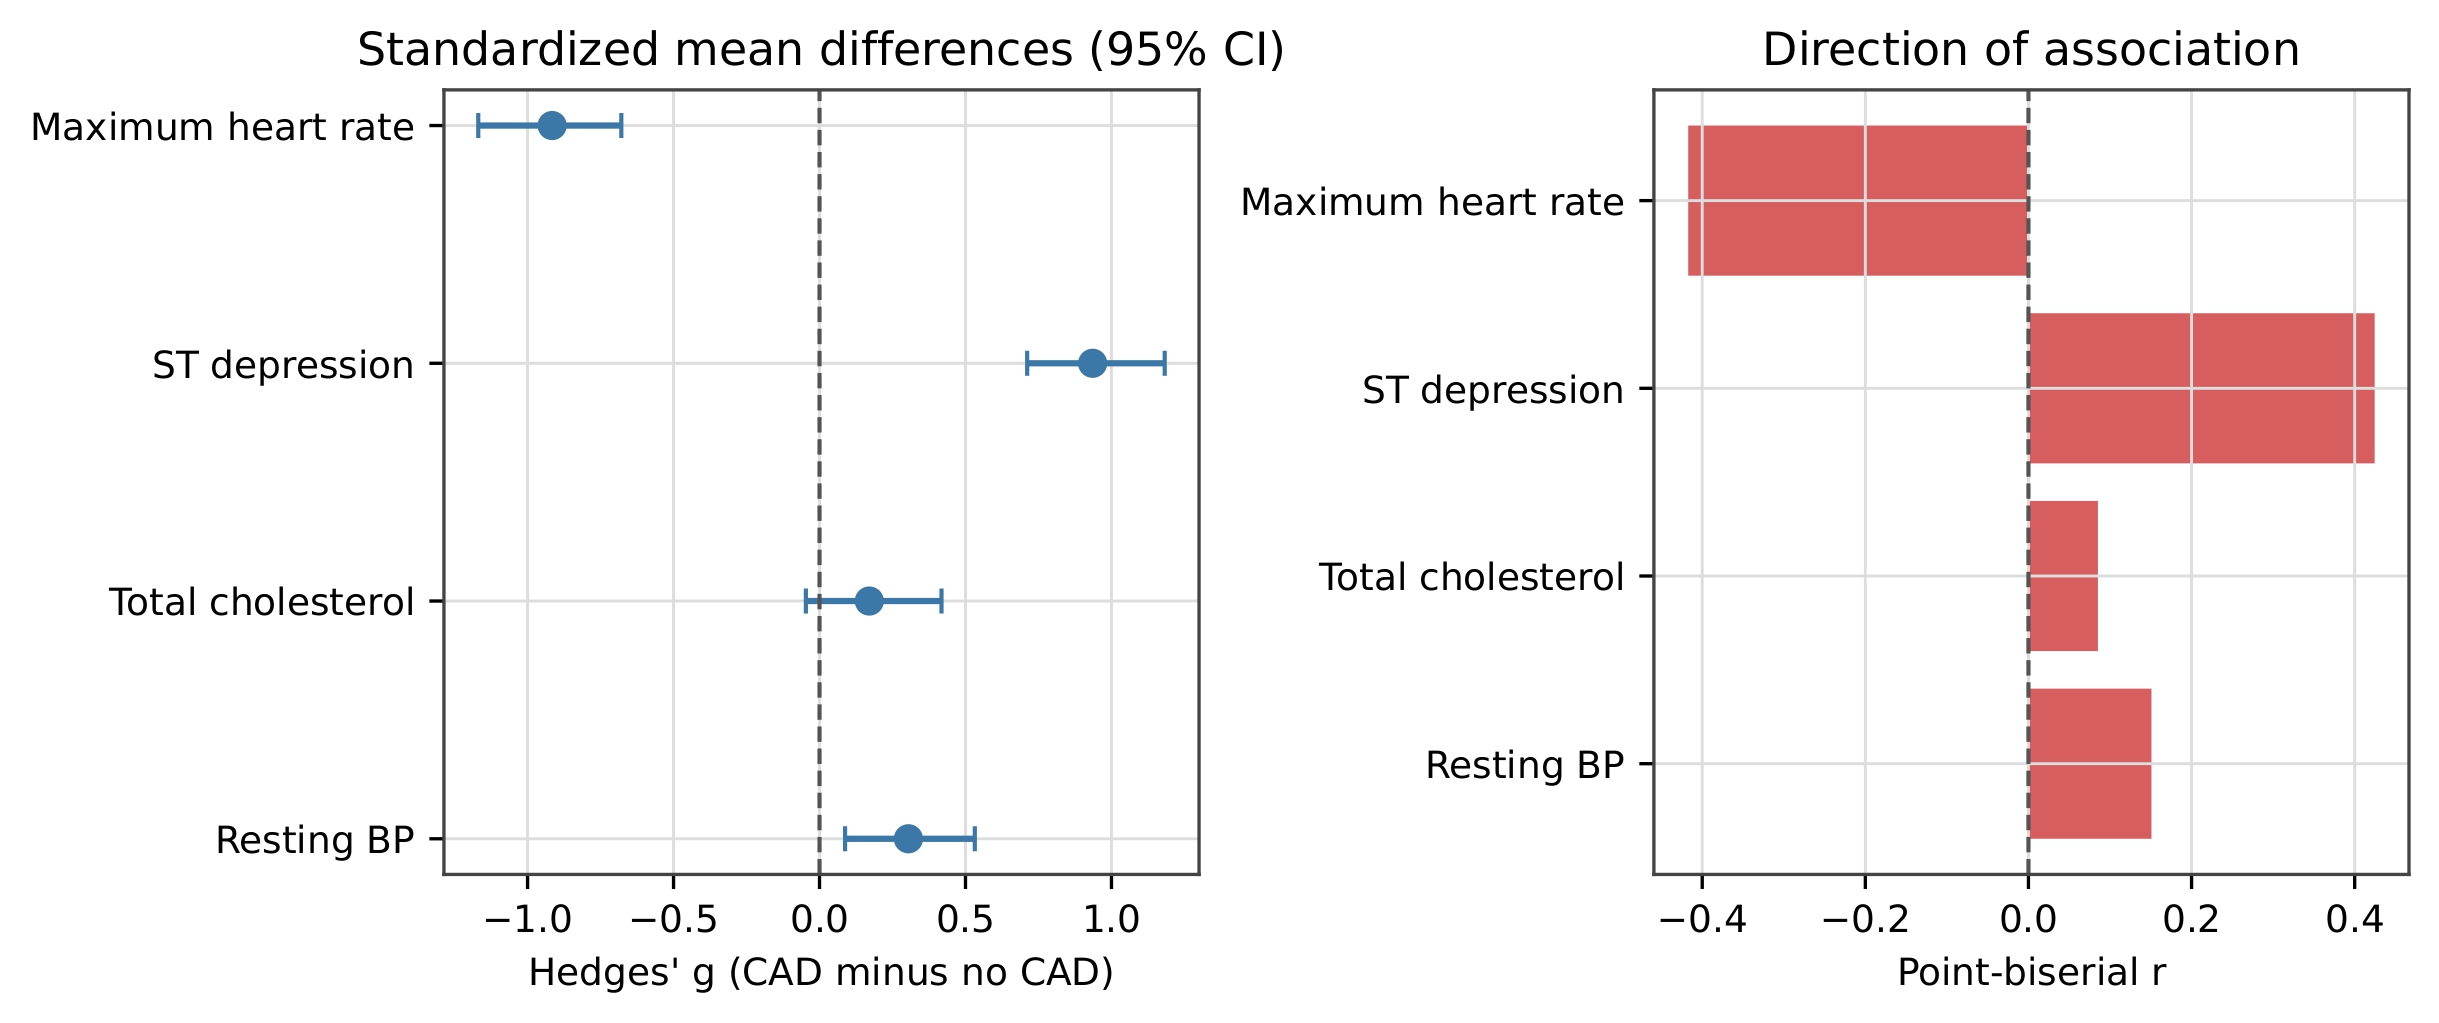
Maximum achieved heart rate demonstrated a strong inverse association with recorded obstructive CAD. The Welch test comparing the disease and no-disease groups produced t=−7.858 with p=9.11×10⁻¹⁴. Hedges’ g was −0.916, with a bootstrap 95% confidence interval (CI) from −1.169 to −0.679, indicating a large standardized difference. The point-biserial correlation was rpb=−0.417 with p=3.46×10⁻¹⁴. The negative values occurred because patients with recorded obstructive CAD achieved lower maximum heart rates. Maximum heart rate had a raw AUROC of 0.255. After applying the same direction-independent AUC*=max(AUC, 1−AUC) calculation to all eight features, maximum heart rate had AUC*=0.745 with a bootstrap 95% CI of 0.690–0.799. It was therefore inverted for ROC plotting without reversing the disease labels.
ST depression demonstrated a strong positive association with recorded obstructive CAD. The Welch test produced t=7.823 with p=2.20×10⁻¹³. Hedges’ g was 0.935, with a bootstrap 95% CI of 0.711–1.182, indicating a large standardized difference. The point-biserial correlation was rpb=0.425 with p=1.10×10⁻¹⁴. ST depression had a raw AUROC and AUC* of 0.735, with a bootstrap 95% CI of 0.678–0.792.
Univariate Analyses (Categorical Exercise Features)
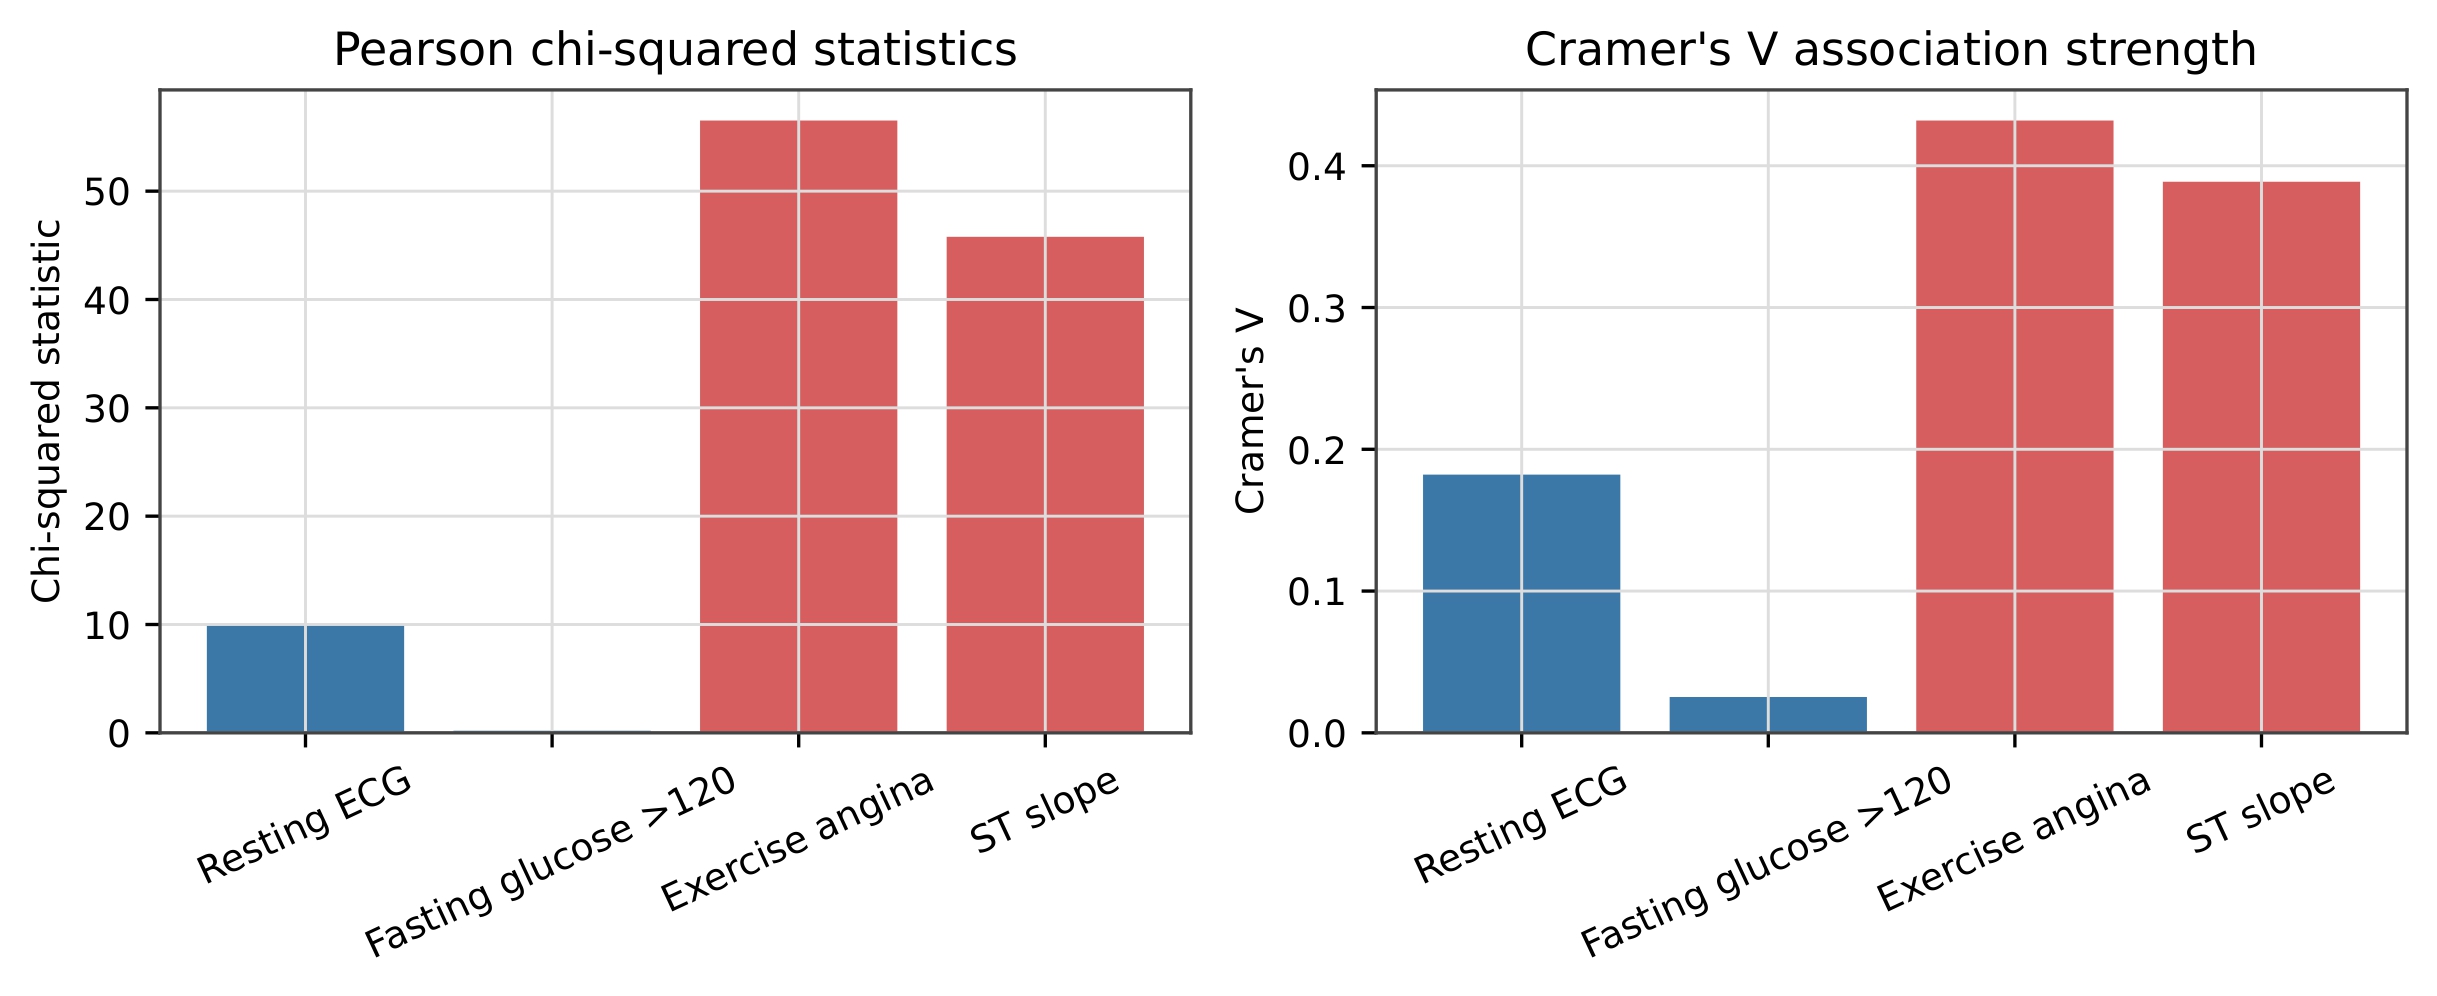
Exercise-induced angina demonstrated the strongest categorical association with recorded obstructive CAD. The Pearson chi-squared test produced χ²=56.519 with 1 degree of freedom and p=5.56×10⁻¹⁴. Cramér’s V was 0.432, indicating a relatively strong association, and the minimum expected count was 45.416. Exercise-induced angina had a raw AUROC and AUC* of 0.703, with a bootstrap 95% CI of 0.654–0.752. Welch testing, Hedges’ g, and point-biserial correlation were not calculated because exercise-induced angina was analyzed as a binary categorical feature.
ST slope also demonstrated a substantial categorical association with recorded obstructive CAD. The Pearson chi-squared test produced χ²=45.785 with 2 degrees of freedom and p=1.14×10⁻¹⁰. Cramér’s V was 0.389, and the minimum expected count was 9.634. ST slope had a pooled out of fold AUROC and AUC* of 0.678, with a bootstrap 95% CI of 0.616–0.735. Welch testing, Hedges’ g, and point-biserial correlation were not calculated because ST slope was analyzed as a multicategory feature.
Univariate Analyses (Continuous Resting Features)
Resting blood pressure demonstrated a smaller positive association with recorded obstructive CAD. The Welch test produced t=2.615 with p=0.00941. Hedges’ g was 0.304, with a bootstrap 95% CI of 0.088–0.532, indicating a small standardized difference. The point-biserial correlation was rpb=0.151 with p=0.00855. Resting blood pressure had a raw AUROC and AUC* of 0.574, with a bootstrap 95% CI of 0.514–0.637.
Total cholesterol showed a weak and nonsignificant relationship with recorded obstructive CAD. The Welch test produced t=1.492 with p=0.137. Hedges’ g was 0.171, with a bootstrap 95% CI from −0.047 to 0.418. The confidence interval crossed zero, indicating that the observed standardized difference was not statistically supported. The point-biserial correlation was rpb=0.085 with p=0.139. Total cholesterol had a raw AUROC and AUC* of 0.570, with a bootstrap 95% CI of 0.510–0.637.
| Set | Feature | Welch t | p | Hedges’ g [95% CI] | rpb (p) | AUC* [95% CI] |
| Exercise | Maximum heart rate | −7.858 | 9.11×10⁻¹⁴ | −0.916 [−1.169, −0.679] | −0.417 (3.46×10⁻¹⁴) | 0.745 [0.690, 0.799] |
| Exercise | ST depression | 7.823 | 2.20×10⁻¹³ | 0.935 [0.711, 1.182] | 0.425 (1.10×10⁻¹⁴) | 0.735 [0.678, 0.792] |
| Resting | Resting blood pressure | 2.615 | 0.00941 | 0.304 [0.088, 0.532] | 0.151 (0.00855) | 0.574 [0.514, 0.637] |
| Resting | Total cholesterol | 1.492 | 0.137 | 0.171 [−0.047, 0.418] | 0.085 (0.139) | 0.570 [0.510, 0.637] |
Hedges’ g is recorded obstructive CAD minus no recorded obstructive CAD. Confidence intervals were estimated using 5,000 bootstrap samples. For maximum heart rate, raw AUROC was 0.255 and AUC*=0.745.
Univariate Analyses (Categorical Resting Features)
Resting ECG produced an overall Pearson chi-squared statistic of χ²=10.052 with 2 degrees of freedom and p=0.00657. Cramér’s V was 0.182, indicating a small association. The minimum expected count was 1.835, which was below 5; therefore, the asymptotic chi-squared result was interpreted cautiously and checked using the fixed-margin Monte Carlo sensitivity analysis described in the Methods (Monte Carlo p=0.00403). Resting ECG had a pooled out of fold AUROC and AUC* of 0.575, with a bootstrap 95% CI of 0.515–0.638. Welch testing, Hedges’ g, and point-biserial correlation were not calculated because resting ECG was analyzed as a multicategory feature.
Fasting glucose above 120 mg/dL produced χ²=0.193 with 1 degree of freedom and p=0.660. Cramér’s V was 0.025, indicating essentially no association, and the minimum expected count was 20.644. Fasting glucose had a raw AUROC and AUC* of 0.509, with a bootstrap 95% CI of 0.501–0.549. Welch testing, Hedges’ g, and point-biserial correlation were not calculated because fasting glucose was analyzed as a binary categorical feature.
| Set | Feature | χ² (df) | p | Cramér’s V | Minimum expected | AUC* [95% CI] |
| Exercise | Exercise-induced angina | 56.519 (1) | 5.56×10⁻¹⁴ | 0.432 | 45.416 | 0.703 [0.654, 0.752] |
| Exercise | ST slope | 45.785 (2) | 1.14×10⁻¹⁰ | 0.389 | 9.634 | 0.678 [0.616, 0.735] |
| Resting | Resting ECG | 10.052 (2) | 0.00657 | 0.182 | 1.835 | 0.575 [0.515, 0.638] |
| Resting | Fasting glucose >120 mg/dL | 0.193 (1) | 0.660 | 0.025 | 20.644 | 0.509 [0.501, 0.549] |
The resting-ECG Pearson result was interpreted cautiously because one expected count was below 5 and was checked with the fixed-margin Monte Carlo sensitivity analysis specified in the Methods (Monte Carlo p=0.00403).
Across the four individual exercise features, mean AUC* was 0.716, compared with 0.557 across the four resting parameters. The paired patient-level bootstrap difference was 0.158, with a 95% CI of 0.107–0.202. These univariate analyses consistently demonstrated associations and descriptive discrimination for the four selected exercise features.
Multivariate Analyses
We performed logistic-regression analysis across different feature selections.
Combined Exercise and Resting Feature Logistic Regression
In the full multivariable logistic-regression analysis, continuous features were standardized so that each odds ratio represented a one-standard-deviation increase. Among the exercise features, maximum achieved heart rate was β=−0.502, standard error (SE)=0.169, odds ratio (OR)=0.606, 95% CI=0.435 – 0.843, and p=0.00294. Thus, a one-standard-deviation increase in maximum heart rate was associated with approximately 39.4% lower conditional odds of recorded obstructive CAD. ST depression had β=0.749, SE=0.199, OR=2.116, 95% CI=1.433–3.124, and p=0.000165. A one-standard-deviation increase in ST depression was therefore associated with approximately 2.12 times the conditional odds of recorded obstructive CAD. For the categorical exercise features, exercise-induced angina had β=1.427, SE=0.322, OR=4.165, 95% CI=2.217–7.825, and p=9.23×10⁻⁶. Records with exercise-induced angina therefore had approximately 4.17 times the conditional odds of recorded obstructive CAD compared with records without exercise-induced angina. ST slope was dummy-coded using upsloping as the reference category. Flat ST slope had β=0.514, SE=0.341, OR=1.671, 95% CI=0.856–3.261, and p=0.132. Downsloping ST slope had β=−0.705, SE=0.733, OR=0.494, 95% CI=0.118–2.078, and p=0.336. Neither individual ST-slope category remained statistically significant in the complete model.
Among the resting parameters, resting blood pressure had β=0.215, SE=0.154, OR=1.240, 95% CI=0.917–1.676, and p=0.162. Total cholesterol had β=0.086, SE=0.147, OR=1.090, 95% CI=0.817–1.454, and p=0.556. Neither continuous resting parameter remained statistically significant after conditioning on the other features in the model. For the categorical resting parameters, fasting glucose above 120 mg/dL had β=0.002, SE=0.406, OR=1.002, 95% CI=0.452–2.223, and p=0.996. Resting ECG was dummy-coded using normal ECG as the reference category. ST–T abnormality versus normal ECG had β=−0.059, SE=1.314, OR=0.943, 95% CI=0.072–12.377, and p=0.964. UCI resting-ECG code 2 versus normal ECG had β=0.453, SE=0.300, OR=1.573, 95% CI=0.873–2.834, and p=0.131. None of these categorical resting parameters remained statistically significant after conditioning on the other model features.
| Set | Predictor | β | SE | OR | 95% CI | p |
| Exercise | Maximum heart rate (per SD) | −0.502 | 0.169 | 0.606 | 0.435–0.843 | 0.00294 |
| Exercise | ST depression (per SD) | 0.749 | 0.199 | 2.116 | 1.433–3.124 | 0.000165 |
| Resting | Resting blood pressure (per SD) | 0.215 | 0.154 | 1.240 | 0.917–1.676 | 0.162 |
| Resting | Total cholesterol (per SD) | 0.086 | 0.147 | 1.090 | 0.817–1.454 | 0.556 |
β, regression coefficient; SE, standard error; OR, odds ratio; CI, confidence interval; SD, standard deviation. Continuous ORs represent a one-standard-deviation increase.
| Set | Predictor | β | SE | OR | 95% CI | p |
| Exercise | Exercise-induced angina: yes vs no | 1.427 | 0.322 | 4.165 | 2.217–7.825 | 9.23×10⁻⁶ |
| Exercise | ST slope: flat vs upsloping | 0.514 | 0.341 | 1.671 | 0.856–3.261 | 0.132 |
| Exercise | ST slope: downsloping vs upsloping | −0.705 | 0.733 | 0.494 | 0.118–2.078 | 0.336 |
| Resting | Fasting glucose >120: yes vs no | 0.002 | 0.406 | 1.002 | 0.452–2.223 | 0.996 |
| Resting | Resting ECG: ST–T abnormality vs normal | −0.059 | 1.314 | 0.943 | 0.072–12.377 | 0.964 |
| Resting | Resting ECG: UCI code 2 vs normal | 0.453 | 0.300 | 1.573 | 0.873–2.834 | 0.131 |
Reference categories were absence of exercise-induced angina, upsloping ST slope, fasting glucose at or below 120 mg/dL, and normal resting ECG. The model intercept was β=−1.047 (SE=0.297; OR=0.351; 95% CI=0.196–0.628; p=0.000426).
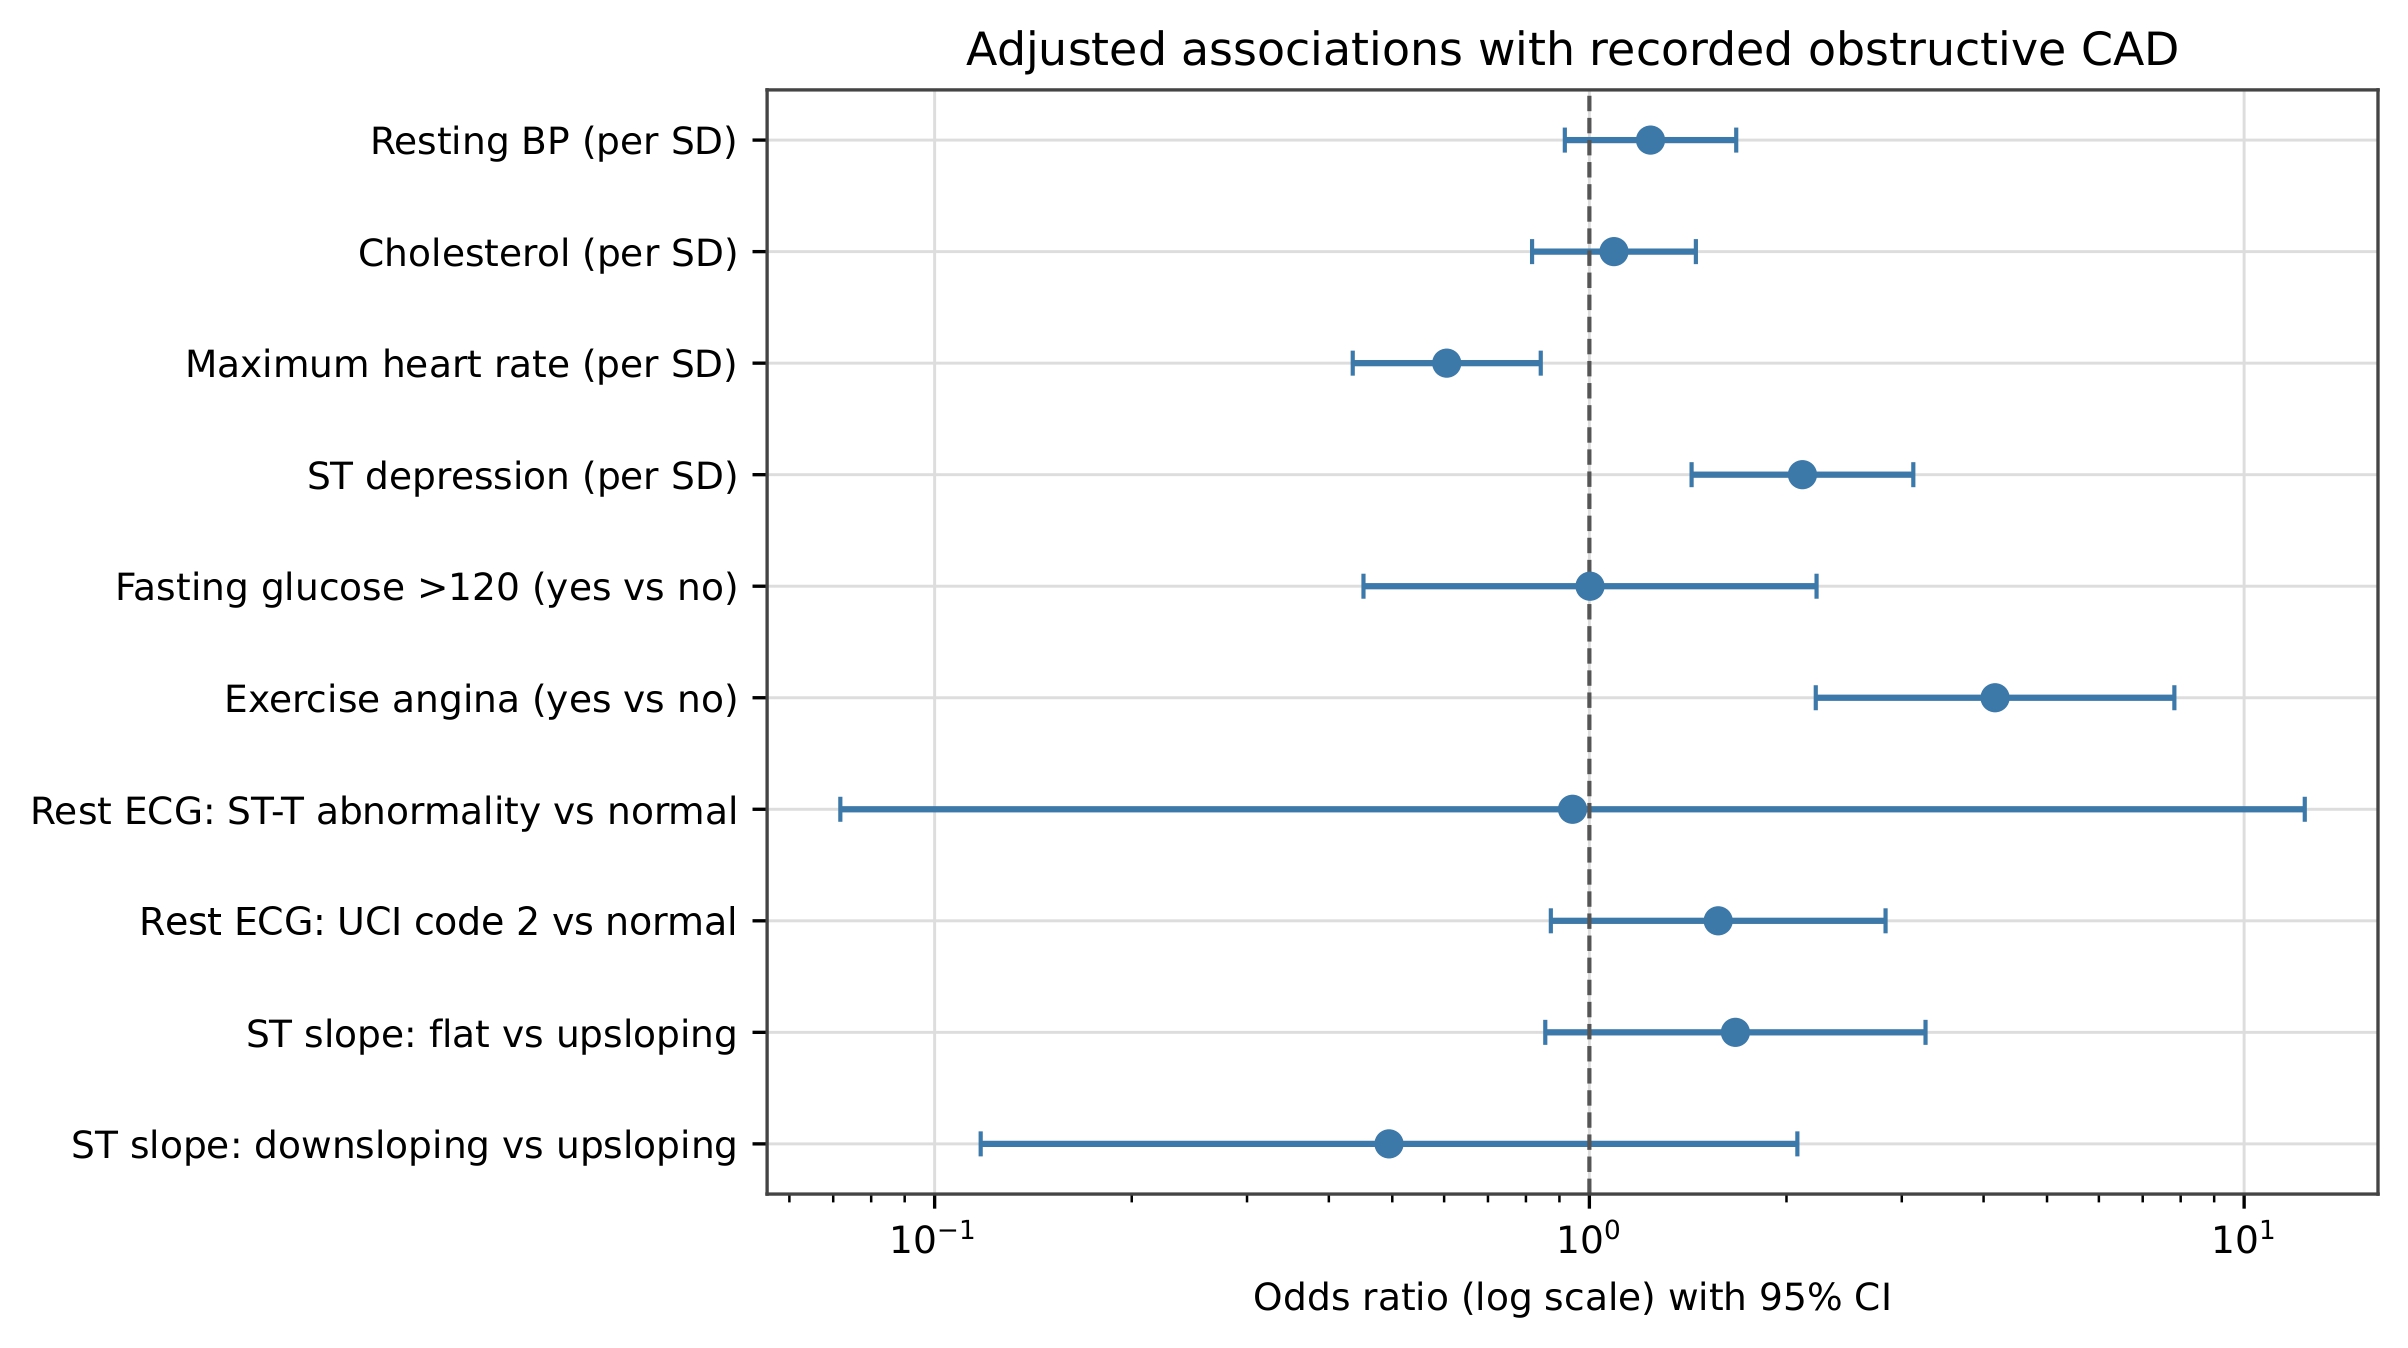
Separate Logistic Regression for Exercise and Resting Features
The exercise-only logistic-regression model was evaluated using shuffled five-fold stratified cross-validation and pooled out-of-fold predictions. Its confusion matrix contained 138 true negatives, 26 false positives, 39 false negatives, and 100 true positives. The model achieved accuracy=0.785, disease-class precision=0.794, disease-class recall=0.719, disease-class F1=0.755, specificity=0.841, and AUROC=0.817 with a bootstrap 95% CI of 0.768–0.865. When no disease was treated as the class of interest, precision was 0.780, recall was 0.841, and F1 was 0.809.
The resting-only model produced 111 true negatives, 53 false positives, 77 false negatives, and 62 true positives. It achieved accuracy=0.571, disease-class precision=0.539, disease-class recall=0.446, disease-class F1=0.488, specificity=0.677, and AUROC=0.604 with a bootstrap 95% CI of 0.540–0.668. When no disease was treated as the class of interest, precision was 0.590, recall was 0.677, and F1 was 0.631.
| Model | Accuracy | Precision | Recall | F1 | Specificity | AUROC [95% CI] |
| Exercise-only | 0.785 | 0.794 | 0.719 | 0.755 | 0.841 | 0.817 [0.768, 0.865] |
| Resting-only | 0.571 | 0.539 | 0.446 | 0.488 | 0.677 | 0.604 [0.540, 0.668] |
Precision, recall, and F1 use recorded obstructive CAD as the positive class. Metrics and confusion matrices were pooled from out-of-fold predictions for all 303 records.
Impact of Age and Sex
Three additional logistic-regression models were evaluated using the same shuffled five-fold stratified cross-validation folds. The model containing age and sex alone achieved an AUROC of 0.707, with a bootstrap 95% CI of 0.651–0.765. Adding the four resting parameters to age and sex increased AUROC to 0.730, with a 95% CI of 0.672–0.784. In comparison, adding the four exercise features to age and sex increased AUROC to 0.846, with a 95% CI of 0.800–0.889.
| Model | AUROC | Bootstrap 95% CI |
| Age and sex | 0.707 | 0.651–0.765 |
| Age and sex + resting parameters | 0.730 | 0.672–0.784 |
| Age and sex + exercise features | 0.846 | 0.800–0.889 |
| Age and sex + all eight features | 0.851 | 0.806–0.892 |
All models used identical shuffled five-fold stratified folds, random seed 42, and pooled out-of-fold probabilities for n=303.
Overall, the multivariable results showed that maximum heart rate, ST depression, and exercise-induced angina retained statistically significant conditional associations with recorded obstructive CAD, whereas the selected resting parameters did not. The cross-validated model results demonstrated the same ordering, with the exercise-feature models showing greater classification performance than the corresponding resting-parameter models.
Hypothesis #2
To assess whether women younger than 55 with recorded obstructive CAD had higher cholesterol levels compared to women aged 55 or older, we first analyzed the averages of the cholesterol values for both women younger than 55 years and women aged 55 years or older. We found that the average cholesterol for women younger than 55 was 323.00±25.46 mg/dL (n=2), while for women aged 55 or older it was 272.09±60.55 mg/dL (n=23). Furthermore, we conducted both a Mann–Whitney U test and a Welch independent t-test. Both tests were used to determine whether the difference in cholesterol levels between the two groups was statistically significant. The exact Mann–Whitney U test was not significant (U=37.5, p=0.20), while the Welch t-test yielded t=2.32, p=0.135. Additionally, a Pearson correlation analysis between age and cholesterol produced an r=−0.313 with p=0.127 (Figure 8). The two women exactly age 55 were included in the older group.
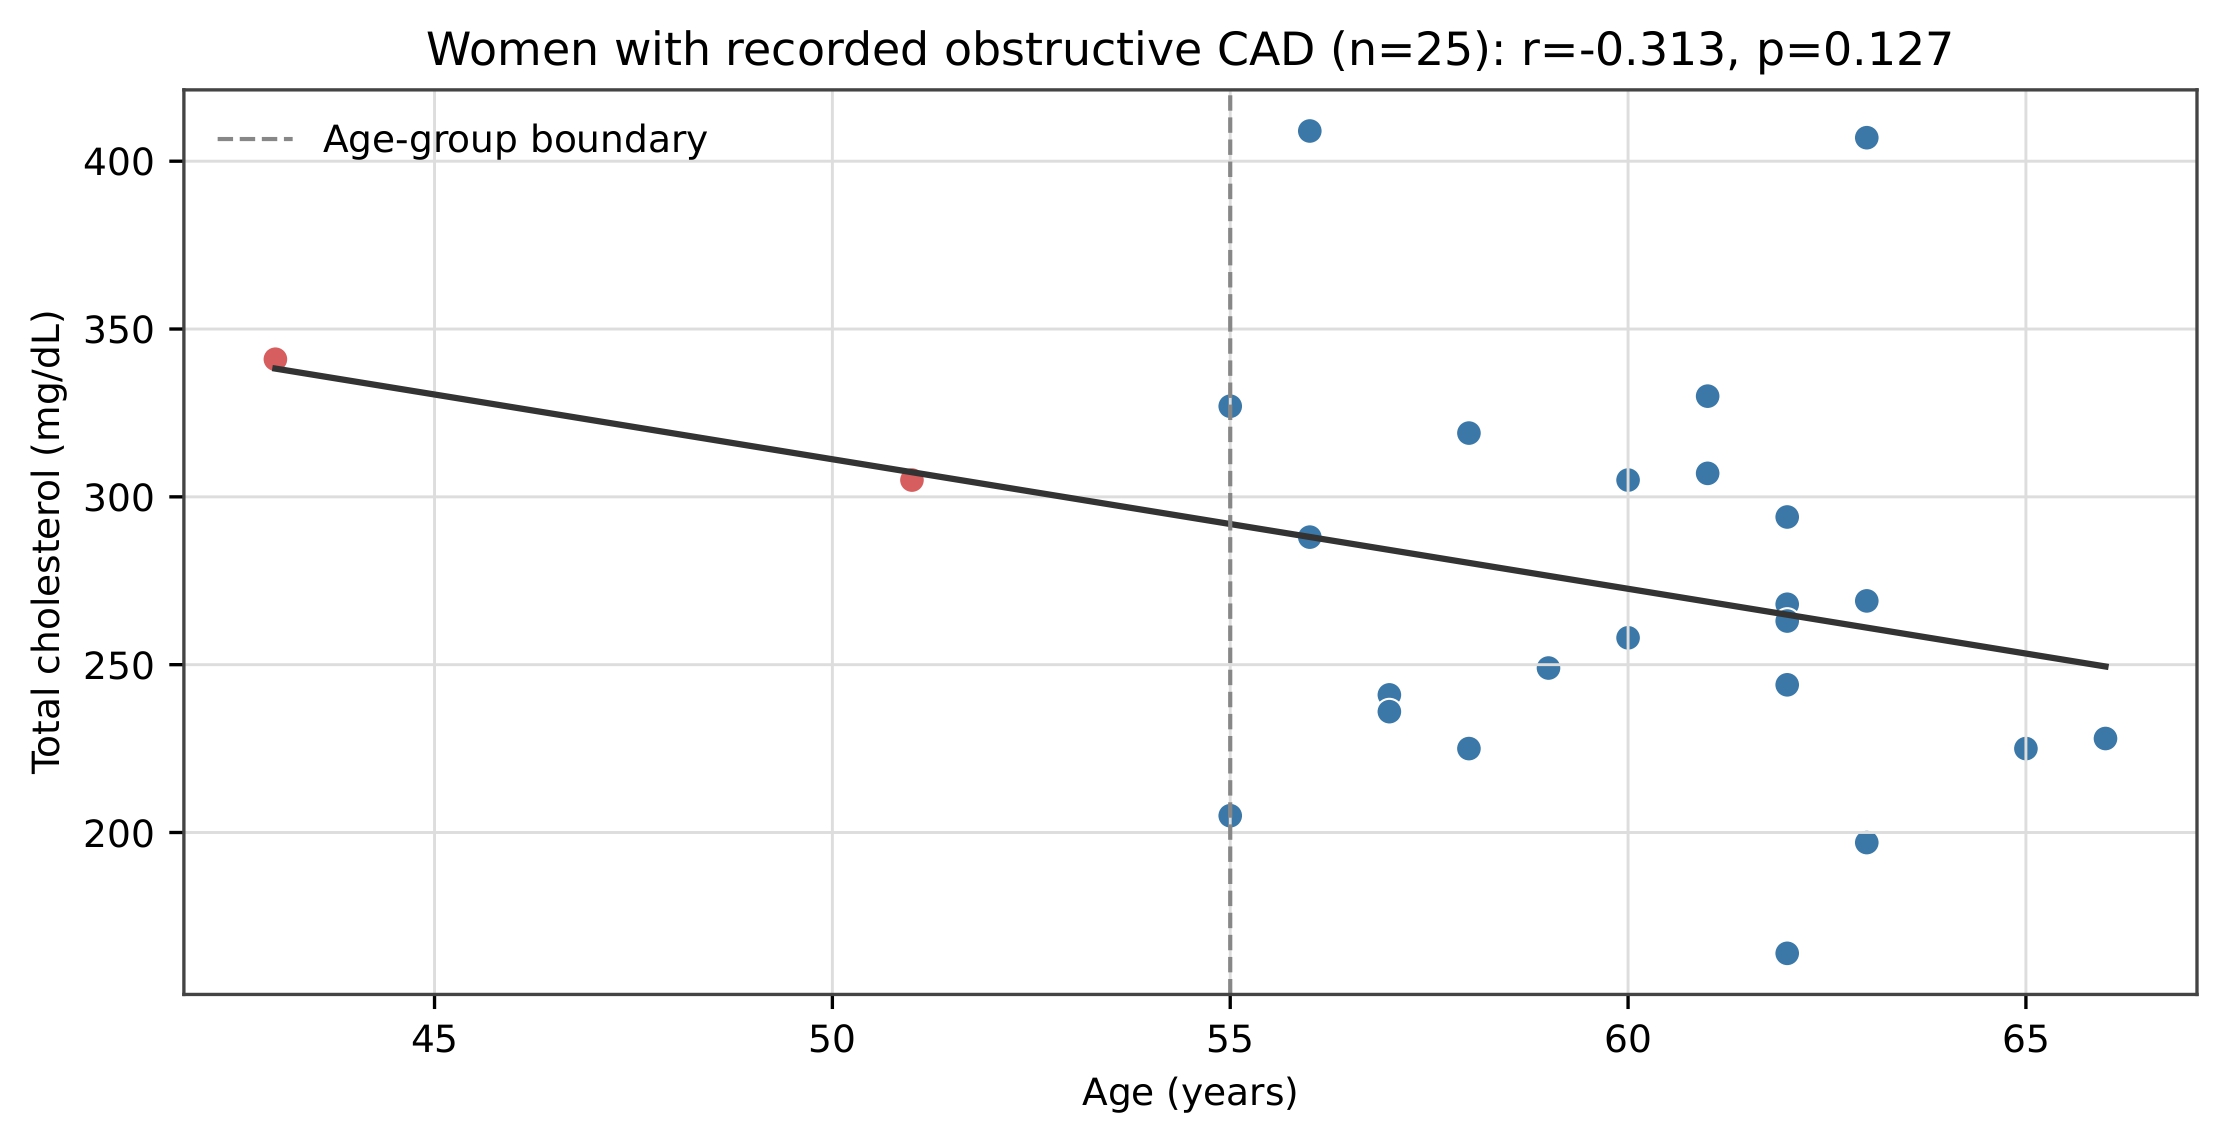
These analyses showed a descriptive trend consistent with our hypothesis that women younger than 55 with recorded obstructive CAD may have higher cholesterol levels than women aged 55 or older, but the difference was not statistically significant in this cohort. Therefore, the hypothesis was not statistically supported. Menopause and estrogen were not measured.
Discussion
Restatement of Key Findings
The study found that exercise-related features, especially maximum heart rate, ST depression, and exercise-induced angina, were strongly associated with recorded obstructive CAD. Among resting features, resting blood pressure and resting ECG showed significant associations before adjustment, but none of the resting variables remained significant in the full multivariable model. Within this dataset, adding exercise features to age and sex substantially improved model discrimination, while adding resting features provided only a small additional benefit. Overall, the findings suggest that exercise-related measurements may be particularly valuable for distinguishing CAD status in this dataset, although further validation in larger and independent populations is needed.
Implications and Significance
The results quantify differences between the selected feature sets in this retrospective dataset. They support further evaluation in larger, independent populations but do not establish that exercise testing is clinically superior to resting risk assessment.
Connection to Objectives:
The primary objective was to statistically quantify associations of the chosen exercise and resting features with recorded obstructive CAD. This objective was addressed: numerical associations were found for both feature groups, with the selected exercise features generally having stronger associations with recorded obstructive CAD. The analysis also aimed to examine whether age and cholesterol were related among women with recorded CAD. In the descriptive analysis, there was a difference between the age groups; however, further statistical analysis was nonsignificant. Therefore, the second hypothesis was not statistically supported.
Recommendation
The findings highlight that exercise-induced angina, maximum heart rate, and ST-segment depression demonstrated significant associations with prevalent obstructive coronary artery disease (CAD) in this dataset. Baseline metabolic panels remain essential for long-term primary prevention and risk stratification11,12,13,14. Future research should expand upon these retrospective observational findings by utilizing larger, multicenter prospective cohorts that include detailed hormonal profiling (such as serum estrogen levels and menopausal status), advanced lipid subfractions (such as LDL, HDL, and Apolipoprotein B), and medication tracking (e.g., statin therapy). Additionally, future studies should employ unselected, sex-balanced populations to more reliably evaluate age- and sex-stratified metabolic interactions without the risk of selection bias inherent to single-center, angiographically referred datasets37.
Limitations
Several key limitations constrain the findings of this study. Methodologically, the reliance on the retrospective, single center Cleveland dataset with a moderate sample size (n=303) limits generalizability to broader clinical populations, and the cohort contains substantial sex imbalances, including a small subgroup of women with recorded obstructive CAD (n=25). The features evaluated across groups are not biologically equivalent; resting metabolic risk factors and dynamic exercise stress metrics measure distinct physiological processes, and exercise parameters themselves are influenced by unmeasured factors such as patient effort, fitness levels, and stress-test protocols3. Furthermore, the dataset lacks critical clinical data, including medication usage (such as statins), lifestyle factors, hormonal profiles (estrogen and menopausal status), and detailed lipid subfractions (LDL/HDL), which restricts the ability to control for confounding. Finally, as a cross-sectional observational analysis without an external validation cohort, the study can only evaluate associations with prevalent angiographic CAD rather than establish causality, future risk, or disease incidence.
Closing Thoughts
Ultimately, this study found that, within the Cleveland dataset, the selected exercise features provided greater discrimination of recorded obstructive CAD. While resting markers remain crucial for long-term cardiometabolic risk screening, exercise measurements assess dynamic physiological responses not captured by resting measurements3,6,15,16. Moving forward, leveraging larger, prospectively tracked cohorts with comprehensive hormonal and lipid data will be essential28,29,30. Determining whether these findings generalize and can inform clinical predictions will require evaluation in different populations24,25.
References
- S. S. Martin, A. W. Aday, Z. I. Almarzooq, C. A. M. Anderson, P. Arora, C. L. Avery, C. M. Baker-Smith, B. Barone Gibbs, A. Z. Beaton, A. K. Boehme, Y. Commodore-Mensah, M. E. Currie, M. S. V. Elkind, K. R. Evenson, G. Generoso, D. G. Heard, S. Hiremath, M. C. Johansen, R. Kalani, D. S. Kazi, D. Ko, J. Liu, J. W. Magnani, E. D. Michos, M. E. Mussolino, S. D. Navaneethan, N. I. Parikh, S. M. Perman, R. Poudel, M. Rezk-Hanna, G. A. Roth, N. S. Shah, M. P. St-Onge, E. L. Thacker, C. W. Tsao, S. M. Urbut, H. G. C. Van Spall, J. H. Voeks, N. Y. Wang, N. D. Wong, S. S. Wong, K. Yaffe, L. P. Palaniappan, American Heart Association Council on Epidemiology and Prevention Statistics Committee and Stroke Statistics Subcommittee. 2024 heart disease and stroke statistics: a report of US and global data from the American Heart Association. Circulation. Vol. 149, pg. e347-e913, 2024, https://doi.org/10.1161/CIR.0000000000001209. [↩]
- P. Libby. The changing landscape of atherosclerosis. Nature. Vol. 592, pg. 524-533, 2021, https://doi.org/10.1038/s41586-021-03392-8. [↩]
- J. Knuuti, W. Wijns, A. Saraste, D. Capodanno, E. Barbato, C. Funck-Brentano, E. Prescott, R. F. Storey, C. Deaton, T. Cuisset, S. Agewall, K. Dickstein, T. Edvardsen, J. Escaned, B. J. Gersh, P. Svitil, M. Gilard, D. Hasdai, R. Hatala, F. Mahfoud, J. Masip, C. Muneretto, M. Valgimigli, S. Achenbach, J. J. Bax, ESC Scientific Document Group. 2019 ESC guidelines for the diagnosis and management of chronic coronary syndromes. Eur Heart J. Vol. 41, pg. 407-477, 2020, https://doi.org/10.1093/eurheartj/ehz425. [↩] [↩] [↩] [↩] [↩] [↩] [↩] [↩] [↩]
- T. Singh, R. Bing, M. R. Dweck, E. J. R. van Beek, N. L. Mills, M. C. Williams, T. C. Villines, D. E. Newby, P. D. Adamson. Exercise electrocardiography and computed tomography coronary angiography for patients with suspected stable angina pectoris: a post hoc analysis of the randomized SCOT-HEART trial. JAMA Cardiol. Vol. 5, pg. 920–928, 2020, https://doi.org/10.1001/jamacardio.2020.1567. [↩]
- P. Schlattmann, V. Wieske, K. K. Bressem, T. Götz, G. M. Schuetz, D. Andreini, G. Pontone, H. Alkadhi, J. Hausleiter, E. Zimmermann, B. Gerber, A. A. Shabestari, M. F. L. Meijs, A. Sato, K. A. Øvrehus, S. M. M. Jenkins, J. Knuuti, A. Hamdan, B. A. Halvorsen, V. Mendoza-Rodriguez, J. Rixe, Y. L. Wan, C. Langer, S. Leschka, E. Martuscelli, S. Ghostine, J. C. Tardif, A. R. Sánchez, R. Haase, M. Dewey. The effectiveness of coronary computed tomography angiography and functional testing for the diagnosis of obstructive coronary artery disease: results from the individual patient data Collaborative Meta-Analysis of Cardiac CT (COME-CCT). Insights Imaging. Vol. 15, pg. 208, 2024, https://doi.org/10.1186/s13244-024-01702-y. [↩] [↩] [↩] [↩] [↩]
- L. D. Rasmussen, S. E. Schmidt, J. Knuuti, D. E. Newby, T. Singh, K. Nieman, T. W. Galema, C. Vrints, M. Bøttcher, S. Winther. Exercise electrocardiography for pre-test assessment of the likelihood of coronary artery disease. Heart. Vol. 110, pg. 263-270, 2024, https://doi.org/10.1136/heartjnl-2023-322970. [↩] [↩] [↩] [↩] [↩] [↩] [↩]
- P. Lacolley, V. Regnault, P. Segers, S. Laurent. Vascular smooth muscle cells and arterial stiffening: relevance in development, aging, and disease. Physiol Rev. Vol. 97, pg. 1555-1617, 2017, https://doi.org/10.1152/physrev.00003.2017. [↩]
- A. C. Flint, C. Conell, X. Ren, N. M. Banki, S. L. Chan, V. A. Rao, R. B. Melles, D. L. Bhatt. Effect of systolic and diastolic blood pressure on cardiovascular outcomes. N Engl J Med. Vol. 381, pg. 243-251, 2019, https://doi.org/10.1056/NEJMoa1803180. [↩]
- F. Qafoud, K. Kunji, M. Elshrif, A. Althani, A. Salam, J. Al Suwaidi, D. Darbar, N. Asaad, M. Saad. Correlations between resting electrocardiogram findings and disease profiles: insights from the Qatar Biobank cohort. J Clin Med. Vol. 13, pg. 276, 2024, https://doi.org/10.3390/jcm13010276. [↩]
- Y. Kaolawanich, R. Thongsongsang, T. Songsangjinda, T. Boonyasirinant. Clinical values of resting electrocardiography in patients with known or suspected chronic coronary artery disease: a stress perfusion cardiac MRI study. BMC Cardiovasc Disord. Vol. 21, pg. 621, 2021, https://doi.org/10.1186/s12872-021-02440-5. [↩]
- American Diabetes Association Professional Practice Committee. Diagnosis and classification of diabetes: standards of care in diabetes—2026. Diabetes Care. Vol. 49, pg. S27–S49, 2026, https://doi.org/10.2337/dc26-S002. [↩] [↩]
- N. Hashemi Madani, F. Ismail-Beigi, H. Poustchi, M. Nalini, S. G. Sepanlou, M. Malek, M. A. Abbasi, A. Khajavi, M. E. Khamseh, R. Malekzadeh. Impaired fasting glucose and major adverse cardiovascular events by hypertension and dyslipidemia status: the Golestan cohort study. BMC Cardiovasc Disord. Vol. 20, pg. 113, 2020, https://doi.org/10.1186/s12872-020-01390-8. [↩] [↩]
- B. A. Ference, H. N. Ginsberg, I. Graham, K. K. Ray, C. J. Packard, E. Bruckert, R. A. Hegele, R. M. Krauss, F. J. Raal, H. Schunkert, G. F. Watts, J. Borén, S. Fazio, J. D. Horton, L. Masana, S. J. Nicholls, B. G. Nordestgaard, B. van de Sluis, M. R. Taskinen, L. Tokgözoglu, U. Landmesser, U. Laufs, O. Wiklund, J. K. Stock, M. J. Chapman, A. L. Catapano. Low-density lipoproteins cause atherosclerotic cardiovascular disease. 1. Evidence from genetic, epidemiologic, and clinical studies: a consensus statement from the European Atherosclerosis Society Consensus Panel. Eur Heart J. Vol. 38, pg. 2459-2472, 2017, https://doi.org/10.1093/eurheartj/ehx144. [↩] [↩] [↩]
- F. Mach, C. Baigent, A. L. Catapano, K. C. Koskinas, M. Casula, L. Badimon, M. J. Chapman, G. G. De Backer, V. Delgado, B. A. Ference, I. M. Graham, A. Halliday, U. Landmesser, B. Mihaylova, T. R. Pedersen, G. Riccardi, D. J. Richter, M. S. Sabatine, M. R. Taskinen, L. Tokgozoglu, O. Wiklund, ESC Scientific Document Group. 2019 ESC/EAS guidelines for the management of dyslipidaemias: lipid modification to reduce cardiovascular risk. Eur Heart J. Vol. 41, pg. 111-188, 2020, https://doi.org/10.1093/eurheartj/ehz455. [↩] [↩] [↩]
- A. Sinha, U. Dutta, O. M. Demir, K. De Silva, H. Ellis, S. Belford, M. Ogden, M. Li Kam Wa, H. P. Morgan, A. M. Shah, A. Chiribiri, A. J. Webb, M. Marber, H. Rahman, D. Perera. Rethinking false-positive exercise electrocardiographic stress tests by assessing coronary microvascular function. J Am Coll Cardiol. Vol. 83, pg. 291-299, 2024, https://doi.org/10.1016/j.jacc.2023.10.034. [↩] [↩]
- R. Katheria, S. K. Setty, B. S. Arun, P. Bhat, H. V. Jagadeesh, C. N. Manjunath. Significance of recovery ST-segment depression in exercise stress testing. Indian Heart J. Vol. 73, pg. 693-696, 2021, https://doi.org/10.1016/j.ihj.2021.10.001. [↩] [↩]
- A. Carlén, M. Gustafsson, M. Åström Aneq, E. Nylander. Exercise-induced ST depression in an asymptomatic population without coronary artery disease. Scand Cardiovasc J. Vol. 53, pg. 206-212, 2019, https://doi.org/10.1080/14017431.2019.1626021. [↩]
- S. Li, Y. Yuan, L. Zhao, T. Lv, F. She, F. Liu, Y. Xue, B. Zhou, Y. Xie, Y. Geng, P. Zhang. Coronary stenosis is a risk marker for impaired cardiac function on cardiopulmonary exercise testing. BMC Cardiovasc Disord. Vol. 22, pg. 486, 2022, https://doi.org/10.1186/s12872-022-02935-9. [↩]
- B. Akıncı Özyürek, Ş. Savaş Bozbaş, A. Aydınalp, H. Bozbaş, G. Ulubay. Value of cardiopulmonary exercise testing in the diagnosis of coronary artery disease. Tuberk Toraks. Vol. 67, pg. 102-107, 2019, https://doi.org/10.5578/tt.68200. [↩] [↩]
- M. Whitman, C. Jenkins, S. Sabapathy, L. Adams. Comparison of heart rate-blood pressure product versus age-predicted maximum heart rate as predictors of cardiovascular events during exercise stress echocardiography. Am J Cardiol. Vol. 124, pg. 528-533, 2019, https://doi.org/10.1016/j.amjcard.2019.05.027. [↩]
- P. Thorild, G. Mourtzinis. The value of exercise electrocardiography in outpatients with stable chest pain and low pre-test probability of significant coronary artery disease. J Clin Med. Vol. 12, pg. 4670, 2023, https://doi.org/10.3390/jcm12144670. [↩]
- R. J. Gibbons, D. Carryer, D. Hodge, T. D. Miller, V. L. Roger, J. W. Askew. Stress testing in the evaluation of stable chest pain in a community population. Mayo Clin Proc. Vol. 95, pg. 319-327, 2020, https://doi.org/10.1016/j.mayocp.2019.08.005. [↩] [↩]
- Y. H. Lee, T. H. Tsai, J. H. Chen, C. J. Huang, C. E. Chiang, C. H. Chen, H. M. Cheng. Machine learning of treadmill exercise test to improve selection for testing for coronary artery disease. Atherosclerosis. Vol. 340, pg. 23–27, 2022, https://doi.org/10.1016/j.atherosclerosis.2021.11.028. [↩]
- J. J. Jang, M. Bhapkar, A. Coles, S. Vemulapalli, C. B. Fordyce, K. L. Lee, J. E. Udelson, U. Hoffmann, J. C. Tardif, W. S. Jones, D. B. Mark, V. L. Sorrell, A. Espinoza, P. S. Douglas, M. R. Patel, PROMISE Investigators. Predictive model for high-risk coronary artery disease. Circ Cardiovasc Imaging. Vol. 12, pg. e007940, 2019, https://doi.org/10.1161/CIRCIMAGING.118.007940. [↩] [↩]
- R. Senior, H. R. Reynolds, J. K. Min, D. S. Berman, M. H. Picard, B. R. Chaitman, L. J. Shaw, C. B. Page, S. C. Govindan, J. Lopez-Sendon, J. Peteiro, G. S. Wander, J. Drozdz, J. Marin-Neto, J. B. Selvanayagam, J. D. Newman, C. Thuaire, J. Christopher, J. J. Jang, R. Y. Kwong, S. Bangalore, G. W. Stone, S. M. O’Brien, W. E. Boden, D. J. Maron, J. S. Hochman, ISCHEMIA Research Group. Predictors of left-main coronary artery disease in the ISCHEMIA trial. J Am Coll Cardiol. Vol. 79, pg. 651-661, 2022, https://doi.org/10.1016/j.jacc.2021.11.052. [↩] [↩]
- J. Reeh, C. B. Therming, M. Heitmann, S. Højberg, C. Sørum, J. Bech, D. Husum, H. Dominguez, T. Sehestedt, T. Hermann, K. W. Hansen, L. Simonsen, S. Galatius, E. Prescott. Prediction of obstructive coronary artery disease and prognosis in patients with suspected stable angina. Eur Heart J. Vol. 40, pg. 1426–1435, 2019, https://doi.org/10.1093/eurheartj/ehy806. [↩]
- B. Wu, B. Fan, Y. Qu, C. Li, J. Chen, Y. Liu, J. Wang, T. Zhang, Y. Chen. Trajectories of blood lipids profile in midlife women: does menopause matter? J Am Heart Assoc. Vol. 12, pg. e030388, 2023, https://doi.org/10.1161/JAHA.123.030388. [↩]
- J. Lew, M. Sanghavi, C. R. Ayers, D. K. McGuire, T. Omland, D. Atzler, M. O. Gore, I. Neeland, J. D. Berry, A. Khera, A. Rohatgi, J. A. de Lemos. Sex-based differences in cardiometabolic biomarkers. Circulation. Vol. 135, pg. 544-555, 2017, https://doi.org/10.1161/CIRCULATIONAHA.116.023005. [↩] [↩]
- J. Park, M. K. Son, H. Y. Park. Substantial lipid increases during menopausal transition in Korean middle-aged women. J Korean Med Sci. Vol. 38, pg. e238, 2023, https://doi.org/10.3346/jkms.2023.38.e238. [↩] [↩]
- Q. Wang, D. L. S. Ferreira, S. M. Nelson, N. Sattar, M. Ala-Korpela, D. A. Lawlor. Metabolic characterization of menopause: cross-sectional and longitudinal evidence. BMC Med. Vol. 16, pg. 17, 2018, https://doi.org/10.1186/s12916-018-1008-8. [↩] [↩]
- G. L. Clayton, A. Gonçalves Soares, F. Kilpi, A. Fraser, P. Welsh, N. Sattar, S. M. Nelson, K. Tilling, D. A. Lawlor. Cardiovascular health in the menopause transition: a longitudinal study of up to 3892 women with up to four repeated measures of risk factors. BMC Med. Vol. 20, pg. 299, 2022, https://doi.org/10.1186/s12916-022-02454-6. [↩]
- A. Janosi, W. Steinbrunn, M. Pfisterer, R. Detrano. Heart Disease [dataset]. UCI Machine Learning Repository. 1989, https://doi.org/10.24432/C52P4X. Accessed August 8, 2026. [↩] [↩] [↩] [↩]
- R. Detrano, A. Janosi, W. Steinbrunn, M. Pfisterer, J. J. Schmid, S. Sandhu, K. H. Guppy, S. Lee, V. Froelicher. International application of a new probability algorithm for the diagnosis of coronary artery disease. Am J Cardiol. Vol. 64, pg. 304–310, 1989, https://doi.org/10.1016/0002-9149(89)90524-9. [↩] [↩]
- C. R. Harris, K. J. Millman, S. J. van der Walt, R. Gommers, P. Virtanen, D. Cournapeau, E. Wieser, J. Taylor, S. Berg, N. J. Smith, R. Kern, M. Picus, S. Hoyer, M. H. van Kerkwijk, M. Brett, A. Haldane, J. F. Del Río, M. Wiebe, P. Peterson, P. Gérard-Marchant, K. Sheppard, T. Reddy, W. Weckesser, H. Abbasi, C. Gohlke, T. E. Oliphant. Array programming with NumPy. Nature. Vol. 585, pg. 357-362, 2020, https://doi.org/10.1038/s41586-020-2649-2. [↩]
- P. Virtanen, R. Gommers, T. E. Oliphant, M. Haberland, T. Reddy, D. Cournapeau, E. Burovski, P. Peterson, W. Weckesser, J. Bright, S. J. van der Walt, M. Brett, J. Wilson, K. J. Millman, N. Mayorov, A. R. J. Nelson, E. Jones, R. Kern, E. Larson, C. J. Carey, İ. Polat, Y. Feng, E. W. Moore, J. VanderPlas, D. Laxalde, J. Perktold, R. Cimrman, I. Henriksen, E. A. Quintero, C. R. Harris, A. M. Archibald, A. H. Ribeiro, F. Pedregosa, P. van Mulbregt, SciPy 1.0 Contributors. SciPy 1.0: fundamental algorithms for scientific computing in Python. Nat Methods. Vol. 17, pg. 261-272, 2020, https://doi.org/10.1038/s41592-019-0686-2. [↩]
- F. Pedregosa, G. Varoquaux, A. Gramfort, V. Michel, B. Thirion, O. Grisel, M. Blondel, P. Prettenhofer, R. Weiss, V. Dubourg, J. Vanderplas, A. Passos, D. Cournapeau, M. Brucher, M. Perrot, E. Duchesnay. Scikit-learn: machine learning in Python. J Mach Learn Res. Vol. 12, pg. 2825-2830, 2011, https://doi.org/10.5555/1953048.2078195. [↩]
- H. R. Reynolds, D. D. Cyr, C. N. B. Merz, L. J. Shaw, B. R. Chaitman, W. E. Boden, K. P. Alexander, Y. D. Rosenberg, S. Bangalore, G. W. Stone, C. Held, J. Spertus, K. Goetschalckx, O. Bockeria, J. D. Newman, J. S. Berger, A. Elghamaz, R. D. Lopes, J. K. Min, D. S. Berman, M. H. Picard, R. Y. Kwong, R. A. Harrington, B. Thomas, S. M. O’Brien, D. J. Maron, J. S. Hochman, ISCHEMIA Research Group. Sex differences in revascularization, treatment goals, and outcomes of patients with chronic coronary disease: insights from the ISCHEMIA trial. J Am Heart Assoc. Vol. 13, pg. e029850, 2024, https://doi.org/10.1161/JAHA.122.029850. [↩]