
Abstract
A student’s habits, such as time management and study techniques, are closely linked to their academic performance. Additionally, their home life, access to resources, and amount of scholastic support play a crucial role. This study involves a dataset which considers factors such as sleep patterns, study habits, and socioeconomic background to predict the students’ final grades. This study uses a neural network regressor, a powerful machine learning model, to make these predictions and assess the correlation between these factors and the final outcomes. Cross-validation was used to identify parameters for the training process which would maximize the model’s final accuracy. The final R2 value of the model is  , and the final mean squared error is 2.0. This suggests that these factors are strong predictors of student academic performance. This modelling approach helps identify key factors associated with student performance, which in turn can be used to implement personalized learning experiences. To improve the model’s accuracy, more up-to-date data could be used for training. Furthermore, the study could perform rigorous calculation of the relative importance of different features on the final prediction. This study does not involve human subjects or any personal data requiring consent.
Keywords: Machine learning, education, neural networks, demographics
Introduction
Research shows that 20-50% of students experience daytime sleepiness, which easily affects their school performance. Daytime sleepiness represents just one of numerous factors and variables, some being environmental conditions, family support, and access to educational resources. Machine learning models such as neural network regressors can be used to accurately predict and analyze the relationship between these different factors in a student’s academic performance. Recent applications of educational data mining have demonstrated that machine learning algorithms, such as Random Forests and Support Vector Machines, can achieve classification accuracies of over 70% in predicting student outcomes, significantly outperforming traditional baseline methods1.
Literature Review: Academic Performance
Throughout this section, the percentages in parentheses show how many students in a survey stated that these factors had the most influence on their academic achievement and success2.
Family Background
Research shows that a student’s family background plays a significant role in their academic achievement. The education level of the family is particularly influential. Educated families provide more academic support (according to 45% of participants), helping with homework and school-related tasks. They often serve as role models (25%), with children imitating their parents’ learning behaviors. Additionally, families who show greater concern (15%) about their child’s education foster stronger academic focus. Exposure to an intellectual environment (10%) in the home enhances cognitive development, and motivational support (5%) from parents further encourages academic ambition.
Family Stress and Socioeconomic Status
High levels of family stress, financial instability, or household conflict can negatively affect a student’s ability to concentrate and succeed3. Specific disadvantages, such as sickness-related absences, have been shown to disproportionately impact grades for students from lower socioeconomic backgrounds compared to their wealthier peers4.These stressors often lead to anxiety, distraction, and lack of motivation, reducing academic performance. Conversely, a supportive and stable home environment can help students stay engaged and motivated. Socioeconomic status also has a strong correlation with academic performance. Recent meta-analyses indicate that this correlation has actually strengthened in the post-2000s educational landscape5. Students from higher-income families generally perform better due to increased access to educational resources, private tutoring, and extracurricular activities. Both parental education level and family income are strong predictors of student success. Furthermore, parental involvement, a resource often constrained by economic instability, remains a critical, independent predictor of student engagement and final grades6.
School Resources and Environment
The physical conditions of a school are directly linked to student performance. Well-maintained schools with resources like smart boards, laboratories, and libraries enhance learning (48%); increase motivation (28%), and encourage creativity (24%). Effective school management is equally important. When a school is well-operated (52%) and has a positive administrative attitude (48%), it promotes a sense of discipline, structure, and belonging, which are key drivers of academic success. According to Ozcan (2021), effective school management is defined by its ability to maintain discipline and prevent complacency among staff and students. In their qualitative analysis, “well-operated” schools are characterized as those where management enforces clear values and rules, ensuring that the educational environment does not suffer from the negligence or ‘easy-going’ attitudes that lead to academic failure.
The surrounding environment of the school also has an impact. A focused and distraction-free setting enhances student motivation (40%), while the presence of nearby distractions (like cafes or shopping centers) has a negative social effect (40%). A culturally rich and educated community around the school contributes to better outcomes (20%) for its students. This means that students get the support they need from parents, teachers, and peers, and that they are surrounded by conscious, well-informed people.
Teacher Influence
Teachers are a critical component of academic success. Their professional competence (27%)—including subject knowledge and teaching ability—has a strong impact on student understanding. Teachers also act as role models (19%), influencing students’ attitudes toward education. Strong communication skills (19%) between teachers and students build confidence and engagement. A teacher’s attitude (16%), ability to motivate (11%), and role in offering guidance (8%) all contribute meaningfully to student outcomes.
Learning Facilities and Guidance
Access to learning facilities such as libraries and computer labs has a measurable effect on academic performance. A well-equipped environment supports student engagement, research, and study habits, while students without these resources may struggle to keep up.
Additionally, proper guidance from parents, teachers, and mentors is vital. Structured advice on study techniques, career planning, and academic strategies can greatly improve performance. In contrast, a lack of guidance may lead to poor decision-making and reduced motivation.
Student Habits
A student’s personal habits play a significant role in their academic journey. Communication skills, particularly in the language of instruction, are crucial for understanding, participating, and expressing ideas effectively. Poor communication may result in misunderstanding concepts and lower grades.
Sleep habits are also important. Most notably, a large-scale 2025 study of over 165,000 students identified a distinct inverted-U relationship between sleep and grades, establishing that deviations from the optimal 8–9 hour window significantly impede academic performance7. According to a study done in 2012, the relationship between sleep and academic performance is non-linear; both too little and too much sleep can negatively affect grades8. The authors find that an optimal sleep range, which varies with age, is associated with better cognitive performance. In particular, they find that the optimal range as a function of age, can be calculated using the formula
(1) 
where  is the
  coefficient,
  is the
  coefficient,
  is the
  coefficient, and
  is the
  coefficient. However, the original study does not provide universal numerical values for the coefficients , , , and , as these parameters vary based on factors such as age distribution, socioeconomic background, and assessment types. Although prior research identifies a nonlinear relationship between sleep and academic performance as a function of age, the dataset used in this study does not include students’ ages. Because the data is a synthetic dataset created for educational purposes and was not collected from real people, certain variables such as age were not provided. As a result of this limitation, the optimal-sleep formula discussed above cannot be incorporated into the predictive model. Future studies using datasets with demographic information could explore how sleep interacts with age to influence academic outcomes more accurately.
The amount of time spent studying also matters, but not in a simple way9. Academic performance is not directly proportional to the number of hours spent studying. Instead, studying quality and efficient techniques matter more. Students with better strategies can perform well in less time, while those with poor habits may struggle despite longer hours.
Finally, class attendance is positively correlated with academic performance10. Students who attend more classes tend to earn higher grades. Interestingly, even missing the first day of class can impact performance, especially in easier courses, where the effect is more pronounced. In this context, an “easier course” refers to introductory-level classes or those in which the pace is slower and there are fewer prerequisites, where early material is foundational to later topics.
Methods
Although the literature review identifies many detailed components of family background (parental education, household stability, and stress), the dataset used in this study provides a single socioeconomic score that aggregates economic and educational conditions. This score therefore serves as a practical representation of the broader family context discussed in the literature: higher values generally correspond to greater economic stability, higher parental education levels, and increased availability of academic resources, while lower values reflect conditions associated with financial stress, fewer educational materials, and reduced academic support.
In addition, this review defines many other factors affecting academic performance, such as school resources, teacher quality, communication skills, and family support. However, these resources were not included in the predictive model as they were not available in the dataset used for this study. As a result, the model focuses on the four features that were consistently measured across all students. This represents a limitation of the current work, and future studies should incorporate a wider range of variables in order to encapsulate all of the information highlighted in the review.
Neural Networks
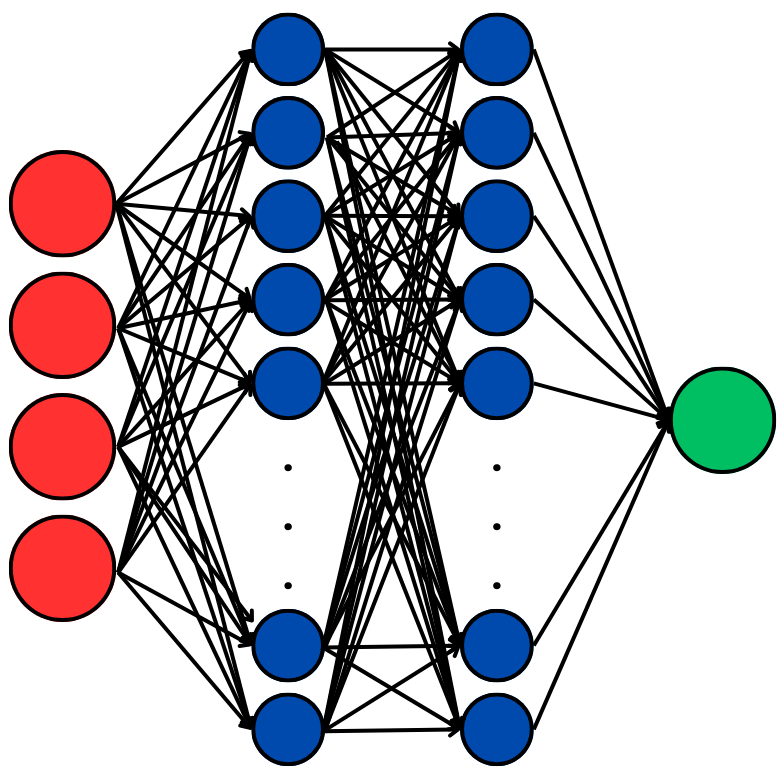
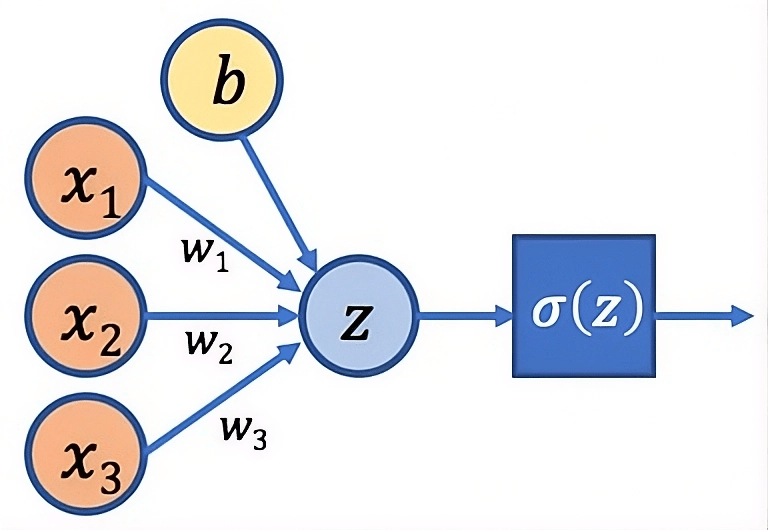
A neural network is a machine learning model that loosely mimics the functions of the human brain, via interconnected neurons (Fig. 1)11. Each neuron has weights and biases associated with it. The neuron computes WX+b, where W is a weight matrix, X is a matrix of inputs to the neuron, and b is a bias. After computing WX+b, an activation function is applied to introduce nonlinearity and roughly mimic the idea of a neuron firing when the signal is beyond a certain threshold (Fig. 2). The weights and biases are determined by a training process involving loss functions, which try to make the neural network applied to the inputs yield outputs that are close to the true labels of those inputs.
Implementation
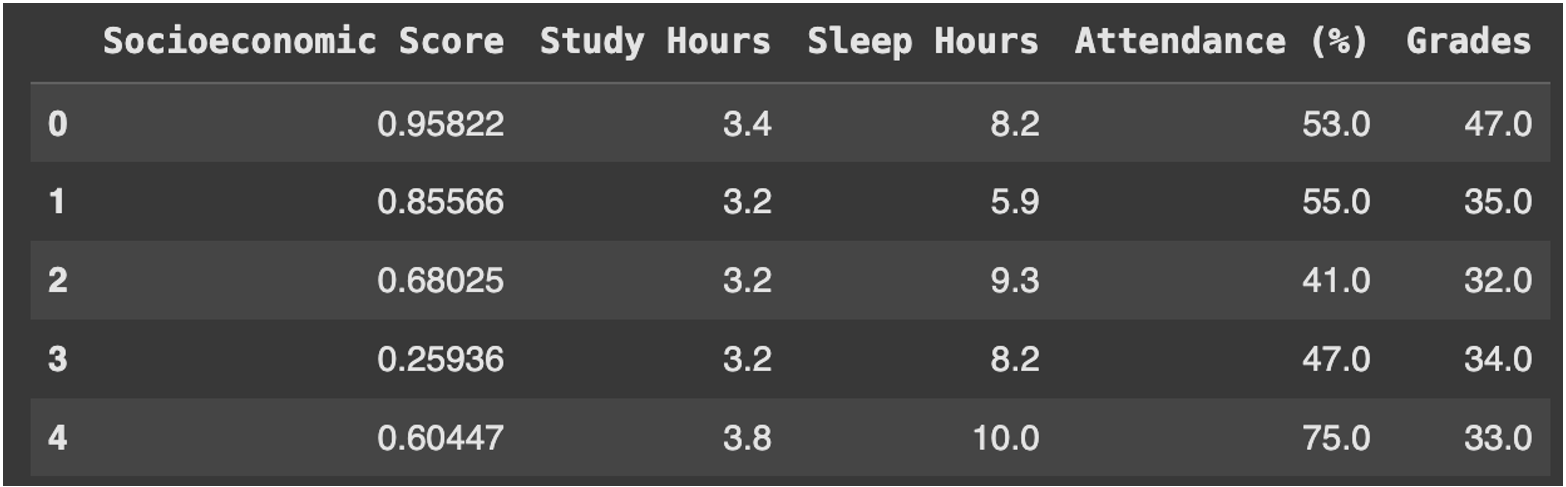
This project is carried out using Google Colab’s CPU environment. The primary Python packages used are sklearn12, pandas13, and matplotlib14. In this project, pandas is used for data loading and preprocessing, scikit-learn is used to implement the neural network regressor and conduct hyperparameter tuning, and matplotlib is used to generate visualizations. The goal of the project is to perform regression analysis to predict students’ grades based on various inputs and factors. The dataset used for this project contains 2000 rows (data points), 4 feature columns, and 1 target column (see Table 1). This dataset was obtained from a publicly available Kaggle repository15, where it was generated synthetically for educational and demonstration purposes. It does not contain records of actual human subjects, nor does it include any Personally Identifiable Information (PII) such as names, student IDs, or specific location data. The features (study hours, sleep hours, socioeconomic score, and attendance) were created using simulated distributions designed to resemble typical student behavior and performance patterns. The target variable predicted is the student’s final grade (values ranging from 0-100).
Model Training Process
The training of the neural network is an iterative optimization process done to minimize the error between the model’s predictions and the students’ actual grades.
To ensure transparency and reproducibility, the full neural network regressor configuration is reported here. The model (see Fig. 1) consists of an input layer with four features, followed by two hidden layers with 50 neurons each, both using the ReLU activation function. This function outputs the input directly if it is positive, and outputs zero if the input is negative, which speeds up training. This introduces non-linearity and enables the model to learn complex patterns. The output layer uses a linear activation function to predict a continuous grade value. Training was performed using the LBFGS optimizer, which was selected as the best-performing solver during cross-validation. The model was trained for a maximum of 200 iterations, with no mini-batching since LBFGS uses the full batch by design. No L1 or L2 regularization or dropout layers were used, and early stopping was not applied.
The minimization of the loss function is achieved through backpropagation, which calculates how much each weight contributes to the final error. During the training phase, the input features are passed forward through the network to generate predictions. The gradients of the loss function with respect to each weight and bias are then computed. The optimization algorithm uses these gradients to update the network parameters, adjusting them in the direction that reduces the prediction error. To further ensure the model’s generalization capability and prevent overfitting, k-fold cross-validation is utilized during the hyperparameter tuning stage.
For training and evaluation, the dataset was split into 70% training and 30% testing using a fixed seed of 40 to ensure reproducibility. We used 5-fold cross validation to select hyperparameters that achieved optimal loss (see Table 2). Additionally, the best model achieved a mean cross-validation MSE of 1.56 with a standard deviation of 0.17 (on the 0–100 grade scale). No stratification was used, as the target variable is continuous. To ensure compatibility between the model output and training variable, the grade values were scaled to the 0-1 range before training, and predictions were rescaled back to the 0-100 range after evaluation.
| Parameter | Values Tested (with 5-fold CV) | Selected Values |
| activation | logistic, tanh, relu | relu |
| learning rate | adaptive, constant, invscaling | invscaling* |
| learning rate initialization | 0.01, 0.001, 0.0001 | 0.0001* |
| hidden layer sizes | (50), (100), (50, 50) | (50, 50) |
| solver | lbfgs, sgd, adam | lbfgs |
*Note: While these learning rate parameters were configured during the grid search, the selected solver, LBFGS, does not use them.
Results
The table below reports the model’s Mean Squared Error and R² Score on unseen test data.
| Mean Squared Error | R² Score | |
| Neural network regressor | 2.00 | 0.9803 |
The neural network regressor achieved a Mean Squared Error of nearly 2.0, which indicates that, on average, the model predicted values very close to the true grade. The R2 score is also very high at 0.98, which indicates that the model fits the data well.
Model Comparisons
To validate the necessity of a deep learning architecture, we compared the neural network regressor to three alternative models: linear regression, random forest, and gradient boosting.
| Model | Mean Squared Error | R2 Score |
| Linear Regression | 19.80 | 0.78 |
| Random Forest | 1.58 | 0.98 |
| Gradient Boosting | 1.52 | 0.98 |
| Neural Network | 2.00 | 0.98 |
As shown in Table 4, the linear regression model achieved an MSE of 19.80 and an R2 of 0.78, significantly underperforming compared to the machine learning approaches. This discrepancy indicates that the relationship between student lifestyle and grades contains non-linearities that cannot be captured using simple linear modeling. The random forest and gradient boosting models achieved MSEs of 1.58 and 1.52 respectively. While these methods performed comparably to the neural network model, the neural network model demonstrated competitive performance (MSE = 2.00). The choice of a neural network architecture is further supported by recent findings indicating that artificial intelligence models, such as adaptive neuro-fuzzy systems, are required to capture the non-linear correlations between student attitudes and academic achievement that linear models fail to detect16.
Bias-Variance Analysis
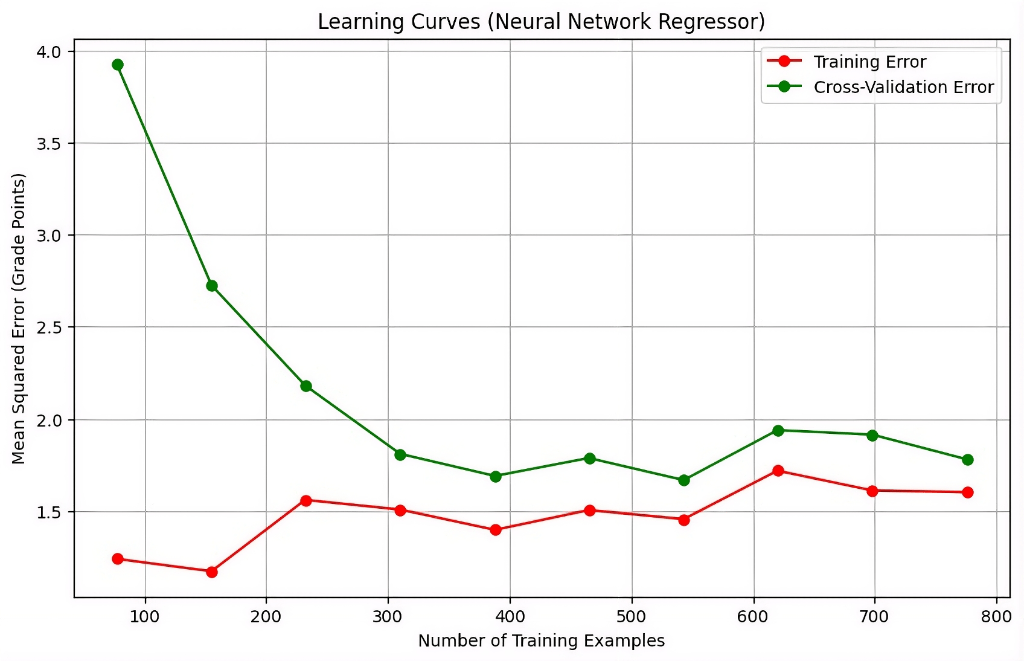
To visually assess the bias-variance tradeoff, we generated learning curves (Fig. 3), plotting the Mean Squared Error against the number of training examples. The plot reveals a classic convergence pattern: as the training set size increases, the cross-validation error (green) decreases significantly, settling around 1.6. The final gap between the training error and cross-validation error is minimal, providing visual confirmation that the model is robust and not suffering from high-variance overfitting. This validates the decision to forego additional regularization, as the model effectively captures the underlying trends without memorizing noise.
Discussion
In this paper, we have predicted students’ academic performance by using machine learning with a neural network regressor. The factors from the dataset this paper uses show a strong correlation with student grades, three particularly prominent features being family background, school resources, and student habits. This research is important as it can help educators design more effective support systems for students in order to positively influence their performance at school.
Specifically, students with consistently low study hours may benefit from individualized study plans or tutoring programs. Those whose sleep duration falls under the recommended hours could be offered wellness programs which emphasize healthy daily routines. Such routines are critical, as physical activity levels have been positively correlated with cognitive function and exam performance in educational settings17. Conversely, unmanaged academic stress acts as a significant suppressor of GPA, often negating the benefits of high study hours18. Nutritional quality also serves as a hidden variable, with distinct links established between dietary habits and academic achievement19. Additionally, students with low socioeconomic scores, those who have limited exposure to resources could be prioritized for academic support services such as technology access programs or learning centers. Similarly, because attendance is one of the strongest predictors of performance, schools might intervene early by monitoring trends or offering support to students with frequent absences. Contemporary research confirms a significant inverse correlation between absence rates and exam scores, where every absence corresponds to a measurable grade deduction20. This impact is often most pronounced in first-year undergraduate students who may struggle with self-regulation21. Furthermore, machine learning models have successfully been utilized to detect low engagement early, validating the potential for automated monitoring systems as effective intervention tools22. Additionally, students can gain awareness of which habits and conditions are most characteristic of their success.
Although the neural network regressor achieved a high R² score (0.98) and a low Mean Squared Error (2.0) on the test set, these strong metrics raise the possibility of overfitting. To reduce this risk, the study used a 5-fold cross-validation procedure during hyperparameter tuning, which helps ensure that the model generalizes across multiple subsets of the data rather than learning patterns specific to a single split. The cross-validation mean and standard deviation further provide evidence of the model’s stability. Moreover, the convergence of training and validation errors observed in the learning curves (see Fig. 3) provides visual evidence that the model is stable and not suffering from overfitting.
While the current model demonstrates high predictive accuracy, educational environments and student lifestyles are prone to change. For instance, the post-pandemic integration of digital learning platforms has fundamentally altered study habits, making screen time a more complex variable than in the past. Increased smartphone usage duration has been directly linked to declining academic performance due to cognitive fragmentation23. A strong negative correlation has also been reported between specific smartphone addiction behaviors and GPA, highlighting the role of digital distraction24. Social relationship craving has also been identified as a key determinant of this addiction, which subsequently degrades the quality of study hours25. Similarly, social media has introduced a change in sleep quality and attention spans in ways that historical data may underestimate. Future iterations of this study would benefit from real-time data collected within the last 3-5 years to ensure that the model accounts for these evolving trends.
In the future, we could explore using different datasets or different machine learning models (random forests, polynomial regression, regularized regression), test with a range of age groups, or gather our own survey data on factors which have the most impact on grades.
References
- M. Yağcı. Educational data mining: prediction of students’ academic performance using machine learning algorithms. Smart Learning Environments. Vol. 9, pg. 1-19, 2022, https://doi.org/10.1186/s40561-022-00192-z. [↩]
- M. Ozcan. Factors affecting students’ academic achievement according to the teachers’ opinion. International Journal of Evaluation and Research in Education. Vol. 10, pg. 9-16, 2021. [↩]
- K. R. White. The relation between socioeconomic status and academic achievement. Psychological Bulletin. Vol. 91, pg. 461-481, 1982. [↩]
- M. Klein, E. M. Sosu. School attendance and academic achievement: understanding variation across family socioeconomic status. Sociology of Education. Vol. 97, pg. 58-75, 2024, https://doi.org/10.1177/00380407231191541. [↩]
- J. Liu, P. Peng, B. Zhao, L. Luo. Socioeconomic status and academic achievement in primary and secondary education: a meta-analytic review. Educational Psychology Review. Vol. 34, pg. 2867-2896, 2022. [↩]
- X. Liu, J. Liu, C. D. Epp, Y. Cui. Exploring the effect of parental involvement on student engagement and academic performance using process data from learning management system. Educational Technology Research and Development. Vol. 73, pg. 1071-1092, 2025. [↩]
- D. Ge, J. Yao, S. Zhou. Effects of sleep duration on academic performance and its heterogeneity: evidence from 165,750 primary and secondary school students in China. Psychology in the Schools. Vol. 62, pg. 2542-2553, 2025. [↩]
- E. R. Eide, M. H. Showalter. Sleep and student achievement. Eastern Economic Journal. Vol. 38, pg. 512-524, 2012. [↩]
- D. J. Dickinson, D. Q. O’Connell. Effect of quality and quantity of study on student grades. Journal of Educational Psychology. Vol. 82, pg. 227-231, 1990. [↩]
- J. F. Yao, T. M. Chiang. Correlation between class attendance and grade. International Journal of Humanities and Social Science. Vol. 1, pg. 8-14, 2011. [↩]
- K. Hornik, M. Stinchcombe, H. White. Multilayer feedforward networks are universal approximators. Neural Networks. Vol. 2, pg. 359-366, 1989. [↩]
- F. Pedregosa, G. Varoquaux, A. Gramfort, V. Michel, B. Thirion, O. Grisel, M. Blondel, P. Prettenhofer, R. Weiss, V. Dubourg, J. Vanderplas, A. Passos, D. Cournapeau, M. Brucher, M. Perrot, E. Duchesnay. Scikit-learn: machine learning in Python. Journal of Machine Learning Research. Vol. 12, pg. 2825–2830, 2011 [↩]
- W. McKinney. Data structures for statistical computing in python. Proceedings of the 9th Python in Science Conference. Pg. 56-61, 2010. [↩]
- J. D. Hunter. Matplotlib: a 2D graphics environment. Computing in Science & Engineering. Vol. 9, pg. 90–95, 2007. [↩]
- Z. Umair. Predict student performance. Kaggle Repository. https://www.kaggle.com/datasets/stealthtechnologies/predict-student-performance-dataset/, 2024. [↩]
- S. G. Körpeoglu, S. G. Yildiz. Using artificial intelligence to predict students’ STEM attitudes: an adaptive neural-network-based fuzzy logic model. International Journal of Science Education. Vol. 46, pg. 1001-1026, 2024. [↩]
- S. K. Ruiz-Ariza, S. Suarez-Manzano, S. Lopez-Serrano, E. J. Martinez-Lopez. The effects of physical activity on academic performance in school-aged children: a systematic review. Children. Vol. 10, pg. 1019, 2023, https://doi.org/10.3390/children10061019. [↩]
- X. Liu, Y. Ping, W. Gao. Academic stress and academic burnout in adolescents: a moderated mediating model. Frontiers in Psychology. Vol. 14, pg. 1133706, 2023, https://doi.org/10.3389/fpsyg.2023.1133706. [↩]
- P. R. Reuter, B. L. Forster. The influence of eating habits on the academic performance of university students. Journal of American College Health. Vol. 69, pg. 1-6, 2021, https://doi.org/10.1080/07448481.2020.1715986. [↩]
- R. F. Ancheta, D. Daniel, R. Ahmad. Effect of class attendance on academic performance. International Journal of English Language Studies. Vol. 3, pg. 40-48, 2021. [↩]
- M. Méndez-Suárez, N. Crespo-Tejero. Impact of absenteeism on academic performance under compulsory attendance policies in first to fifth year university students. Journal of Technology and Science Education. Vol. 11, pg. 488-500, 2021. [↩]
- N. Alruwais, M. Zakariah. Student-engagement detection in classroom using machine learning algorithm. Electronics. Vol. 12, pg. 731, 2023. [↩]
- R. Yildirim, M. Yilmaz. The impact of smartphone use on university students’ education. Turkish Online Journal of Educational Technology. Vol. 24, pg. 93-105, 2025. [↩]
- A. Hashemi, A. Q. Noori, S. N. Orfan, S. A. Akramy, M. R. M. Rameli. Undergraduate students’ perception of smartphone addiction and its impact on themselves and their academic performance: a case study. Cogent Education. Vol. 11, pg. 2340845, 2024. [↩]
- S. M. Bugti, F. Bugti, P. S. A. Sarhandi. Determinants of smartphone addiction and its influence on students’ academic performance. Pakistan Journal of Distance and Online Learning. Vol. 9, pg. 73-92, 2023. [↩]


