
Abstract
In this study, we address two main questions regarding the evolutionary trajectory and lifespan of globular clusters (GCs) within the Milky Way by employing the Python-based galactic dynamics module, Galpy. By incorporating the Navarro-Frenk-White (NFW) profile to approximate the Milky Way’s dark matter halo, we explore how varying the Milky Way’s gravitational potential, particularly its dark matter halo, affects the orbits and structural stability of GCs. The research also examines whether changes in the GCs’ orbital properties over time lead to significant alterations in their internal structure or directly influence their overall lifespan. Our findings suggest that increasing the NFW potential by up to a factor of five results in a decrease in both the tidal and orbital radii of GCs, alongside a reduction in their orbital periods. Despite these changes, most GC orbits remain stable and avoid destruction by tidal forces. However, we observe that smaller GCs are more susceptible to disruption compared to their larger counterparts, indicating a mass-dependent survivability.
Introduction
Luminous structure is a form of matter that is visible and emits radiation. In contrast, dark matter is a hypothetical form of matter that does not interact with any electromagnetic waves, or light, at all, meaning it does not reflect, absorb or emit light. Therefore, dark matter cannot be detected in traditional ways such as trying to observe it with a telescope. However, dark matter is inferred to exist due to its gravitational effects on visible matter as we can see phenomenon like gravitational lensing, where the dark matter bends and distorts light1. The cosmos refers to the entire universe, comprising all matter and energy and is shaped by the presence of dark matter. The standard model used to explain the structure and evolution of the cosmos is Lambda-CDM, which refers to the beginning of the composition and observations with respect to our universe2. Nevertheless, scientists know very little about dark matter to this day and still research about it. Specifically, a dark matter halo is a region of matter that has become gravitationally decoupled from the general expansion of the universe and collapsed into a bound structure3. Within this halo, there may be multiple, distinct peaks in the density field that form stable clumps of dark matter—known as subhalos—which are smaller than the host halo and orbit within its gravitational potential.
A galaxy is a large system containing stars, dust, gas, and dark matter, which are all held together by gravity4. Different galaxies will have different mass distribution and gravitational potential depending on their density profile and dominant source of matter. Therefore, they can be used as a test of gravity as different gravitational effects can be observed in different galactic condition. The mass distribution around a galaxy can also be approximated by measuring the motion of objects within it.
Globular clusters (GCs) are densely packed, roughly spherical assemblies of stars that rank among the oldest known stellar systems in the universe5. Recent data shows that there are about 170 GCs in the Milky Way6. Dynamical friction the gravity felt by an object moving in a medium due to its density wake7. GCs orbiting in the Milky Way will experience drag due to gravity exerted by smaller masses, ultimately causing them to spiral to the galactic center8. Tidal forces are defined as forces that stretch a body towards and away from the center of mass of another body due to a difference in strength of the gravitational fields9. Tidal forces are responsible for tidal disruptions; if a satellite’s orbit intersects the disk or bulge, tidal disruption can occur when the satellite come into close contact with more massive subhalos or during infall into the main halo10. The disruptions create tidal tails composed of streams of matter stripped from the bodies.11 utilized N-body simulations on a GPU to investigate the dynamical history of a globular cluster (GC) similar to NGC 6397—the second closest GC to our Sun at 2.39 kpc, with a pericenter of only a few kiloparsecs—thus subjecting it to significant tidal interactions in a Milky Way–like galaxy. The simulations suggest that such a cluster should have developed strong and extended tidal tails. However, observations from the third Gaia early data release contradict these predictions. The discrepancy is attributed to the assumption of a purely baryonic cluster in the simulations, neglecting the potential protective effect of a dark matter minihalo surrounding the cluster.
Tidal radius is the distance from the center of a GC beyond which the tidal force of the galaxy is able to strip stars from the cluster12. In addition, the tidal radius of a satellite primarily depends on the host galaxy’s and the satellite’s own potentials, as well as the orbit of the satellite and the orbits of the stars within the satellite13.
The aforementioned research papers involved the assumptions on the mass distribution of the Milky Way and the survival of GCs in other galaxies. This research fits in with those papers as it aims to investigates how different dark matter halo mass distributions of the Milky Way affect the GCs. The paper uses new Gaia data on current GC positions to track their past and future and estimates the lifespans of those GCs by analyzing their orbits and tidal radii. This research also considers the influence of Chandrasekhar dynamical friction, as the GCs will lose portions of their mass and change their orbit under those circumstances. We use numerical orbit integrators to calculate the cluster’s orbit in a gravitational field and include analytical approximations for behaviors dependent on the resolved particles, such as dynamical friction and tidal stripping. By varying the dark matter halo mass distributions and potentials in the Milky Way, the orbits and lifespans of the GCs would change, and from the results we can learn more about dark matter and have a better understanding of the dark matter distribution in our galaxy.
In this study, distances are expressed in parsecs (pc) and kiloparsecs (kpc). A parsec is defined as the distance at which one astronomical unit (AU), the average distance between the Earth and the Sun (approximately  m), subtends an angle of one arcsecond. A kiloparsec (kpc) is 1,000 parsecs, making it a convenient unit for describing distances on galactic scales. Time is also expressed in gigayears (Gyr), where 1 Gyr is equal to 1 billion years, making it easier to address long-term astronomical processes.
The paper is structured as follows. In section 2, we present the methods we use, including orbit integrations and the formulas and data we use. In section 3, we present the results of our simulation and plots. In section 4, we discuss our results and their interpretation as well as outlining and drawing our conclusions.
Methods
Orbit Integration
To track the trajectories of the GCs, it is necessary first to set the appropriate Milky Way mass models. Different mass models have different gravitational potentials, each impacting the GCs differently. Once the potential and initial conditions are defined, Galpy numerically integrates the equations of motion over a specified time interval. During integration, the positions and velocities of the star are updated step by step, allowing the orbit to be traced forward or backward in time.
Another widely used tool in astrophysics is N-body simulations. While orbital integration is as accurate as N-body simulations for the studies we are examining, it is computationally cheaper. This efficiency allows more scenarios of the Milky Way’s uncertain gravitational potential to be explored.
Milky Way Potential
Assuming a galaxy has symmetric gravitational potential about the center, the circular velocity  is the tangential velocity that a body must have to maintain a circular orbit at a specified distance from the centre. In this case, the absolute acceleration is equal to
  , where
  is the radius of the circular orbit. If the gravitational field and potential follow spherical symmetry, then the gravitational field strength from a distance away from the center of the galaxy is just
  , where
  is the mass within . Therefore,
(1) 
And by rearranging Eqn.~1, can then be estimated by
(2) 
If the  against graph of objects in a galaxy can be obtained, also known as the rotation curve, it will provide useful information about the gravitational potential of the galaxy
Eilers et al. (2019) summarizes methods of measuring circular velocity, such as analyzing the dynamics and distances of objects in the Milky Way14.
A dark matter halo is made up of the group of particles orbiting in their own self-generated potential15. The Navarro-Frenk-White (NFW) profile is one of the most used models for dark matter halos. The three pioneers fitted a spatial mass distribution of dark matter to dark matter halos identified in N-body simulations16. The NFW profile states that:
(3) 
where  is the density of dark matter,
  is the distance away from the center of the dark matter, and
  is the scale radius. The scale radius depends on the mass and size of the dark matter halo. Equation~3 shows that
  near the center (
 ) and becomes
  at larger distances (
 ).
).
We use the potential model from Bovy et al. (2013) as a simplified model of Milky Way’s gravitational potential17. MWPotential2014 is an array of three components: a bulge modeled as a power-law density profile that is exponentially cutoff with a power law exponent of −1.8 and a cut-off radius of 1.9 kpc, a Miyamoto-Nagai Disk described by Miyamoto-Nagai Potential, and a dark-matter halo described by Navarro-Frenk-White potential18.
Dynamical Friction
Dynamical friction must be considered as it affects the orbits of the GCs, meaning we must compute the drag force of the surrounding particles on the moving GC. The Chandrasekhar dynamical friction force on a mass  at position
  moving at velocity
  through a background density
  is:
is:
(4) ![\begin{equation*}\small\mathbf{F}(\mathbf{x}, \mathbf{v}) = -2\pi\,(GM)\,(G\rho(\mathbf{x}))\,\ln(1 + \Lambda^2)\left[\mathrm{erf}(X) - \frac{2X}{\sqrt{\pi}}\,e^{-X^2}\right]\frac{\mathbf{v}}{|\mathbf{v}|^3}\end{equation*}](https://nhsjs.com/wp-content/ql-cache/quicklatex.com-0fbb3e59719010e11f831e6f2f380624_l3.png "Rendered by QuickLaTeX.com")
Quantity  is
is  . The factor
  that goes into the Coulomb logarithm is
  where
where  is a constant. should be the absolute value of the logarithmic slope of the density
  , but should be set to 1 when
  19. Implementation roughly follows20.
Tidal Radius
The formula for tidal radius for a body of mass in a circular orbit is defined as
(5) 
where is the cluster mass,  is the circular frequency, and
  is the gravitational potential. We use
  for non-spherical potentials and calculate the derivatives at the given position of the object21.
N-body simulations shows that the mass loss rate of GCs in cuspy profiles increases very quickly after their tidal radii are less than their half-mass radii or 6 pc, whichever comes first. The GC is then disrupted shortly after22. This can also be applied to the Milky Way Galaxy; by calculating a long list of tidal radii corresponding to different times, the lifespans of the GCs can be determined. We can also vary the mass and potential of the galaxy to investigate how the path and lifespan of the GCs would change. In this study, we mostly look at how changing the NFW potential affect the GCs in the Milky Way Galaxy. More specifically, the NFW potential will be multiplied by 0.5, 3, and 5, and the effects of each case will be observed.
While the most recent dynamical study23. places the Milky Way’s virial mass in the range of  —
— , scaling the NFW potential by factors of three and five serves as a useful theoretical stress test. These factors probe extreme but still conceivable upper limits, allowing us to investigate the survivability of globular clusters under significantly stronger gravitational fields than currently observed. A
  —
— scaling could mimic scenarios where the halo mass has been systematically underestimated or where additional unseen mass components are present. However, increasing the NFW potential beyond a factor of five would imply a halo mass exceeding
  , inconsistent with satellite galaxy dynamics, stellar stream constraints, and the observed Milky Way rotation curve. Such masses would place the Milky Way in the regime of the most massive spiral galaxies or low-mass galaxy clusters, making them implausible considering existing observational evidence.
Data
The paper uses Gaia data24,25, and more specifically, we use the Vasiliev data for GCs26. The Baumgardt website includes data for the mass, half-mass radius, and positions of globular clusters, which were used in the simulations.
Results
The Results Section contains the rotation curves for different potentials in the Milky Way Galaxy. It also encompasses orbital and tidal radius against time graphs for GCs with different mass under each dark matter halo potential. The maximum and minimum orbital and tidal radius for each GC and potential are included, too.
Table 1 summarizes the basic physical and orbital parameters of the five globular clusters examined in this study, including their masses, half-mass radii, and pericentric and apocentric distances.
| Globular Cluster | Mass (in terms of mass of the Sun) | Half-mass Radius (pc) | Minimum Orbital Radius (kpc) | Maximum Orbital Radius (kpc) | |
| 1 | NGC6397 | 82,400 | 3.16 | 2.171 | 6.255 |
| 2 | NGC5139 | 4,000,000 | 10.42 | 2.033 | 6.751 |
| 3 | NGC104 | 800,000 | 6.44 | 5.331 | 7.392 |
| 4 | NGC7492 | 19,700 | 10.59 | 3.666 | 27.712 |
| 5 | NGC6535 | 19,800 | 3.43 | 1.248 | 4.385 |
Rotation Curves
 and
and 
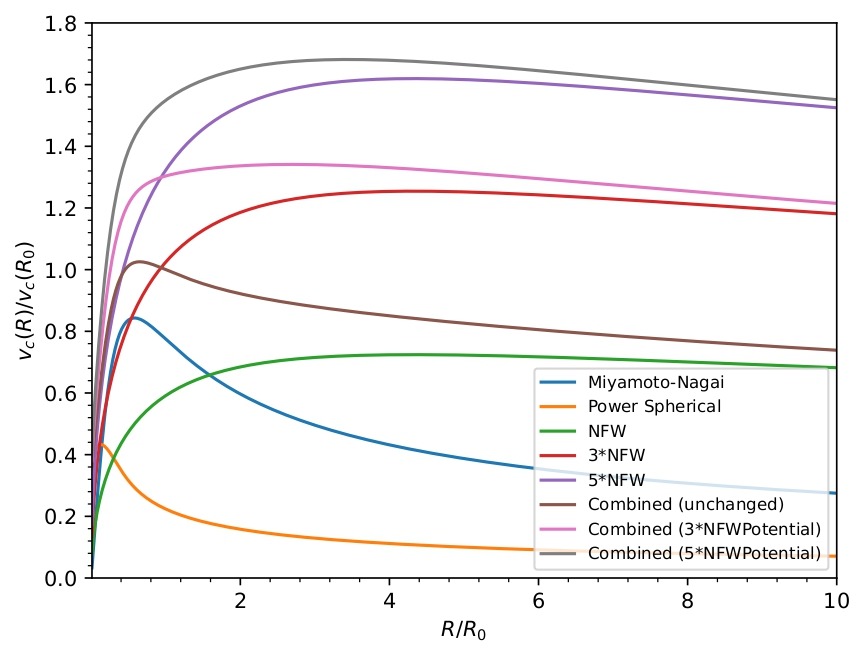
Figure 1 displays the rotation curves of the Milky Way. It includes the Miyamoto-Nagai, Power Spherical, and NFW potentials described in Bovy (2015). The graph also shows the rotation curves of triple and quintuple the NFW potential, as well as the combined rotation curve of the three potentials for each case of the NFW potential. On the horizontal axis, represents the distance from the center of the galaxy while . On the vertical axis  represents the circular velocity at a distance away from the center of the galaxy while .
NGC6397
NGC6397 is a GC in the Milky Way with a mass of approximately 100,000 times the mass of the Sun and a half-mass radius of 3.16 pc. Since an aforementioned paper suggested its missing tidal tails around NGC6397, we thought it would be interesting to look at its orbits and tidal radii.
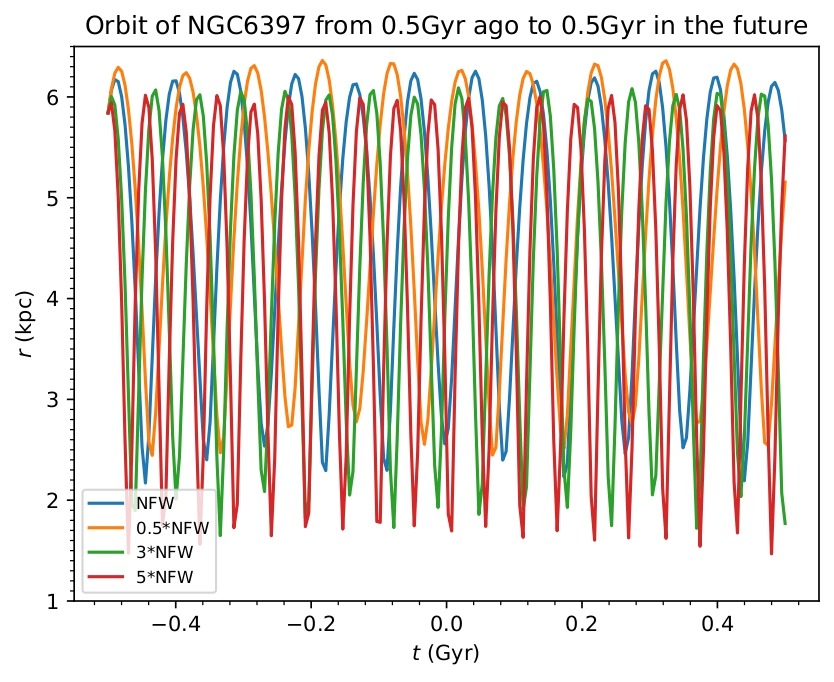
Figure 2A displays NGC6397’s orbital radius against time graph under four different NFW potentials. Under the normal potential indicated in blue, the maximum orbital radius is 6.255 kpc while the minimum is 2.171 kpc. Under the halved NFW potential indicated in orange, the maximum orbital radius is 6.361 kpc while the minimum is 2.445 kpc. Under the tripled NFW potential indicated in green, the maximum orbital radius is 6.090 kpc while the minimum is 1.649 kpc. Under the quintupled NFW potential indicated in red, the maximum orbital radius is 6.021 kpc while the minimum is 1.468 kpc.
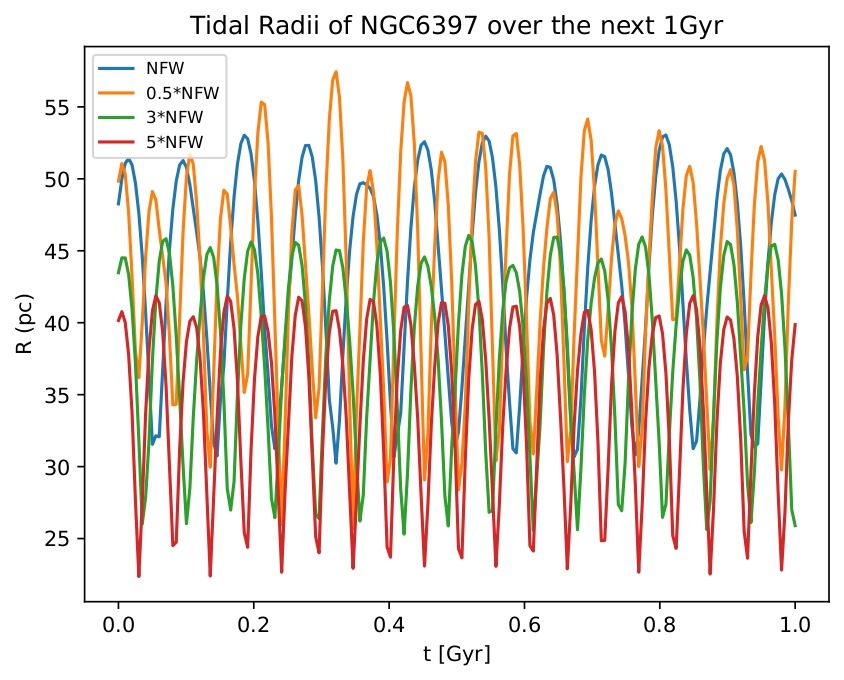
Figure 2B displays NGC6397’s tidal radius against time graph under four different NFW potentials. Under the normal potential indicated in blue, the maximum tidal radius is 53.046 pc while the minimum is 30.239 pc. Under the halved NFW potential indicated in orange, the maximum tidal radius is 57.437 pc while the minimum is 25.696 pc. Under the tripled NFW potential indicated in green, the maximum tidal radius is 46.066 pc while the minimum is 25.312 pc. Under the quintupled NFW potential indicated in red, the maximum tidal radius is 41.884 pc while the minimum is 22.367 pc.
NGC5139
NGC5139, also known as Omega Centauri, is the biggest GC by mass in the Milky Way with a mass of approximately 4 million times the mass of the Sun and a half-mass radius of 10.42 pc.
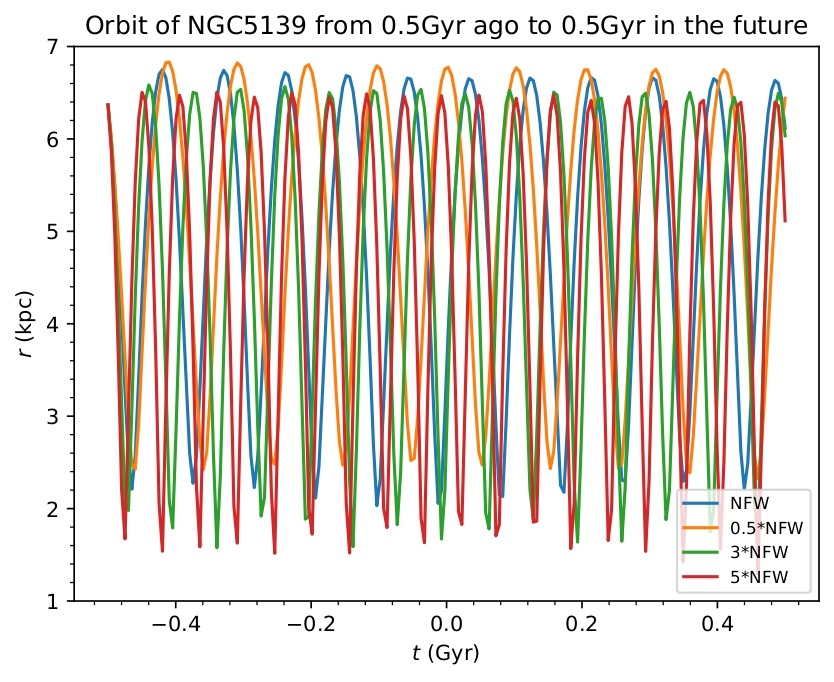
Figure 3A displays NGC5139’s orbital radius against time graph under four different NFW potentials. Under the normal potential indicated in blue, the maximum orbital radius is 6.751 kpc while the minimum is 2.033 kpc. Under the halved NFW potential indicated in orange, the maximum orbital radius is 6.832 kpc while the minimum is 2.324 kpc. Under the tripled NFW potential indicated in green, the maximum orbital radius is 6.583 kpc while the minimum is 1.577 kpc. Under the quintupled NFW potential indicated in red, the maximum orbital radius is 6.505 kpc while the minimum is 1.295 kpc.
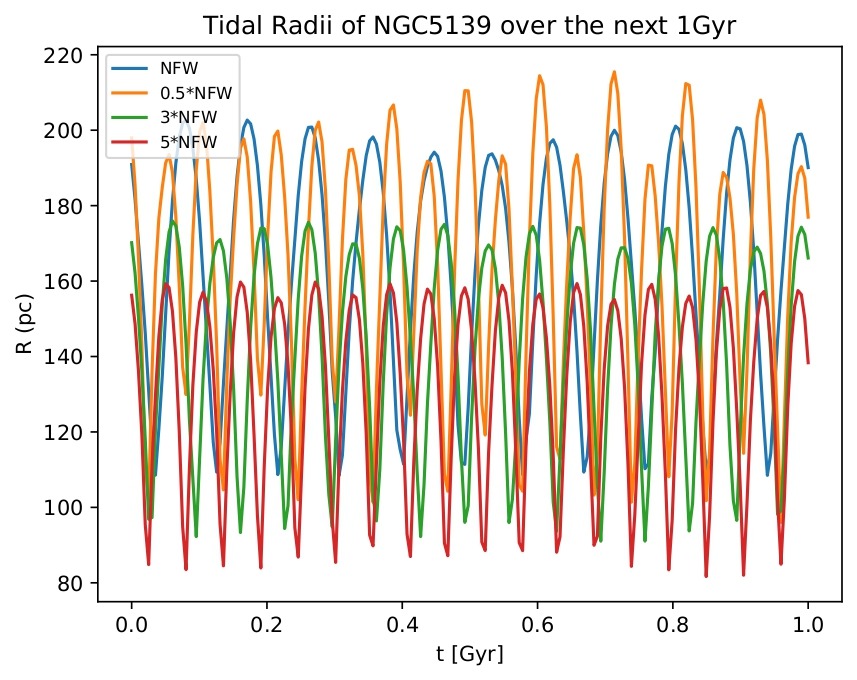
Figure 3B displays NGC5139’s tidal radius against time graph under four different NFW potentials. Under the normal potential indicated in blue, the maximum tidal radius is 202.679 pc while the minimum is 108.450 pc. Under the halved NFW potential indicated in orange, the maximum tidal radius is 215.482 pc while the minimum is 96.036 pc. Under the tripled NFW potential indicated in green, the maximum tidal radius is 175.940 pc while the minimum is 91.055 pc. Under the quintupled NFW potential indicated in red, the maximum tidal radius is 159.738 pc while the minimum is 81.687 pc.
NGC104
NGC104, also known as 47 Tucanae, is another massive GC in the Milky Way with a mass of approximately 8 hundred thousand times the mass of the Sun and a half-mass radius of 6.44 pc.
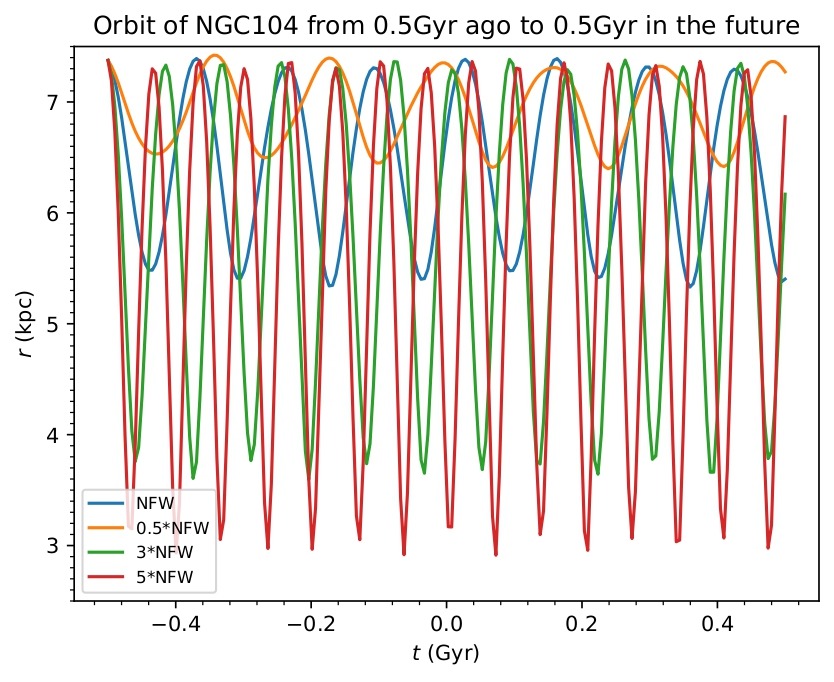
Figure 4A displays NGC104’s orbital radius against time graph under four different NFW potentials. Under the normal potential indicated in blue, the maximum orbital radius is 7.392 kpc while the minimum is 5.331 kpc. Under the halved NFW potential indicated in orange, the maximum orbital radius is 7.422 kpc while the minimum is 6.398 kpc. Under the tripled NFW potential indicated in green, the maximum orbital radius is 7.384 kpc while the minimum is 3.596 kpc. Under the quintupled NFW potential indicated in red, the maximum orbital radius is 7.375 kpc while the minimum is 2.914 kpc.
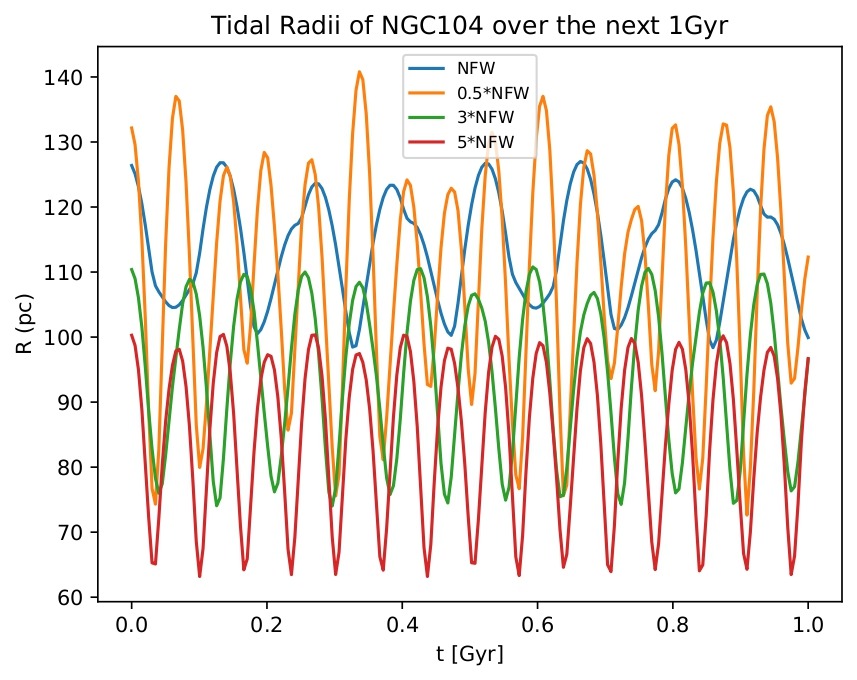
Figure 4B displays NGC104’s tidal radius against time graph under four different NFW potentials. Under the normal potential indicated in blue, the maximum tidal radius is 127.003 pc while the minimum is 98.374 pc. Under the halved NFW potential indicated in orange, the maximum tidal radius is 140.794 pc while the minimum is 72.628 pc. Under the tripled NFW potential indicated in green, the maximum tidal radius is 110.788 pc while the minimum is 74.028 pc. Under the quintupled NFW potential indicated in red, the maximum tidal radius is 100.405 pc while the minimum is 63.189 pc.
NGC7492
NGC7492 is one of the smaller GCs by mass in the Vasiliev Data. It has a mass of approximately 20 thousand times the mass of the Sun and a half-mass radius of 10.59 pc.
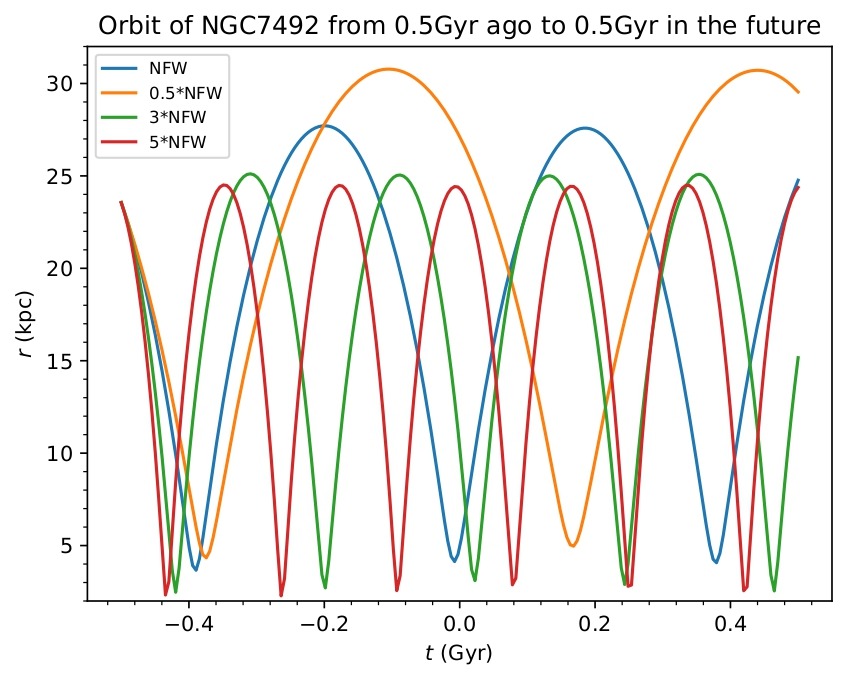
Figure 5A displays NGC7492’s orbital radius against time graph under four different NFW potentials. Under the normal potential indicated in blue, the maximum orbital radius is 27.712 kpc while the minimum is 3.666 kpc. Under the halved NFW potential indicated in orange, the maximum orbital radius is 30.777 kpc while the minimum is 4.334 kpc. Under the tripled NFW potential indicated in green, the maximum orbital radius is 25.112 kpc while the minimum is 2.477 kpc. Under the quintupled NFW potential indicated in red, the maximum orbital radius is 24.509 kpc while the minimum is 2.281 kpc.
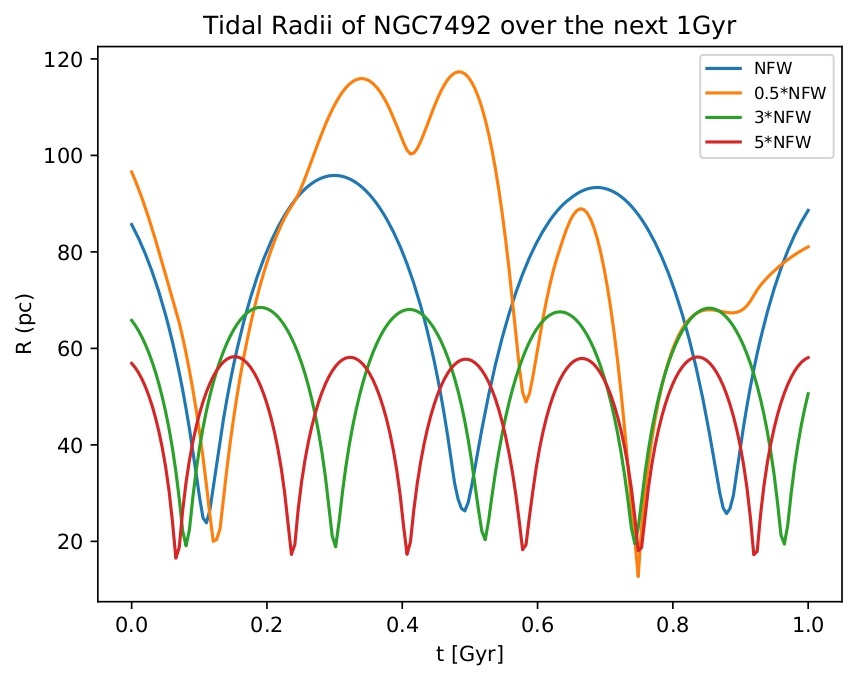
Figure 5B displays NGC7492’s tidal radius against time graph under four different NFW potentials. Under the normal potential indicated in blue, the maximum tidal radius is 95.847 pc while the minimum is 23.852 pc. Under the halved NFW potential indicated in orange, the maximum tidal radius is 117.326 pc while the minimum is 12.728 pc. Under the tripled NFW potential indicated in green, the maximum tidal radius is 68.491 pc while the minimum is 18.868 pc. Under the quintupled NFW potential indicated in red, the maximum tidal radius is 58.283 pc while the minimum is 16.529 pc.
NGC6535
NGC6353 is another of small GC by mass in the Vasiliev Data. It has a mass of approximately 20 thousand times the mass of the Sun and a half-mass radius of 3.43 pc.
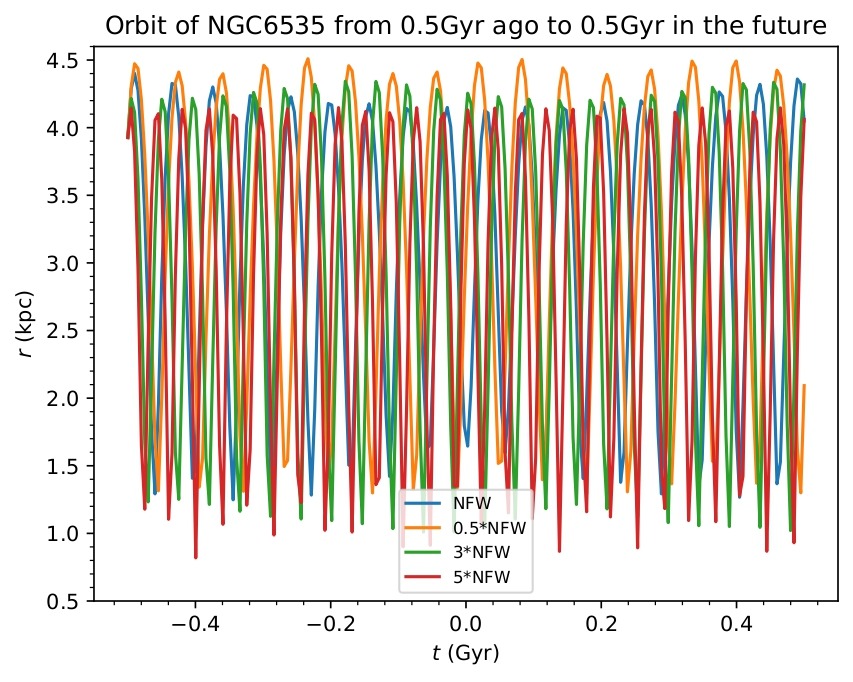
Figure 6A displays NGC6535’s orbital radius against time graph under four different NFW potentials. Under the normal potential indicated in blue, the maximum orbital radius is 4.401 kpc while the minimum is 1.248 kpc. Under the halved NFW potential indicated in orange, the maximum orbital radius is 4.509 kpc while the minimum is 1.294 kpc. Under the tripled NFW potential indicated in green, the maximum orbital radius is 4.343 kpc while the minimum is 1.011 kpc. Under the quintupled NFW potential indicated in red, the maximum orbital radius is 4.148 kpc while the minimum is 0.819 kpc.
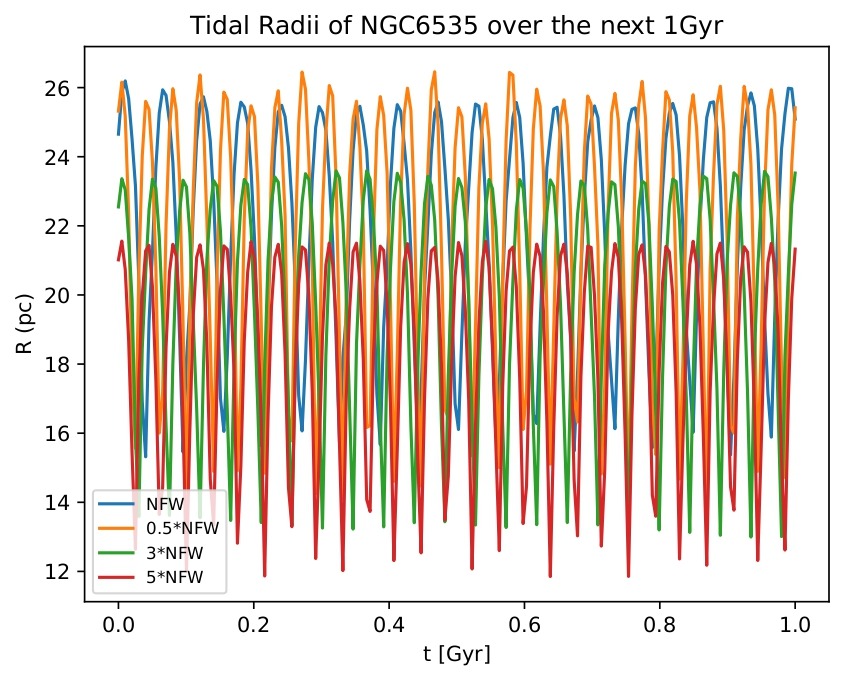
Figure 6B displays NGC6535’s tidal radius against time graph under four different NFW potentials. Under the normal potential indicated in blue, the maximum tidal radius is 26.193 pc while the minimum is 15.318 pc. Under the halved NFW potential indicated in orange, the maximum tidal radius is 26.463 pc while the minimum is 13.942 pc. Under the tripled NFW potential indicated in green, the maximum tidal radius is 23.594 pc while the minimum is 12.997 pc. Under the quintupled NFW potential indicated in red, the maximum tidal radius is 21.557 pc while the minimum is 11.859 pc.
Discussion
Combined Rotation Curves
The combined rotation curves show that as we increase the NFW potential, the circular velocities,  , will also increase. This relationship aligns with Eqn. 2; a stronger gravitational potential implies a greater mass, which increases the circular velocity.
In addition, all the combined rotation curves initially display a square root relationship between the circular velocity and the distance from the center of the galaxy before  . However, at some point around and onwards, the combined rotation curves plateau. We can conclude that the dark matter halo potential is responsible for this observation, as its rotation curves resemble a similar shape to that of the combined potential. When the NFW potential is multiplied several times, it becomes the dominant form of matter in the Milky Way, elucidating its effect on the flat part of the combined rotation curve.
Analysis on the Orbits
All the orbits’ plots show that as the dark matter halo gets more massive, the maximum and minimum orbital radii of the GCs decrease, and there are more revolutions over the same time interval. This implies that the orbital period is inversely proportion to the mass of the halo.
It is worth noting that despite the increase in the potential, all the GCs still maintain stable orbits. If an orbit is not stable, the plots will not appear sinusoidal or having a constant amplitude, and the maximum and minimum orbital radii will differ greatly between each revolution. Such cases include a GC slowly following toward the centre of the galaxy: its orbital radius decreases with every revolution it makes.
For most globular clusters, even the 5 times more massive dark matter halo does not have a strong enough tidal field to decay the orbital radius of the cluster significantly over the 1 Giga-year of the simulation. The results imply that the orbits of the GCs will remain stable for any dark matter halo potential within a factor of 5 in the Milky Way.
Analysis on the Tidal Radii
| Globular Cluster | Mass (in terms of mass of the Sun) | 0.5 x NFW (pc) | Normal NFW (pc) | 3 x NFW (pc) | 5 x NFW (pc) | |
| 1 | NGC6397 | 82,400 | 25.696–57.437 | 30.239–53.046 | 25.312–46.066 | 22.367–41.884 |
| 2 | NGC5139 | 4,000,000 | 96.036–215.482 | 108.450–202.679 | 91.055–175.940 | 81.687–159.738 |
| 3 | NGC104 | 800,000 | 72.628–140.794 | 98.374–127.003 | 74.028–110.788 | 63.189–100.405 |
| 4 | NGC7492 | 19,700 | 12.728–117.326 | 23.852–95.847 | 18.868–68.491 | 16.529–58.283 |
| 5 | NGC6535 | 19,800 | 13.942–26.463 | 15.318–26.193 | 13.686–23.645 | 12.997–23.594 |
Similarly, the tidal radii plots show that as the dark matter halo becomes more massive, both the maximum and minimum tidal radii decrease. The orbits also complete more revolutions over the same time interval, which implies a shorter orbital period under stronger potentials.
It is also notable that even a halo five times heavier than the fiducial Milky Way model does not fully disrupt any of the GCs tested. None of the minimum tidal radii drop below either the cluster’s half-mass radius or the disruption threshold of 6 pc. However, the plots still reveal meaningful differences between more massive and less massive clusters.
When the NFW potential is increased by a factor of 3 or 5, the tidal radii of the lower-mass GCs shrink proportionally more than those of the higher-mass GCs. In contrast, at 5× NFW, the minimum tidal radii of massive clusters remain well above the disruption limit, suggesting that smaller GCs are closer to instability while larger ones remain resilient.
Overall, the results suggest that less massive GCs have shorter lifespans in stronger halo potentials. Because their tidal radii lie closer to their half-mass radii or the disruption threshold, they are more vulnerable to being stripped and destroyed over time.

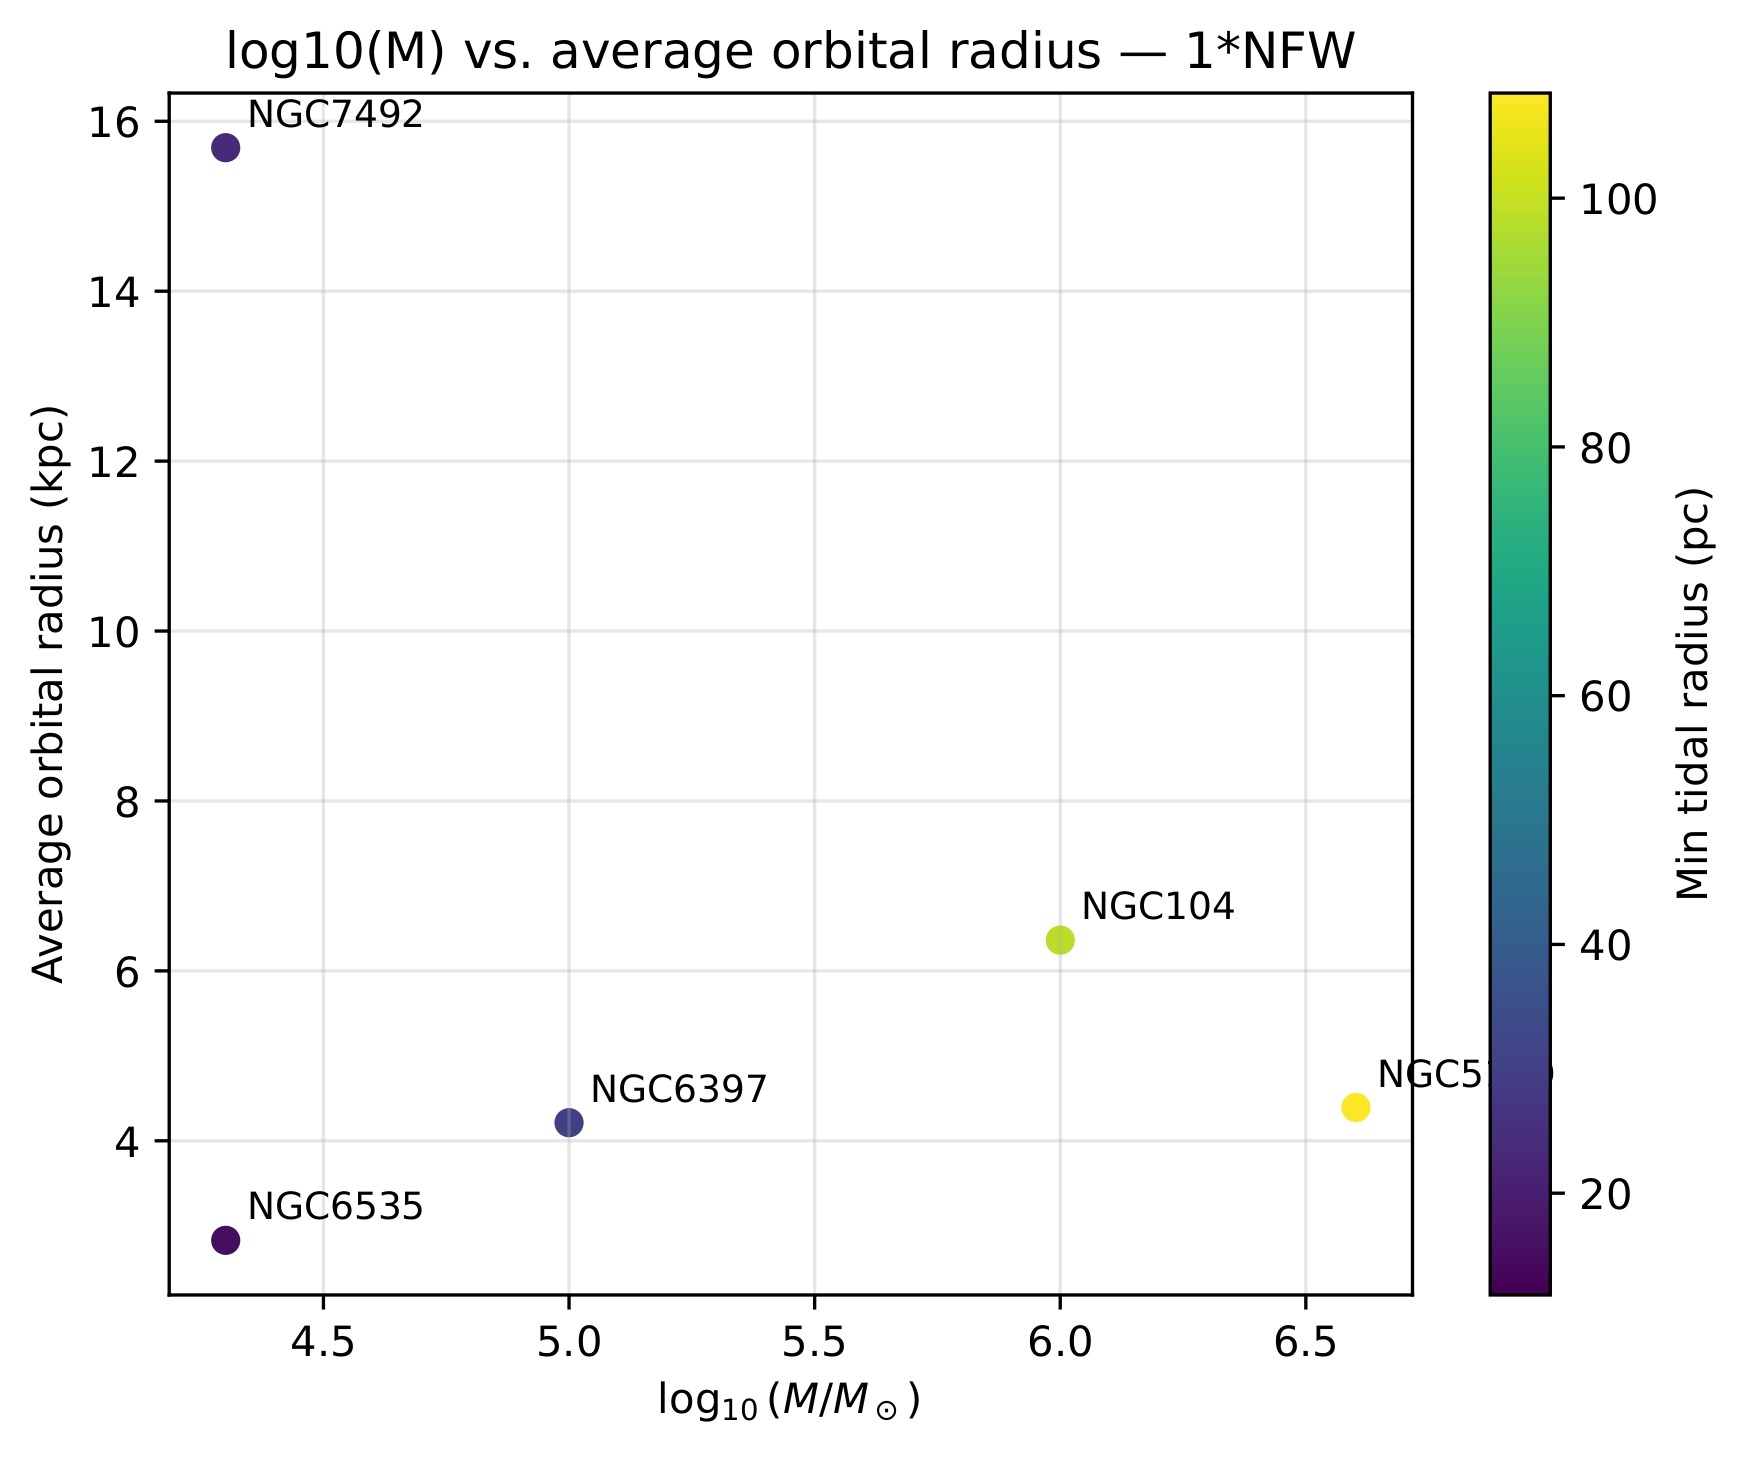
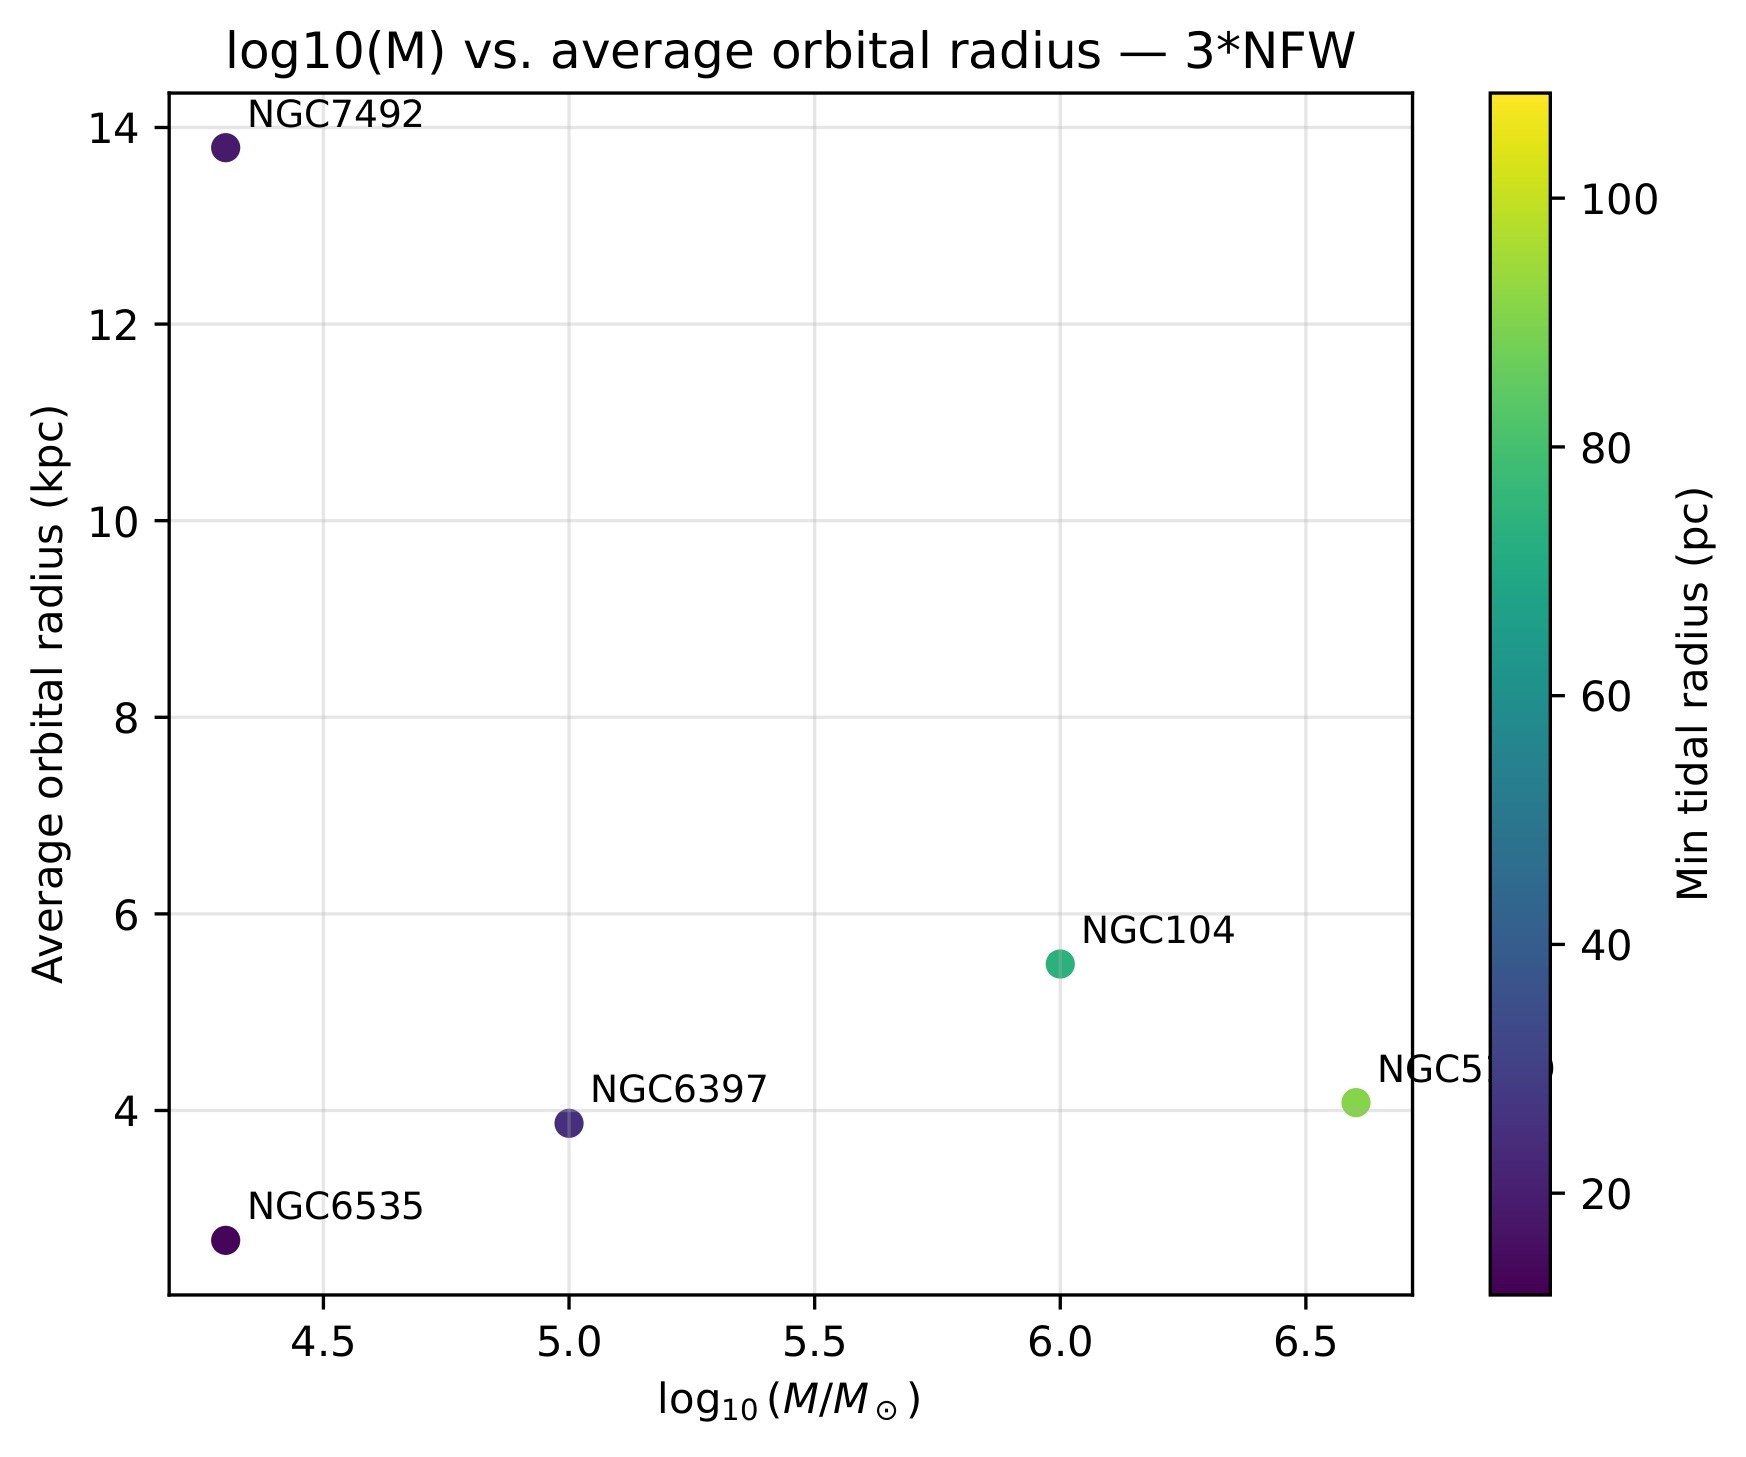
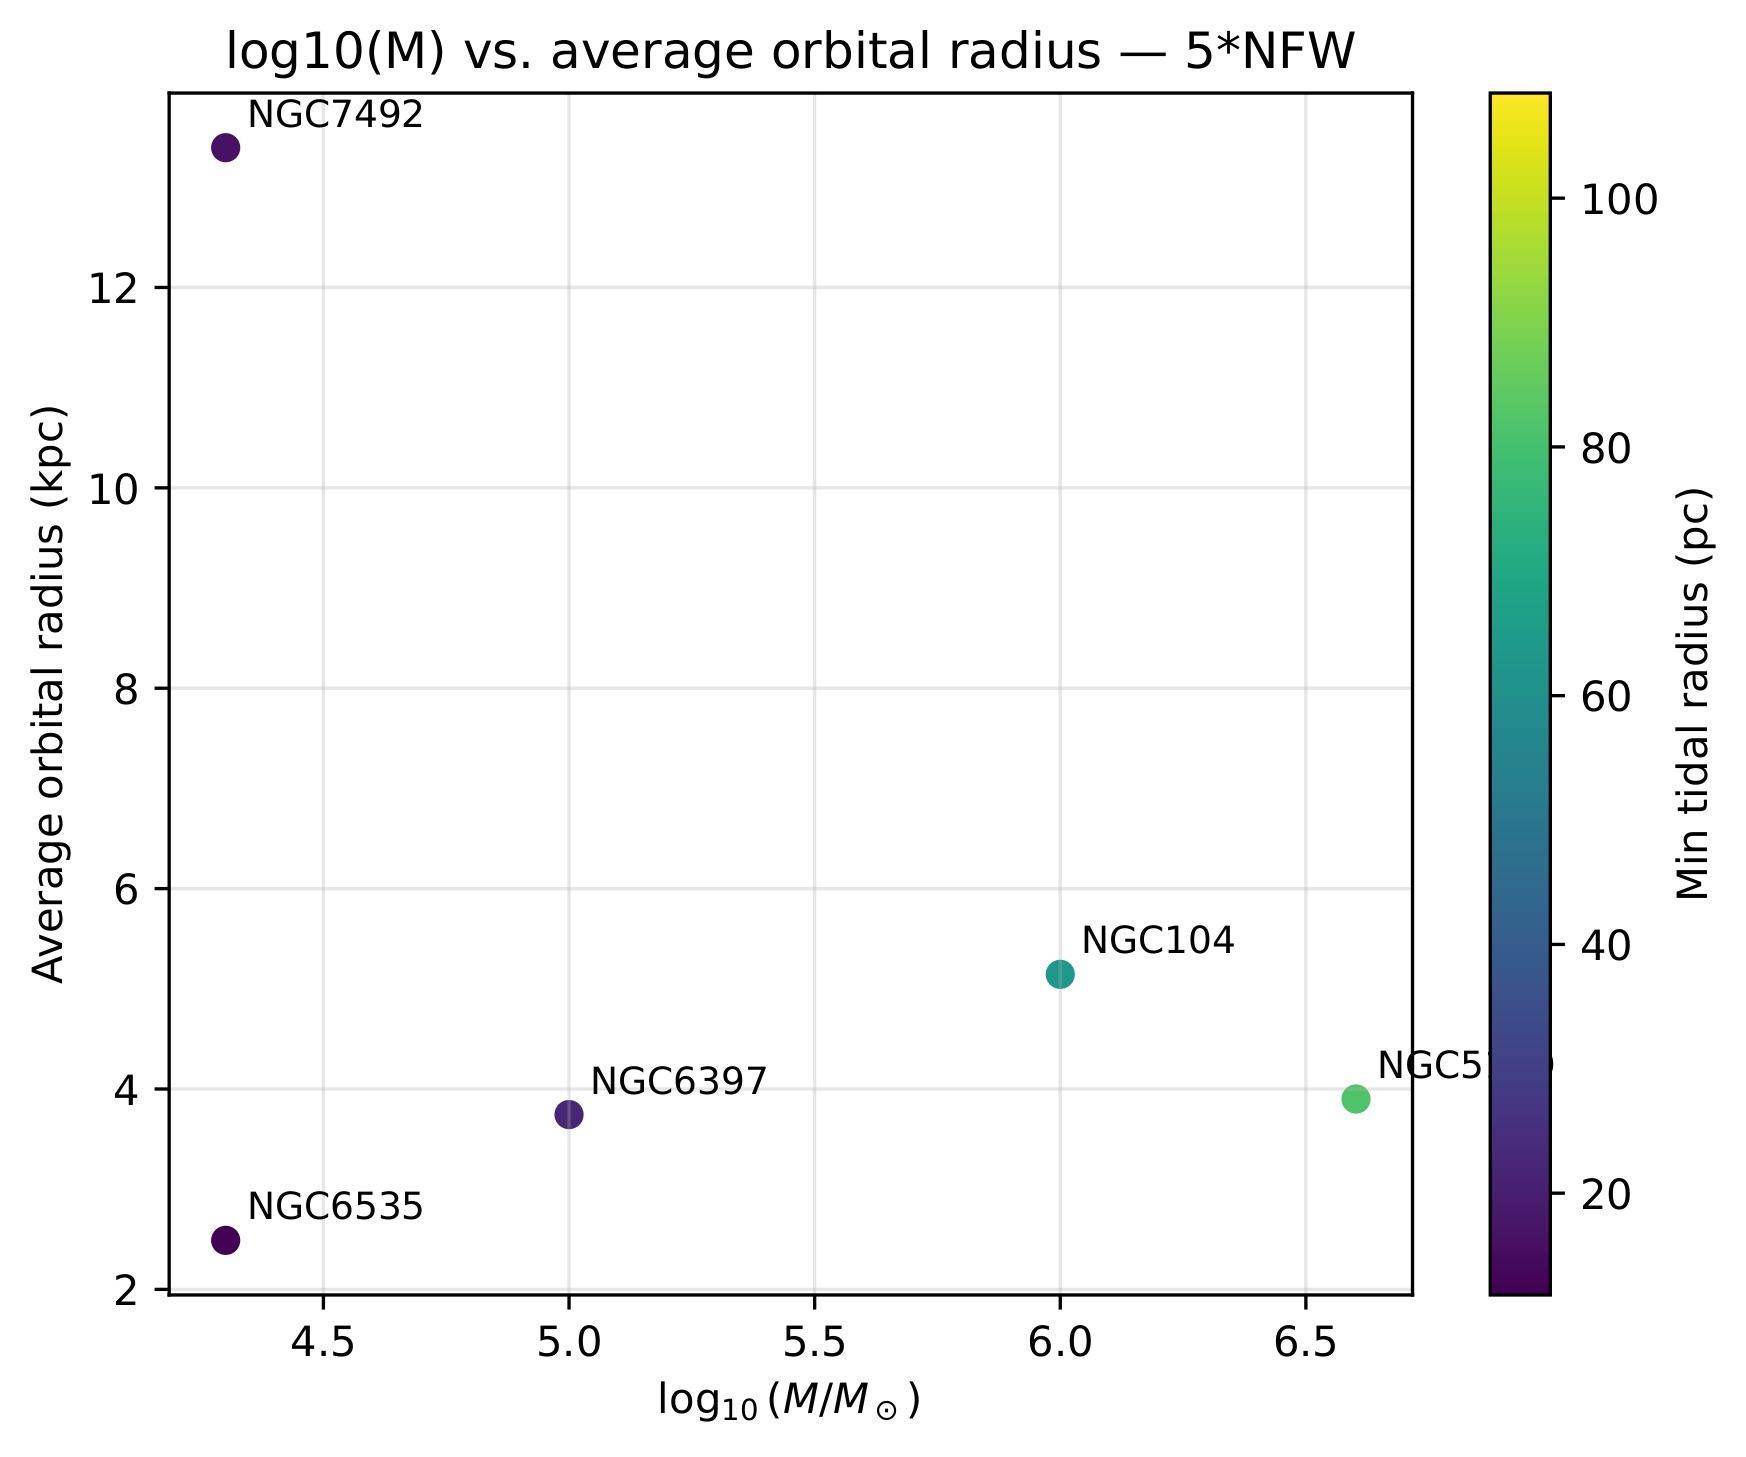
The log–log plots that follow help visualize this trend. Less massive clusters consistently show smaller minimum tidal radii (indicated by darker colors), which places them closer to the disruption threshold. In contrast, the more massive clusters maintain larger tidal radii across all halo strengths, reinforcing their greater stability.
Conclusion
This study explored the orbits and survivability of several Milky Way globular clusters by modeling their motion in modified NFW halo potentials using the Galpy Python package. The results show clear trends: as the halo becomes more massive, the tidal and orbital radii of the clusters shrink, and their orbits complete more revolutions over the same time interval. Even when the halo strength is increased by a factor of five, the clusters remain largely stable, with minimum tidal radii staying above their half-mass radii or the 6-pc disruption threshold. Smaller clusters, however, consistently sit closer to this limit, suggesting they are more vulnerable to tidal stripping than larger, more massive clusters.
Although our Galpy-based model includes Chandrasekhar dynamical friction, it remains a simplified semi-analytic approximation compared with full N-body simulations. Future work could use N-body simulations to follow the actual stripping of stars and test why lower-mass clusters are more prone to disruption. It would also be valuable to explore how changes in the bulge or disk components affect GC lifespans. While many uncertainties remain — especially regarding the true structure of the Milky Way’s dark matter halo — studies like this help build a clearer picture of how cluster mass, orbit, and environment shape the long-term survival of globular clusters.
Acknowledgements
We thank the authors of Galpy for their codes, which helped run the simulations. We also thank Tariq Yasin for useful comments and suggestions to improve the quality of this work.
References
- K. Garrett, G. Duda. Dark matter: A primer. Advances in Astronomy. Vol. 2011, pg. 1–22, 2011. [↩]
- NASA/LAMBDA Archive Team. Graphic history to cosmology. NASA Goddard Space Flight Center, https://lambda.gsfc.nasa.gov/education/graphic_history/, 2025. [↩]
- R. H. Wechsler, J. L. Tinker. The connection between galaxies and their dark matter halos. Annual Review of Astronomy and Astrophysics. Vol. 56, pg. 435–487, 2018. [↩]
- L. S. Sparke, J. S. Gallagher. Galaxies in the universe: An introduction. Cambridge University Press, 2010. [↩]
- J. P. Brodie, J. Strader. Extragalactic globular clusters and galaxy formation. Annual Review of Astronomy and Astrophysics. Vol. 44, pg. 193–267, 2006. [↩]
- M. Ishchenko, M. Sobolenko, P. Berczik, S. Khoperskov, C. Omarov, O. Sobodar, M. Makukov. Milky Way GCs on cosmological timescales. Astronomy & Astrophysics. Vol. 673, 2023. [↩]
- R. Buehler, V. Desjacques. Dynamical friction in fuzzy dark matter: Circular orbits. Physical Review D. Vol. 107(2), 2023. [↩]
- J. M. Silva, J. A. S. Lima, R. E. de Souza, A. D. Popolo, M. L. Delliou, X.-G. Lee. Chandrasekhar’s dynamical friction and non-extensive statistics. Journal of Cosmology and Astroparticle Physics. Vol. 2016(05), pg. 021–021, 2016. [↩]
- R. Goswami, G. F. Ellis. Tidal forces are gravitational waves. Classical and Quantum Gravity. Vol. 38(8), pg. 085023, 2021. [↩]
- J. Silk, A. DiCintio, I. Dvorkin. Galaxy formation. Post-Planck Cosmology. pg. 406–458, 2015. [↩]
- P. Boldrini, E. Vitral. Absence of obvious tidal tails around the GC NGC 6397. Monthly Notices of the Royal Astronomical Society. Vol. 507(2), pg. 1814–1826, 2021. [↩]
- F. Renaud. Star clusters in evolving galaxies. New Astronomy Reviews. Vol. 81, pg. 1–38, 2018. [↩]
- J. I. Read, M. I. Wilkinson, N. W. Evans, G. Gilmore, J. T. Kleyna. The tidal stripping of satellites. Monthly Notices of the Royal Astronomical Society. Vol. 366(2), pg. 429–437, 2006. [↩]
- A.-C. Eilers, D. W. Hogg, H.-W. Rix, M. K. Ness. The circular velocity curve of the Milky Way from 5 to 25 kpc. The Astrophysical Journal. Vol. 871(1), pg. 120, 2019. [↩]
- R. García, E. Salazar, E. Rozo, S. Adhikari, H. Aung, B. Diemer, D. Nagai, B. Wolfe. A better way to define dark matter haloes. Monthly Notices of the Royal Astronomical Society. Vol. 521(2), pg. 2464–2476, 2023. [↩]
- J. F. Navarro, C. S. Frenk, S. D. White. The structure of cold dark matter halos. The Astrophysical Journal. Vol. 462, pg. 563, 1996. [↩]
- J. Bovy, H.-W. Rix. A direct dynamical measurement of the Milky Way’s disk surface density profile, disk scale length, and dark matter profile at 4 kpc ≤ r ≤ 9 kpc. The Astrophysical Journal. Vol. 779(2), pg. 115, 2013. [↩]
- J. Bovy. Galpy: A Python library for Galactic dynamics. The Astrophysical Journal Supplement Series. Vol. 216(2), pg. 29, 2015. [↩]
- J. Bovy. Chandrasekhar dynamical friction. Galpy documentation. https://docs.galpy.org/en/v1.7.2/reference/potentialchandrasekhardynfric.html, 2018. [↩]
- J. A. Petts, J. I. Read, A. Gualandris. A semi-analytic dynamical friction model for cored galaxies. Monthly Notices of the Royal Astronomical Society. Vol. 463(1), pg. 858–869, 2016. [↩]
- J. Webb. galpy.potential.rtide. Galpy documentation. https://docs.galpy.org/en/v1.7.2/reference/potentialrtides.html, 2018. [↩]
- S. Shao, S. Jin, R. Li, L. V. Sales, L. Hernquist, H. Wang. The survival of globular clusters in a cuspy Fornax. Monthly Notices of the Royal Astronomical Society. Vol. 507, pg. 2339–2353, 2021, https://doi.org/10.1093/mnras/stab2285. [↩]
- L. L. Watkins, R. P. van der Marel, S. T. Sohn, N. Wyn Evans. Evidence for an intermediate-mass Milky Way from Gaia DR2 halo globular cluster motions. The Astrophysical Journal. Vol. 873, pg. 118, 2019. [↩]
- A. G. Brown, A. Vallenari, T. Prusti, J. H. de Bruijne, C. Babusiaux, C. A. Bailer-Jones, M. Biermann, … T. Zwitter. Gaia data release 2. Astronomy & Astrophysics. Vol. 616, 2018. [↩]
- A. Helmi, F. van Leeuwen, P. J. McMillan, D. Massari, T. Antoja, A. C. Robin, … T. Zwitter. Gaia data release 2. Astronomy & Astrophysics. Vol. 616, 2018. [↩]
- H. Baumgardt. Structural parameters of Galactic GCs. https://people.smp.uq.edu.au/HolgerBaumgardt/globular/parameter.html, 2023. [↩]


