Abstract
Natural resources, such as coal, oil, minerals, and metals, greatly influence the growth of the country that owns them. Yet, in many cases, these economies suffer from low growth and low productivity in the long-run. Many claim that the reason for this poor growth despite being resource-rich is a result of endemic extractive institutions, and that modernized inclusive institutions are the only path to usher in prosperity. This paper will analyze if stability and elite incentives could be the prerequisite for resource-driven growth as opposed to the conventional narrative. Analyzing the foundational Resource Curse and Dutch Disease theories, and the factors that lead to the development of inclusive institutions, sheds light on how institutions affect growth. This paper further explores whether stability and elite incentives could be used to explain growth outcomes rather than institutional quality alone. To this end, four case studies were used. The experiences of the Democratic Republic of Congo illustrate how elite incentives and institutional quality are interlinked. Botswana and Namibia illustrate how similar institutions can lead to widely different growth outcomes. An analysis of Kazakhstan, a country with extractive institutions yet remarkably strong growth in the last 30 years, was consistent with the hypothesis that long-run economic growth is more strongly associated with aligned elite incentives than with the presence of inclusive institutions. These examples illuminate the nuances within the relationships of elite incentives, institutional quality, growth, and reform, yet conclusions are limited to these four cases.
Keywords: Growth, Elite Incentives, Institutional Quality, Resource Curse, Dutch Disease
Introduction
It is reasonable to expect that access to natural resources is a boon for developing economies. Yet in many developing countries, the presence of natural resources is often associated with low growth and high poverty rates. This paradox is widely thought to point to the extractive institutions (associated with illiberal autocratic regimes) of these countries as the reason they are unable to utilize these natural-resource endowments1. Inclusive economic institutions tend to be those that focus on increasing economic productivity, uplifting the conditions of all citizens, and having a strong rule of law and democratic norms. Extractive economic institutions are the opposite; they aim to extract the maximum amount of wealth and concentrate it in the hands of a few who hold sweeping political power2. As institutions are the foundation of economic and political governance, their flaws or strengths have cascading effects on a country’s future. Conventional thinking argues that inclusive institutions explain why some resource-rich countries escape the Resource Curse while others do not. However, other perspectives highlight potential pathways to growth in autocratic states. This paper explores an alternative explanation: that political stability and elite incentives could explain long-run growth rather than institutional quality alone.
By analyzing the Resource Curse and Dutch Disease theories and understanding the factors that lead to the development of inclusive institutions, it’s possible to begin examining how natural resource-rich economies grow3. A key function of inclusive institutions is to align the incentives of elites and citizens; hence, if autocratic states can have a similar alignment of incentives, autocratic states should be able to access growth. Accordingly, specific analysis of elite incentives is necessary.
Four countries will be analyzed as case-studies to shed light on the hypothesis. The Democratic Republic of Congo has weak institutions, while the contrasting Botswana and Namibia have inclusive institutions. The fourth case study of Kazakhstan, a country with extractive institutions yet strong growth in the last 30 years, is an example that sheds light on whether or not inclusive institutions are required for growth or if stability and elite incentives may permit resource-driven growth. These four countries illuminate the nuances of institutional quality, economic growth, and reform.
Key Terms
Growth: Growth is defined by consistent increases in GDP per capita over time and meaningful improvements in the Human Development Index (HDI), (with additional information being provided by Inequality adjusted HDI or IHDI) and decreases in the Gini coefficient4,5,6. A country with ballooning GDP per capita but stagnant HDI has not achieved the real and equitable growth required to consider it a growing and prosperous economy. Both indicators are used as HDI combines GNI per capita at Purchasing Power Parity with measures of education and health.
Stability: Stability is dependent on the consistency in political management, absence of succession crises and strategic continuity on policy. There are not many variables that contextualize all of the factors that build stability. One metric that will be used as a baseline is the Durable variable which measures the years since regime change which measures institutional stability (the Durable variable by Polity5 being higher does not necessarily mean a country is more stable due to different starting points, rather, it quantifies how long a certain regime existed)7; the other components must be analyzed qualitatively.
Elite incentives: Elite incentives describe the reasons that elites act in particular ways. There is no statistic which can determine the incentives of elites; rather it depends on specific actions taken by elites.
Institutional quality: Inclusive and Extractive institutions have distinct qualities as previously defined. The measures used in this paper for institutional quality include the Corruption Perceptions Index and the Freedom House Index8,9. The former explains the perception of countries from external firms, necessary for understanding the business environment, which will be coupled with the Doing Business Index (while only ranging from 2001 to 2020), for an understanding as to how companies perceive the business related institutions of a specific country and their willingness to engage with them10. The Freedom House Index provides an understanding of the protections of citizen liberties in various countries, often associated with inclusive institutions.
Background: Growth Theories for Resource-Rich Countries
Structural transformation theory explains that countries experience growth as they move up the value chain. This gradual increase in productive output lifts people out of poverty, increases economic prosperity, and improves quality of life— measured by indicators of education, life expectancy, and standard of living in the Human Development Index (HDI)5. In many cases, this transformation is aided by advanced technological sectors and sufficient domestic capital. This movement into modern economic activities is most commonly explained by the three-sector model, which traces a country’s growth through the primary, secondary, and tertiary sectors11. Productivity growth, however, also requires investment in human capital such as educational institutions. Those investments become possible through surplus generated by a country’s natural resource sector. Theoretically, resource-rich countries should be able to use the surplus as investment capital to stimulate many other sectors, thereby leading to increased productivity growth. Yet, paradoxically, many countries with reliance on natural resource endowments have developed more slowly compared to similar non-resource-rich countries3. Resource-rich countries grew on average about one percentage point less between 1970 and 1989 even when controlling for investments, openness, rule of law and initial income per capita3.
By understanding the standard path of growth, it’s possible to determine the key factors that prohibit these resource-rich countries from growing. In most countries, the difficulty arises in this gradual increase of productivity in the movement between agriculture, manufacturing, and services. Yet, different sectors can have vastly different effects on structural transformation. For example, natural resource sectors do not have the same level of capacity to employ people compared to industries like manufacturing. In Malawi, while the labor productivity—output produced per unit of labor—in mining is 136 times higher than in agriculture, the mining sector is unable to absorb sufficient labor for sustained growth12.
Thus, a key problem is that highly productive resource sectors cannot employ sufficient labor to cause structural transformation. The implication is a lack of diversification from the resource sector inhibits the growth of resource-rich countries. As the resource sector lacks sufficient capacity to employ a portion of the labor needed for growth, it’s essential to diversify into other industries that can absorb the excess labor.
While different economists point to various reasons to explain why diversification does not occur, the most prominent theories are the Dutch Disease and the Resource Curse, which explain how free-market interactions and governance, respectively, influence political incentives to diversify.
The Dutch Disease hypothesis claims that the presence of a large exporting sector decreases the competitiveness of other traded sectors13. This claim relies on the following chain of logic: international consumers who want to purchase natural resources, like oil or minerals, use the domestic currency of the exporting country. The purchase of the domestic currency causes increased demand for that currency and, if market forces operate freely, results in the appreciation of its value. This higher-value currency makes other exports of the resource-rich country less competitive. For example, if Currency A and Currency B have equivalent value to begin with, if Currency B doubles in value, then those who hold Currency A have to spend twice as much to purchase the products of Country B. As a result, international consumers are more likely to purchase goods from elsewhere instead of the resource-rich country14. In fact, the term Dutch Disease was based on a natural gas discovery in the Netherlands3.
Currency appreciation is detrimental to developing export sectors because it makes it difficult for them to grow without international consumers. These export sectors are essential for structural transformation because natural resource sectors do not employ enough people to significantly increase productivity. Manufacturing, for example, not only uses a larger share of labor but also generates unique productivity growth over time due to specialization14. The harm of Dutch Disease extends beyond currency appreciation. The increased income from the products for certain groups means that non-traded goods have their prices bid up resulting in additional pressure on manufacturing13. Additionally, natural resource industries are capital-intensive, meaning capital that would otherwise be invested in other industries flows to them. This distribution of capital often prevents other industries from accessing the necessary investment for growth14.
For example, the ready-made garment industry relies on machinery such as sewing machines, which require an upfront investment. Without this investment, the industry would produce hand-stitched garments, which would reduce its size. If governments let market forces operate unimpeded, these types of sectors are weakened, often causing de-industrialization.
While Dutch Disease explains the market mechanisms that hinder diversification, the Resource Curse theory focuses on political systems, specifically how institutions handicap growth. Governance is influenced by natural resources because resource rents generate substantial revenue for governments without the accountability associated with taxation1. Low taxation leads to poor oversight of governmental resource distribution, as electoral accountability is reduced. Most political elites oppose economic diversification as it poses a threat to their political power. The creation of new sectors tends to create a new set of elites who could threaten the current elites’ control over the economy and thus politics15. In other cases, there is simply more focus on short-term gains from resource extraction. Overall, these combined factors lead to poor policy decisions and spending, for example, “white-elephant projects” (wasteful and expensive projects) that weaken economies3.
Such policies often condemn these countries to stagnation because of the volatile nature of natural resource prices and the lack of economic diversification. Even in countries with traditionally inclusive institutions, there are instances of poor policy management due to an abundance of natural resources. This was seen in the Netherlands with huge reallocations of state funding into welfare due to oil price shocks in the late 1900s3. Thus, it is clear that the availability of natural resources could adversely impact political decision-making and economic prosperity. Elite incentives shift from prioritizing economic growth to capturing resource rents while handicapping economic diversification to maintain political power16.
Even though the Dutch Disease focuses on economic factors and the Resource Curse theory focuses on institutional factors, there is considerable common ground between them. Dutch Disease explains how market forces weaken non-resource sectors. The Resource Curse highlights how political elites, who have benefited from resource rents, have almost no incentive to promote diversification. Taken together, the two theories provide a robust explanation for why many resource-rich countries struggle with long-term growth.
Interestingly, these problems can be overcome if elites intervene in the market to act against their short-term interests for long-term gain with appropriate policy action. Elites would be willing to make these decisions if there is a sufficient degree of stability that elites would benefit from long-term growth. For example, Norway created a centralized wage system where the manufacturing sector was the “wage leader,” preserving competitiveness. In conjunction with this policy, Norway established a sovereign wealth fund (SWF) to invest resource surpluses globally, to avoid domestic inflationary pressure and impede the traditional market forces that would harm the economy17.
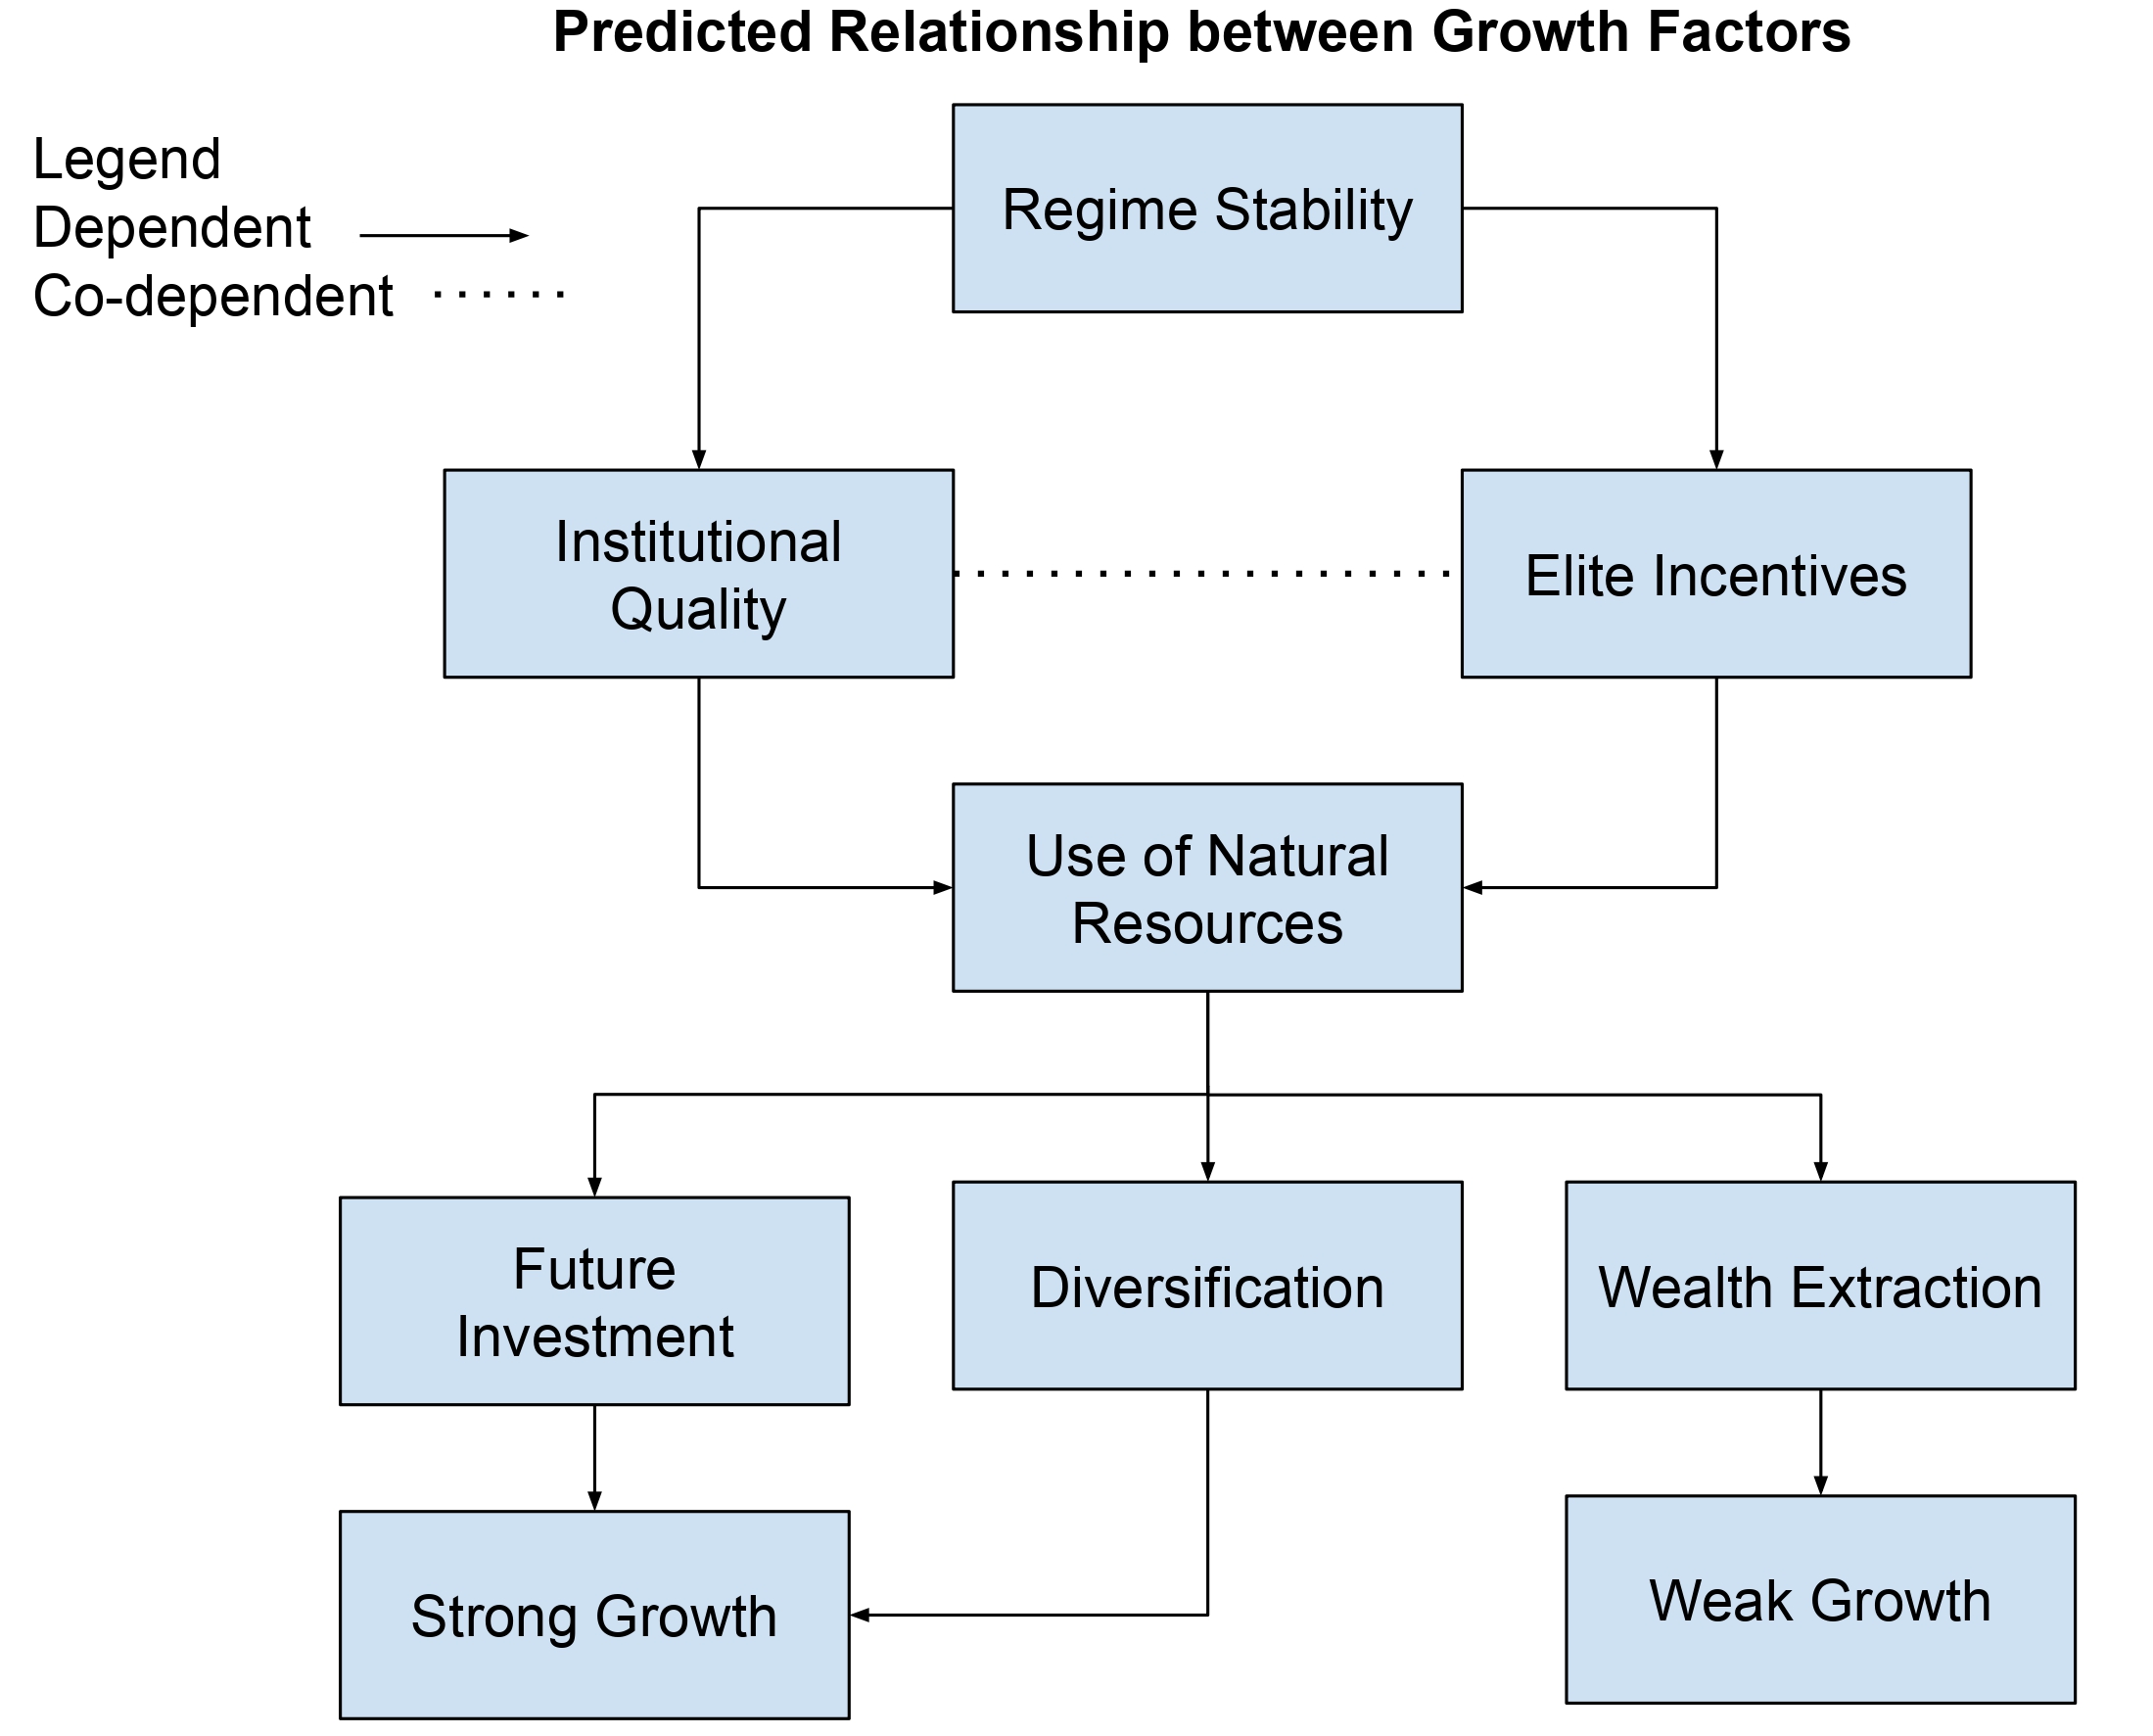
While developing countries would need to modify the Norwegian approach, the underlying principles show that informed policy decisions can prevent much of the harm from Dutch Disease. For instance, developing economies could set manufacturing wages as the wage leader and invest parts of resource windfalls to subsidize manufacturing. This highlights the critical connection between Dutch Disease and Resource Curse theories: both depend on elite incentives to manage resource wealth effectively. When elites are willing to prioritize long-term wealth over short-term extraction, resource wealth can be managed to promote stability, diversification, and growth. The linkages between these concepts are illustrated in Figure 1.
The factors that create inclusive and extractive institutions
The creation of institutions is a complex process that depends on a country’s historical and current experiences. One defining characteristic of many developing resource-rich countries is the legacy of colonialism and its impact on institutional development. The other key aspect is how the current elites interact with the state, which can be explored by building on the institutional aspects of the Resource Curse theory.
While the colonial experience often varied in its severity, most colonial policies aimed to extract the maximum amount of resources and wealth from the colonized country. Many of the richest empires, such as the Mughal, Aztec, and Inca, became much poorer after colonialism compared to relatively underdeveloped societies in the territories that became Australia, the United States, or Canada18. In prosperous societies, it was more profitable to impose extractive institutions — heavy taxation and direct resource extraction. In contrast, where many Europeans settled (for climatic or other reasons), they established more inclusive institutions, such as a strong rule of law and property rights. The example of Guatemala and Uruguay illustrates this effect. In 1500, Guatemala had an urbanization rate of 9.2%, compared to Uruguay’s near-zero urbanization rate. This resulted in the estimate that Guatemala was 42% richer than Uruguay; yet by 1995, Uruguay was roughly 105% richer than Guatemala18. Another example is the institution of slavery. The civilizations with the highest population density, often used as a metric to determine prosperity, exported the most slaves. By 2000, the corresponding countries had some of the lowest incomes19.
The Resource Curse theory posits that, in many cases, weak post-colonial institutions tend to deteriorate over time because elites often corrupt them further; even democracies can devolve into systems of patronage for self-enrichment. Leaders often distribute revenues to their supporters and appoint them to positions of influence to maintain power. This institutional decay weakens private enterprise by making it difficult to do business in these areas. Many investors, who are often the only actors prioritizing long-term projects and creating corporations, want clear regulations and minimal governmental overreach for investment security. Investment is a key driver of economic growth, as corporations bring in capital, skills, and technology, thereby increasing productivity. Corrupt institutions choke off the supply of talented people in productive enterprises. In places where corruption and patronage are the path to wealth and influence, it is unlikely that talented individuals will invest their time in productive activities. These are called “grabber-friendly” institutions and often have poor growth, as most individuals and corporations aim to control natural resource rents20. People who cannot access this wealth through conventional means seize it with violence, mainly because resources are regionally concentrated. The control of natural resources comes with power, making being on the losing side untenable1. Hence, there are many examples of countries with widespread conflict due to natural resources. The many military regimes in Nigeria or conflicts in the Democratic Republic of Congo are consistent with theories that resource wealth can lead to increased instability1. Overall, these factors, explained by the Resource Curse, cause a weakening and corruption of institutions, leaving countries in disarray.
The Resource Curse and colonial history often occur together, which explains why developing countries tend towards extractive institutions. Colonialism favored taking revenue as opposed to building a strong government. If colonial experiences result in extractive institutions, the Resource Curse exacerbates the problem. Even if colonial experiences created more positive institutions, the Resource Curse may still corrupt these institutions over time.
There is still hope for resource-rich developing countries, as even extractive institutions can, under certain conditions, yield positive growth results. Some theorists argue that institutions are less critical than elite incentives. Olson’s stationary bandit hypothesis suggests that a state should have a stable autocrat who consistently extracts a specific amount of money through taxation as opposed to an erratic, unstable system21.
Stability, in Olson’s view, encourages long-term economic growth because a stationary autocrat benefits from expanding the economy to increase future tax revenues. Even in cases where the autocrat does not give people liberal rights, stable autocracies can promote economic development when the ruler’s incentives align with national prosperity21.
Dercon’s argument is similar, explaining that elites are sometimes willing to forgo current benefits of extracting wealth in favor of long-term returns. Both of these explanations highlight that extractive political institutions do not necessarily result in poor economic growth, provided that elites prioritize maintaining stability and encouraging productive investments16. However, the relationship that exists between institutions and elite incentives is quite interlinked. It is possible for extractive institutions to distort elite incentives to become more selfish and opportunistic.
Overall, the development of institutions is integral for growth, yet the specific aspects of these institutions that must be present are debated. Acemoglu and Robinson believe that inclusive institutions are necessary for growth. In contrast, others, such as Olson and Dercon, argue that the right elite incentives can lead to growth even in cases of extractive institutions. In the remainder of this paper, through analyzing country case studies, this paper tests whether elite incentives offer more explanatory traction than institutional quality alone across the four cases.
Methods
In this section, the proposed framework will shed some light on how the theories of growth can apply to different countries. The analyzed theory suggests that the quality of institutions determines growth results. To create a short-list of countries that fit the categories of developing and resource rich, a series of criteria were established. Developing countries are defined as countries with non-high income status as defined by the World Bank in 1998 based on GNI from 199622. The paper will analyze a 35 year time-frame from 1991-2026 to understand their development. Some data might not be available for the entire period, but in aggregate, the various data sources paint a detailed picture of the growth of these countries. A country being resource rich was defined by having at or above 20% of their total exports being ores, minerals, precious stones, non-monetary gold or fossil fuels23. These criteria yielded 60 potential states. Of these, Botswana was selected due to having strong pre-colonial inclusive institutions that avoided the greatest colonial harms24. The Democratic Republic of Congo (DRC) was selected due to being considered one of the richest countries in terms of natural resource endowment and for its high reliance on these resources. The cases of the DRC and Botswana largely follow the inclusive institution hypotheses and further analysis will illustrate how previously discussed theory applies in actual scenarios. Namibia was selected due to having inherited strong institutions from South Africa and being similar to the Botswana case in type of export25. If the growth outcomes of Namibia and Botswana differ, it would suggest growth is not guaranteed with inclusive institutions. Kazakhstan was selected due to unique institutional origins, originating from a post-soviet state with highly centralized power that could act in ways Olson’s Stationary Bandit predicts and would examine whether Olson’s theory leads to growth outcomes. Should the case of Kazakhstan show that elite incentives may have led to this growth, it could mean inclusive institutions are not necessary for growth, rather aligned elite incentives may accomplish many of the same preconditions for growth. Four cases were selected to allow sufficient depth of analysis into the specific history, policies and outcomes of each country. In summary, Botswana and Namibia have similar inclusive institutional origins which sheds light on how inclusive institutions shape growth. The DRC and Kazakhstan have more extractive institutions which shed light on whether extractive institutions handicap most forms of equitable growth. While four cases cannot definitely prove whether or not inclusive institutions are necessary for growth, their growth outcomes will shed light on whether alternative paths to growth are possible and if inclusive institutions always lead to growth.
After selection of the cases in the method above, the following pattern, as shown in Table 1, was observed. Two countries had inclusive institutions and two had extractive institutions yet both countries within these groups surprisingly had vastly different growth outcomes.
| Weak Growth | Strong Growth | |
| Inclusive Institutions | Namibia | Botswana |
| Extractive Institutions | Democratic Republic of Congo | Kazakhstan |
If institutional quality alone predicted growth, Botswana and Namibia would have strong growth, while both the Democratic Republic of Congo and Kazakhstan would have weak growth. If elite incentives explain growth, the Democratic Republic of Congo and Namibia would have weak growth, while both Botswana and Kazakhstan would have strong growth.
In the remainder of the paper, these case studies will be explored with analysis on how each model is able to explain the growth conditions of these countries. Specifically exploring the case of Kazakhstan, a country with extractive institutions yet high growth, which will be necessary in making the determination about whether or not inclusive institutions are truly necessary for growth.
Results
Case Study 1: Democratic Republic of Congo – Weak Growth and Extractive Institutions
Background
The Democratic Republic of Congo (DRC) as the first case will test whether or not extractive institutions preclude growth, as seen with the low GDP per capita of US$806.8 as of 20254. The DRC is frequently cited as consistent with the theory of the Resource Curse. It experienced considerable economic decline in the late 20th century, mostly because of its weak institutions caused by a history of colonialism, leading to events like the Congo Crisis in the early 1960s. The DRC experienced a massive economic slump. By 2000, the mining sector was contributing to GDP at around 30% of the mid 1980s level26. The DRC’s weak institutions led to widespread corruption, economic mismanagement, and conflict, which explains the negative or low growth within the DRC27. The lack of growth is in line with a failure to achieve structural transformation, seen by the very high share of employment in agriculture starting at 58.6% in 1991 and after a brief increase, being at the same level at 58.5% in 202528. In this period, industry as a share of employment actually decreased from 9% to 8%, illustrating a lack of economic diversification28. The implications of this failure can be seen by the incredibly low HDI and IHDI of the DRC of 0.522 and 0.341 respectively as of 20235,6. The International Monetary Fund (IMF) points to other factors, including a lack of investment in the country that further led to poor growth outcomes26. This lack of investment is supported by low performance on many indicators, being ranked 183 in the world in the Doing Business 2020 Indicator and being ranked 163rd in the world with a score of 20 on the Corruption Perception Index in 20258,10.
How do the growth theories apply to the DRC?
The case of the DRC demonstrates how the Resource Curse theories apply in the real world. The factors of poor governance, lack of investment, and conflict all relate with the predictions made by many academics regarding the Resource Curse. The DRC’s experience highlights how both of the factors of institutional formation can cause considerable harm to a country’s future. The legacy of exploitative institutions and corruption, sown in the Congo Free State, continue to plague the DRC into the present day as seen by Freedom House Index score of 18 as of 20269. This effect was then exacerbated by various elites who opportunistically amassed their fortunes, as showcased by an increasing Gini coefficient, an inequality index by the World Bank, of 44.7 as of 202029. It is evident that the DRC lacks many diversified industries that would allow for growth, likely due to a combination of both the Resource Curse and Dutch Disease theories. The case of Mobutu Sese Seko, the dictator of the DRC from 1965 to 1997, shows the intertwined relationship between elite incentives and institutional structure. Mobutu Sese Seko took 15-20% of the state’s operating budget in the 1970s for personal use30. Interestingly, the DRC received a durable score of 25 by 1991, and due to a series of conflicts and changes in power, only recently had a stable increasing score7. Despite Mobutu’s stability, he continued to enrich himself at the expense of the population. Acemoglu and Robinson point to Mobutu’s divide and conquer strategy, and weak institutions as to why this gross corruption was possible, yet, the reason for his exploitation would be his self-interest30. In this regard, Mobutu’s elite incentive for personal gain could be preexisting and exacerbated by weak institutions or may have developed opportunistically as a result of the weak institutions. Thus, this case is consistent with both the institutional and elite incentive theory, showing that the absence of strong institutions and/or elite incentives prevents growth, the closely interrelated relationship between institutions and elites, and serves as a baseline for further analysis.
Case Study 2: Botswana – Strong Growth and Inclusive Institutions
Background
Botswana as the second case will test if inclusive institutions lead to growth, however, the extent of stability within Botswana means that even if Botswana succeeds it does not mean institutional quality is the only path to growth, rather confirming that the combination of both features will lead to growth. Botswana is heralded as a country that was able to break the Resource Curse and prosper economically. Botswana’s GDP per capita increased from US$446.5 to US$7,649.8 over 50 years, from 1974 to 20244. As of 2020, Botswana was ranked 87th in the Doing Business Index and ranked 41st in the world with a score of 58 on the Corruption Perception Index in 20258,10. The quality of Botswana’s democratic institutions is also incredibly high with a score of 75 on the Freedom House Index as of 20269.
Botswana’s Institutions
The conventionally accepted key factor for Botswana’s consistent growth was its traditional institutions, which developed distinctly compared to many other colonies. As diamonds were only discovered in 1967, one year after independence from the British protectorate, many extractive institutions, commonplace in other colonies, were never developed31. Before the discovery of diamonds, Botswana’s largest sector was cattle farming, which was difficult to tax, resulting in relatively low colonial infringement. The tribes within Botswana, with the Tswana tribes being the dominant group, avoided conflict by moving to enclaves away from potential aggressors, made possible by cattle farming31. While there were other ethnic groups, conflict was avoided because many other tribes cooperated with the Tswana tribes, who were the political elites. These conditions imply that the institutions of Botswana were unique due to a lack of colonial interference through strategies like divide and rule, and a relatively homogenous society with similar beliefs. This led to a unique set of elite incentives, even before the discovery of diamonds, which focused on ameliorating the conditions of the people. Chiefs were held accountable through councils called kgotla, which aimed to align the chiefs’ incentives with other tribe members32. Overall, this showcases that Botswana’s institutions had a unique stability, as seen by a score of 52 in the Durable index as of 2018, that was not present in many other post-colonial states, caused by traditional institutions7.
The traditional heritage of Botswana’s institutions also likely reduced conflict over succession, as succession would have become standardized over time. This would lead to long-term incentives for elites who would want to invest to ensure better conditions for their children21. This is demonstrated by the Khama family’s influence over the Botswana Democratic Party, including both Sir Seretse Khama and his son Ian Khama being president33. While there was some concern about this lineage becoming an oligarchy and elites amassing the majority of profits, the Human Development Index (HDI) of Botswana has improved from 0.590 in 1990 to 0.731 in 20235. However, Botswana’s IHDI was 0.509 in 2023 showcasing a wide variety of outcomes in the population6. Coupled with a relatively high Gini coefficient of 54.9 as of 2015, it shows that despite inclusive institutions, there’s difficulty with equitable distribution of growth outcomes4.
The above analysis only explains how Botswana interacted with the Resource Curse; understanding the policies that prevented Dutch Disease provides replicable ways for countries to escape this trap. Botswana invested in a joint partnership with De Beers, allowing them to develop the capital-intensive industry and maintain relatively stable prices due to De Beers’ quasi-monopoly on diamond pricing31. This strategic partnership mitigated volatility, allowing stable growth. The government used a variety of policies, including amassing foreign exchange reserves, instituting a central bank, and controlling fiscal spending through National Development Plans, ensuring long-term planning31. These budgetary policies avoided the Dutch Disease harms of de-industrialization, currency appreciation, and improper government spending.
Botswana’s Policy Decisions and the Effect on Growth
Another key policy was Botswana’s establishment of the Pula fund in 1993, in an effort to protect resource revenues for future generations and avoid the harms of Dutch Disease as seen in Norway34. This was coupled with policies created by Seretse Khama to create an effective economic system. Charles Barclay writes that Khama’s landownership encouraged him to protect property rights and make laws that resolved property disputes35. Additionally, his decision to create specialized positions in the cabinet without shuffling resulted in the development of technical expertise, allowing better decision making. These policies aimed to create a temporal transfer of wealth ensuring future generations also benefit.
As for structural transformation, Botswana’s employment was mostly service driven by 1996. This can be seen with the roughly 66% employment in services remaining stable between 1995 to 202528. While there was an interesting reversal between the share of employment between industry and agriculture, agriculture being around 15% before shooting up to around 20% in 2006 with the opposite effect occurring in industrial employment, the overall trend shows a relatively productive economy28. However, there was an increase in resource exports as a share of total exports from 80.8% in 1995 to 91.7% by 2024, showcasing an increasing reliance on natural resources23. This is reinforced by the fact Botswana’s public sector capital had a growth rate of 15% compared to the private sector’s 7.7%, coupled with the large role of the mining sector, which implies that some degree of economic diversification did not occur, the overall goal of the policies to reinvest resource rents into other sectors did build Botswanan wealth36.
As a result, Botswana’s growth seems to be decoupled from diversification but rather mostly focusing on elite-driven reinvestment and the development of stronger institutions. Moreover, the commitment to inclusive institutions persisted because the structure of power led to robust property rights through indigenous governance. These strong property rights encouraged more investment from external sources because the returns were more secure, as illustrated by the De Beers partnership31. This fits into Dercon’s analysis of the Elite Bargain: elites had an incentive to invest in long-term growth due to accountability and potential riches from a more productive country16. Overall, strong traditional institutions led to prudent policies that avoided many of the harms of natural resources, showcasing the importance of institutions in development. Botswana showcases that the presence of both strong institutions and positive elite incentives lead to growth. Therefore, Botswana cannot show which explanation is stronger.
Case Study 3: Namibia – Weak Growth and Inclusive Institutions
Background
Namibia became independent from South Africa in 1990, inheriting many of South Africa’s political institutions including the legal system and democracy. Additionally, the geographical proximity to Botswana and overlap of many key resources means it provides a valuable comparison as to the unique role of inclusive institutions at achieving growth outcomes. Namibia’s growth was somewhat in line with Botswana with increased volatility, with Namibia’s GDP per capita rising from US$2,037.5 in 1990 to US$5,942.6 in 2012; however, in the years that followed GDP per capita fell to a low of US$3,878.6 in 2020 before rising to US$4,875.9 in 20254. However, this growth was not spread equally with Namibia’s Gini Coefficient being ranked among the highest in the world at 59 as of 2015 down from a peak of 71 in 19934. This is supported by the fact that Namibia’s HDI is moderately high with a value of 0.665, yet the IHDI is ~34% lower at 0.438 as of 20235,6. However, the lack of growth is not due to political instability, corruption or restrictions, rather, Namibia’s overall quality of institutions was quite high as seen by a Corruption Perception Index score of 46, ranked 65th in the world as of 2025, and a 2026 Freedom House score of 738,9. Namibia has maintained a perfect durable score since 1990 due to no major changes in regime, resulting in a score of 28 as of 2018, showcasing a large degree of political stability, reinforced with the fact that the South West Africa People’s Organisation (SWAPO) has maintained control of the presidency since independence7,37. However, it is apparent that there are perceived difficulties with business in Namibia as in the Doing Business index 2020 Namibia ranked 104th in the world10. Likely, the issues originate from problems with specific business facing institutions such as regulatory issues. It is possible that due to electoral cycles, the short-termist democratic incentives that existed for political parties may have harmed the policy outcomes the government selected. This may explain the lack of long-term investment into the economy and the spending of natural resource revenues on short-term economic stimulus. The apparent “flip-flopping” on key policy decisions as cited by the Institute for Public Policy Research created uncertainty that appears to originate from misaligned elite incentives38.
Namibia’s Growth Outcomes
As a result, Namibia fell prey to many of the theoretical traps due to a lack of reinvestment of natural resource revenues both in the pre-1990 and post 1990 governments. In contrast to Botswana’s policies of increasing foreign exchange reserves, controlling fiscal spending and instituting long-term plans36, Namibia only created a sovereign wealth fund in 2022, nearly 30 years after Botswana’s comparable Pula fund39.
While there has been an increase in the employment of the service sector as a share of the population from 38.5% in 1991 to 61.1% in 2025, industry only increased from 16.2% to 16.5% in the same period28. However, Namibia’s share of resource exports as a share of total exports increased from 39.8% in 1995 to 61.5% in 2024, showcasing an increasing reliance on resource exports23. Coupled with all other facts on the results of the country, Namibia seems to have a very similar economic structure to Botswana, meaning the difference in growth outcome is puzzling. Likely, the differences arise from the investment Botswana established like various SWFs which Namibia established much later.
Overall, Namibia’s case in contrast to Botswana gestures to the conclusion that despite having strong institutions, it depends on the correctly aligned long-term elite incentives to create long-term equitable growth. Namibia’s strong political institutions outperform many peers, yet the lack of structural transformation and resource rent reinvestment prevented truly transformative growth in its economy40.
Case Study 4: Kazakhstan – Strong Growth and Extractive Institutions
If Kazakhstan prospers despite extractive institutions, it suggests that inclusive institutions may not be necessary for growth. Kazakhstan is a post-Soviet economy with many of the same institutions as other Soviet countries. It exhibits very little political freedom, an autocratic system of rule, and a significant reliance on natural resources. Many of the same hallmarks of other resource-rich economies that remain trapped in poverty are present, yet Kazakhstan has grown significantly in the past 30 years. This growth presents an interesting case that seems to contradict the conventional understanding of inclusive institutions leading to growth.
Background
In 1991, Kazakhstan became an independent nation separate from the planned economy of the Soviet Union. Kazakhstan had rich reserves of oil, natural gas, and metals, yet these resources were managed poorly for years after independence41. Kazakhstan’s institutions were primarily controlled by Nursultan Abishuly Nazarbayev, who was president from the start of the republic until 201942,43. The policies that Kazakhstan implemented in the 1990s echoed much of the Russian policies, including price liberalization and privatization efforts. However, the corrupt institutions prevented the efficacy of these policies. Compounded with low oil prices and geopolitical issues, the 1990s were harmful for growth, with GDP per capita being lower in 2000 compared to 199041,44. An increase in oil prices in 1999 provided a needed stimulus for the economy, yet this reliance on resources could negatively impact growth through the Dutch Disease and Resource Curse theories.
Institutional Structure and Political Incentives in Kazakhstan
While Kazakhstan remains autocratic, a key characteristic of its autocracy may have encouraged a stronger focus on growth: Nazarbayev’s stable power. Dercon’s theory applies as the long-term stability of Nazarbayev’s control made the elite bargain very profitable for him and his family16. Olson would highlight that a leader in a stable position could act as a stationary bandit, where sustained taxation becomes more profitable when the economy grows over time. This is shown by the durable score of 23 by 2018 after starting by 1991. The score marks a break in power as of 1995 yet this actually increased Nazarbayev’s control by removing any constraints on his power7.
The stationary bandit theory suggests that Nazarbayev could act in the theoretically best way21. In many circumstances, an elite can hold power for decades but still have conflicts over this control. In these circumstances, the positive economic results are less likely to occur. This stability would lead Nazarbayev to act similarly to Botswana’s elites despite the lack of accountability, as the end goals become similar. This was made possible by the stability of the Soviet institutions, which largely continued in Kazakhstan and clearly favored centralized control41. The concentration of power within the President’s office and vertical structure, albeit weaker than in other Central Asian countries, created a strong long-term system with clear divisions of rents and power43. Kazakhstan’s stability potentially explains many of the strategic focuses of the regime, like investment into education, and openness to business, where it’s ranked 25 internationally on the Doing Business Index5,10. While the degree of innovation and efficiency in the market appears to be structurally limited due to the entrenched interests, many new elites developed through partnerships with entrenched elites, mitigating the extent of rivalry43. Without these specific partnerships, it is unlikely that Kazakhstan would have diversified even to the relatively limited extent that it did, as the consequences of diversification are detrimental for the ruling elites. Furthermore, Kazakhstan established many SWFs to reinvest proceeds, the Kazakhstan National Fund was founded in 2000, shortly after the oil crash, and the Samruk-Kazyna was founded in 2008, after the Great Recession45,46. The elites responding to crises affecting the entire economy show a set of incentives that aligned with overall growth.
While Kazakhstan’s growth could be attributed in part to oil revenues, it’s clear that the non-oil economy expanded in the last few decades. Kazakhstan’s non-oil GDP only had a negative growth rate in 2009 and 2020. Despite the external shocks that caused these events, the economy enjoyed a mean growth of 5.83% between 2002 and 202447. Compounding the growth of both oil and non-oil GDP from a 2002 baseline, where the baseline is valued at 100, non-oil GDP would be valued at 344.0 in 2024 and oil GDP would be valued at 185.347,48. This illustrates that Kazakhstan’s policies have led to growth in non-oil sectors which is further reinforced by the fact that after 2000, Kazakhstan’s GDP only shrank in 20204. Kazakhstan’s GDP per capita is at US$14,692.1 as of 2025 up from US$1,281.4 in 19964. However, after a fall in oil prices in 2014, there was nearly a halving in the growth rate for non-oil GDP, which is expected as the growth in non-oil sectors was largely financed through oil rents and does not discount the overall positive economic development of Kazakhstan47. Kazakhstan’s share of employment in the service sector increased from 43.7% to 68.8% between 1991 and 2025 which was coupled with a gradual decrease in agricultural employment from 38% to 11.3%28. Industry as a share of employment moved from 18.3% to 19.9% in the same period28. While the share of resource exports as a share of total exports began at 49.1% in 1995 and ended at 72.7% in 2024, there was a gradual rise until 2013 at 87.1% which began to steadily decrease over the next ten years showcasing a positive change in the Kazakh economy23.
Does this growth benefit the people?
Despite weak institutions, Kazakhstan’s growth has materially benefited citizens. Understanding the effects of growth on the population is essential to determine whether strong institutions are required for democratizing growth. Kazakhstan clearly does not have a benevolent autocracy, as illustrated by the Freedom House Index remaining at 23 in 20269. Yet, the government’s policies have benefits for all citizens. The share of the population living in extreme poverty has dropped from 20.7% in 2001 to 0.04% in 2021, and the HDI score reached 0.837 in 2023, with an IHDI of 0.7665,6,44. However, when using the $8.30 a day poverty line for an upper-middle income country, the poverty rate jumps to 15.15%, showcasing some stress on the full equitable nature of the economic growth44. The median daily income more than doubled in real terms (adjusting for inflation and differences in cost of living) since the start of the 21st century44. Kazakhstan’s 2021 value of 12.24 international dollars is on par with China’s 13.39 at the same time44. In fact, Kazakhstan’s Gini coefficient is 29.2 as of 2021, showcasing significant equality, however, some alternative measures have seen a high degree of wealth concentration in the top 1%43,44. Kazakhstan is in an interesting position where growth benefits the people despite weak institutions resulting from specific elite incentives.
Interestingly, there has been further institutional reform in recent years, and the perception of Kazakhstan among investors has been improving. The Corruption Perception index score increased to 38 in 2025 from 26 in 20138. This suggests that originally weak institutions can reform after periods of growth, when the elite bargain is favorable, leading to some liberalization. Thus, the theoretical applications of elite bargain and stationary bandit analysis apply in some form to Kazakhstan.
Discussion
After understanding each case study, a recurring differential in the selected cases’ growth outcomes became how resource rents were allocated as shown in Table 2.
| DRC | Botswana | Namibia | Kazakhstan | |
| Institutional Quality | Extractive Institutions | Inclusive Institutions | Inclusive Institutions | Extractive Institutions |
| Creation of Investment Mechanisms like SWFs | No investment mechanisms | Creation of Pula fund (1993) | Creation of Welwitschia fund (2022) | Creation of National Fund (2000) |
| Growth Outcomes | Weak Growth | Strong Growth | Weak Growth | Strong Growth |
Overall, Kazakhstan sheds light on how growth theories apply within autocratic systems to generate strong outcomes despite extractive institutions. Elite incentives and stability were important, echoing Olson’s stationary bandit model and Dercon’s elite bargain framework. This comparison also helps explain the bigger question of whether inclusive institutions are required for growth in resource-rich economies. These four cases suggest institutional quality alone may not sufficiently explain divergent growth outcomes. Even weak institutions can allow elites to push growth if their power is stable and they see long-term benefits16. This shows that being autocratic may not automatically mean a country will face economic failure. This comparison aligns with Botswana’s success: indigenous institutions provided long-term stability, much like Kazakhstan’s autocracy. There are exceptions such as the DRC’s stable autocrat that still extracted immense wealth and Namibia’s political elite falling into a spiral of economic stimulus that suggest stability alone does not lead to growth, rather it is a prerequisite to elites being able to make long-term decisions.
While Kazakhstan did not have the same colonial experience that hurt many countries, its post-Soviet system faced similar challenges. This means Kazakhstan’s experience can still be helpful in understanding how other resource-rich countries might develop. Interestingly, all four case studies did not see considerable structural transformation, rather the growth outcomes were heavily based on how resource rents were spent, either on immediate spending or long-term developments. Across resource-rich economies, natural resources can be used to push economies up the development ladder if the money is spent wisely. Kazakhstan suggests resource revenues can be a stepping stone for some diversification. While it was theorized that countries need policies that protect other sectors, reuse resource revenues, encourage outside investment, and create industries linked to resources, to achieve growth, these four cases suggest that it is the distribution of resource rents that is of greater importance than perfectly following a structural transformation pathway. This was also seen in the case of Norway and was quite useful to avoid the harms of Dutch Disease and the Resource Curse for over two decades17. Overall, the cases point to reinvestment of resource rents and the early establishment of the institutions that protect them, namely SWFs, as a clear distinguishing factor across these cases of economic growth in the last 30 years. This was seen as Namibia’s late development of SWFs and the DRC never establishing them set them behind relative to Botswana and Kazakhstan who set up funds early. While the conclusions are limited to only these four cases, it may be that in resource rich countries, the conventional increase of productivity through structural transformation is achievable despite reliance on natural resources for exports continuing, although future developments as time passes may arise such as greater shocks in commodity prices. However, the economies of these cases are not identical to all developing economies and as such, resource rent reinvestment may not be sufficient in many situations and countries may require diversification in line with conventional wisdom.
In the end, natural resources are not simply a blessing or a curse—they are a tool. The results depend on how leaders use them. Stability, whether in a democracy or an autocracy, is needed to give leaders the chance to think long-term, strengthen institutions, and create growth that benefits citizens. However, it’s essential that the elites are willing to invest in those long-term outcomes, otherwise some may use stability as a tool to extract more wealth now. Kazakhstan suggests that even with an autocratic system, growth for the people is possible when stability and the right incentives are in place meaning that institutional quality is likely one of many pathways to growth.
Acknowledgments
There are no conflicts of interest in this paper; no funding was used from outside sources. AI tools were consulted for reviewing citations and ensuring compliance.
References
- P. Collier, A. Hoeffler. Resource rents, governance, and conflict. Journal of Conflict Resolution. Vol. 49, pg. 625–633, 2005, https://doi.org/10.1177/0022002705277551. [↩] [↩] [↩] [↩]
- D. Acemoglu, J. A. Robinson. Why nations fail: the origins of power, prosperity, and poverty. Profile Books, London, 2013. [↩]
- F. van der Ploeg. Natural resources: curse or blessing? Journal of Economic Literature. Vol. 49, pg. 366–420, 2011, https://doi.org/10.1257/jel.49.2.366. [↩] [↩] [↩] [↩] [↩] [↩]
- World Bank. World development indicators. Washington, DC: World Bank, https://databank.worldbank.org/source/world-development-indicators, 2025. [↩] [↩] [↩] [↩] [↩] [↩] [↩] [↩]
- United Nations Development Programme. Human development report 2025. New York: UNDP, 2025. [↩] [↩] [↩] [↩] [↩] [↩] [↩]
- United Nations Development Programme. Inequality-adjusted Human Development Index. Human Development Reports, New York: UNDP, https://hdr.undp.org/inequality-adjusted-human-development-index, 2025. [↩] [↩] [↩] [↩] [↩]
- M. G. Marshall, T. R. Gurr. Polity5: political regime characteristics and transitions, 1800–2018. Center for Systemic Peace, Vienna, VA, 2020, https://www.systemicpeace.org/inscrdata.html. [↩] [↩] [↩] [↩] [↩]
- Transparency International. Corruption perceptions index 2025. Berlin: Transparency International, https://www.transparency.org/en/cpi/2025, 2026. [↩] [↩] [↩] [↩] [↩]
- Freedom House. Freedom in the world: countries and territories. Washington, DC: Freedom House, https://freedomhouse.org/country/scores, 2026. [↩] [↩] [↩] [↩] [↩]
- World Bank. Doing business 2020: training for reform. Washington, DC: World Bank, 2020, https://documents1.worldbank.org/curated/en/688761571934946384/pdf/Doing-Business-2020-Comparing-Business-Regulation-in-190-Economies.pdf. [↩] [↩] [↩] [↩] [↩]
- M. Wolfe. The concept of economic sectors. Quarterly Journal of Economics. Vol. 69, pg. 402–420, 1955, https://doi.org/10.2307/1885848. [↩]
- M. McMillan, D. Rodrik. Globalization, structural change, and productivity growth. NBER Working Paper No. 17143. National Bureau of Economic Research, Cambridge, MA, 2011, https://www.nber.org/papers/w17143. [↩]
- W. M. Corden, J. P. Neary. Booming sector and de-industrialisation in a small open economy. Economic Journal. Vol. 92, pg. 825–848, 1982, https://doi.org/10.2307/2232670. [↩] [↩]
- J. Di John. Is there really a resource curse? A critical survey of theory and evidence. Global Governance. Vol. 17, pg. 167–184, 2011. [↩] [↩] [↩]
- D. Acemoglu, J. A. Robinson. Political losers as a barrier to economic development. American Economic Review. Vol. 90, pg. 126–130, 2000. [↩]
- S. Dercon. Gambling on development: why some countries win and others lose. Hurst, London, 2022. [↩] [↩] [↩] [↩] [↩]
- E. Røed Larsen. Escaping the resource curse and the Dutch disease? When and why Norway caught up with and forged ahead of its neighbours. American Journal of Economics and Sociology. Vol. 65, pg. 605–640, 2006, https://doi.org/10.1111/j.1536-7150.2006.00476.x. [↩] [↩]
- D. Acemoglu, S. Johnson, J. A. Robinson. Reversal of fortune: geography and institutions in the making of the modern world income distribution. Quarterly Journal of Economics. Vol. 117, pg. 1231–1294, 2002, https://doi.org/10.1162/003355302320935025. [↩] [↩]
- N. Nunn. The long-term effects of Africa’s slave trades. Quarterly Journal of Economics. Vol. 123, pg. 139–176, 2008, https://doi.org/10.1162/qjec.2008.123.1.139. [↩]
- H. Mehlum, K. Moene, R. Torvik. Institutions and the resource curse. Economic Journal. Vol. 116, pg. 1–20, 2006, https://doi.org/10.1111/j.1468-0297.2006.01045.x. [↩]
- M. Olson. Dictatorship, democracy, and development. American Political Science Review. Vol. 87, pg. 567–576, 1993, https://doi.org/10.2307/2938736. [↩] [↩] [↩] [↩]
- World Bank. World Bank analytical classifications: GNI per capita in US$ (Atlas methodology). Washington, DC: World Bank, https://datahelpdesk.worldbank.org/knowledgebase/articles/906519-world-bank-country-and-lending-groups, 2026. [↩]
- United Nations Conference on Trade and Development. Merchandise: trade matrix — annual (analytical). UNCTADstat, Geneva, https://unctadstat.unctad.org/datacentre/dataviewer/US.TradeMatrix, 2026. [↩] [↩] [↩] [↩]
- D. Acemoglu, S. Johnson, J. A. Robinson. An African success story: Botswana. In D. Rodrik (ed.), In search of prosperity: analytic narratives on economic growth. Princeton University Press, Princeton, NJ, 2003. [↩]
- World Bank. Namibia: country brief. Washington, DC: World Bank, 2009, https://doi.org/10.1596/978-0-8213-7870-0. [↩]
- International Monetary Fund. Democratic Republic of the Congo: selected issues and statistical appendix. IMF Country Report No. 03/175. Washington, DC: International Monetary Fund, 2003, https://doi.org/10.5089/9781451841152.002. [↩] [↩]
- L. O. Abdulwahab, E. A. Firmansyah. Are abundant natural resources in the Democratic Republic of the Congo a blessing or curse? Journal of Innovation in Business and Economics. Vol. 8, pg. 47–60, 2024, https://doi.org/10.22219/jibe.v8i01.30330. [↩]
- International Labour Organization. ILO modelled estimates database. ILOSTAT, Geneva, https://ilostat.ilo.org/data/, 2025. [↩] [↩] [↩] [↩] [↩] [↩] [↩]
- World Bank. Poverty and inequality platform: Democratic Republic of Congo. Washington, DC: World Bank, https://pip.worldbank.org/, 2025. [↩]
- D. Acemoglu, J. A. Robinson, T. Verdier. Kleptocracy and divide-and-rule: a model of personal rule. Journal of the European Economic Association. Vol. 2, pg. 162–192, 2004, https://doi.org/10.1162/154247604323067916. [↩] [↩]
- P. Martin. A closer look at Botswana’s development: the role of institutions. Paterson Review of International Affairs. Vol. 9, pg. 35–54, 2008. [↩] [↩] [↩] [↩] [↩]
- E. Hillbom. Botswana: a development-oriented gate-keeping state. African Affairs. Vol. 111, pg. 67–89, 2011, https://doi.org/10.1093/afraf/adr070. [↩]
- Botswana (1966–present). DADM Project: Sub-Saharan Africa Region. University of Central Arkansas, https://uca.edu/politicalscience/home/research-projects/dadm-project/sub-saharan-africa-region/66-botswana-1966-present/, 2025. [↩]
- International Forum of Sovereign Wealth Funds. Botswana: Pula Fund. London: IFSWF, https://www.ifswf.org/members/botswana, 2026. [↩] [↩]
- C. A. Barclay. Factors that contributed to the economic success of Botswana. M.A. project, Simon Fraser University, 2009, https://summit.sfu.ca/item/9589. [↩]
- G.-M. Lange. Wealth, natural capital, and sustainable development: contrasting examples from Botswana and Namibia. Environmental and Resource Economics. Vol. 29, pg. 257–283, 2004, https://doi.org/10.1007/s10640-004-4045-z. [↩] [↩]
- Encyclopaedia Britannica. History of Namibia. https://www.britannica.com/topic/history-of-Namibia, 2025. [↩]
- Institute for Public Policy Research. Namibia quarterly economic review, Q1 2020. Windhoek: IPPR, 2020, https://ippr.org.na/wp-content/uploads/2020/04/Namibia-QER-Q1-2020.pdf. [↩]
- Bank of Namibia. The Welwitschia Fund. Windhoek: Bank of Namibia, https://www.bon.com.na/Bank/Welwitschia-Fund.aspx, 2022. [↩] [↩]
- R. Hausmann, M. A. Santos, D. Barrios, N. Taniparti, J. Tudela Pye, F. Muci, J. Lu. A growth diagnostic of Namibia. CID Faculty Working Paper No. 405. Harvard Growth Lab, Cambridge, MA, 2022, https://growthlab.hks.harvard.edu/wp-content/uploads/2022/02/2022-02-cid-wp-405-namibia-growth-diagnostic.pdf. [↩]
- R. Pomfret. Kazakhstan’s economy since independence: does the oil boom offer a second chance for sustainable development? Europe-Asia Studies. Vol. 57, pg. 859–876, 2005, https://doi.org/10.1080/09668130500199321. [↩] [↩] [↩]
- Encyclopaedia Britannica. Nursultan Nazarbayev. https://www.britannica.com/biography/Nursultan-Nazarbayev, 2025. [↩]
- S. Commander, R. Prieskienyte. The political economy of Kazakhstan: a case of good economics, bad politics? CASE Working Paper No. 15 (139). Center for Social and Economic Research, Warsaw, 2021, https://case-research.eu/app/uploads/2024/06/id_plik6896.pdf. [↩] [↩] [↩] [↩]
- World Bank. Poverty and inequality platform: Kazakhstan. Washington, DC: World Bank, https://pip.worldbank.org/country-profiles/KAZ, 2025. [↩] [↩] [↩] [↩] [↩] [↩]
- Sovereign Wealth Fund Institute. Kazakhstan National Fund. https://www.swfinstitute.org/profile/598cdaa50124e9fd2d05b556, 2026. [↩] [↩]
- Global SWF. Samruk-Kazyna. https://globalswf.com/fund/SAMRUK, 2026. [↩]
- International Monetary Fund. Non-oil real GDP growth in constant prices for Kazakhstan [KAZNGDPXORPCHPT]. Retrieved from FRED, Federal Reserve Bank of St. Louis, https://fred.stlouisfed.org/series/KAZNGDPXORPCHPT, 2026. [↩] [↩] [↩]
- International Monetary Fund. Oil real GDP growth in constant prices for Kazakhstan [KAZNGDPORPCHPT]. Retrieved from FRED, Federal Reserve Bank of St. Louis, https://fred.stlouisfed.org/series/KAZNGDPORPCHPT, 2026. [↩]