
Abstract
With the rapid growth of personal and corporate lending, loan default risk prediction has become a core component of commercial banks’ risk control system. In this paper, the author aims to build effective machine learning models to accurately predict bank loan default, mitigating the effects of information asymmetry, enabling better credit decisions and extending loans to a broader population. Various features, including age, income, interest rate, and engineered features etc, from a dataset of over 250,000 cases were used on four models: logistic regression, naive bayes, decision tree, and neural network. The model performance results show that it would be misleading if researcher only rely on single parameter, like the accuracy, as the evaluation metrics. This study uses the F1-score and ROC-AUC as the primary evaluation metric because they provide a balanced assessment by jointly considering precision and recall. Using this assessment framework, Logistic Regression shows the best overall performance among the four studied models. It achieves the best trade-off between capturing default cases and decreasing the false positive predictions among the four studied models. Therefore, Logistic Regression model is recommended as the decision support tools in loan default application to assist human judgment in banking decisions.
Keywords: Machine Learning, Bank Loan Default, Logistic Regression, Naive Bayes, Decision Tree, Neural Network
Introduction
As globalization deepens, the process of international economic integration places growing role on the banking sector in fostering cross-border economic and financial linkages. Within banks’ operational activities, lending and deposit represent the primary components from the capital sources and the total assets1. According to the Federal Reserve’s H.8 statistical release, total loans and leases in bank credit held by all U.S. commercial banks amounted to USD 13,245.4 billion in the week ending December 3, 20252. Compared with previous years, loan demand has exhibited a steady upward trend. In the current economic environment, commercial banks remain the dominant lenders in the financial system, and loan operations are still a principal approach of bank profit generation. The increase in loan defaults leads to higher risk for banks, and the effectiveness of risk control at the individual loan level will affect banks’ operational performance. Therefore, banks need to use effective screening methods for each loan to improve the accuracy of potential default prediction, and reduce loan default rates while simultaneously expand credit access to borrowers with a low likelihood of default.
To meet this demand, the objective of this paper is to conduct a machine learning study of loan default behavior using sample data. Multiple models, including logistic regression, naive bayes, decision tree, and neural network, are developed and evaluated to assess and compare their predictive accuracy in loan default prediction. Based on the results, this research is able to provide practical insights into how various machine learning models can be used as a decision support tools in loan default risk assessment and help loan officers better understand the tradeoff between capturing default cases and minimizing false positive predictions.
Literature Review
Over the past several decades, loan default prediction is an important topic that commercial banks have been focusing on for a long time. They have evolved their methods to assess such risk in response to the development of techniques availability. In the early stages, the loan default prediction primarily relied on bank officer’s subjective judgement based on experience3,4.
With the development of information technology in the 2000s, banks increasingly used statistical based models to predict borrowers’ probabilities of loan default in a more scientific manner5. In the past decade, with the rapid growth of machine-learning and artificial intelligence techniques, the advanced machine learning models have been widely used into credit risk modeling. Compared with traditional statistical methods, these approaches can detect complex nonlinear relationships as well as the interactions among multiple characteristics, thus improving predictive performance.
Malekipirbazari and Aksakalli proposed a classification method which is based on random forest in order to predict the borrower status. They conducted the study based on a data from social lending platform. The results show the proposed method is better than the FICO credit score when evaluating if a borrower is good or not6. Huang et al investigated the application of support vector machines (SVM) based models to credit scoring as an approach for default prediction in the credit card industry. Based on real world dataset, the research demonstrated that SVM-based models outperform traditional statistical methods, including decision tree, in terms of number of input features. The results provided early research evidence supporting the using of machine learning models in credit risk predictions7. Sahin et al addressed the increasing problem of credit card fraud, particularly in online or virtual transaction. The authors proposed a cost sensitive decision tree approach that minimize the misclassification cost during tree construction. Based on a real-world credit card dataset, the proposed model is compared with the traditional classification methods. The results shows that the cost-sensitive decision tree outperforms existing models in terms of conventional performance metrics, like the accuracy and true positive rate, as well as a new-defined evaluation metric. The findings suggest that the proposed decision tree models can substantially reduce financial losses in credit card fraud application cases8. While decision tree models and other models have each demonstrated distinct advantages in credit risk prediction, their individual limitations in terms of capturing complex nonlinear relationships have motivated the development of hybrid modeling approaches. By incorporating the information from decision trees to help to improve the performance of logistic regression, a hybrid approach called penalized logistic tree regression (PLTR) is proposed by Dumitrescu et al9. It is able to capture the non-linear effects that is in credit scoring data and preserve the intrinsic interpretability from the original logistic regression model. The results demonstrated that PLTR significantly outperforms traditional logistic regression and achieves comparable performance with random forests. Although hybrid models combining decision trees and logistic regression have shown the effectively balance interpretability and predictive performance, their capacity to model highly complex and high-dimensional nonlinear relationships remains limited. As the real-world data continue growing in volume and complexity, researchers have turned to artificial neural networks, which provides more flexibility through multilayer architectures. Therefore, neural network–based approaches have attracted researcher’s attention as a prominent direction. Using convolutional neural networks, Kvamme et al. investigated the mortgage default prediction based on a structured financial data. The results show that the AUC for the CNN increase with the size of training data, which suggest the larger data could achieve higher performance. The study also demonstrated that CNN based models outperform conventional machine learning approaches10.
Alongside these developments, recent studies have also examined a variety of machine learning models and their comparative performance in banking related tasks. Lai compared the performance of five different ML models, including XGBoost, AdaBoost, random forest, multi-layer perception and k nearest neighbors11. The study used ROC and AUC as evaluation metrics. The results show that the AdaBoost model can achieve a 100% accuracy during the loan default prediction, which is better than XGBoost, random forest, multilayer perceptron and k nearest neighbors. Maheswari and Narayana presented how data science is impacting the banking sector12. Three machine learning models are used in the study of loan defaulter predictions. They are logistic regression, KNN and random forest. The study concludes logistic regression outperform the KNN and random forest. Wahab et al evaluated the efficacy of decision tree, Adaboost and ANN in order to predict the credit card default13. The standard evaluation metrics were used to evaluate all models. The results indicates that the decision tree and Adaboost have the highest accuracy of 82% in the default prediction, while the accuracy from ANN is 78%. It should be noted that the accuracy values of 82% were achieved in both validation dataset and testing dataset. Appiahene performed a comparative study of machine learning models, including Decision Tree, Random Forest, and Neural Networks, with R codes14. The objective of the study is to evaluate the bank efficiency on 444 Ghanaian bank branches. The efficiency rating from Decision Making Units were compared with model results. According to the prediction results from three models, Decision Tree provided the best accuracy of 100% in predicting the 134 holdout samples. Random Forest models provided an accuracy of 98.5% followed by neural network of 86.6%. Bhattad et al. investigated loan approval prediction using three classification models: Logistic Regression, Decision Tree, and Random Forest15. The results indicates that the Random Forest model provided the highest accuracy (80.2%), outperforming both the Decision Tree(77%) and Logistic Regression(78.91%) models.
Motivated by the various modeling efforts adopted in the existing literature, this study investigates bank loan default prediction using four representative machine learning approaches: Logistic Regression, Decision Tree, Neural Network, and Naive Bayes. Logistic Regression is included as a widely accepted baseline model in financial studies. Decision Tree is selected as a representative rule-based model to capture the nonlinear relationships. Neural Network model is incorporated due to its ability to model complex and nonlinear interactions among features. In addition, Naive Bayes is introduced as a probabilistic classifier that has received limited attention in existing loan default research. While machine learning methods such as Random Forest and SVM have been widely adopted in prior loan default research and often demonstrate good performance, they are not the primary focus of this study. The objective of this research is to examine a set of representative modeling framework under a unified evaluation approach. Models such as RF and SVM usually involve higher complexity and reduced interpretability, which could limit the direct use in routine loan assessment. Therefore, they are discussed as a research background but are excluded from the comparison in order to maintain a clear and focused research scope.
Methods
Dataset
The dataset we used was taken from Kaggle16. It is a publicly available and anonymized benchmark dataset commonly used for research purposes. Therefore, the reported results should be interpreted as methodological insights rather than institution-specific performance benchmarks. The dataset includes 255,347 data samples. For each sample, it displays the features in either numerical or text form as described below:
- LoanID: a unique ID for each loan sample
- Age: the age of borrower
- Income: the annual income of the borrower
- LoanAmount: the amount of loan
- CreditScore: the borrower’s credit score which is generated by a third party
- MonthsEmployed: the number of months that borrower has been employed
- NumCreditLines: the number of credit lines associated with the borrower
- InterestRate: the interest rate
- LoanTerm: the term length of the loan
- DTIRatio: the debt to income ratio
- Education: the borrower’s degree(high school, bachelor, master, PhD)
- EmploymentType: the type of employment (full time, part time, self employed, unemployed)
- MaritalStatus: the marital status (single, married, divorced)
- HasMortgage: whether or not the borrower has a mortgage
- HasDependents: whether or not the borrower has dependents
- LoanPurpose: the purpose of loan (home, auto, business, education, other)
- HasCoSigner: whether or not the borrower has a co-signer
- Default: whether the loan defaulted (yes = 1, no = 0)
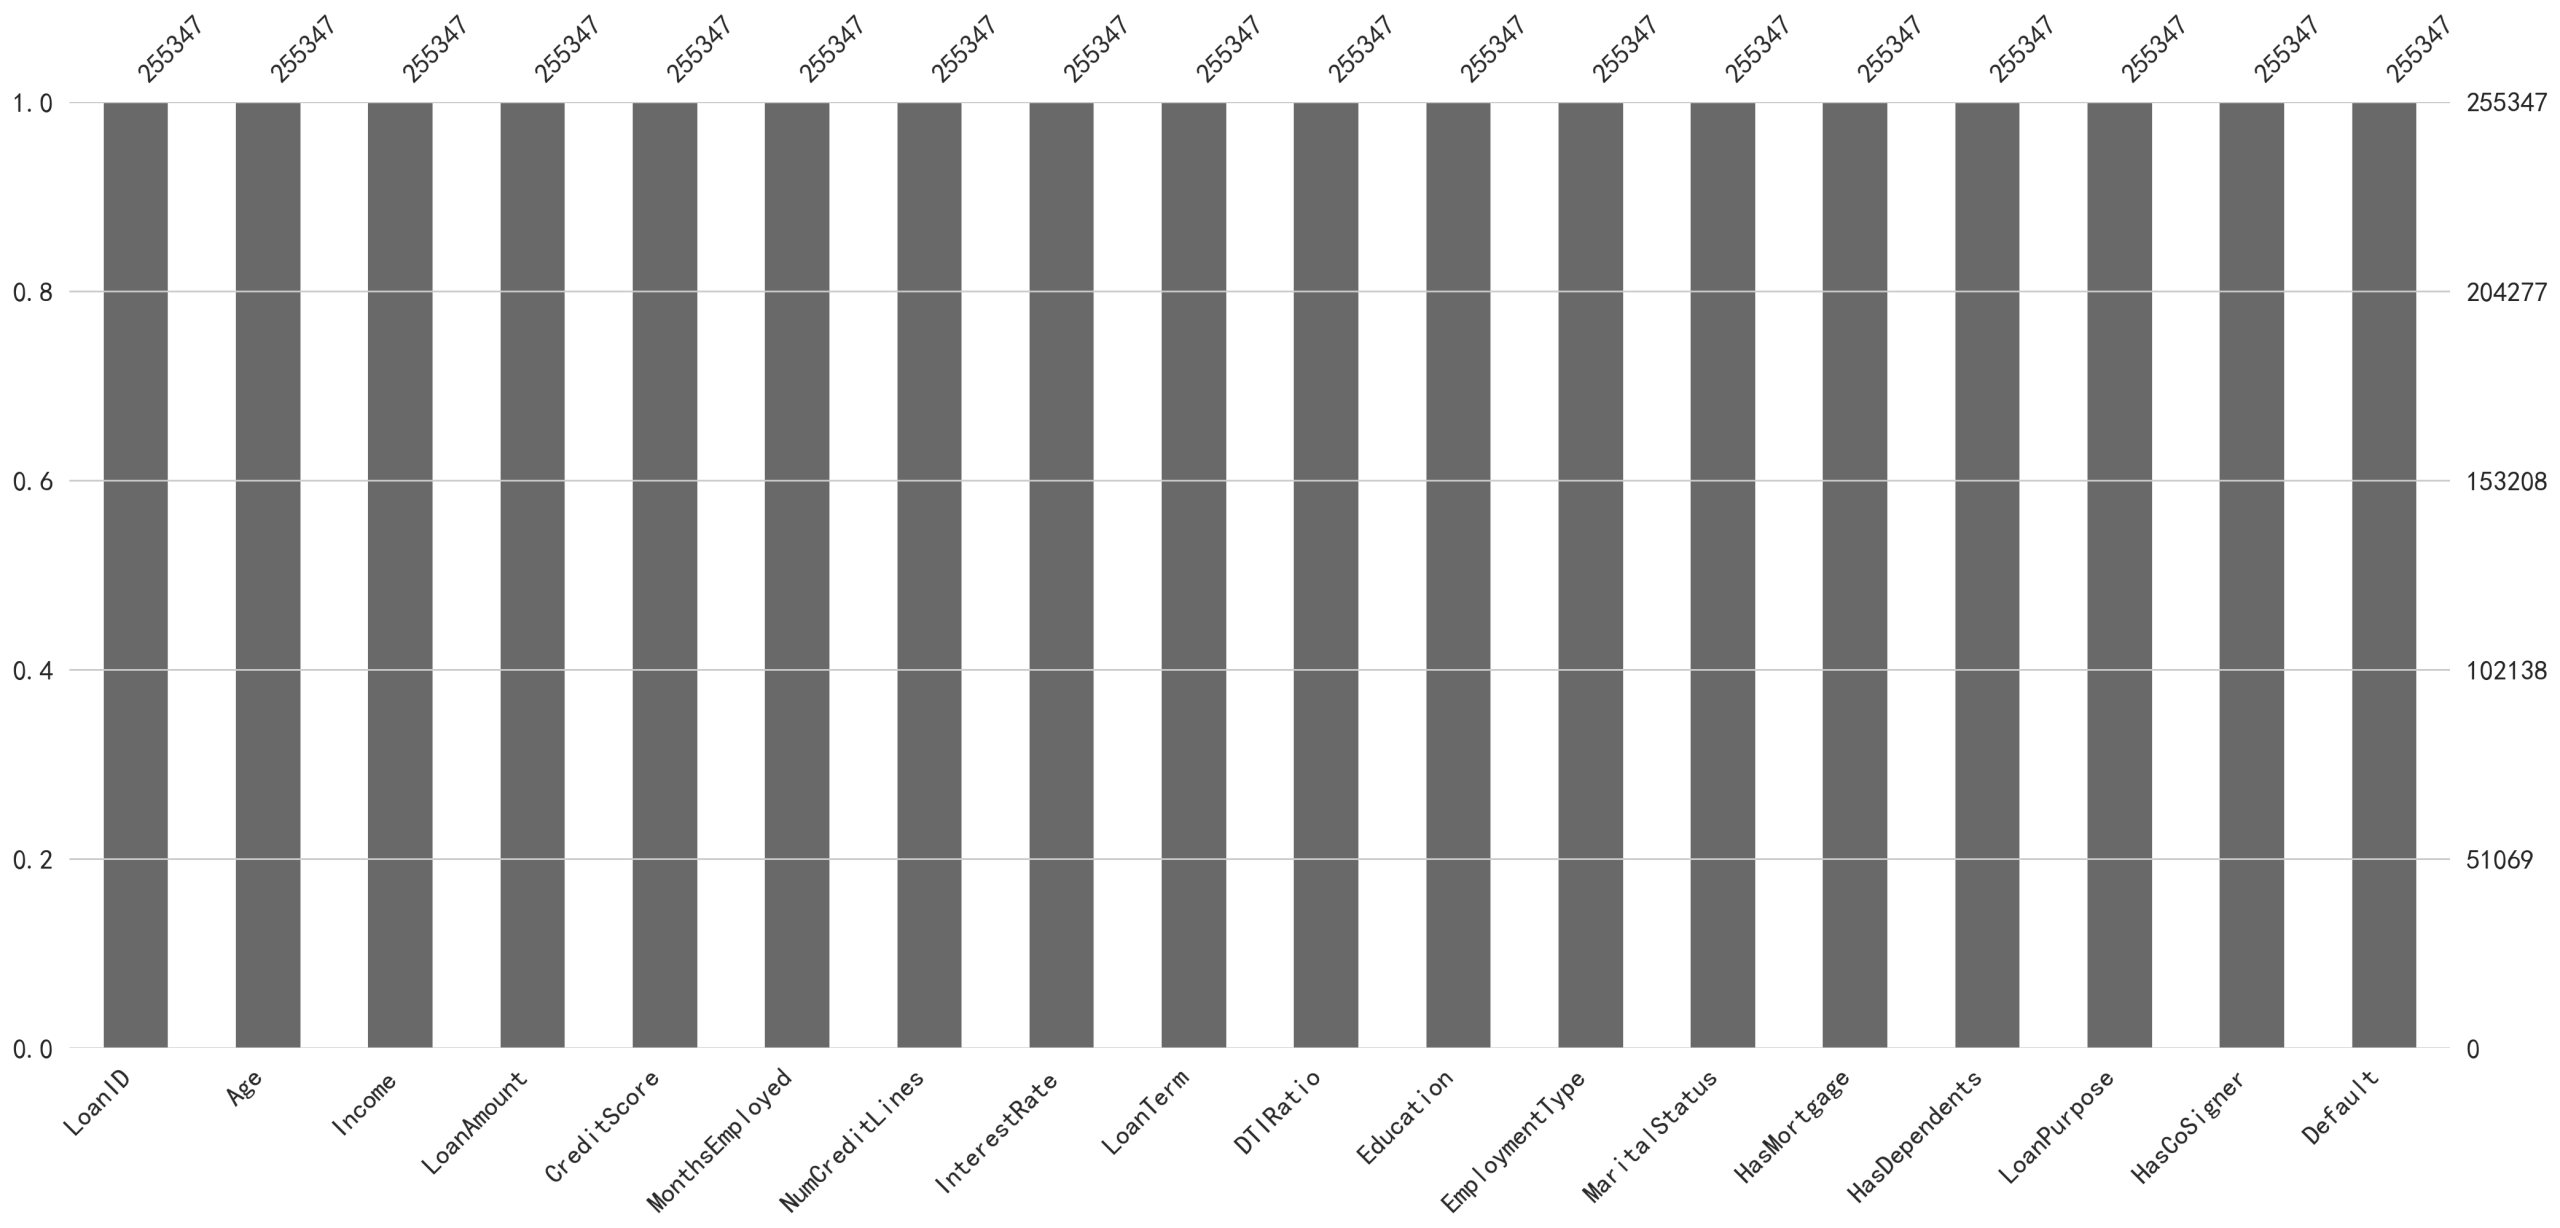
After importing the dataset using the python pandas library, the initial step involves checking the presence of missing values. In cases where missing data exist, different imputation strategies, such as mean, median, or mode substitution, are available to be employed. Given that the dataset used in this study comprises over 200,000 observations, a visualization-based approach is utilized to assess missing values. Figure 1 illustrates the missing value distribution in the dataset. The results indicate that no missing values are present across all features; therefore, data imputation is not necessary.
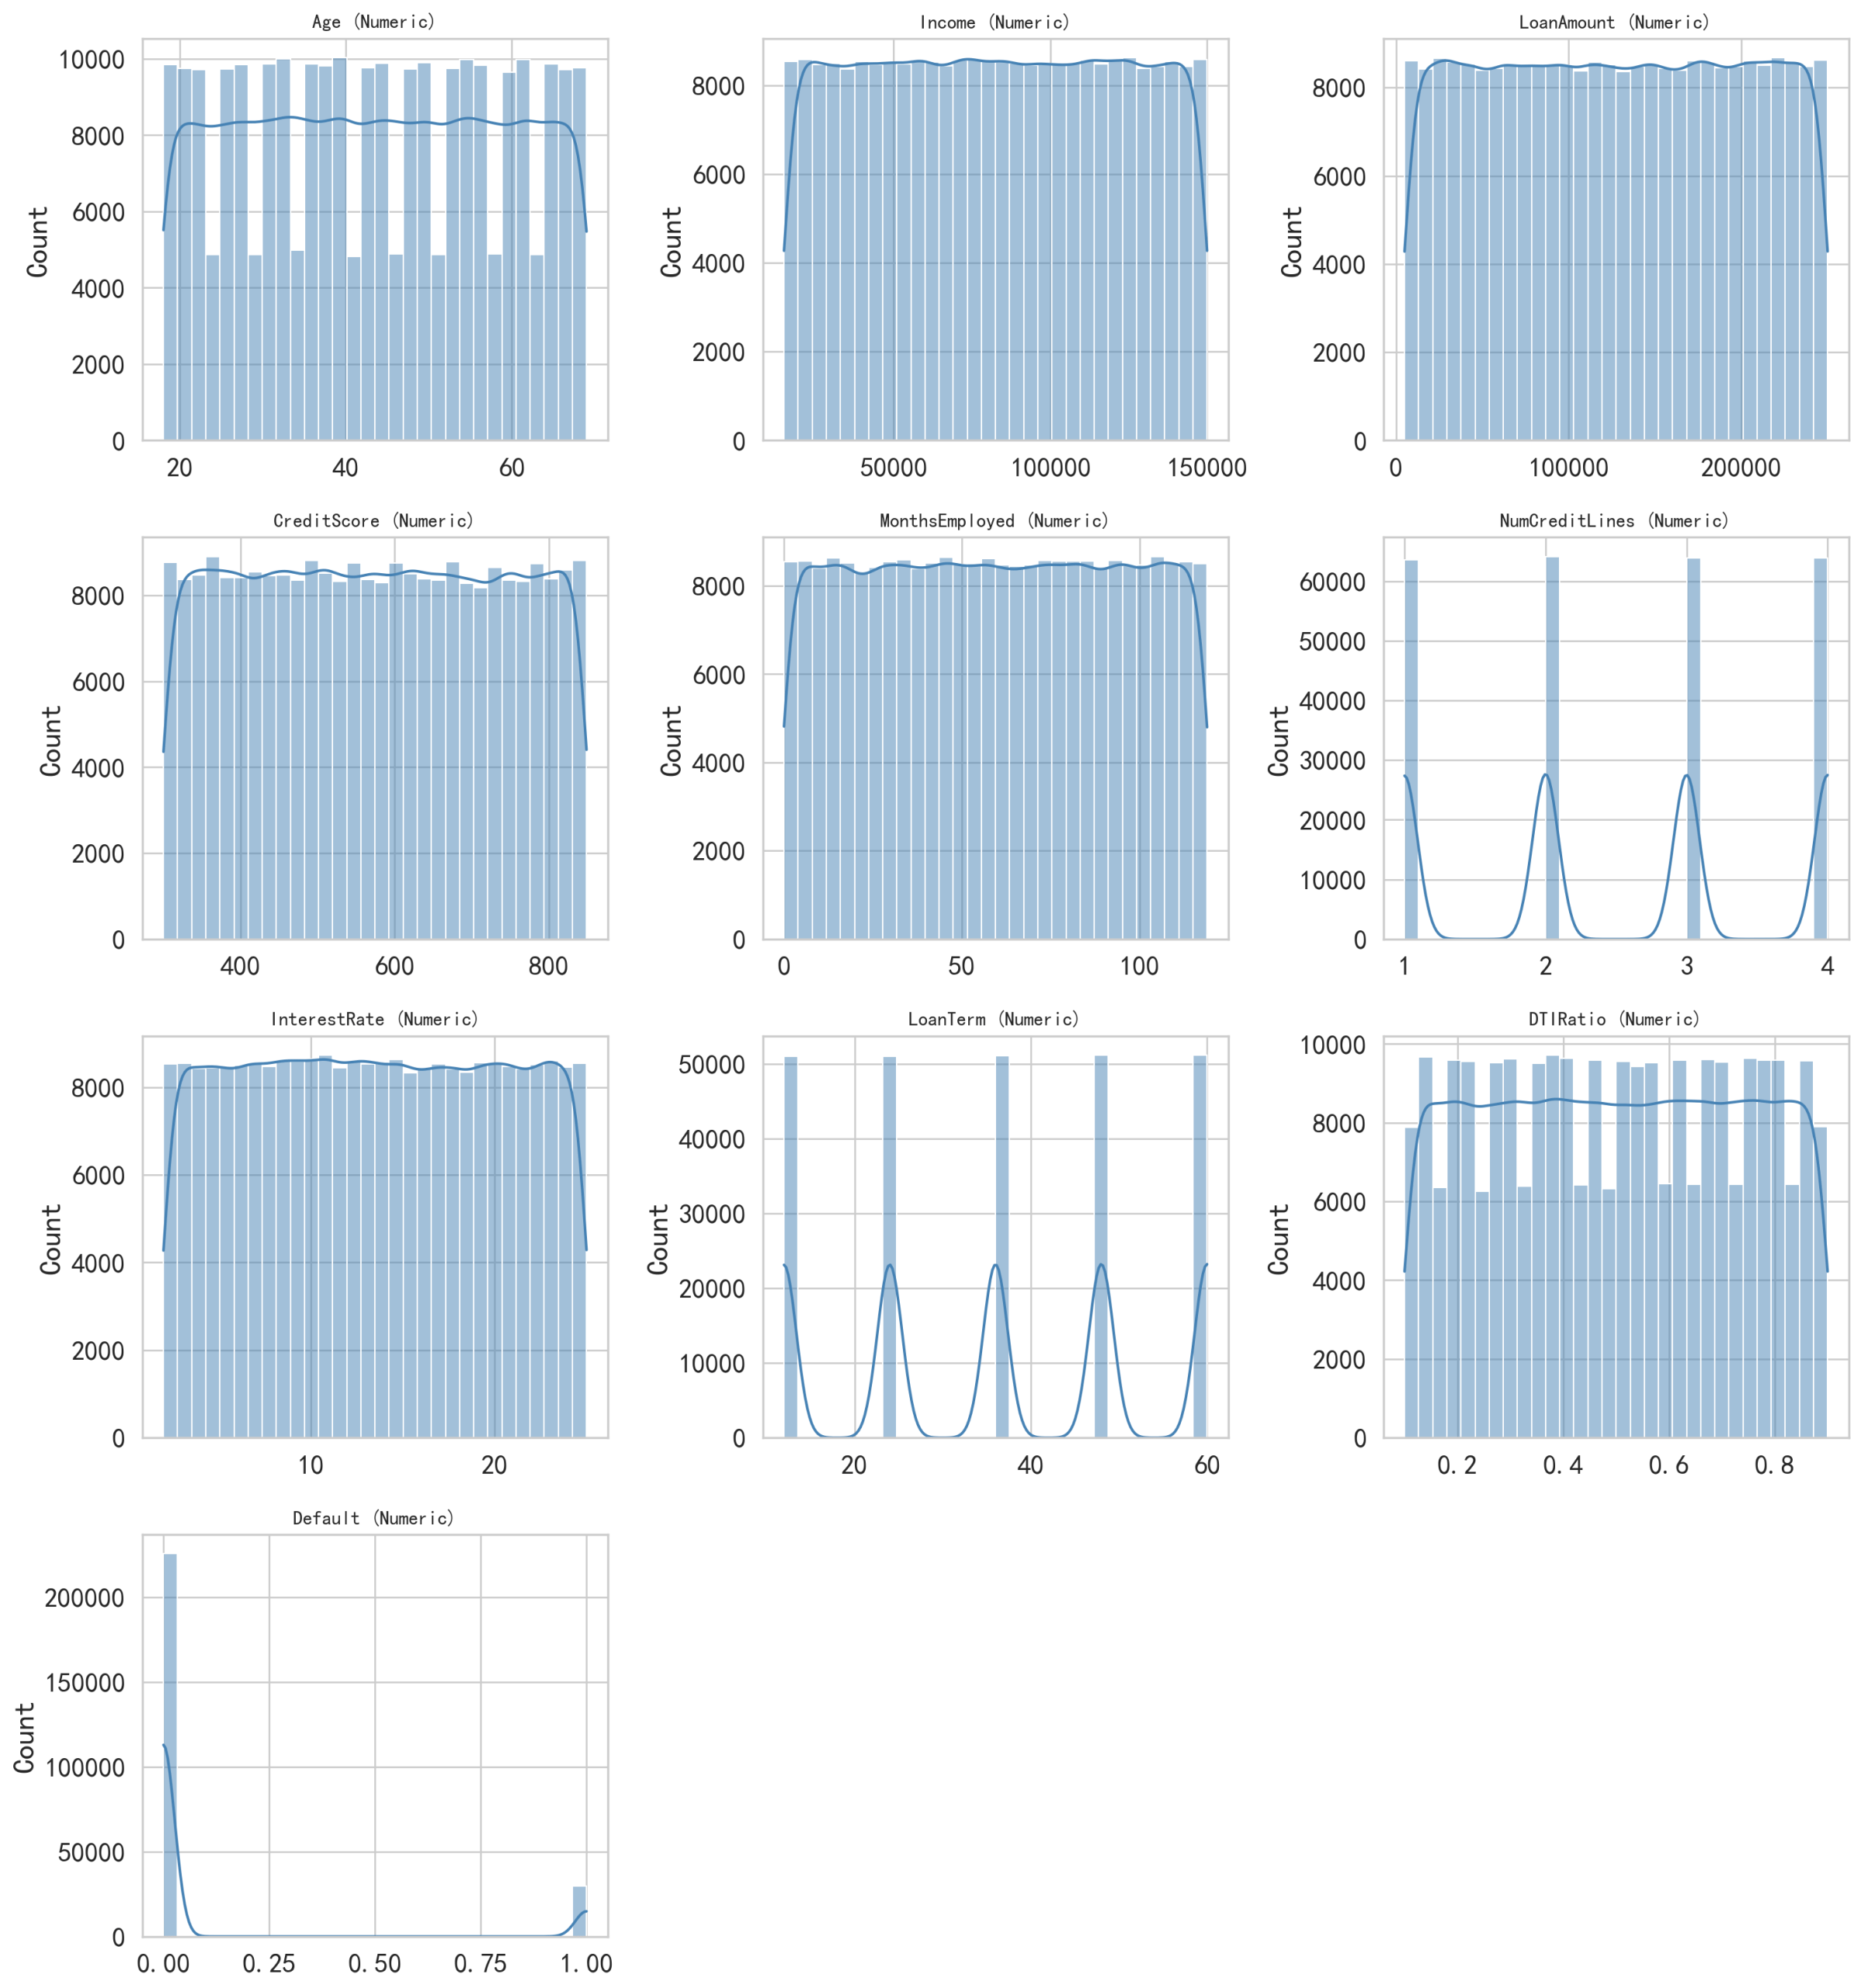
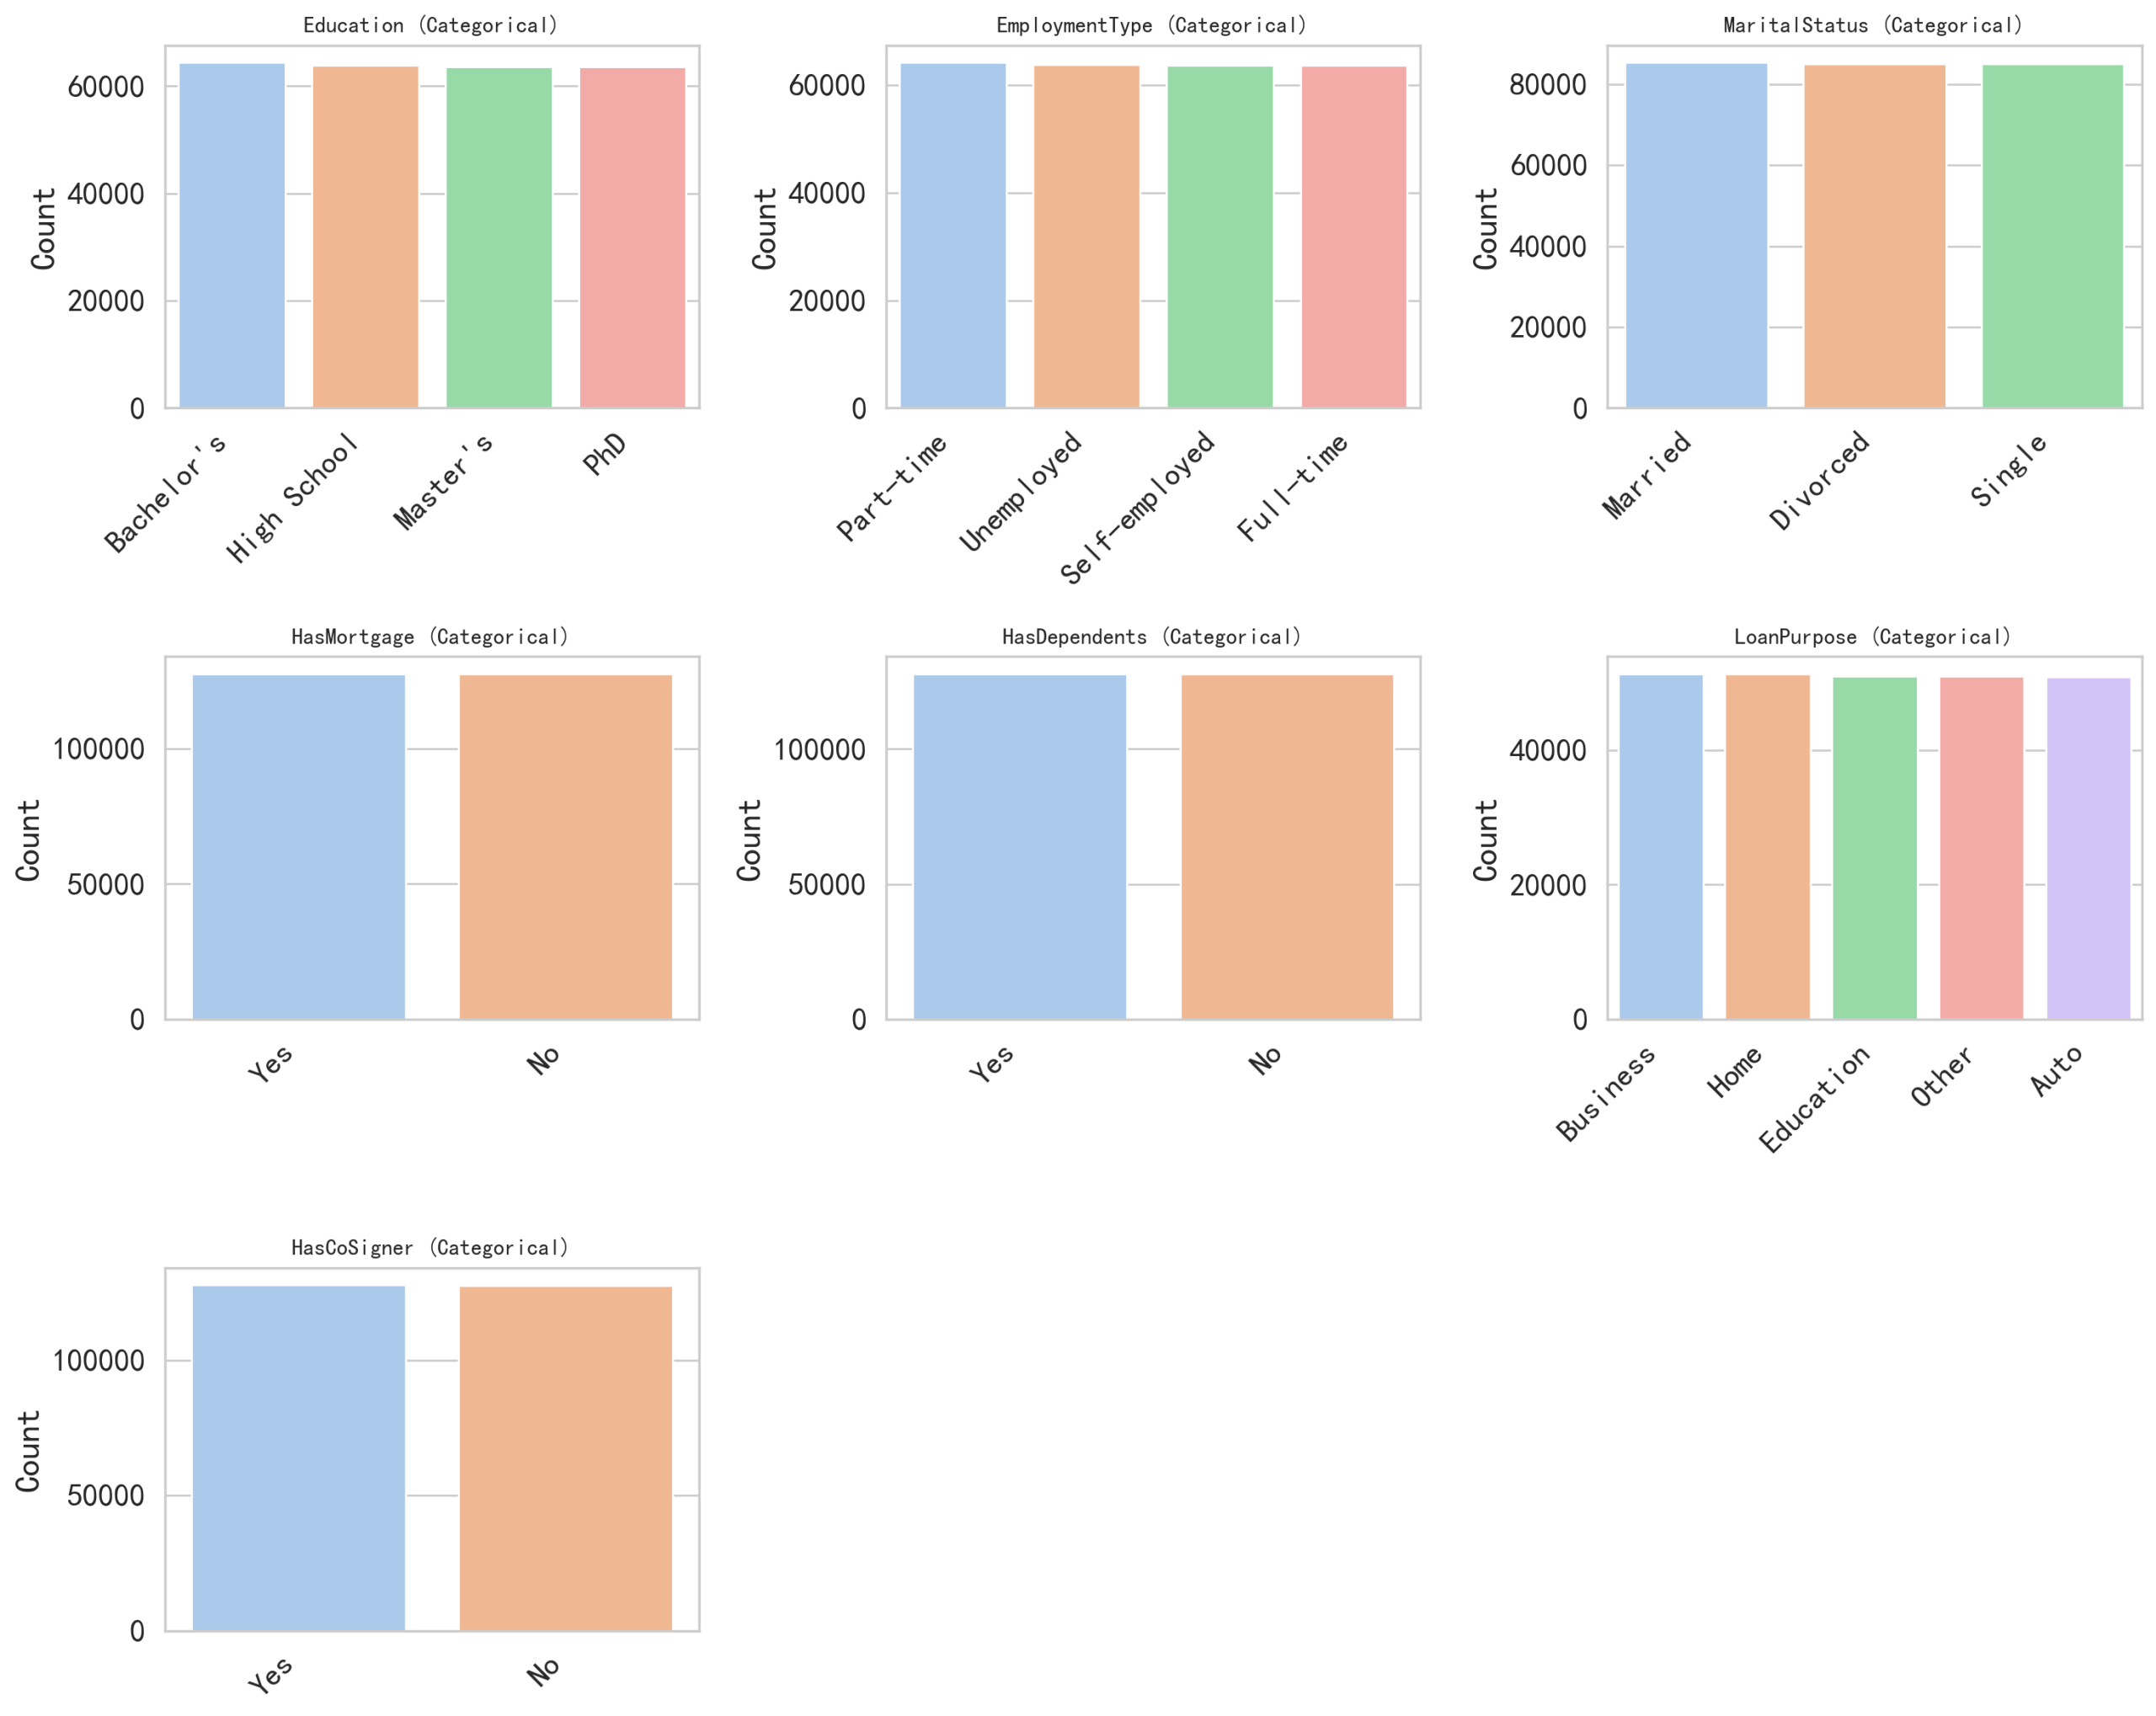
For the imported dataset, visual inspection alone is generally not sufficient to adequately analyze the data characteristics. Therefore, visualization techniques are used to provide a more intuitive examination of the distribution of each feature. Since the features consist of both numerical and categorical variables, they are presented in two separate figures. Figure 2 illustrates the distribution of numerical features, while Figure 3 presents the distribution of categorical features. As shown in these two figures, most features exhibit approximately uniform distributions. Notably, the target variable, default, demonstrates an imbalanced distribution.
Feature engineering plays an important role in improving machine learning performance by incorporating domain knowledge into the dataset. Not solely rely on raw features, well-designed features could better capture the underlying financial characteristics of borrowers. In this study, several feature engineering strategies are used to establish more informative and interpretable variables. First, a feature named EmploymentAgeRatio is introduced, defined as the ratio of MonthsEmployed to the Age. This variable represents the relative length of an individual’s employment history with respect to their age, providing a normalized measure of borrower’s credit. Compared to using employment length alone, this ratio accounts for differences in borrowers’ career progression, thereby offering a more meaningful feature. Second, a feature named TotalDebtRatio is constructed by adding the DTIRatio with the ratio of loan amount to the income (LoanAmount / Income). This feature combines both existing debt and the current loan relative to income, enabling a more comprehensive assessment of a borrower’s financial status. From a financial risk perspective, employment stability and debt burden relative to income are widely recognized as key determinants of borrowers’ payment ability. The EmploymentAgeRatio reflects relative employment stability by normalizing employment duration with respect to their age. Similarly, the TotalDebtRatio is designed to capture short term payment pressure and longer term debt pressure. These engineered features are not intended to introduce novel financial features, but to enhance risk interpretability by aligning model inputs with commonly used concepts in financial risk assessment. Finally, the original variable MonthsEmployed is removed from the dataset after the above feature proposals. This step is taken to avoid redundancy and potential multicollinearity with the proposed EmploymentAgeRatio. We calculated multicollinearity using variance inflation factors (VIF), which showed substantial collinearity between MonthsEmployed (VIF = 5.40) and EmploymentAgeRatio (VIF = 7.34). Based on this assessment, MonthsEmployed was removed while retaining the ratio feature to reduce redundancy and improve model stability. We also conducted an ablation analysis using logistic regression. Results showed that removing MonthsEmployed led to nearly identical predictive performance, confirming that the approach in this paper does not degrade model effectiveness. To further confirm the contribution of the engineered features, an ablation study was also conducted using logistic regression. The results show that including EmploymentAgeRatio and TotalDebtRatio result in a consistent improvement in overall performance, with higher ROC-AUC, F1-score, accuracy, and precision, while maintaining a similar recall level.
Modeling Approaches
The modeling work in this study was primarily conducted in Python using the scikit-learn library. The data samples were randomly divided: 80% for training and 20% for testing and maintained the same default percentage in both training and testing subsets. The default category in our dataset exhibits a class imbalance, with default cases being substantially less than the non-default cases. To address this issue, we applied stratified sampling when splitting the data into training part and testing part to preserve consistent class proportions. During model training section, we incorporated the class weighting strategies in applicable models, assigning higher weights factor to the minority (default cases in current paper) class so that misclassification of default cases results in a greater penalty in the loss function. Compared to over-sampling or under-sampling techniques, this approach preserves the original data distribution while avoiding to introduce additional noise.
Logistic Regression
Logistic regression models the probability of default by learning a linear relationship between borrower characteristics and the binary outcome17. It is a simple model which can be used to predict whether an event will happen or not. In current study, the model is able to predict whether a borrower will default. It assigns weights to various features, like the age, income, credit score etc, and combine them to generate a probability. When this probability exceeds the threshold then the output will be default. It should be noted that the logistic regression only captures linear relationship between features. For some complex interactions, its performance may degrade to a certain extent. In the model, the preprocessed features were fitted using scikit-learn’s LogisticRegression with the SAGA solver, which supports L1, L2, and elasticnet options. To address class imbalance, balanced class weights were applied. Key hyperparameters were selected from randomized search with stratified 3-fold cross-validation on the training set, using Average Precision as the scoring objective. The inverse regularization strength (C value), the penalty type (L1/L2/elasticnet), and the elasticnet ratio parameter were tuned within predefined ranges. The best-performing configuration from cross-validation was reused on the full training set and then evaluated on the test set, where the performance metrics were reported.
Naive Bayes
The Naive Bayes classifier is a probabilistic classification method which is based on Bayes’ theorem18. An important assumption of this model is that the input features are conditionally independent given the class label. Despite of this assumption, Naive Bayes has demonstrated competitive performance in various machine learning tasks and is efficient for large-scale datasets. According to Bayes’ theorem,
(1) 
Where the P(X|Y) is the probability of event X given Y, P(Y|X) is the likelihood, P(X) is the prior probability, and P(Y) is the marginal likelihood.
Decision Tree
Decision trees operate by recursively asking yes/no questions about features based on a sequence of decision rules19. Based on a hierarchical splitting approach, the decision tree is able to capture the nonlinear relationships and complex interactions among various borrower characteristics without requiring certain assumptions. Each leaf node represents a predicted class label based on the training samples. Similarly, to address class imbalance, balanced class weights were used. Model complexity was controlled through several hyperparameters, including the maximum tree depth, the minimum number of samples required to split a node and the minimum number of samples at a node. These hyperparameters were selected based on randomized search with stratified 3-fold cross-validation on the training set, using Average Precision as the scoring objective. The best-performing configuration from cross-validation was reused on the full training set and then evaluated on the test set.
Neural Network
Neural Network is a very useful model that can learn the data patterns by passing data through multiple layer of neurons20. In this study, a multilayer perceptron (MLP) neural network is used as a nonlinear classification model to predict loan default. The MLP consists of an input layer, a hidden layer, and an output layer. The input layer receives the various features, including as received numerical variables and preprocessed categorical variables. The hidden layer contains 32 neurons and uses the ReLU activation function, enabling the MLP to capture the nonlinear and complex relationships between borrower characteristics and default status. The output layer consists of a single neuron to predict probability of the loan default. This compact architecture was chosen to balance the model capacity and computational efficiency, and to reduce the risk of overfitting. Rather than tuning the network width, we fixed the hidden-layer size of 32 and focused on optimizing key hyperparameters, including the L2 regularization strength and the initial learning rate. These hyperparameters were selected based on randomized search with stratified 3-fold cross-validation on the training set, using Average Precision as the optimization objective. Training was performed using the Adam optimizer with early stopping based on a validation split, ensuring stable convergence. The best-performing configuration from cross-validation was reused on the full training set and then evaluated on the test set.
Performance Metrics
The precision, Recall, F1-Score, and Accuracy are four performance indicators used to assess the classification. Before introducing the performance metrics, the following notation is used: TP represents True Positives, TN represents True Negatives, FP represents False Positives, and FN represents False Negatives. The indicators are defined by Equation (2) to (5)
(2) 
(3) 
(4) 
(5) 
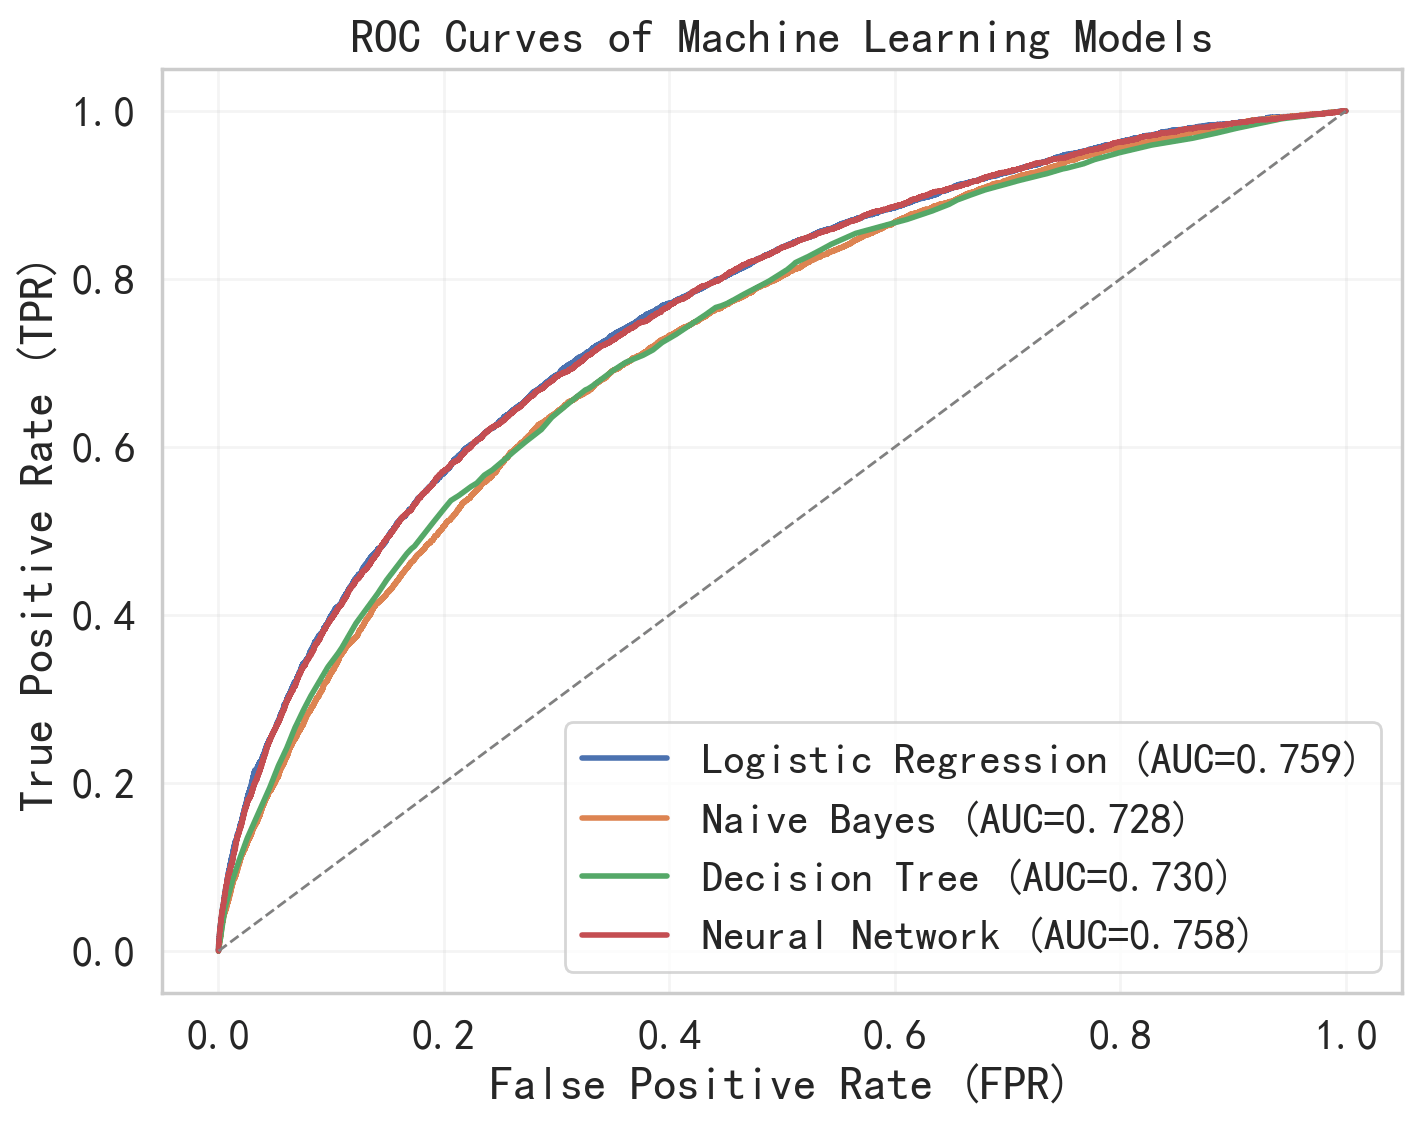
In addition, the area under the receiver operating characteristic curve (ROC-AUC) is used as a key metric for model comparison. The curve shows the trade-off between the TPR and the FPR across all thresholds21. The x-axis represents the FPR, while the y-axis represents the TPR. The ROC curve captures the overall behavior of a model rather than under a single point. Therefore the ROC-AUC is a threshold-independent parameter which is suitable for comparing different models performance. Accuracy is also reported for comparison purposes and the conclusions are primarily based on F1 score and ROC-AUC due to the imbalanced nature of the dataset.
Results
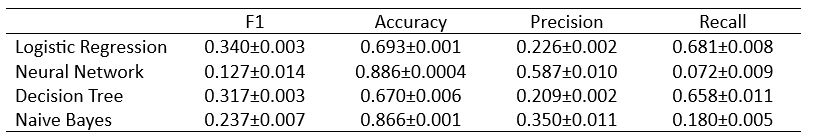
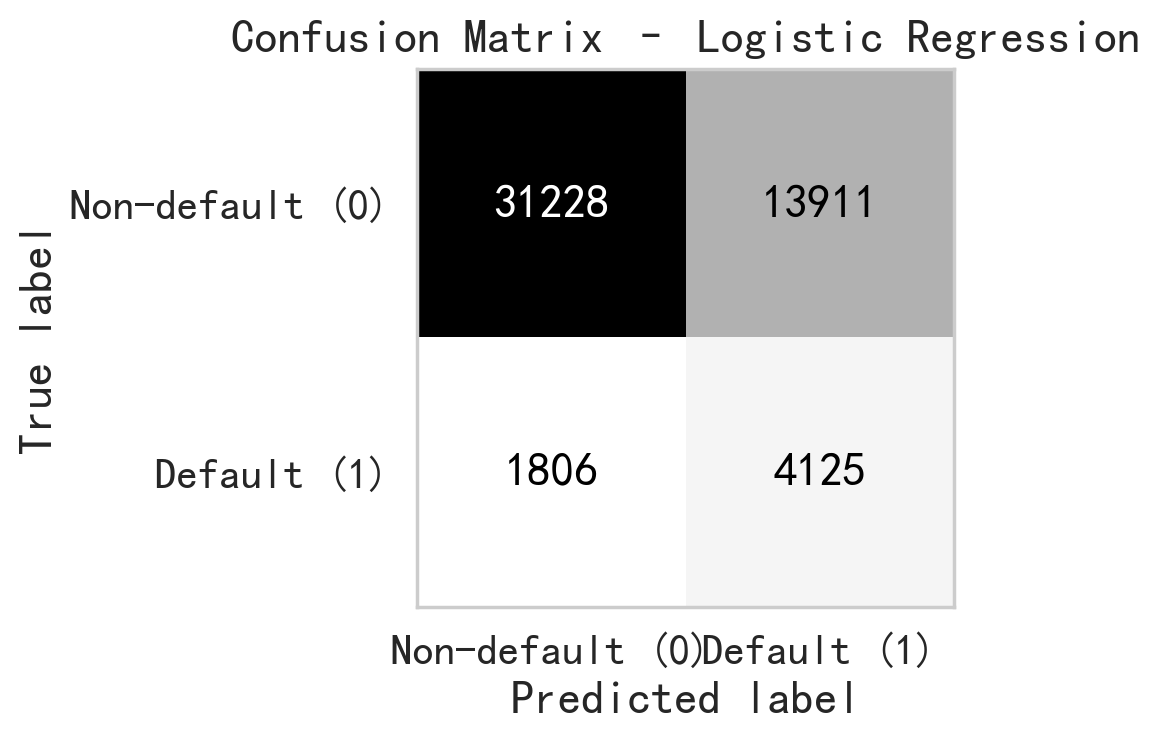
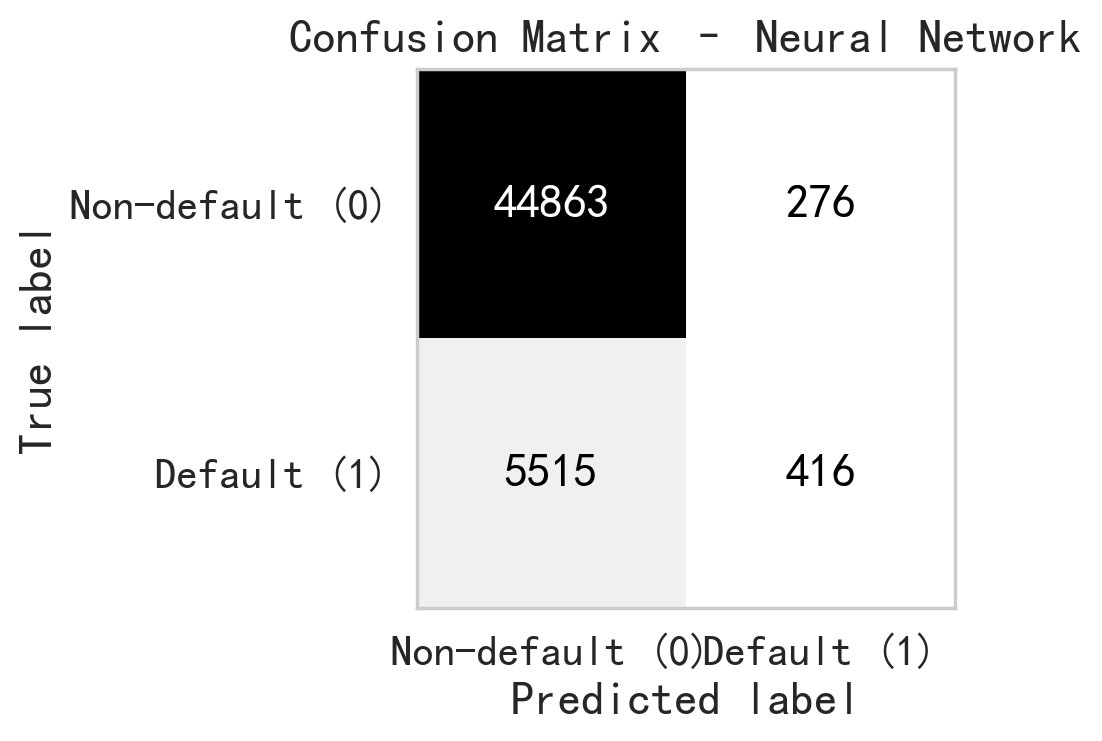
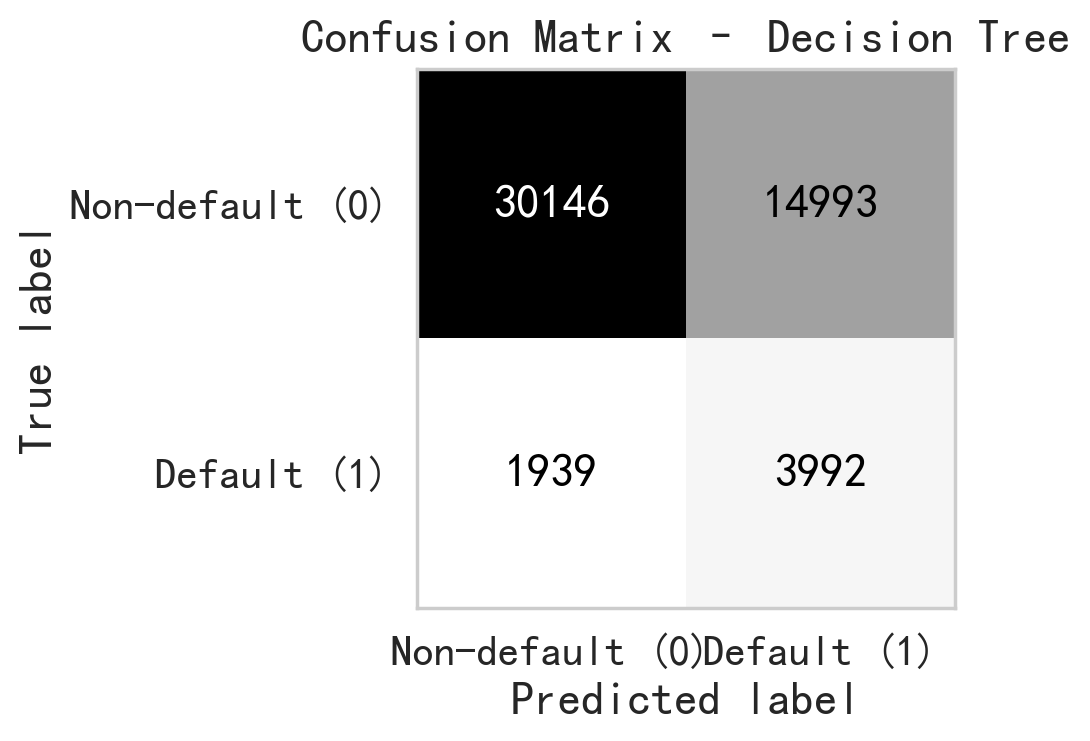
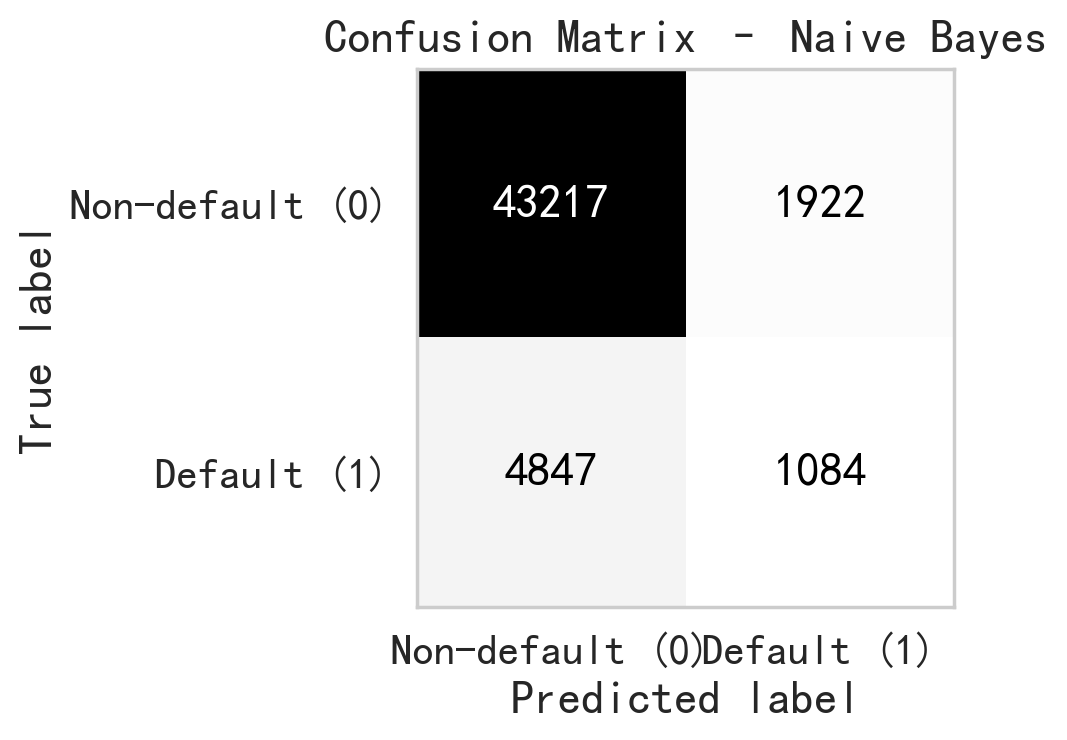
To evaluate the robustness of the proposed models with respect to various random seeds, all models were trained and tested five times using different random seeds (2, 33, 51, 82, and 99). For each model, we reported the mean and standard deviation of the evaluation metrics across these runs, as shown in Table.1. The results show that the performance metrics are consistent across different random seeds, as evidenced by the small standard deviations compared to their corresponding average values. In particular, accuracy and F1 score exhibit minimal variation, indicating that the models’ predictive behavior is stable and not driven by a specific random seeds. Overall, these results suggest that the reported performance is robust to random seed selection and not sensitive to a particular random configuration. Table. 1 shows the mean and standard deviation of the performance metrics across five independent runs with different random seeds. It provides a comprehensive summary of the scoring metrics for the four machine learning models, including accuracy, precision, recall, and F1-score, providing an overall comparison of their classification performance. Since the performance metrics show minimal sensitivity to the choice of random seed, we report the results corresponding to random seed 51 in the remaining figures for simplicity. Fig. 4 shows the Receiver Operating Characteristic (ROC) curves, which illustrates the trade-off between the true positive rate and false positive rate across various thresholds. Fig. 5 through fig. 8 present the confusion matrices for each model, respectively, displaying the distribution of true positives, true negatives, false positives, and false negatives, and therefore offering further insight into the classification performance of each machine learning model.
Discussions
During calculating the metrics of accuracy, precision, recall, and F1-score, all models use a fixed probability threshold of 0.5, which is a conventional cutoff threshold in binary classification study. This approach provides an accepted baseline, enabling fair comparison across four different machine learning models. Our study also conducted a ROC analysis, with ROC–AUC curves evaluating model performance under various thresholds.
The Logistic Regression model demonstrates a characteristic performance profile in current study. The reported ROC-AUC value of 0.759 suggests that the Logistic Regression model provides an acceptable level of discriminatory power to differentiate defaulting from non-defaulting borrowers, which is independent of a specific threshold value. With the threshold of 0.5, the model exhibits a tendency toward high recall with an expense of precision. As shown in the confusion matrix, it correctly predicts 4,125 default cases while mislabeling 1,806 default cases as the non-default. It result in a Recall of 0.695. In another words, the Logistic Regression model successfully captures a majority of actual defaulters. This is desirable for bank business since the actual default can lead to financial loss to bank. The model’s Precision of 0.229 shows a high level of false positive predictions. It reveals that among all default cases predicted, 13,911 cases are actual non-default borrowers. It demonstrates that the Logistic Regression model, with the chosen threshold, is tending to overestimate the default risk. Such conservative prediction behavior may reduce the risks associated with defaults, it may also lead to rejection of creditworthy loan applicants. The Accuracy of 0.692 suggests that the model is able to differentiate substantial cases of the dataset. However, the accuracy alone is insufficient to characterize model performance given the imbalanced nature of current dataset. In this context, the F1-score of 0.344 provides a more informative summary by capturing the trade-off between recall and precision, highlighting the model’s balanced performance under a risk oriented framework and making it suitable for practical deployment as a decision support tool.
Neural network is a higher-capacity nonlinear model and we use it in current study to examine whether a complex nonlinear model could provide additional performance gains compared to linear approaches. Based on the study results, the Neural Network exhibits an asymmetric classification behavior in the current prediction task. The ROC-AUC value of 0.758 suggests that the Neural Network is able to distinguish between defaulting and non-defaulting cases, which indicates that the model successfully captures the complex and nonlinear relationships from the input features. However, the model’s prediction shows skewed toward the non-default borrowers according to the rest of metrics. As shown in the confusion matrix, 44,863 non-default cases are correctly identified, and only 276 non-default cases incorrectly labeled as default. This results in a high accuracy of 0.887, indicating the model’s strong capability in classifying the non-default borrowers. However, it shows very limited effectiveness in capturing the actual default cases. Among all true default cases, only 416 cases are correctly predicted, while 5,515 default cases are mislabeled as non-default, resulting in a Recall of only 0.070. This could be problematic for banks since the undetected default cases could lead to financial losses. In contrast, the model achieves a Precision of 0.601, implying that when the Neural Network model predicts a borrower as default, it is the case under more than 60% of the time. This suggests that the Neural Network uses a conservative strategy for distinguishing the default and non-default cases. The model will label the case as default only it is very confident. Therefore quite amount of default cases are missed. The F1-score of 0.126 indicates poor balance between precision and recall.
In this study, Decision Tree model is used due to its strong interpretability. Based on the model results from Decision Tree, the ROC-AUC value of 0.730 suggests that the Decision Tree model possess a moderate ability to distinguish between default and non-default cases. The confusion matrix shows that the Decision Tree model is relatively effective in capturing the default cases. Among all default cases, 3,992 cases are classified as default, while 1,939 default cases are mislabeled, resulting in a Recall of 0.673. This shows the model is able to identify a substantial portion of the default cases. However, the model’s Precision of 0.210 indicates that only small portion of predicted default cases are real default case. It implys that the Decision Tree model tends to overestimate default risk. An accuracy of 0.668 reflects a moderate level of correct classification among the entire cases. However, the data imbalance of current study suggests the accuracy alone provides limited insight in the model’s performance. The F1-score, which balances precision and recall, achieves 0.320, suggests that the Decision Tree model offers a moderate trade-off between capturing default cases and minimizing the false default cases.
Due to the computational efficiency from Naive Bayes, it is employed in current study, therefore enabling rapid model training and prediction. The results the Naive Bayes model exhibits a conservative classification behavior in loan default evaluation. First of all, the Accuracy of 0.867 suggests that the model is able to correctly predicts the majority of studied cases. The confusion matrix reveals that such high accuracy is mainly due to the effective differentiate of non-default cases. For example, 43,217 non-default cases are correctly identified, but only 1,922 non-default cases are predicted as default case. The model’s recall is only 0.183. Among all true default cases, only 1,084 cases are identified as default, whereas 4,847 default cases are mislabeled. It suggests that the model fails to detect a large portion of default cases, which means a significant default risk to the banks. In terms of predictive precision, the Naive Bayes model achieves a Precision of 0.361. This suggests that the loan default classification are predicted by meaningful probabilistic behavior rather than random guessing. Although with such moderate precision, the low recall results in a F1-score of 0.243. This outcome is corresponding to the independence assumption behind the Naive Bayes model. In real world, the features are often correlated each other, like the higher income probably will have good credit history, therefore the assumption could limit model’s ability to capture complex patterns.
In this paper, a default probability threshold of 0.5 is used for reporting performance metrics in order to ensure a consistent comparison across four models. However, it should be noted that the threshold value is not a model property, but rather a parameter of the risk preference. To provide a threshold independent evaluation, ROC curves and the corresponding AUC values are reported. In real financial practice, banks may select different operating points along the ROC curve depending on their objectives. For example, a lower threshold may be selected to increase the TP rate and capture more default cases with the cost of higher FP, while a higher threshold may be adopted when reducing unnecessary loan decline is a priority. Therefore, the ROC analysis provides a flexible framework to align model outputs with bank’s specific risk control strategy.
Conclusions
Based on the discussion in results section, machine learning model evaluation is strongly influenced by data class imbalance and the asymmetric misclassification costs. It will be misleading if researcher only rely on single parameter, like the accuracy, as the evaluation metrics. This study uses the F1-score and ROC-AUC as the primary evaluation metric because they provide a balanced assessment by jointly considering precision and recall. It is suitable for the loan default prediction. Using this assessment framework, logistic regression model demonstrated a more balanced performance in identifying default cases and limiting false positive predictions, making it suitable for routine loan screening and risk evaluating tasks. In practice, such models are best used as decision support tools which provide quantified risk scores to assist, rather than replace, human judgment in banking decisions.
References
- M.Choudhry, S.Blaafalk, An Introduction to Banking: Principles, Strategy and Risk Management.2nd Edition., Wiley, 2018 [↩]
- Assets and Liabilities of Commercial Banks in the United States – H.8. https://www.federalreserve.gov/releases/h8/current/default.htm(2025). [↩]
- A.Saunders, M.Cornett, Financial Institutions Management: A Risk Management Approach.9th Edition., McGraw Hill, 2017 [↩]
- J.Sinkey. Commercial Bank Financial Management in the Financial Services Industry. 4th edition., Macmillan, 1991 [↩]
- L.C.Thomas, A survey of credit and behavioural scoring: forecasting financial risk of lending to consumers, International Journal of Forecasting, 16, 149-172 (2000). [↩]
- M.Malekipirbazari,and V. Aksakalli. Risk assessment in social lending via random forests, Expert Systems with Applications, 42, 4621-4631 (2015). [↩]
- C.Huang, M.Chen, C.Wang. Credit scoring with a data mining approach based on support vector machines, Expert Systems with Applications, 33, 847-856 (2007). [↩]
- Y.Sahin,S.Bulkan,E.Duman. A cost-sensitive decision tree approach for fraud detection, Expert Systems with Applications, 40, 5916-5923 (2013). [↩]
- E.Dumitrescu, S.Hue, C.Hurlin, S.Tokpavi. Machine learning for credit scoring: Improving logistic regression with non-linear decision-tree effects, European Journal of Operational Research, 297, 1178-1192 (2022). [↩]
- H.Kvamme, N.Sellereite, K.Aas,S.Sjursen. Predicting mortgage default using convolutional neural networks, Expert Systems with Applications, 102, 207-217 (2018). [↩]
- L.Lai. Loan Default Prediction with Machine Learning Techniques, International Conference on Computer Communication and Network Security (CCNS), 5-9 (2020). [↩]
- P.Maheswari, C.Narayana, Predictions of Loan Defaulter – A Data Science Perspective, 5th International Conference on Computing, Communication and Security (ICCCS), (2020). [↩]
- F.Wahab, I.Khan, S. Sabada, Credit card default prediction using ML and DL techniques, Internet of Things and Cyber-Physical Systems, 4, 293-306 (2024). [↩]
- P.Appiahene, Y.Missah, U.Najim, Predicting Bank Operational Efficiency Using Machine Learning Algorithm: Comparative Study of Decision Tree, Random Forest, and Neural Networks, Advances in Fuzzy Systems, 1-12 (2020). [↩]
- S.Bhattad, S.Bawane, S.Agrawal, U.Ramteke, P.Ambhore, Loan Prediction using Machine Learning Algorithms, International Journal of Computer Science Trends and Technology, 9, 143-146 (2021). [↩]
- Loan Default Prediction Dataset. https://www.kaggle.com/datasets/nikhil1e9/loan-default (2023). [↩]
- S.Zahi, B. Achchab. Modeling car loan prepayment using supervised machine learning, Procedia Computer Science, 170, 1128-1133 (2020). [↩]
- O.Peretz,M.Koren,O.Koren. Naive Bayes classifier – An ensemble procedure for recall and precision enrichment, Engineering Applications of Artificial Intelligence, 136, 108972 (2024). [↩]
- Y.Song, Y.Lu. Decision tree methods: Applications for classification and prediction, Shanghai Archives of Psychiatry, 27, 130-135 (2015). [↩]
- J. Rubio, P.Barucca, G.Gage, J.Arroyo, R.Morales-Resendiz. Classifying payment patterns with artificial neural networks: An autoencoder approach, Latin American Journal of Central Banking, 1, 100013 (2020). [↩]
- A.Strzelecka, A.Kurdyś-Kujawska, D.Zawadzka. Application of logistic regression models to assess household financial decisions regarding debt, Procedia Computer Science, 176, 3418-3427 (2020). [↩]


