
Abstract
Anthropogenic carbon dioxide (CO ) emissions play the largest role in rising global temperatures. Post-combustion carbon capture can dramatically reduce emissions, but high costs hinder its mass implementation. Zeolites are aluminosilicate crystals that serve as filters in post-combustion capture and possess silicon-to-aluminum atom ratios (Si/Al) that affect their carbon capture performance. This work aimed to discover a zeolite that surpasses industry standards: Na-FAU and Na-LTA zeolites, both with a Si/Al of 1.0. Of over 250 known zeolite frameworks, fewer than half have been evaluated for post-combustion capture, leaving most configurations unexplored. This study addresses this gap in post-combustion carbon capture research by systematically evaluating nine sodium-inserted zeolite frameworks across varying Si/Al ratios, including configurations that have not been researched. As a result, previously unexplored Na-RWY with a Si/Al of 1.0 possessed a CO capacity of 6.97 and working capacity of 5.54 mmol/g, outperforming Na-FAU by 143% and 191%, and Na-LTA by 154% and 387% in adsorption capacity and working capacity, respectively. Additionally, a strong correlation was observed between adsorption and working capacity and the zeolite framework’s accessible volume (R = 0.94 and 0.98, respectively). Although only nine frameworks were tested and physical experimentation is required to confirm results, the discovery of Na-RWY could shift current industry benchmarks, highlighting the potential of future research to lower costs and encourage widespread adoption of carbon capture.
Keywords: Carbon Capture, Zeolite, Grand Canonical Monte Carlo Simulations
Introduction
Climate change is one of the largest threats humanity is facing. The emission of carbon dioxide (CO) is the primary contributor to rising global temperatures, responsible for approximately 1.2 °C of warming since the late 19th century1. The rapid change in global temperatures has led to severe storms, increased droughts, rising sea levels, and more2. The Paris Climate Agreement consisted of 194 nations agreeing to limit global warming to 2 °C above pre-industrial levels. Current policies are not close to meeting these goals and are on track for 2.6 – 3.1 °C of warming3.
To maintain global temperatures below 2 °C from pre-industrial levels, renewable energy infrastructure needs to develop, and carbon emissions must reduce at a rapid rate. However, this is unlikely due to both political and economic boundaries. If greenhouse gas emissions could instead be mitigated, global warming would slow down, giving humanity more time to develop green infrastructure. With carbon capture, units trap emissions before they enter the atmosphere, reducing CO emissions dramatically. For this to be effective, the technology must be employed on a global scale. This poses a need for this technology to be as cost-effective and efficient as possible. Currently, post-combustion carbon capture costs around  60 per tonne of coal sourced emissions and
  90 per tonne of natural gas sourced emissions, with aims to lower costs to
  504.
504.
Post-combustion carbon capture focuses on filtering factory flue gas of carbon dioxide before it enters the atmosphere5. The process either uses absorption or adsorption to trap the CO, and desorption to release it. Absorption involves a fluid filter that captures the CO, whereas adsorption utilizes a solid filter called an adsorbent. Adsorption holds more promise in terms of cost effectiveness due to its solid filter5. This is because less energy is needed for the desorption process for a solid relative to a fluid. Once the adsorbent traps the CO, the outputting gas exits into the atmosphere. This results in the adsorbent being saturated with CO, and it must be purged to be used again. This is when the process of desorption begins. Desorption typically begins by heating or depressurizing the adsorbent, releasing trapped CO molecules5. An airstream is then generated to take the CO and transport it into a storage facility, where it is safely kept from entering the atmosphere5. Figure 1 shows the process of adsorption and desorption. The success of the adsorption and desorption process can be evaluated through several metrics, including:
 capture process.
- Adsorption Capacity – the amount of CO captured during adsorption
- CO Selectivity – the ratio of the amount of CO adsorbed versus other gases in the flue gas.
- Working Capacity – the difference between the adsorption capacity and the amount of CO remaining after desorption
The higher these values are, the more effectively CO is being adsorbed.
The composition of flue gas varies from factory to factory. Table 1 displays its variability6‘7‘8.

The general trend of the compositions reveals that nitrogen (N) has a much higher presence than CO, showing why high selectivity of CO over N is essential for efficient carbon capture. Due to cement factories being one of the highest CO-emitting factories9, their flue gas composition was used when simulating post-combustion carbon capture for this research.
Adsorption and desorption cycles can be categorized primarily between pressure-swing adsorption (PSA), vacuum-swing adsorption (VSA), and temperature-swing adsorption (TSA)10. PSA and VSA utilizes an increase in pressure for adsorption and a decrease for desorption, where VSA uses a vacuum pump for desorption. Alternatively, TSA holds the pressure nearly constant and instead increases the temperature to begin the desorption process. TSA was chosen in this study because in post-combustion carbon capture, elevated temperatures are already available, and pressure variations are less practical. Thus, a thermal swing process provides a more realistic and energy-feasible scenario than PSA or VSA for the targeted industrial conditions10.
Adsorbents can be grouped into three main categories: Activated carbons, zeolites, and metal-organic frameworks11. These three adsorbents were evaluated for post-combustion carbon capture, which operates with high temperature flue gas and near atmospheric pressure. Activated Carbons are a cheap and durable option for capturing CO11. However, their relatively weak interaction with CO leads to low adsorption capacities and selectivities at the pressures post-combustion carbon capture operates11. Metal-Organic Frameworks are lab-grown microporous materials that can achieve high adsorption capacities; however, they also require high pressures to be effective. Additionally, they are expensive to produce and not durable at high temperatures11. Zeolites possess high stability and are cheap to produce; they also possess moderate capacities at low pressures, which can be optimized by adjusting its properties via post synthetic modification techniques such as ion exchange11. Due to Zeolites’ suitable characteristics for post-combustion carbon capture, they are the adsorbent of focus for this research.
The Na-FAU and Na-LTA zeolites are considered the industry standards for post-combustion adsorption. However, of over 250 known zeolite frameworks, approximately 106 have been evaluated for their post-combustion capture performance in journals12, leaving at least 144 untested frameworks. When considering the different configurations that can be developed from each framework, the number of untested configurations is enormous. To close this research gap, this work utilized online databases and Grand Canonical Monte Carlo simulations to simulate unique, untested zeolites in cement factory conditions. The discovery of more efficient zeolites in post-combustion capture for high CO-emitting factories could lower costs and expand the use of carbon capture technology.
Zeolites
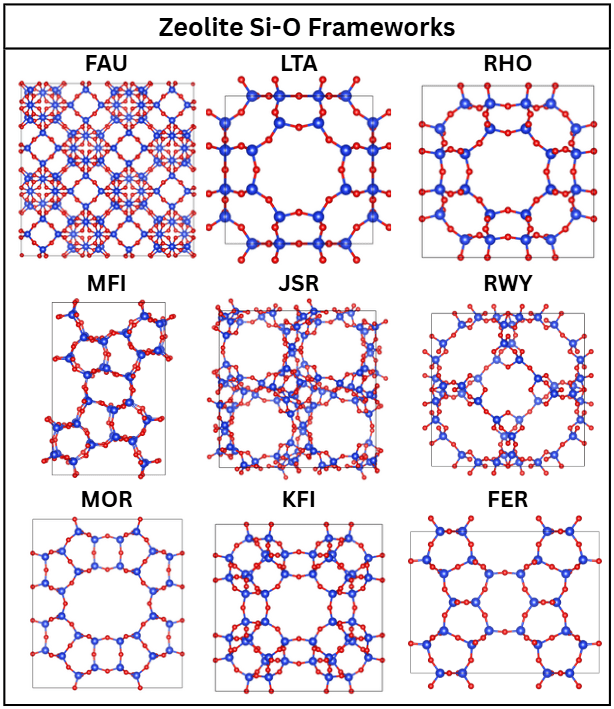
Zeolites are microporous crystals composed of silicon-oxygen tetrahedra or aluminum-oxygen tetrahedra, and extra-framework cations11. There exist over 250 types of zeolites, defined by their crystal geometry. Figure 2 showcases the different silicon-oxygen atom geometries of the zeolites involved in this work, acquired from the Database of Zeolite Structures13 and visualized with the VESTA-314 software.
Zeolites can further be differentiated by various properties, including their Si/Al and the cations they possess. Adjusting a zeolite’s framework, Si/Al, or cations greatly affects its performance in capturing carbon dioxide11. This creates a large variety of zeolites that can be tested for carbon capture technology. Zeolites capture CO through coulombic interactions, micropores, Van der Waals forces, and acid-base interactions11.
Acid Base and Coulombic Interactions
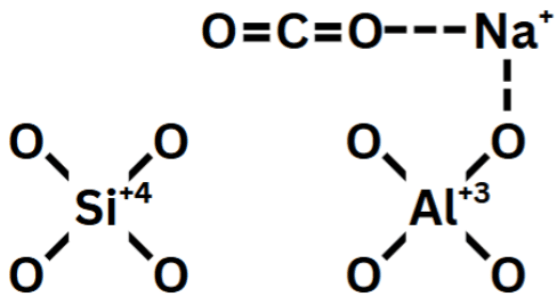
As shown in Figure 3, the silicon tetrahedron is shown to have no cations attached to it, this is due to the silicon atom’s +4 charge, which balances out with the four –1 charged oxygen atoms. However, due to the Aluminum atom’s +3 charge, a cation is then attached to maintain charge neutrality15. This cation then attracts the electronegative oxygen of the CO. In addition to this, the cations are acidic sites, while the oxygens of the CO are basic sites15. Through both coulombic forces and acid-base interactions, the cations of zeolites establish strong interaction sites for CO molecules.
Micropore Trapping
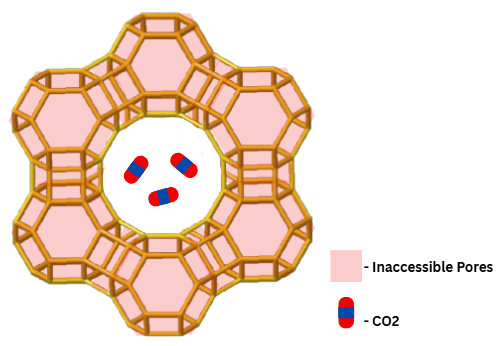
Figure 4 represents the crystal geometry of the FAU zeolite and highlights the importance of the zeolite’s pores in the carbon capture process. Their micro-scale allows for physical caging of CO molecules, while blocking other substances in flue gas that are too large to fit in the pores, such as N.
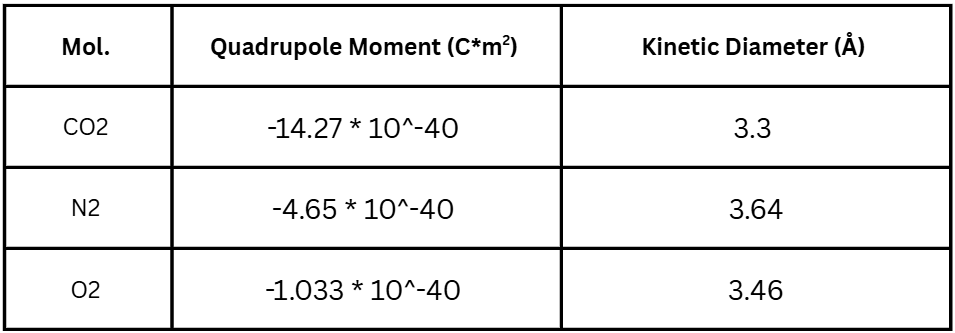
These two methods highlight how zeolites are capable of selectively capturing CO in flue gas. To determine which molecules will more likely be captured by coulombic and acid-base interactions, their quadrupole moments are compared. A molecule’s quadrupole moment describes how evenly distributed its charge is across its spherical shape. A higher quadrupole moment means a more uneven distribution of charge, leading to higher polarity and greater acidity15. To determine which molecules are more likely to be trapped in a zeolite’s micropores, their kinetic diameters are compared. The smaller the kinetic diameter is, the more likely it is to get trapped in a pore of the zeolite. Table 2 compares the gases involved16‘17‘18.
CO’s greater magnitude of quadrupole moment and smaller kinetic diameter than other gases found in flue gas explains how zeolites selectively capture CO. However, water vapor poses a major issue as it has a smaller kinetic diameter and is known to be an extremely polar molecule19. Due to these reasons, post-combustion capture processes usually treat the flue gas to remove water vapor before entering a carbon capture unit19.
 , N, and O.
Grand Canonical Monte Carlo Simulations
Zeolites can be obtained from online databases such as the Database of Zeolite Structures and modified through molecular visualization software’s such as VESTA-3. This enabled carbon capture simulation with zeolites.
Grand Canonical Monte Carlo Simulations were used, which is built specifically for adsorption calculations20. These simulations predict the amount an adsorbent will adsorb a certain molecule under specific temperature and pressure conditions. DL_MONTE-221‘22, a package derived from DL_POLY, was used to run these simulations. The software runs on the Linux operating system and utilizes 3 input files: CONFIG, FIELD, and CONTROL. The CONFIG file holds the data for the zeolite structure, specifying where each atom of the crystal is located. The CONTROL file holds the specific temperature and pressure that the simulation will run at, as well as all the simulation parameters. The FIELD file establishes the force field.
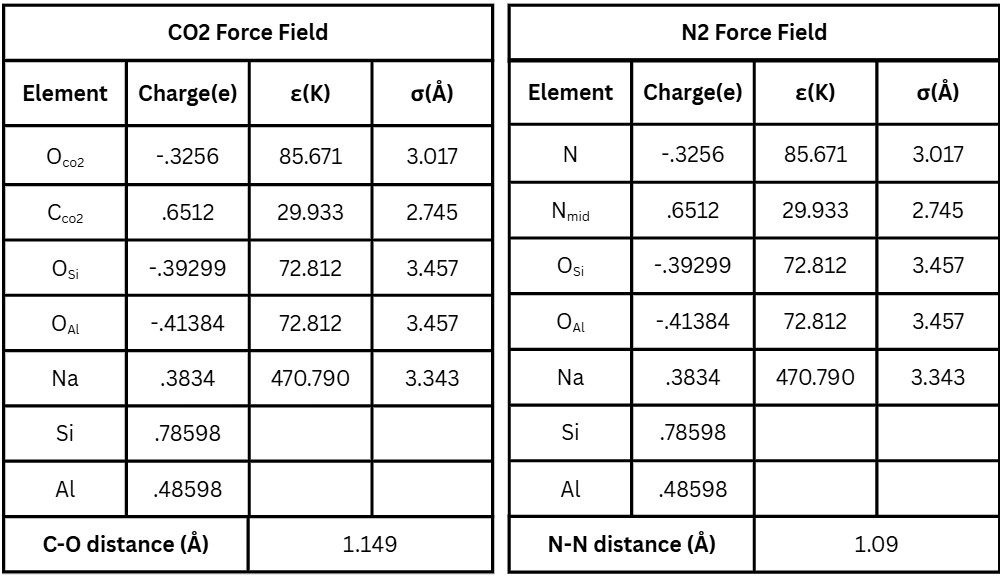
There exist many different force fields; their purpose is to define the interactions between different atoms involved in the simulation23. The force fields used in this research utilizes Lennard-Jones (LJ) potentials, which defines the potential energy between 2 nonbonded atoms as a function of their distance from each other23, and sets partial charges for each atom type. Two different force fields were used, one to simulate CO adsorption24 and the other for N2 adsorption25. To compute long-range coulombic interactions, Ewald summations with a real-space cutoff of 12.0 Angstroms were used. Reciprocal-space contributions were summed with default DL_MONTE-2 parameters (k1max = k2max = k3max = 7). No additional tail corrections or shifted potentials were applied. Table 3 displays these two force fields.
 force field and the N force field.
The OSi and OAl atoms denote whether an oxygen atom belongs to a silicon or an aluminum tetrahedron. This is important as they possess different LJ parameters, affecting simulation outcomes. To calculate the Lennard-Jones potentials between two different atoms, Equations 1 and 2 are shown below26.
(1) 
(2) 
The CONTROL file specified 50,000 equilibration cycles followed by 100,000 production cycles, with one attempted move occurring per cycle for each simulation. The move probabilities for both CO and N molecules were set to 20% translation, 20% rotation, and 60% insertion/deletion with a minimum insertion distance of 0.5 Angstroms from framework atoms. The zeolite framework atoms were treated as rigid, while the CO and N molecules were flexible during simulation.
It is also important to state that the simulations assume idealized conditions. The zeolite was treated as a rigid framework, the pressure and temperature were constant, and the configuration box was a fixed volume. In addition to this, complex intermolecular interactions were largely simplified to force fields, making the force field the primary determinant for simulation accuracy. These assumptions may limit the direct relevance of the simulated results in real-world applications.
Research Question
What zeolite configurations can Grand Canonical Monte Carlo Simulations identify as more efficient than industry-standard zeolites in post-combustion CO2 adsorption?
Methodology
Basic silicon oxygen frameworks of the zeolites were obtained from the Database of Zeolite Structures. Aluminum atoms substituted silicon atoms to set the Si/Al ratio. Sodium atoms were added nearby aluminum atoms to maintain local charge neutrality.
Each zeolite configuration underwent geometry optimization utilizing the Avogadro2 software27 and the UFF force field28. Afterwards, the oxygen atoms were classified as either OSi or OAl atoms.
Grand Canonical Monte Carlo simulations were performed through the DL_MONTE software to calculate the adsorption capacities of each configuration. The CONFIG file held the current configuration, and the CONTROL file held the current pressure and temperature at which the simulation occurred. For CO adsorption, the CO force field was applied to the FIELD file, and two isotherms of 313K and 393K were generated. Simulations for each isotherm were run across pressures of 0.022, 0.11, 0.22, 0.44, 0.66, 0.88, and 1.1 atmospheres (atm).
The simulations outputted the number of CO molecules adsorbed. The values from each pressure were converted into mmol of CO per gram of zeolite (mmol/g). The data was then fitted to a Langmuir Isotherm29 to increase the simulation accuracy. For N adsorption, the force field was set to the N force field, and simulations were conducted at 313K. Additionally, different pressures of 0.069, 0.345, 0.69, 1.38, 2.07, 2.76, and 3.45 atm were used. For each framework, adsorption simulations were repeated for varying Si/Al ratios starting from 1.0 up to 5.0 in 0.5 increments. The process was applied to zeolites FAU, LTA, RHO, MFI, MOR, RWY, KFI, and FER. This process was automated utilizing Java programs. A GitHub repository containing the CONFIG, FIELD, CONTROL files, the Java programs, the zeolite XYZ files, and simulation results has been created30.
Generating the Zeolite
The silicon-oxygen frameworks of each zeolite were acquired from the Database of Zeolite Structures in the CIF file format. VESTA-3 was used to convert this into XYZ format, giving Cartesian coordinates of each atom. Once this was done, repeating atoms were removed from the unit cell. The unit cell was repeated until at least 192 silicon atoms were achieved, and silicon atoms were substituted with aluminum atoms until the desired Si/Al ratio was reached. Afterwards, sodium zeolites were generated within a close distance of these aluminum atoms and an acceptable radius away from any nearby atoms to prevent potential overlapping. Figure 5 demonstrates this process for the FAU zeolite with a Si/Al of 1.030.

Optimizing Configuration Geometries
Each different zeolite configuration underwent geometry optimization using the Avogadro2 software, which utilized the UFF force field. This helped relax the structure and create a more realistic molecule, improving the accuracy of the simulated data.
Identifying Oxygens from Silicon or Aluminum Tetrahedron

Because the force field holds different LJ potentials depending on whether an oxygen atom belongs to an aluminum or silicon tetrahedron, it was necessary to identify these atoms in zeolite configurations before simulation. Figure 6 illustrates how the  and
and  atoms were identified.
Determining the Temperature, Pressure, and Si/Al Values
The average pressure and temperature conditions for post-combustion Carbon Capture utilizing adsorption in cement factories were researched. For adsorption, temperatures range from 40 °C to 60 °C, and the pressure is typically atmospheric31. For desorption, the temperature is raised to approximately 120 °C31. These were the values used to guide the pressure and temperature conditions of the simulations. Each zeolite configuration has 313 and 393K isotherms with flue gas pressures of 0.1, 0.5, 1.0, 2.0, 3.0, 4.0 and 5.0 atmospheres. The evaluation metrics were calculated at the atmospheric flue gas pressure of 1.0 atm.
As previously noted, a cement factory’s flue gas composition is 17.7% CO, 56.5% N, 7.5% O, and 18.2% HO. Assuming this is treated for water vapor before entering the carbon capture process, the new composition is 22% CO, 69% N, and 9% O. While this isn’t an exact composition, it provided an accurate estimate of the zeolite’s performance. These percentages were applied to the flue gas pressures and created pressures of 0.022, 0.11, 0.22, 0.44, 0.66, 0.88, and 1.1 atm for CO adsorption and pressures of 0.069, 0.345, 0.69, 1.38, 2.07, 2.76, and 3.45 atm for N adsorption.
To determine which Si/Al ratios to simulate, a balance between computational cost, Si/Al range, and chemical meaningfulness had to be struck. Various literature categorizes zeolites such as Na-X and Cs-PHI with Si/Al ratio ranges of 0.5 due to the insignificance of variations smaller than this value on simulation results32‘15. This determined an incremental Si/Al value of 0.5. Zeolites generally perform better with lower Si/Al ratios, with 1.0 being the lowest possible, and so an initial ratio of 1.0 was decided. A final Si/Al ratio of 5.0 was determined due to a combination of computational expense and redundancy, as any larger ratios would likely produce undesirable, irrelevant results. This assumption was confirmed later by the results produced in this work.
Converting molecules adsorbed to mmol/g
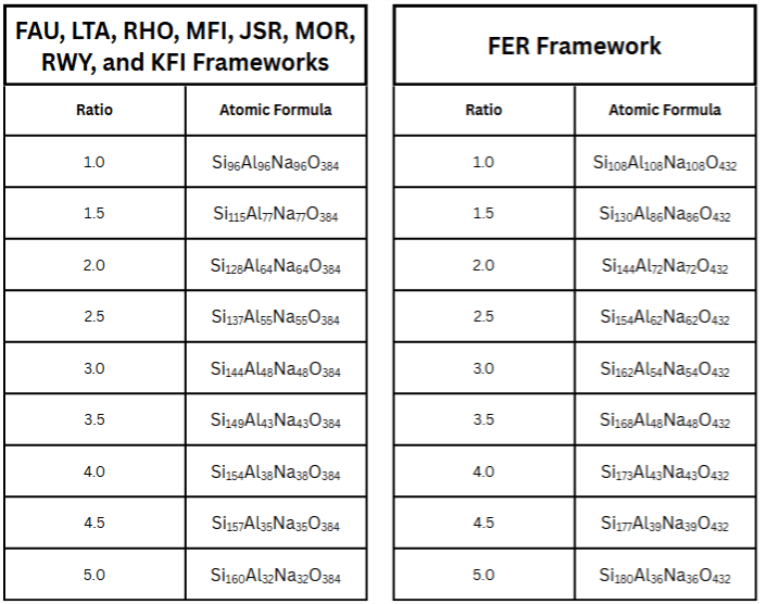
The DL_MONTE simulations return the number of molecules adsorbed; however, this unit is not as useful as mmol/g, which considers the amount of zeolite involved in the simulation. Equation 3 shows the conversion process utilizing molar masses of 28.08, 26.98, 22.99, and 16.00 g/mol for silicon, aluminum, sodium, and oxygen atoms, respectively. Table 4 displays the atomic formulas for the zeolites involved in this work.
(3) 
Creating CO and N Langmuir Isotherms
The Langmuir Isotherm model presents a function of the amount of CO adsorbed vs the pressure29. It assumes there’s a set number of active sites on the adsorbent’s surface, with each site only allowed to adsorb one molecule29. These assumptions were confirmed to be valid for this research’s zeolite configurations through visualization on VESTA-3. The nonlinear function of the Langmuir Isotherm model is shown in Equation 4 below.
(4) 
Where  is the amount adsorbed,
  is the maximum amount the surface can adsorb,
  is the equilibrium constant between the gas and adsorbed phases, and
  is the pressure29. Each isotherm of each zeolite’s Si/Al ratios was fitted to this model. This was done by adjusting the and constants to minimize the deviation between the model curve and the data points for each isotherm and then recalculating the adsorption capacities for each pressure using those constants. This greatly enhances the accuracy of the simulated data as it develops a trendline for all data points in the isotherm, removing any abnormalities. R-squared values are available for each isotherm and Langmuir-model fitting in the GitHub repository.
Calculating Working Capacity and Selectivity
The unit for working capacity and adsorption capacity is in mmol/g. This allows for taking into consideration the physical amount of zeolite when determining efficiency. The adsorption capacity is the amount of CO captured at 0.22 atm, which corresponds to 1.0 atm for flue gas, and at the 313 K isotherm. The working capacity was calculated by taking the zeolite’s adsorption capacity and subtracting it from the 393 K isotherm at 1.0 atm flue gas. This was because the 393 K isotherm was the proposed desorption isotherm. The selectivity was calculated by dividing the adsorption capacity by the N adsorption. The N adsorption was determined at 313 K and a pressure of 0.69 atm, which also corresponds to 1.0 atm of flue gas. Note that selectivity did not have any units, as it’s the ratio of the adsorption capacities of CO and N.
Accuracy Testing
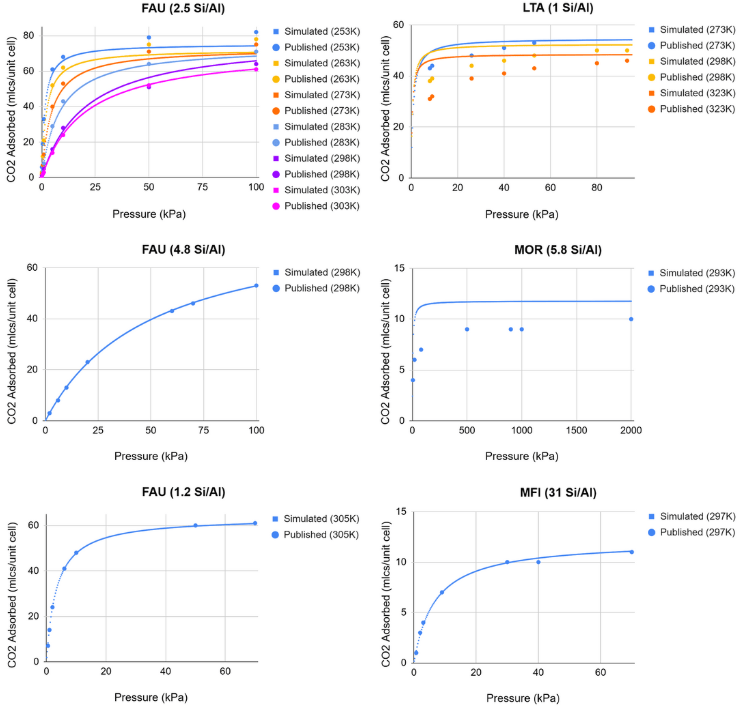
Ten isotherms across four zeolite frameworks with different Si/Al ratios were used to evaluate the accuracy of the data collected. Data points collected from the simulations were compared to published results of physical CO adsorption experiments24‘33. Figure 7 portrays the results.
Eighty-nine data points were used to evaluate the accuracy of simulated data. The root-mean-square deviation (RMSE) between published results and simulated results resulted in 2.58 molecules per unit cell, with a mean deviation of 1.83, and a max deviation of 7.77 molecules per unit cell. These values, when calculated in mmol/g, resulted in an RMSE of 0.17, a mean deviation of 0.20, and a max deviation of 1.40. While a max deviation of 1.4 mmol/g is significant, it’s largely due to the small unit cell of the Na-MOR zeolite with a Si/Al of 5.8 (151 atoms), as the simulated and published results for that specific data point only varied by 4 molecules. This concern is mitigated in the simulation results due to larger atom counts for each zeolite ( 600 atoms).
 adsorption.
N adsorption simulations were also compared against published data34; the results are shown in Figure 8.
28 different data points were collected, resulting in an RMSE of 2.64, a mean deviation of 2.02, and a max deviation of 5.01 N molecules per unit cell. After converting each data point into mmol/g using their respective zeolites, these values were 0.32, 0.24, and 0.62 mmol/g, respectively. Once again, the max deviation in mmol/g belonged to a zeolite with a small unit cell count (108 atoms). Both the CO and N adsorption simulations showed exceptionally accurate data compared to published experimental isotherms.
 adsorption.
Results and Discussion
 adsorption, and working capacities of all zeolite configurations simulated.
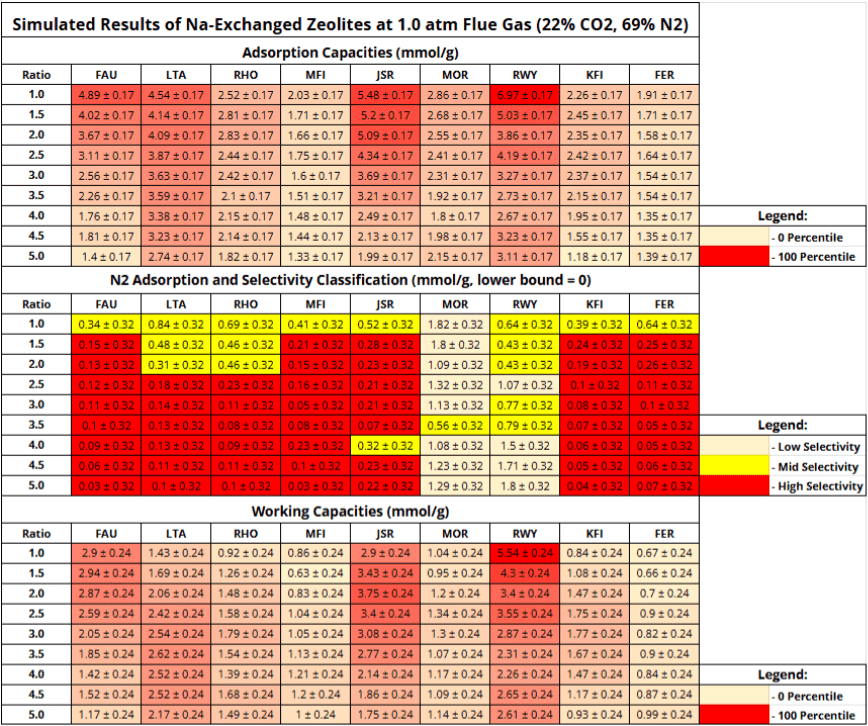
Table 5 displays the CO capacities, N capacities, and working capacities of all zeolite configurations tested. Deviations were evaluated by the RMSE values obtained during the accuracy testing of simulated results and were 0.17 and 0.32 mmol/g for CO and N adsorption capacities, respectively. The working capacity deviation was calculated using the error propagation rules of subtraction shown in Equation 5 below35.
(5) 
Where  is the RMSE of CO adsorption at 313K and
  is the RMSE of CO desorption at 393K. CO RMSE values were not distinctly categorized by temperatures during accuracy tests, and so both and are 0.17 mmol/g. This makes the RMSE for working capacity, which is the 313K CO isotherm subtracted by the 393K CO isotherm, 0.24 mmol/g.
Among the frameworks tested, Na-RWY and Na-JSR zeolites with Si/Al ratios of 1.0 outperformed industry benchmarks Na-FAU and Na-LTA zeolites with Si/Al of 1.0. Na-RWY held the highest values for both adsorption and working capacity (6.97 and 5.54 mmol/g), while Na-JSR zeolite also performed strongly (5.48 and 2.9 mmol/g, respectively). It’s significant to note that Na-RWY’s adsorption capacity was simulated to be 2.08 mmol/g higher than Na-FAU and 2.43 mmol/g higher than Na-LTA, both well above the 0.17 mmol/g RMSE for adsorption capacity. Additionally, Na-RWY had a working capacity 2.64 mmol/g higher than Na-FAU and 4.11 mmol/g higher than Na-LTA, also substantially higher than the 0.24 mmol/g RMSE for working capacities. Because these differences exceeded the RMSE error margins by over an order of magnitude, they represent statistically significant values rather than computational noise. While a full economic analysis lies beyond the scope of this work, improvements in adsorption and working capacities such as those observed here would be expected to significantly reduce regeneration energy and overall operating costs in cement plant carbon capture.
Due to the large deviations of N adsorption relative to the amount of N adsorbed during simulations, calculated selectivities were accompanied by errors of orders of magnitude higher, making any such calculation useless. Instead, raw N adsorption values were reported while selectivities and their uncertainties are available in the GitHub repository. While this doesn’t factor in the amount of CO captured like selectivity does, it still gives useful data by revealing high and low-N adsorbing zeolite configurations, allowing for categorization of selectivity among zeolites. The selectivity was categorized into three categories: high, mid, and low. Categories were determined by taking the maximum amount of N adsorbed across all simulations (1.82 mmol/g) and dividing that into thirds. This allows for an appropriate scaling of selectivity among the simulated results with categories large enough to factor in the N RMSE. To evaluate selectivity conservatively, each raw N adsorption was added with the RMSE for N (0.32 mmol/g) and put into its appropriate category. The high selectivity category represents configurations with N adsorption values less than one-third of the maximum value after adding the RMSE for N. Zeolites with N adsorption greater than two-thirds the maximum value after being added the RMSE for N were put into the low selectivity category. The configurations in between were put into the mid category. While this method departs from conventional selectivity reporting, it ensures that error margins do not obscure selectivity categorizations.
Overall, 51 configurations were placed into the high selectivity category, 18 into the mid category, and 12 into the low selectivity category. Of these, Na-FAU, Na-LTA, Na-JSR, and Na-RWY, all with Si/Al ratios of 1.0, belonged to the mid category. Additionally, only Na-MOR and Na-RWY held configurations that belonged to the low selectivity category, suggesting weak CO/N selectivity for these frameworks.
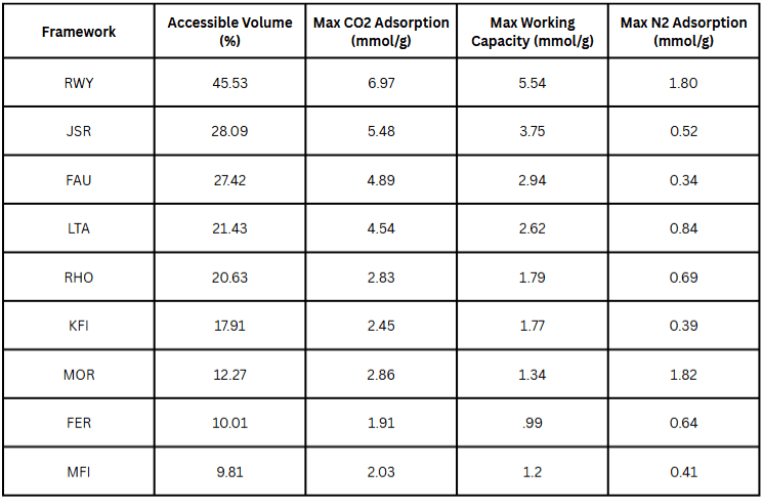
The results indicate that framework topology primarily dictates carbon capture performance. This is supported by a strong correlation between a framework’s accessible volume (reported in the Database of Zeolite Structures) and its simulated CO adsorption and working capacities ( and
and  , respectively). By contrast, there was not a strong correlation with accessible volume and N adsorption (
 ), suggesting that other compositional factors govern N adsorption. Table 6 highlights the trend with adsorption and working capacities by ranking the frameworks by accessible volume in descending order.
 adsorption, working capacity, and N adsorption.
Additionally, this trend was consistent with the observation that increasing Si/Al ratios generally resulted in reduced adsorption capacity, N adsorption, and working capacity. Together, these results suggest that the framework and its accessible volume play a large role in determining adsorption and working capacities, while low Si/Al ratios result in higher CO adsorption and working capacity with the cost of higher N adsorption and thus lower selectivity.
Overall, the simulations revealed promising configurations such as Na-RWY with a Si/Al of 1.0 and Na-JSR with a Si/Al of 1.0 that could outperform the Na-FAU and Na-LTA industry standards under post-combustion cement factory conditions. However, neither the industry standards nor promising configurations belonged to the high selectivity category. This suggests a trade-off between adsorption/working capacity and selectivity that, if overcome, could further optimize zeolite carbon capture technology. Although detailed cost modeling was not feasible within this work, the superior performance of Na-RWY relative to industry-standard zeolites indicates considerable potential for reducing operational expenses in carbon capture. The limitations of the simulation setup and applicability are described in the next section.
Limitations and Future Work
Several factors constrain the applicability of these results. First, because these are theoretical, sodium-exchanged zeolites with low Si/Al ratios, synthesis may be expensive or even impossible. Thus, although Na-RWY and Na-JSR zeolites with a 1.0 Si/Al performed the best computationally, their real-world application may prove challenging.
Second, while different zeolites with varying Si/Al ratios were tested, simulations were restricted to sodium cations. While sodium is commonly used in carbon capture applications, substitution of different cations such as lithium, calcium, and potassium can greatly change the zeolite’s adsorption capacity, selectivity, and working capacity in framework-dependent and often unpredictable ways36. Excluding cation variation in the search space may overlook higher-performing configurations.
Finally, while simulations were the only feasible way to conduct data collection on this scale, they are inherently subject to artifacts caused by the force-field, structural-modeling, and Grand Canonical Monte Carlo setup. Additionally, industrial flue gas contains water vapor and trace contaminants that were not included in this work, which can degrade a zeolite’s performance36. Thus, while the accuracy of the simulation setup was rigorously tested, ultimately, the validation of the research results requires physical experimentation. Future work will therefore proceed in two primary directions: Expanding the simulation search space and experimental validation.
Expanding the Search Space
There are multiple ways to expand the current search space. All of them, however, require the discovery or creation of a more diverse force field. This poses a significant challenge, as to this work’s knowledge, a force field that can accurately simulate CO adsorption across various frameworks with other cations than sodium does not exist. A potential alternative is the development of a force field instead. This also presents major challenges, though, as the creation of a suitable force field that could accomplish such versatility may not be accomplished, and if so, would require extensive time with supercomputing resources. If the obstacle of a more diverse force field can be overcome, the process of generating accurate zeolites with non-sodium cation insertions could be challenging as well. This is due to the abundance of experimental data on sodium-inserted zeolites, which makes benchmarking feasible during accuracy tests.
Experimental Validation
In addition to expanding the simulation workspace, promising configurations must undergo experimental validation before determining their potential application. This would involve purification of zeolites to remove any contaminants by heating to high temperatures. Afterwards, ion-exchange likely through a liquid-cation solution would be utilized to insert the desired number of cations into the zeolite37. The zeolite would likely be in powder form and packed into pipes. Once the zeolite is prepared, an experimental setup consisting of carbon dioxide and nitrogen gas sources, a controlled temperature and pressure chamber, and CO and N gas percentage sensors would be needed. This would allow for CO and N intake measurements of the zeolite with the exact temperatures and pressures conditions as the simulations. Once the data is collected, it can be compared against simulated data to confirm the legitimacy of the results.
Conclusion
This work represents the first systematic tuning of Si/Al across multiple zeolite frameworks under cement flue gas conditions. The discovery of the Na-RWY zeolite as a computationally optimal configuration opens new directions in the search for high-performance carbon capture zeolites beyond current industry standards Na-FAU and Na-LTA. If experimentally validated, the enhanced adsorption and working capacity of Na-RWY could translate into substantial energy savings for regeneration and lower capture costs in cement plants, where adsorption efficiency directly governs economic feasibility. Development of more efficient carbon capture methods could prove to be essential in the race to reduce rising CO emissions and global temperatures. The lower cost of carbon capture units would aid in generating a larger appeal to adapting this technology to companies throughout the globe, greatly raising humanity’s chances of fighting climate change and stabilizing earth’s global temperatures.
References
- WMO. Climate change indicators reached record levels in 2023: WMO. https://wmo.int/news/media-centre/climate-change-indicators-reached-record-levels-2023-wmo (2024 [↩]
- United Nations. Causes and Effects of Climate Change. https://www.un.org/en/climatechange/science/causes-effects-climate-change (2024). [↩]
- UNEP. Emissions Gap Report 2024. https://www.unep.org/resources/emissions-gap-report-2024 (2024). [↩]
- W. J. Schmelz, G. Hochman, K. G. Miller. Total cost of carbon capture and storage implemented at a regional scale: northeastern and midwestern United States. Interface focus, 10, 5 (2020). [↩]
- S. E. Zanco, J. Pèrez-Calvo, A. Gasós, B. Cordiano, V. Becattini, M. Mazzotti. Postcombustion CO Capture: A Comparative Techno-Economic Assessment of Three Technologies Using a Solvent, an Adsorbent, and a Membrane. ACS Engineering AU, 1 (1), 50-72 (2021). [↩] [↩] [↩] [↩]
- W. Schakel, C. R. Hung, L. Tokheim, A. H. Strømann, E. Worrell, A. Ramírez. Impact of fuel selection on the environment performance of post-combustion calcium looping applied to a cement plant. Applied Energy, 210, 75-87 (2010). [↩]
- L. Xi, Q. Lin, M. Hasan, L. Ming, L. Qiang, L. Jia, W. Alisa, L. Muxin, A. Francisco. Assessing the Economics of CO Capture in China’s Iron/Steel Sector: A Case Study. Energy Procedia, 158, 3715-3722 (2019). [↩]
- C. Song, W. Pan, S. T. Srimat, J. Zheng, Y. Li, Y. Wang, B. Xu, Q. Zhu. Tri-reforming of Methane over Ni Catalysts for CO Conversion to Syngas With Desired H2/CO Ratios Using Flue Gas of Power Plants Without CO Separation. Studies in Surface Science and Catalysis, 153, 315-322 (2004). [↩]
- ASU News. Curbing concrete’s carbon emissions with innovations in cement manufacturing. https://news.asu.edu/20231017-curbing-concretes-carbon-emissions-innovations-cement-manufacturing (2023). [↩]
- A. Das, S. D. Peu, M. S. Hossain, M. M. A. Nahid, F. R. B. Karim, H. Chowdhury, M. H. Porag, D. B. P. Argha, S. Saha, A. R. M. T. Islam, M. M. Salah, A. Shaker. Advancements in adsorption based carbon dioxide capture technologies- A comprehensive review. Heliyon, 9 (12), 22341 (2023). [↩] [↩]
- D. G. Boer, J. Langerak, P. P. Pescarmona. Zeolites as Selective Adsorbents for CO Separation. ACS Applied Energy Materials, 6 (5), 2634-2656 (2023). [↩] [↩] [↩] [↩] [↩] [↩] [↩] [↩]
- F. Khan, M. S. Arman, D. Sharma, Z. Pei, C. Ma. Zeolite types reported in the literature on CO adsorption capacity: status and gaps. Separation and Purification Technology, 378, 134596 (2025). [↩]
- C. Baerlocher, D. Brouwer, B. Marler, L.B. McCusker. Database of Zeolite Structures. https://www.iza-structure.org/databases/. [↩]
- K. Momma, F. Izumi. VESTA 3 for three-dimensional visualization of crystal, volumetric and morphology data. Journal of Applied Crystallography, 44, 1272-1276 (2011). [↩]
- D. G. Boer, J. Langerak, P. P. Pescarmona. Zeolites as Selective Adsorbents for CO2 Separation. ACS Applied Energy Materials, 6 (5), 2634-2656 (2023). [↩] [↩] [↩] [↩]
- C. Graham, D. A. Imrie, R. E. Raab. Measurement of the electric quadrupole moments of CO2, CO, N2, Cl2 and BF3. Molecular Physics, 93 (1), 49-56 (1998). [↩]
- C. Scholes, G. Stevens, S. Kentish. Carbon Dioxide Separation through Polymeric Membrane Systems for Flue Gas Applications. Recent Patents on Chemical Engineering, 1(1), 52-66 (2008). [↩]
- V. W. Couling, S. S. Ntombela. The electric quadrupole moment of O2. Chemical Physics Letters, 614, 41-44 (2014). [↩]
- D. Marx, L. Joss, M. Hefti, R. Pini, M. Mazzotti. The Role of Water in Adsorption-based CO2 Capture Systems. Energy Procedia, 37, 107-114 (2013). [↩] [↩]
- V. Ekberg, M. L. Samways, M. M. Ignjatović, J. W. Essex, U. Ryde. Comparison of Grand Canonical and Conventional Molecular Dynamics Simulation Methods for Protein-Bound Water Networks. ACS Physical Chemistry Au, 2(3), 247-259 (2022). [↩]
- A. V. Brukhno, J. Grant, T. L. Underwood, K. Stratford, S. C. Parker, J. A. Purton, N. B. Wilding. DL_MONTE: a multipurpose code for Monte Carlo simulation. Molecular Simulation, 47, 131-151 (2019). [↩]
- J. A. Purton, J. C. Crabtree, S. C. Parker. DL_MONTE: a general purpose program for parallel Monte Carlo simulation. Molecular Simulation, 39, 1240-1252 (2013). [↩]
- K. Heijmans, I. C. Tranca, D. M. J. Smeulders, T. J. H. Vlugt, S. V. Gaastra-Nedea. Gibbs Ensemble Monte Carlo for Reactive Force Fields to Determine the Vapor-Liquid Equilibrium of CO2 and H2O. Journal of Chemical Theory and Computation, 17(1), 322-329 (2020). [↩] [↩]
- A. García-Sánchez, C. O. Ania, J. B. Parra, D. Dubbeldam, T. J. H. Vlugt, R. Krishna, S. Calero. Transferable Force Field for Carbon Dioxide Adsorption in Zeolites. The Journal of Physical Chemistry C, 113(20), 8814-8820 (2009). [↩] [↩]
- B. Vujic, A. P. Lyubartsev. Transferable force-field for modelling of CO2, N2, O2 and Ar in all silica and Na+ exchanged zeolites. Modelling and Simulation in Materials Science and Engineering, 24, 1-24 (2016). [↩]
- A. R. McCluskey. Mixing Rules. https://pythoninchemistry.org/sim_and_scat/parameterisation/mixing_rules (2019). [↩]
- M. D. Hanwell, D. E. Curtis, D. C. Lonie, T. Vandermeersch, E. Zurek, G. R. Hutchison. Avogadro: an advanced semantic chemical editor, visualization, and analysis platform. Journal of Cheminformatics. 4, 17 (2012). [↩]
- A. K. Rappe, C. J. Casewit, K. S. Colwell, W. A. Goddard III, W. M. Skiff. UFF, a full periodic table force field for molecular mechanics and molecular dynamics simulations. Journal of the American Chemical Society, 114 (25), 10024-10035 (1992). [↩]
- A. Bauer. The langmuir adsorption model. https://mcl.mse.utah.edu/the-langmuir-adsorption-model/ (2021). [↩] [↩] [↩] [↩]
- J. Lezama. Zeolite-CarbonCapture-DLMONTE-GCMC. https://github.com/JohnLezama/Zeolite-CarbonCapture-DLMONTE-GCMC (2025). [↩] [↩]
- C. Chao, Y. Deng, R. Dewil, J. Baeyens, X. Fan. Post-combustion carbon capture. Renewable and Sustainable Energy Reviews, 138, 110490 (2021). [↩] [↩]
- H. J. Choi, D. Jo, K. S. Kencana, S. B. Hong. Effect of framework Si/Al ratio on the CO2 adsorption mechanism on cesium-exchanged phillipsite zeolites. Separation and Purification Technology, 358, 130306 (2045). [↩]
- J. M. Findley, S. E. Boulfelfel, H. Fang, G. Muraro, P. I. Ravikovitch, D. S. Sholl. A Transferable Force Field for Predicting Adsorption and Diffusion of Hydrocarbons and Small Molecules in Silica Zeolites with Coupled-Cluster Accuracy. The Journal of Physical Chemistry C, 125(15), 8418-8429 (2021). [↩]
- B. Vujic, A. P. Lyubartsev. Transferable force-field for modelling of CO, N, O and Ar in all silica and Na
 exchanged zeolites. Modelling and Simulation in Materials Science and Engineering, 24, 1-24 (2016). [↩]
 - V. Lindberg. Uncertainties and Error Propogation Part I of a manual on Uncertanties, Graphing, and the Vernier Caliper. http://www.geol.lsu.edu/jlorenzo/geophysics/uncertainties/Uncertaintiespart2.html (2000). [↩]
- D. G. Boer, J. Langerak, P. P. Pescarmona. Zeolites as Selective Adsorbents for CO Separation. ACS Applied Energy Materials, 6 (5), 2634–2656 (2023). [↩] [↩]
- R. P. Townsend, E. N. Coker. Chapter 11 Ion Exchange in Zeolites. Studies in Surface Science and Catalysis. 137, 467-524 (2001). [↩]


