
Abstract
Plastic pollution is a major issue in our world, and our online shopping habits are contributing to the issue even further. Online shopping patterns changed significantly during COVID-19, but the extent to which this shift contributed to plastic waste remains unclear. Using various open data sources, such as NYC and Austin, Texas Open Data, I estimated trends in waste generation related to online shopping in the U.S., focusing specifically on recyclable materials that include plastic. I collected garbage and recycling data from before, during, and after the pandemic, and analyzed trends in Google search interest. NYC and Austin were used as case studies to examine plastic levels during peak COVID times (pre-COVID: December 1, 2019–February 29, 2020; during COVID: December 1, 2020–February 28, 2021; and post-COVID: December 1, 2023–February 29, 2024). I also utilized Google Trends to obtain data from specific time periods. I analyzed the data to identify patterns that help provide an estimate of plastic waste levels. I found that recyclable waste levels increased during peak COVID months, which may be associated with greater demand for supplies and increased delivery services. However, because the data includes other materials such as metal, glass, and cartons, these patterns cannot be attributed specifically to plastic consumption. This research shows that open data sources can be useful for analyzing trends in plastic consumption, but reveal the need for more precise data tracking on plastic pollution for environmental conservation.
Keywords: plastic pollution, online shopping, COVID-19, Google Trends, environmental conservation
Introduction
Plastic pollution poses significant risks to both human health and the natural environment, with consumer behaviors contributing to this issue. The COVID-19 pandemic was associated with increases in both online shopping behavior and plastic-related waste. With restaurants and shops closed for a significant amount of time and millions of Americans staying home as a preventative measure against contracting COVID-19, e-commerce sales and food delivery increased by 43% and 142%, respectively1,2. Furthermore, single-use plastic items were used more often during the pandemic because of hygiene concerns. These activities are often linked to plastic pollution. For example, Amazon generated 709 million pounds of plastic packaging waste in 2021, and online shopping results in about five times more plastic waste than in-store shopping3. These habits have persisted beyond the pandemic. In fact, a survey of 2,000 American adults conducted by McKinsey & Company in November of 2020 found a 40% net increase in intent among respondents to spend online post-Covid4.
This research paper explores the possibility of using open data sources to analyze the impact of increased online shopping and home deliveries on plastic pollution due to the COVID-19 pandemic. I did this by examining the values of two different data sources during pre-COVID (December 1, 2019–February 29, 2020), during COVID (December 1, 2020–February 28, 2021), and post-COVID (December 1, 2023–February 29, 2024). These time frames were selected based on mortality rates in the United States. For the first dataset, I searched different terms on Google Trends and examined their search popularity in the United States during each time period. The terms I used included COVID-related products and popular online shopping and delivery platforms that may all result in increased plastic, for example, “masks,” “Amazon,” and “Instacart.” For the second dataset, I used open data about garbage and recycling materials from New York City and Austin, Texas. Throughout this paper, I use terms like “plastic waste,” “plastic consumption,” and “packaging waste” somewhat interchangeably to reflect trends likely influenced by plastic packaging use. However, the waste datasets analyzed include other materials such as metal, glass, and cartons, so the results reflect broader waste patterns, not isolated plastic pollution levels.
I had two hypotheses for my analysis:
H1: People increased their online shopping and food delivery during COVID-19, which may have contributed to greater overall household waste, including packaging-related materials.
H2: Online shopping patterns that emerged during the pandemic have continued post-COVID, potentially sustaining elevated levels of packaging waste compared to pre-COVID behavior.
While these hypotheses aim to highlight the potential relationship between online shopping behavior and waste patterns, they are simplified models that do not account for the full complexity of consumer behavior, packaging systems, and waste infrastructure. Factors such as local recycling policy, product type, consumer income, and packaging design also influence waste generation and plastic use. This study does not seek to model all such factors but instead provides an exploratory analysis that future research can build on with more comprehensive data and modeling techniques.
I found that plastic consumption has increased since the COVID-19 pandemic due to our altered shopping habits. A survey of consumers from 23 different countries reported a 53% increase in their households’ plastic packaging waste during the pandemic5. The scope of this research is limited to publicly available datasets, including Google Trends data and municipal garbage and recycling data from New York City and Austin, Texas, during pre-COVID, during COVID, and post-COVID periods. Unlike many previous studies that focused primarily on global marine microplastic levels or industry-specific trends, this study integrates municipal waste and behavioral data at the city level to examine domestic consumption patterns. While some research has modeled plastic pollution growth or investigated supply-chain changes, few have combined consumer interest indicators with local-level waste collection to estimate plastic-related trends over time. This approach offers a practical, accessible framework that can be replicated or scaled in future environmental analyses.
Several studies have examined the impact of the COVID-19 pandemic on plastic pollution, online shopping, and the rise of packaging waste, providing valuable insights into the broader environmental consequences6,7,8,9,10. Dr. Phan and Dr. Luscombe’s 2023 research used machine learning to monitor microplastics in marine environments and found that masks, gloves, COVID-19 antigen tests, and other medical items contributed to plastic pollution. As a result, plastic manufacturing has increased because many of these essentials are either completely made of plastic or contain plastic components. Takeout containers, utensils, and other single-use plastic items were also used more during the pandemic because of hygiene concerns. Furthermore, the increased use of single-use plastics resulted in spikes in waste production globally, with Wuhan, China, producing 200 tons of medical waste in a single day, far exceeding incineration capacity.
Online shopping boomed during the pandemic, with companies like Amazon reporting a 37% increase in sales by the third quarter of 2020. This surge led to significant plastic packaging waste, with Amazon alone generating 465 million pounds of plastic in 2019, a portion of which ended up polluting waterways. Online shopping produces nearly five times more packaging waste than traditional shopping, and this trend is expected to add 10% more waste over the next decade.
Additionally, online food delivery services saw rapid growth, contributing to a 12-36% increase in non-biodegradable packaging waste. Together, these studies highlight the pandemic’s significant environmental impact and the urgent need for improved waste management practices.
Results
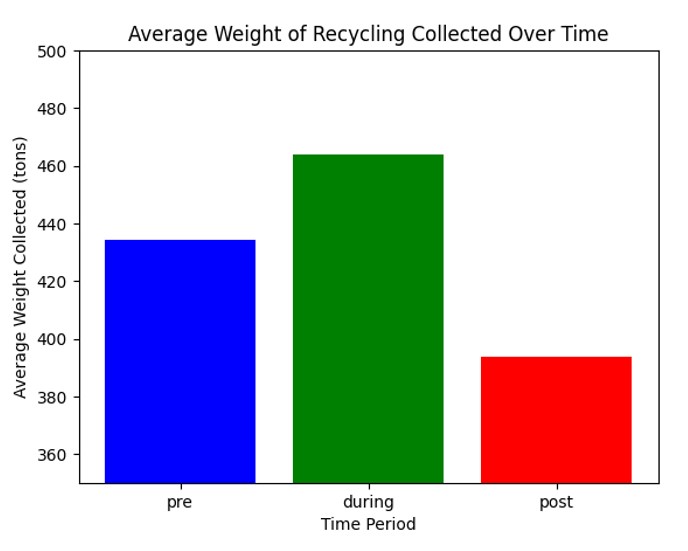
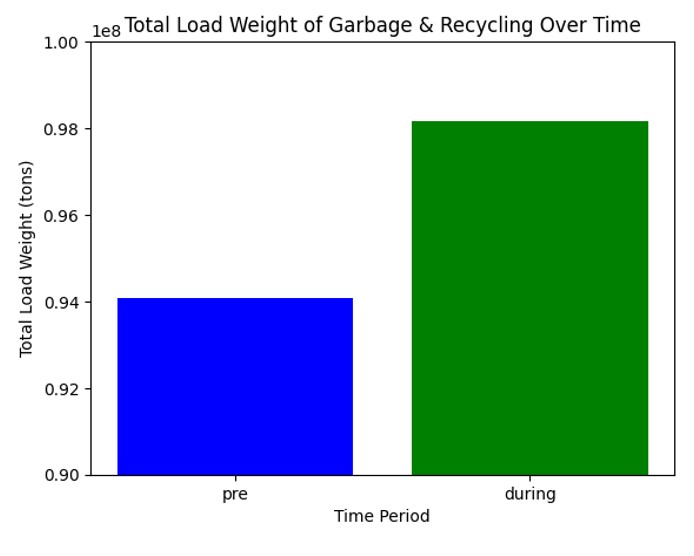
Across both NYC and Austin, waste collection patterns varied during the pandemic. In NYC, average monthly recycling collection increased from approximately 25,616 tons pre-COVID to 27,371 tons during COVID. However, this difference was not statistically significant (t = -0.623, p = 0.57). Garbage collection in NYC also rose slightly, from 198,665 tons to 202,726 tons, but the change was not significant (t = -0.245, p = 0.82). In Austin, daily combined waste loads (garbage and recycling) increased from an average of 1.22 million pounds pre-COVID to 1.40 million pounds during COVID. This difference approached statistical significance (t = -1.738, p = 0.084), suggesting a possible—but inconclusive—pandemic-related impact on household waste generation. The results of these tests are summarized in Table 1, which compares pre-, during-, and post-COVID waste levels in NYC and Austin to evaluate statistical significance.
| City | Data Type | Time Periods Compared | Mean Difference | t-value | p-value | Interpretation |
| NYC | Recycling (monthly) | Pre-COVID vs. During COVID | +1,755 tons | -0.623 | 0.57 | Not statistically significant |
| NYC | Garbage (monthly) | Pre-COVID vs. During COVID | +4,061 tons | -0.245 | 0.82 | Not statistically significant |
| Austin | Combined waste (daily) | Pre-COVID vs. During COVID | +180,000 lbs | -1.738 | 0.084 | Marginal trend; not statistically significant |
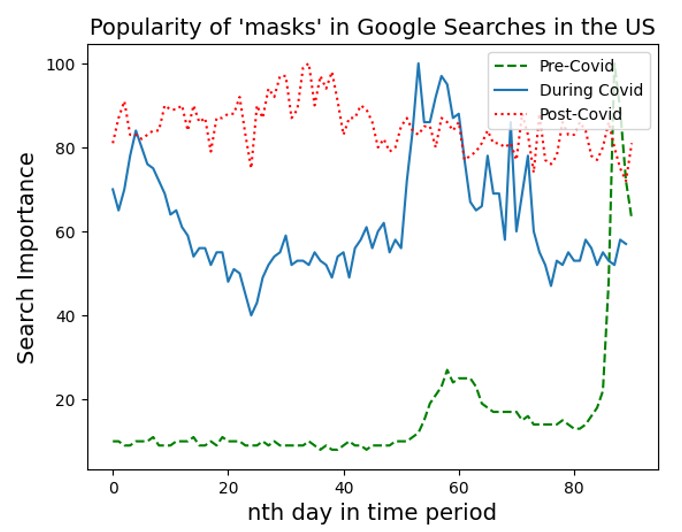
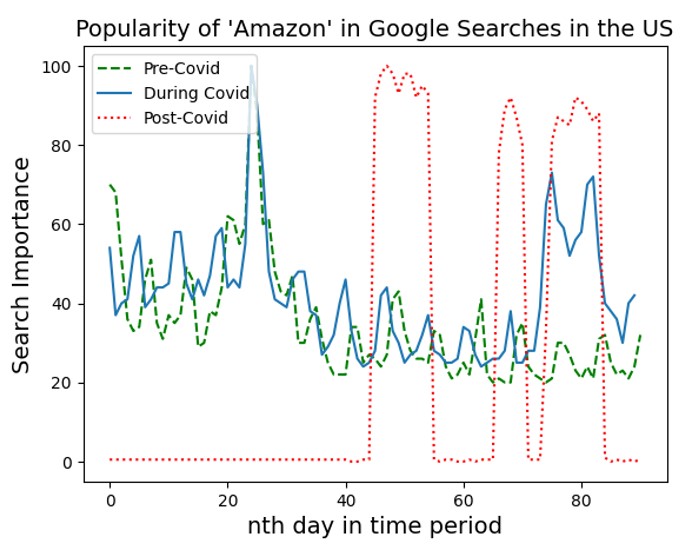
Figure 4 illustrates that the term “masks” was more frequently searched on Google during COVID, in comparison to pre-COVID. The popularity of this term remained high and even increased post-COVID. Figure 5 shows that search interest in the term “Amazon” increased during COVID, with there being times when the search importance of this term remained high after the pandemic. Another interesting observation to note regarding Figure 5 is that the 25th day in the time period, which is Christmas (December 25), is when the word “Amazon” has the highest search importance.
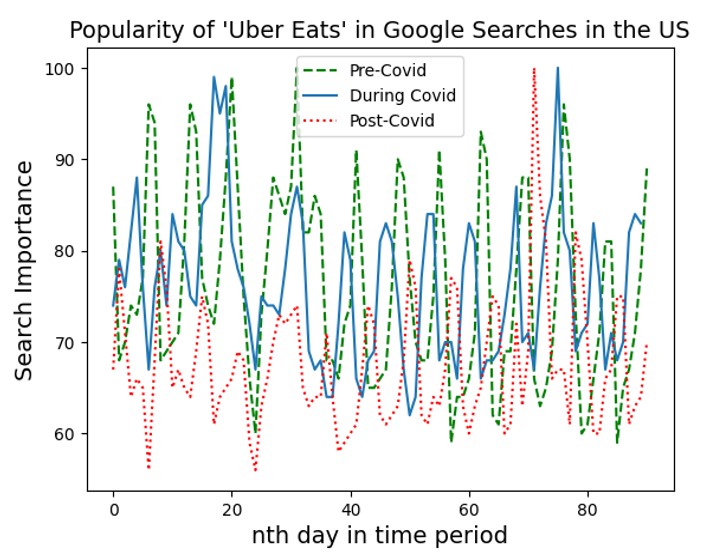
Figure 6 demonstrates that the search importance in Google for the word “eBay” increased during COVID, and slightly even more post-COVID. In Figure 7, we can see that the popularity of the search term “Instacart” increased significantly during COVID, and at times, increased post-COVID. This suggests that interest in online grocery delivery increased during the pandemic, which may reflect a shift in consumer behavior that potentially contributed to more packaging-related waste. Figure 8 reveals that the search importance of “DoorDash” actually decreased during COVID, and decreased further post-COVID. Figure 9 shows that the search importance of the term “Uber Eats” was relatively similar pre-COVID and during COVID, however, it decreased post-COVID.
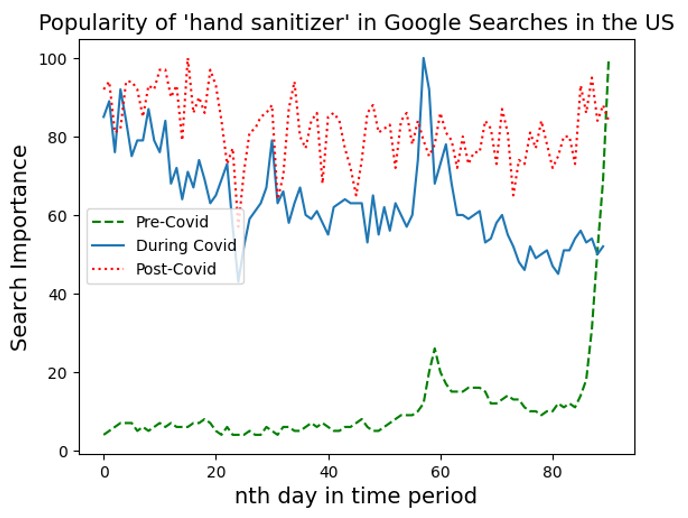
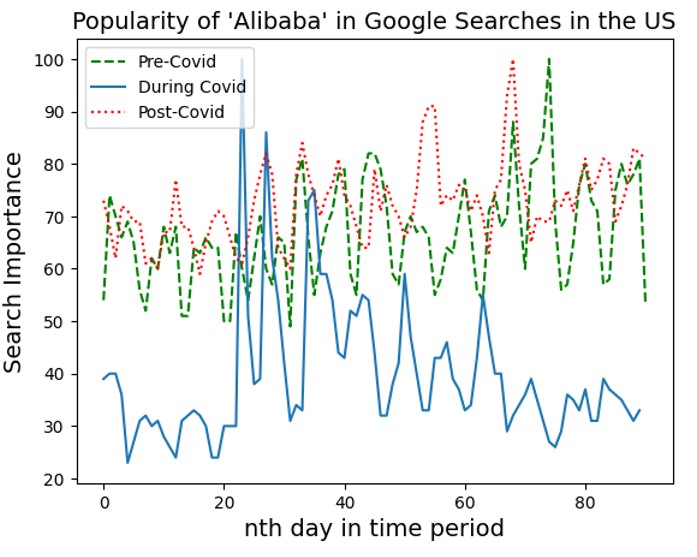
In Figure 10, we can see that the popularity for the search term “hand sanitizer” substantially increased during COVID, and increased even further post-COVID. This suggests a growing public interest in hand sanitizer since the pandemic, which may reflect increased purchasing and, indirectly, a rise in packaging-related plastic use. Finally, Figure 11 indicates a decrease in search importance for “Alibaba” during COVID, and then an increase post-COVID. Several of these graphs point to potential increases in packaging-related waste since the pandemic, though this study does not directly measure plastic consumption.


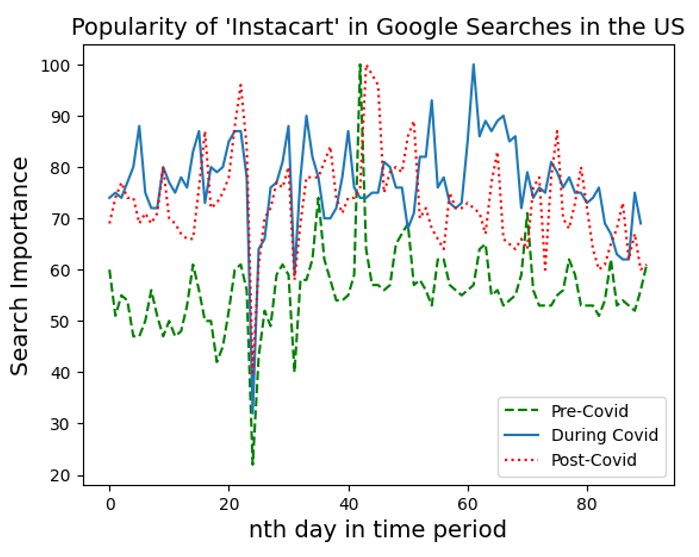
Instacart from Dec 2019 to Feb 2024. Popularity is scaled from 0 to 100, where 100 represents the term’s peak interest during the selected time frame.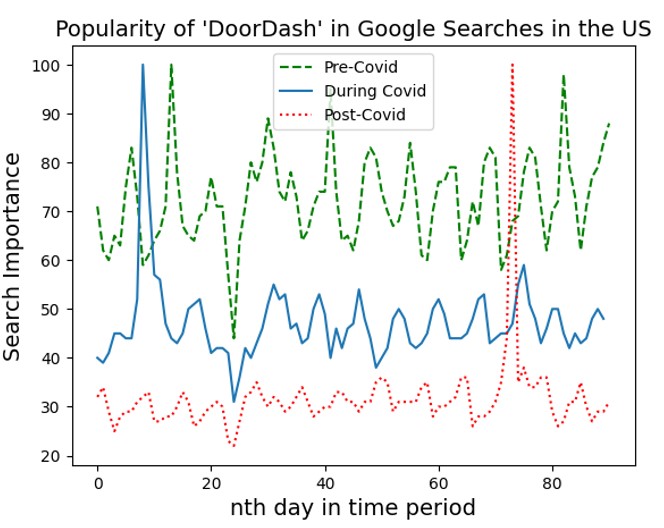
Discussion
As a result of my research, I observed that the increase in online shopping during COVID-19 was likely associated with changes in consumer behavior, particularly in waste generation patterns. It is also possible that observed increases were partially influenced by natural year-over-year growth in e-commerce, rather than being solely driven by the pandemic. Even today, people online shop more regularly than they did prior to COVID. Studies have found that online shopping tends to generate more plastic waste than traditional retail shopping. This increase in online shopping may have contributed to more orders and deliveries, potentially leading to more plastic packaging waste, though additional data would be needed to confirm this link. Table 1 summarizes statistical results comparing waste levels across COVID periods to assess support for the hypotheses.
The majority of the results support both my hypotheses. However, there are a few sets of results that either only support H1 or only support H2. There are also some graphs that do not agree with either of my hypotheses. Some factors that influenced whether or not certain search terms met my hypotheses include where the services are located and where the terms/services are most popular. For instance, Alibaba is based in China, which explains why its search popularity decreased during the pandemic. Racism may be the reason for the drop in search interest for Alibaba during the pandemic. Additionally, DoorDash was found to be most popular in San Francisco, California11. It is possible that the popularity of DoorDash has significantly decreased over the years, as shown in Figure 8, due to people moving out of the city and not returning to work.
Future research could expand on these findings by examining other geographic areas, further exploring alternative packaging, or developing models to predict long-term trends in plastic consumption.
Limitations
Despite these results, there are several limitations to this study. First, the recycling datasets used include multiple materials beyond plastic—such as metal, glass, and beverage cartons—making it difficult to isolate plastic-specific trends. While recyclable waste patterns may suggest plastic-related changes, they cannot be interpreted as direct measures of plastic pollution. Additionally, not all plastic is recyclable, and data specifically measuring plastic waste was largely unavailable. As a result, I relied on publicly available municipal data and Google Trends as proxies.
Google Trends reflects search interest rather than actual purchasing behavior or plastic use. Search activity can occur for informational reasons and may not translate directly into consumer actions or waste generation. Although useful for tracking public attention, search frequency alone is not a direct indicator of plastic consumption. Future studies should consider pairing search interest with shipping or sales data to strengthen conclusions.
There are also limitations related to the datasets themselves. Austin’s data only extended through July 2021, preventing analysis of post-pandemic trends for that city. NYC and Austin also report waste data at different time intervals—monthly and daily, respectively—which may introduce inconsistencies when comparing trends. Furthermore, this study focuses only on two cities, which differ in population size, recycling programs, and demographics. While these case studies provide valuable insight, the findings are not generalizable to the entire United States.
Several broader factors may have influenced waste trends independently of the pandemic. The three-year gap between the during-COVID and post-COVID periods introduces potential confounding factors such as inflation, supply chain shifts, and economic recovery. While seasonal effects were controlled by comparing the same months across different years, this study does not account for underlying year-over-year growth in online shopping that predated the pandemic. Additionally, changes in local recycling policies or infrastructure, population migration, remote work, or packaging innovations may have impacted waste patterns. Future studies should investigate municipal policy shifts when interpreting trends in waste generation. This study identifies correlations, not causation, and further research is needed to establish more direct links between online shopping and plastic waste generation.
This study highlights the impact of the COVID-19 pandemic on plastic pollution in the U.S., as evidenced by both recycling data from New York City and Austin, Texas, and search interest trends in Google. The analysis revealed that increased online shopping and home delivery during the pandemic were associated with rising levels of plastic-related waste, as observed in the NYC data. Since Austin data did not extend into the post-COVID period, findings about long-term trends are based on NYC alone. Even as the pandemic subsided, our reliance on online shopping has persisted, indicating that the habits formed during COVID-19 have long-lasting environmental implications.
The results highlight the urgent need for sustainable practices in both consumer behavior and packaging waste management. As the research shows, the shift to online shopping created a reliance on plastic packaging that may not disappear unless addressed by policy changes, increased consumer awareness, and innovation in packaging materials. By explaining these connections, this research emphasizes the importance of implementing more responsible consumption habits and sustainable waste solutions.
These findings highlight the need for improved tracking systems and policy responses to reduce plastic waste. This study contributes to a broader understanding of how behavioral patterns, local waste systems, and open data can be used to explore environmental impacts in a post-pandemic context. Future research could apply this framework to additional cities or countries using open-source datasets. Incorporating more granular packaging data, delivery volumes, or plastic-specific waste tracking would improve accuracy and strengthen conclusions.
Methods
Selecting Time Frames
I selected time frames for the pre-, during-, and post-COVID periods based on mortality peaks reported by multiple sources to ensure accuracy. I decided on my during-COVID time frame because, according to PBS, there were 3.465 million deaths in 2021, which was 80,000 more than 2020’s record-setting total12. December 2020 to February 2021 had particularly high COVID-19 mortality rates13. With this information, I used the same months for all three time periods and chose different years to eliminate the variables of seasonal shopping patterns. While the time gap between the ‘during COVID’ and ‘post-COVID’ periods spans over two years, this decision was made to reflect a period after major pandemic disruptions had subsided and to allow for meaningful post-pandemic behavioral trends to emerge. The final time frames I ended up choosing were the following: pre-COVID: December 1, 2019–February 29, 2020; during COVID: December 1, 2020–February 28, 2021; post-COVID: December 1, 2023–February 29, 2024.
Google Trends Data
For my research, I used Google Trends to examine changes in the relative popularity of various search terms across three time periods14. Google Trends does not provide raw search volume; instead, it normalizes search interest on a scale from 0 to 100, where 100 represents peak popularity within the selected time frame. This means that a score of 100 only indicates the term’s relative peak during the selected period, not an absolute comparison across terms or locations. I used this normalized data to compare patterns in search interest, not absolute numbers. To identify search terms likely associated with online shopping behavior, I examined the most popular online shopping websites and search terms15,16. I also used terms that would have been commonly searched for during COVID17. The terms and ways in which they were selected are shown in Table 2. This provided me with a clearer understanding of the interest in online shopping at these varying time periods. This analysis does not assume a direct link between search interest and plastic consumption. Rather, search interest is used as a general indicator of public attention that may reflect broader shifts in behavior. This is an observational approach where I analyzed publicly available search data without manipulating any of the variables.
Data Analysis Using Python
For the Google Trends data analysis, I used Pandas, a Python coding library. I wrote several lines of code and created graphs to show how often a specific term was being searched during different time periods. All three time periods are displayed on one graph, along with a key. These graphs make it easier to truly see the pattern of these searches and how popular they were at specific times.
| Search Term | Rationale |
| Amazon | Top starting point for online searches; significant contributor to packaging waste. |
| Instacart | Major food delivery platform; increased plastic packaging during and after COVID18. |
| eBay | Popular resale site; often ships secondhand items in new plastic packaging. |
| Alibaba | Popular international e-commerce platform; goods often arrive with heavy packaging. |
| Doordash | Major food delivery service; increased food deliveries during and since COVID |
| Uber Eats | Major food delivery service; increased food deliveries during and since COVID |
| Toilet paper* | High-demand product during COVID; often sold in plastic packaging. |
| Hand sanitizer | Top-selling hygiene item, especially during COVID; commonly packaged in single-use plastic bottles. |
| Masks | Widely used during COVID; typically contain synthetic plastic fibers19. |
Open Data about Waste from New York City and Austin, Texas
I examined two different cities (New York City and Austin, Texas) and their available Open Data to gain access to data about their plastic consumption20,21. I selected New York City and Austin as case study cities because both offer publicly available, detailed waste collection data. NYC is the most populous city in the U.S. with over 8 million residents and a long-established municipal recycling program22. Austin, with a population of nearly 1 million, has an aggressive “zero waste” policy and a strong culture of environmental accountability23. Including two cities with differing sizes, geographic regions, and policy approaches allows for a broader view of urban waste trends, though results may not be fully generalizable to rural or international contexts. For New York City, the data is stored monthly for each type of waste. The data stores the tons of recyclable metal, glass, plastic, and beverage cartons in New York City, as well as the tons of garbage. The datasets were pre-processed to include only the relevant cities and time periods. I used Python’s Pandas library to group the data by time period and visualize trends using graphs. These graphs formed the basis for my conclusions and comparisons. Waste levels were compared based on monthly totals for NYC and daily totals for Austin. The Austin dataset stores the daily amount of waste collection based on garbage or recycling. For both cities, the recycling was single-streamed, meaning that all the recyclable materials were combined. I then extracted data for the defined time periods (pre-, during-, and post-COVID) and calculated total and average waste values. The Austin dataset only contained information regarding the pre-COVID and during COVID time periods. For NYC, I used the reported monthly totals for garbage and recycling. For Austin, the dataset contained daily values for combined garbage and recycling loads. I filtered the Austin data to include only entries from the defined pre- and during-COVID periods and calculated the arithmetic mean for each time period. To account for any days with missing data, I computed the average based on the available number of valid entries within each period (e.g., 70–77 days).
Statistical Tests and Analysis
To assess whether changes in waste collection were statistically significant, I performed independent two-sample t-tests comparing pre-COVID and during-COVID periods. These tests were applied to NYC monthly garbage and recycling totals and to Austin’s daily combined garbage and recycling loads. The NYC data included three months per period; the Austin data included 70–77 daily entries per period. A significance level of p < 0.05 was used.
Acknowledgments
I would like to thank my mentor, Alex Cabral, for her invaluable guidance, particularly in helping me navigate the data analysis process. Her expertise and support were instrumental throughout the course of this project. I am also thankful for the continued encouragement and support from my family during this journey.
References
- United States Census Bureau. E-Commerce Sales Surged During the Pandemic. https://www.census.gov/library/stories/2022/04/ecommerce-sales-surged-during-pandemic.html (2022). [↩]
- Statista. Coronavirus (COVID-19) impact on restaurant and food delivery in the U.S. https://www.statista.com/topics/9996/coronavirus-covid-19-impact-on-restaurant-food-delivery-in-the-us/#statisticChapter (2023). [↩]
- Oceana. The cost of Amazon’s plastic denial. https://oceana.org/reports/the-cost-of-amazons-plastic-denial/ (2022). [↩]
- A. North. Online shopping has boomed in the pandemic. But what about all the packaging? Vox. https://www.vox.com/the-goods/22214017/online-shopping-pandemic-packaging-ecommerce-waste-plastic (2021). [↩]
- S. Hubbart. Reducing plastic pollution after the pandemic. NEEF. https://www.neefusa.org/story/climate-change/reducing-plastic-pollution-after-pandemic (2021). [↩]
- A. North. Online shopping has boomed in the pandemic. But what about all the packaging? https://www.vox.com/the-goods/22214017/online-shopping-pandemic-packaging-ecommerce-waste-plastic (2021). [↩]
- S. Phan, C. Luscombe. Recent trends in marine microplastic modeling and machine learning tools: Potential for long-term microplastic monitoring. AIP Publishing. 133, 2 (2023). [↩]
- A. L. Patrício Silva, J. C. Prata, T. R. Walker, A. C. Duarte, W. Ouyang, D. Barcelò, T. Rocha-Santos. Increased plastic pollution due to COVID-19 pandemic: Challenges and recommendations. Science Direct. 405, 126683 (2021). [↩]
- Y. Kim, J. Kang, H. Chun. Is online shopping packaging waste a threat to the environment? Science Direct. 214, 110398 (2022). [↩]
- W. Queiroz de Oliveira, H. M. Cordeiro de Azeredo, I. A. Neri-Numa, G. M. Pastore. Food packaging wastes amid the COVID-19 pandemic: Trends and challenges. Science Direct. 116, 1195-1199 (2021). [↩]
- Statista. Cities where DoorDash is the most used food delivery service in the United States as of April 2021. https://www.statista.com/statistics/916783/cities-where-doordash-is-the-most-used-food-delivery-service-us/ (2024). [↩]
- PBS NewsHour. COVID helped make 2021 the deadliest year in U.S. history. https://www.pbs.org/newshour/nation/covid-helped-make-2021-the-deadliest-year-in-u-s-history (2022). [↩]
- Centers for Disease Control and Prevention (CDC). Trends in United States COVID-19 deaths, emergency department (ED) visits, and test positivity by geographic area. https://covid.cdc.gov/covid-data-tracker/#trends_weeklydeaths_select_00 (2024). [↩]
- Google. Google Trends. https://trends.google.com/trends/ (2024). [↩]
- Flippa. The top 5 places people start their online shopping search. https://flippa.com/blog/the-top-5-places-people-start-their-online-shopping-search/ (2024). [↩]
- Statista. Most popular online shops in the U.S. as of March 2025. https://www.statista.com/forecasts/997230/most-popular-online-shops-in-the-us (2025). [↩]
- USA Today. 24 things that have been selling out online during the coronavirus pandemic. https://www.usatoday.com/story/tech/reviewedcom/2020/04/20/24-products-selling-out-online-due-coronavirus-pandemic-toilet-paper-cleaning-wipes-yeast-and-more/5161629002/ (2020). [↩]
- P. Meena, G. Kumar. Online food delivery companies’ performance and consumers expectations during Covid-19: An investigation using machine learning approach. PubMed Central. 68, 103052 (2022). [↩]
- S. Shukla, R. Khan, A. Saxena, S. Sekar. Microplastics from face masks: A potential hazard post Covid-19 pandemic. PubMed Central. 302, 134805 (2022). [↩]
- NYC Open Data. DSNY monthly tonnage data. https://data.cityofnewyork.us/City-Government/DSNY-Monthly-Tonnage-Data/ebb7-mvp5/about_data (2013). [↩]
- City of Austin. Waste collection & diversion report (daily). https://data.austintexas.gov/Utilities-and-City-Services/Waste-Collection-Diversion-Report-daily-/mbnu-4wq9/about_data (2015). [↩]
- Independent Budget Office (IBO). Ten years after: Assessing progress on the city’s solid waste management plan. https://ibo.nyc.ny.us/iboreports/ten-years-after-assessing-progress-on-the-citys-solid-waste-management-plan-2017.html (2017). [↩]
- United States Environmental Protection Agency (EPA). Zero Waste Case Study: Austin. https://www.epa.gov/transforming-waste-tool/case-study-austin (2024). [↩]


