
Abstract
In oncology clinical trials, treatment crossover has become increasingly common. While overall survival (OS) is typically analyzed using the intent-to-treat (ITT) principle to prevent selection bias between randomized arms, substantial crossover can bias estimates of treatment effect, as patients in both groups may ultimately receive the experimental therapy. To address this, the conventional two-stage method for adjusting crossover is widely used. However, this approach relies on strong assumptions about the parametric distribution of survival times, which may not always hold and can lead to biased results. This paper introduces an alternative two-stage method based on Restricted Mean Survival Time (RMST) to adjust for treatment crossover. In this approach, the acceleration factor is defined as the RMST ratio between patients who crossed over and those who did not, using data from progression to death. Unlike the conventional method, the RMST-based approach does not require assumptions about the underlying survival model. To evaluate its performance, the SHIVA01 trial was re-analyzed using both the conventional and RMST-based two-stage methods. The proposed RMST-based approach offers a viable alternative when there is concern about the model assumptions required in the conventional two-stage method.
keywords: 2-Stage Method, Crossover, Oncology Clinical Trials, Overall Survival, RMST
Introduction
An oncology clinical trial is a study designed to evaluate how well a new cancer treatment works compared to the current available treatment. It often uses randomization to assign patients to different treatment arms (groups), such as a test drug arm (the experimental treatment) and a control arm (the current treatment). The primary goal is typically to compare overall survival (OS)—how long patients live after treatment—between these groups.
In some cases, patients in the control group are allowed to switch to the test drug if their disease worsens, a process known as treatment crossover. Treatment crossover is more common when there is external evidence that the new treatment might be more efficacious than the current treatment1.
Figure 1 presents the CodeBreak 200 study in lung cancer. This study compared OS between the new treatment of Sotorasib and the standard-of-care treatment of Docetaxel. Treatment crossover was allowed in this clinical trial and refers to patients who were originally assigned to the docetaxel group (orange box) but were later permitted to switch to the sotorasib group (blue box). This is shown by the blue arrow labeled “Crossover” connecting the two treatment arms. These patients began with standard chemotherapy but were later given access to the investigational drug, often after they failed the chemotherapy with disease progression1.
In oncology trials, it is often considered unethical to deny crossover once the experimental drug shows benefit or becomes standard in other studies/a later treatment line. Crossover also encourages trial participation by offering patients in the control arm access to the promising treatment after they fail the current treatment. As a result, crossover is now common in oncology trials. For example, EMPOWER-Lung 1 and CodeBreaK 200 both allowed patients in the control arm to cross over to the experimental treatment1,2.
However, while ethically important, crossover can dilute the observed OS benefit by reducing the difference in overall survival between treatment groups when the experimental treatment does prolong OS. Since OS is typically analyzed based on the original treatment assignments (called the intent-to-treat (ITT) principle), this can underestimate how effective the new drug really is—especially if a large percent of patients in the control arm ended up receiving the test drug later. To address this, researchers use sensitivity analyses with statistical methods like the rank-preserving structural failure time model3, inverse probability of censoring weighting4, or the two-stage method5. In this research we will focus on the two-stage method (TSE) due to its simplicity compared with other methods. Stage one of the TSE method involves estimating the treatment effect of crossover or switching on post-crossover overall survival. Stage two involves using this estimated effect to derive counterfactual overall survival times for those who crossed over or switched treatments. An HR less than 1 using TSE suggests that the test drug reduces risk of death hence effective after adjusting for treatment crossover.
While the two-stage method is conceptually simple and easy to implement, it relies on strong assumptions like “no unmeasured confounding” to estimate the post-crossover treatment effect and is therefore rather sensitive to the chosen parametric model. Here in this research, we propose to use an alternative method called the RMST-Based 2-Stage Method. This proposed approach uses the Restricted Mean Survival Time (RMST) posttreatment crossover, which measures the area under the KM curve up to a fixed time point to estimate average overall survival for those who crossed over.
Conventional Simple 2-Stage Method
In Oncology clinical trials, patients usually are allowed to crossover or switch to other treatments at the time of progressive disease (PD) when current treatments have failed. Per Latimer et al. (2017), the simple 2-stage estimation method assumes that all patients are at a similar stage of progressive disease (PD) and the effect of the test treatment on extending the survival from PD to death can be estimated5. Specifically, the data after PD in the control arm can be treated as an observational dataset. By fitting an accelerated failure time (AFT) model (such as a Weibull model) to this data (excluding patients in the experimental arm) including covariates measured at the time of PD and a covariate indicating treatment crossover, the treatment effect received by patients who crossed over compared to patients who did not can be estimated. This method assumes there are “no unmeasured confounding” at PD that associate with crossover and patients cross over soon after PD. Counterfactual overall survival times for those who crossed over could then be obtained using
(1) 
where  represents the time spent on the control treatment, represents the time spent on the experimental treatment and
  is the treatment effect (i.e., acceleration factor) in the crossed over patients. It can be seen this method requires assumptions about the parametric distribution of survival times (e.g. Weibull).
The conventional simple 2-stage method is carried out as follows:
- Stage 1: Fit an AFT model to post-progression survival data to estimate the acceleration factor based on the patients who had PD in the control arm. Derive the counterfactual survival times for the control patients had there been no treatment crossover.
- Stage 2: Fit the Cox proportional hazards model to the observed survival times for the experimental arm and the counterfactual survival times for the control arm to obtain the hazard ratio estimate.
As Latimer et al. (2017) emphasize, this method depends heavily on the assumption that there is no unmeasured confounding5. To satisfy this, information on prognostic covariates—variables that independently affect survival and are related to switching—must be available at the point of progression disease (PD), which serves as the secondary baseline. Additionally, if patients switch treatments sometime after PD, the analysis must assume that no time-dependent confounding occurs in the interim. This is because the two-stage estimation (TSE) method only adjusts for differences between switchers and non-switchers at the secondary baseline, not beyond it. Latimer et al. (2020) further explored these issues, explaining how both unmeasured and time-dependent confounding can arise in crossover trials6. They also used Directed Acyclic Graphs (DAGs) to illustrate the potential bias from a causal inference perspective7.
Proposed RMST-Based 2-Stage Method
Restricted mean survival time quantifies the average overall survival time within a specific time window and can be easily estimated by the area under the Kaplan-Meier (KM) curve8. Therefore, RMST has been increasingly used in oncology clinical trials as a measure of treatment effect by RMST difference or RMST ratio due to its interpretability over HR9. As mentioned in Section 2, data after PD in the control arm can be treated as an observational dataset. Hence, RMST can be calculated for this dataset for patients who crossed over and patients who did not cross over, respectively. We propose to use the ratio of RMST for patients who crossed over versus RMST for those who did not as the acceleration factor used in Stage 1 of the conventional simple 2-stage method in Section 2.
The RMST-based 2-stage method is carried out as follows:
- Stage 1: Calculate RMST to post-PD survival data to estimate the acceleration factor (i.e., RMST ratio) based on the patients who had PD in the control arm. Derive the counterfactual survival times for the control patients had there been no treatment crossover.
- Stage 2: Fit the Cox proportional hazards model to the observed survival times for the experimental arm and the counterfactual survival times for the control arm to obtain the hazard ratio estimate.
Notably, the proposed RMST-based two-stage method simplifies the original TSE approach by eliminating model-based assumptions. However, like the TSE, it remains subject to the same assumptions regarding unmeasured confounding—assumptions that are often untestable3. The proposed method can also be extended to handle crossover in the experimental arm. This is done by restricting analysis to patients within that group and calculating the acceleration factor as the ratio of estimated RMST between switchers and non-switchers. Additionally, the RMST-based two-stage method requires a pre-specified restriction time τ which can influence the comparison of overall survival outcomes. A common approach is to set τ as the longest observed post-PD follow-up time.
Re-censoring in RMST-based 2-stage Method
Re-censoring is a critical consideration when analyzing overall survival (OS) data in the presence of treatment crossover. Most existing methods—including the proposed RMST-based two-stage approach—estimate counterfactual survival times for crossover patients. However, these counterfactual times can extend beyond the original censoring time, leading to informative censoring.
Re-censoring addresses this issue by truncating the counterfactual survival times, so they do not exceed recalculated censoring thresholds. While this technique is theoretically intended to reduce bias, its practical performance remains debated10. Latimer et al. (2019) investigated re-censoring across a range of scenarios varying in switch proportions, treatment effect magnitudes, time-dependent effects, survival curve shapes, disease severity, and switcher prognoses11. Latimer et al. (2014) also compared methods including RPSFTM, IPCW, and TSE12.
Their findings revealed a consistent trend: re-censored analyses tended to underestimate treatment effects (negative bias), whereas non-re-censored analyses generally overestimated them (positive bias). Given these opposing patterns, it is essential to conduct analyses both with and without re-censoring to ensure robustness and provide a more comprehensive interpretation of the treatment effect13.
Case Study
The publicly available dataset from the SHIVA01 study has been used as the case study to compare the conventional 2-stage TSE method and the proposed RMST-based 2-stage method14. SHIVA01 (NCT01771458) was a randomized trial to compare molecularly targeted therapy based on tumor molecular profiling (MTA) versus conventional therapy (CT) for advanced cancer. Crossover to the other arm was scheduled to occur at progressive disease for patients in both arms. The primary endpoint of the study was progression-free survival with HR (95% CI) of 0.88 (0.65, 1.19) published by Tourneau et al. (2015).
Analysis of Original Data
To assess the impact of crossover on both arms, OS of the SHIVA01 study was analyzed in R package “trtswitch” by the conventional 2-stage method15. The dataset has 100 patients on the MTA arm and 93 patients on the CT arm. Table 1 shows the basic statistics from the dataset used in this analysis using R version 4.5.1.
| Tumour Molecular Profiling | Conventional Therapy | ||
| Treatment Arms | (MTA) | (CT) | Total |
| Number of Patients | 100 | 93 | 193 |
| Number of Deaths | 67 | 63 | 130 |
| Number of Patients with PD | 83 | 83 | 166 |
| Number of Patients Who Crossed Over | 25 | 68 | 93 |
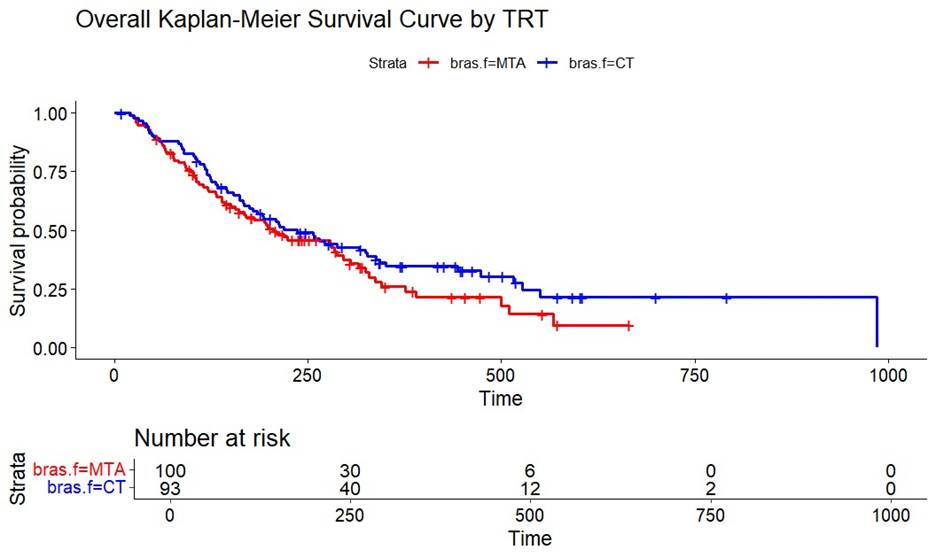
A higher percentage (73%) of patients in the CT arm crossed over to the MTA arm, compared to 25% of patients in the MTA arm. The ITT analysis of OS without adjustment of treatment crossover had HR (95% CI) of MTA versus CT of 1.27 (0.90, 1.81) after adjusting for the five baseline variables of age at randomization, sex, the number of previous lines of treatment, the Royal Marsden Hospital score segregated into two categories, and the
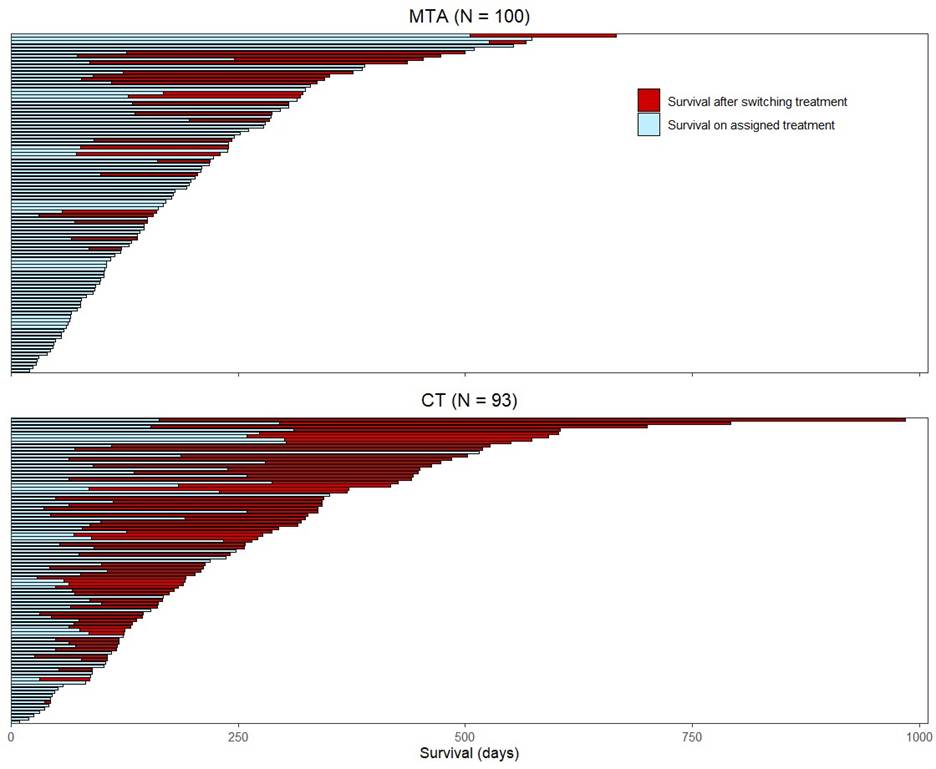
molecular pathway altered (i.e., the hormone receptors pathway, the PI3K/ AKT/mTOR pathway, and the RAF/MEK pathway). In Figure 2, the swimmer plot provides further details on the time of crossover for all patients. Each line represents the survival time for a patient and the red part represents the survival contribution post-crossover. Crossover rate accounted for 55% of the OS time for the CT arm and 22% for the MTA arm, thus indicating the CT arm might have benefited more from the crossover compared to the MTA arm. Figure 3 shows the OS Kaplan-Meier (KM) curve based on the original data. It appears that CT had better treatment effect compared to MTA based on analysis without crossover adjustment.
An analysis of the Time-to-Crossover (or, for non-switchers, Time-to-Progression) distributions by treatment arm suggests the presence of potential confounding, as the distributions are not fully comparable across groups.
In the control treatment (CT) arm, the median Time-to-Crossover for patients who switched was 63 days (Q1:52, Q3:134), while for those who did not switch, the median Time-to-PD was 64 days (Q1:35, Q3:117). In contrast, within the molecularly targeted agent (MTA) arm, the median Time-to-Crossover was 85 days (Q1:61, Q3:122) for crossover patients, compared to a median Time-to-PD of 70 days (Q1:55, Q3:119) for non-switchers. While these differences may indicate differences between crossover and non-crossover groups, it is important to interpret the findings with caution due to the small sample size of the study.
Analysis Using Conventional 2-Stage Method
Lu (2025) has compiled the function “tsesimp” in the R package of “trtswitch” to adjust crossover for the SHIVA01 data using the conventional 2-stage TSE method15. In Stage 1 of the analysis, we applied an accelerated failure time (AFT) model to estimate survival time from disease progression (PD) to death, with the primary covariate of interest being treatment crossover status. In addition to the five baseline covariates included in the primary model, we incorporated several time-updated covariates measured at the point of PD: ECOG performance status, concomitant treatments, and use of platelet transfusions. These variables were selected based on their potential influence on both the decision to cross over and subsequent overall survival following PD16. The AFT model was fit using a Weibull distribution, chosen for its flexibility in accommodating both increasing and decreasing hazard functions, depending on the value of its shape parameter.
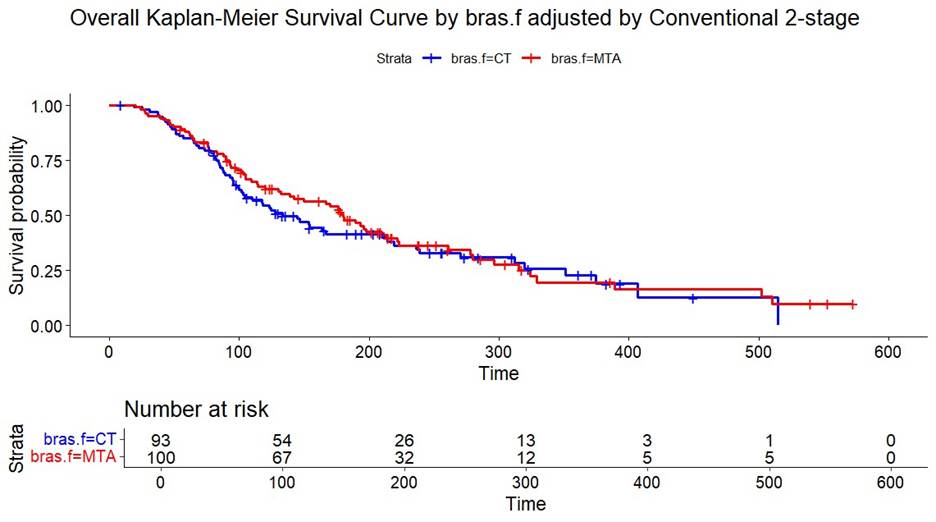
The acceleration factors of 3.12 and 2.67 for the CT arm and the MTA arm, respectively, were obtained. Figure 4 shows the KM curves after adjustment. In Stage 2, based on the counterfactual data, the proportional hazards model with adjustment of the five baseline variables generated HR (95% CI) of MTA versus CT of 0.86 (0.61, 1.22). These baseline variables were selected because of their potential prognostic effect on OS16. It appears that MTA had some trending treatment effect compared to CT after adjusting for crossover.
Analysis Using the proposed RMST-based 2-Stage Method
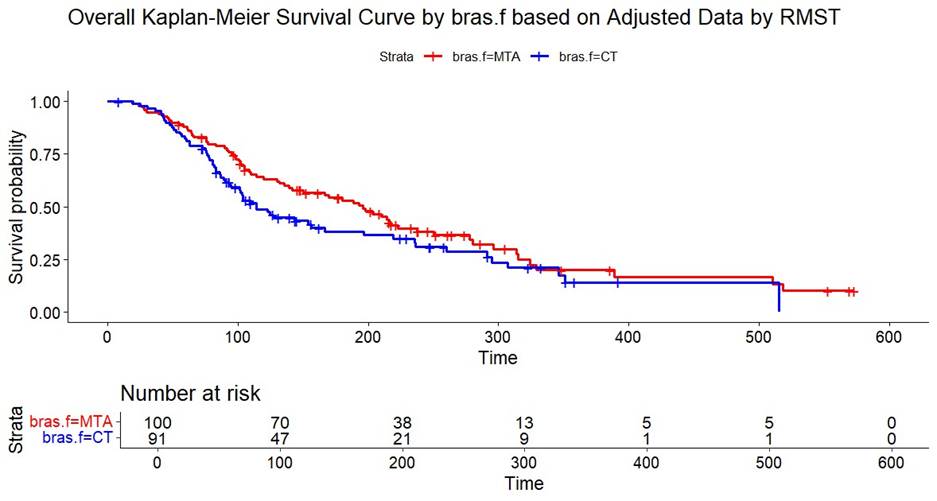
For the data from PD to death in both arms (control and treatment), we re-coded the categorical variables (treatment (braf), crossover (co), sex, and pathway) to numeric variables to use the R package survRM2 to calculate RMST17. For Stage 1 of the RMST analysis of the time from PD to death, covariates at the time of PD (including the ECOG performance status, the presence of concomitant treatments, and the use of platelet transfusions) were used in addition to the baseline variables mentioned above. Restriction time was defined as the maximum follow up time for this study across both arms18. We found in Table 2 the acceleration factors (i.e., RMST ratios) were 4.95 for the CT arm and 1.97 for the MTA arm. Figure 5 shows the KM curves after adjustment. In Stage 2, based on the counterfactual OS data, the Cox proportional hazards model with adjustment of the five baseline variables generated HR (95% CI) of MTA versus CT of 0.73 (0.51, 1.04). It appears that MTA had some trending treatment effect compared to CT after adjusting for crossover.
Alternative Restriction Times
In the above analysis, the restriction time was set as the maximum follow-up time observed in the study, a common practice in most analyses18,19. To assess the robustness of our findings, we conducted two sensitivity analyses using alternative restriction times:
- Set restriction time as 294 days, defined as the minimum of the maximum follow-up time post PD across crossover and non-crossover groups in both MTA and CT arms.
- Set restriction time as 250 days, a deliberately shorter time used to evaluate the potential impact of early truncation on OS estimates.
As shown in Table 3, the choice of restriction time meaningfully affects OS comparisons. Notably, shorter restriction times tend to produce more pessimistic survival outcomes.
| Original Analysis | Sensitivity 1 | Sensitivity 2 | |
| Analysis | HR (95% CI) | Restriction Time at 294 Days | Restriction Time at 250 Days |
| RMST-Based 2-Stage Method | 0.73 (0.51, 1.04) | 0.85 (0.59, 1.20) | 0.87 (0.61, 1.24) |
Re-censoring for 2-Stage Methods
We conducted Re-censoring analyses to assess whether results would differ for both RMST-based and TSE methods. For simplicity, the acceleration factors in Table 2 were applied to calculate the re-censoring times. As summarized in Table 4, the RMST-based 2-Stage method appeared to be more sensitive to re-censoring than the TSE method. However, due to the limited sample size of the SHIVA01 dataset, it is challenging to draw definitive conclusions or identify the precise reasons for this discrepancy. Further investigation in larger datasets may help clarify the impact of re-censoring across methods20,21.
| Without Re-censoring | Re-censoring | |
| Analysis | HR (95% CI) | HR (95% CI) |
| Conventional TSE 2- Stage Method | 0.86 (0.61, 1.22) | 0.88 (0.61, 1.25) |
| RMST-Based 2-Stage Method | 0.73 (0.51, 1.04) | 0.65 (0.45, 0.95) |
Conclusion
Treatment crossover in oncology clinical trials is common. Statistical analyses without adjusting for crossover can often underestimate the true treatment effect for the experimental or test drug. To handle crossover, the conventional 2-stage TSE method is broadly used, but may generate a biased estimate if the assumption of the parametric distribution of survival times is not appropriate. This paper proposes the RMST-based 2-stage method to adjust treatment crossover, where the acceleration factor is defined as the RMST ratio between patients who crossed over and patients who did not crossover based on data from progressive disease to death. This proposed method does not have assumptions for OS when calculating the crossover acceleration factors.
The case study that aimed at evaluating the benefit of therapy based on tumor molecular profiling for advanced cancers (SHIVA01) has been analyzed by the ITT method, the conventional simple 2-stage method, and the proposed RMST-based 2-stage method. The results from Section 4 are summarized in Table 2. The proposed RMST-based 2-stage method can be used as an alternative method if there are concerns about model assumptions in the simple 2-stage method22.
There is one limitation in the case study, as our data had only 15 patients in the CT arm who had PD and did not cross over. The RMST ratio based on data from a small
number of patients could be unreliable. Although we conducted sensitivity analyses using different OS restriction times and incorporated re-censoring adjustments, the results proved challenging to interpret—likely due to the limited sample size and data variability. The primary goal of this paper was to propose and illustrate the application of the RMST-based 2-Stage method using a single real-world case study. Future work will include a comprehensive simulation study to evaluate and compare the performance of various 2-Stage adjustment methods under a range of realistic crossover scenarios and confounding structures.
Acknowledgement
Thank you for the guidance of Dr. Shufang Liu from Gilead Sciences in the creation of this research paper.
References
- de Langen, Adrianus Johannes et al. Sotorasib versus docetaxel for previously treated non-small-cell lung cancer with KRASG12C mutation: a randomised, open-label, phase 3 trial. The Lancet, Volume 401, Issue 10378, pp. 733–746, 2023 [↩] [↩] [↩]
- Özgüroğlu, Mustafa et al. First-line cemiplimab monotherapy and continued cemiplimab¨ beyond progression plus chemotherapy for advanced non-small-cell lung cancer with PDL1 50% or more (EMPOWER-Lung 1): 35-month follow-up from a multicentre, openlabel, randomised, phase 3 trial. The Lancet Oncology, Volume 24, Issue 9, pp. 989–1001, 2023 [↩]
- Robins, J. M., and Tsiatis, A. A. Correcting for non-compliance in randomized trials using rank preserving structural failure time models. Communications in Statistics, 1991; 20(8): 2609–2631 [↩] [↩]
- Robins, J. M., and Finkelstein, D. M. Correcting for noncompliance and dependent censoring in an AIDS clinical trial with inverse probability of censoring weighted (IPCW) log-rank tests. Biometrics, 2000; 56: 779–788 [↩]
- Latimer, N. R., Abrams, K. R., et al. Adjusting for treatment switching in randomised controlled trials – A simulation study and a simplified two-stage method. Statistical Methods in Medical Research, 2017; 26(2): 724–751 [↩] [↩] [↩]
- Latimer N, White I, Tilling K, Siebert U. Improved two-stage estimation to adjust for treatment switching in randomised trials: g-estimation to address time-dependent confounding. Statistical Methods in Medical Research. 2020;29(10):2900-2918. doi:10.1177/0962280220912524 [↩]
- Digitale JC, Martin JN, Glymour MM. Tutorial on directed acyclic graphs. J Clin Epidemiol. 2022 Feb;142:264-267. doi: 10.1016/j.jclinepi.2021.08.001. Epub 2021 Aug 8. PMID: 34371103; PMCID: PMC8821727 [↩]
- Uno, H., Claggett, B., Tian, L., et al. Moving beyond the hazard ratio in quantifying the between-group difference in survival analysis. Journal of Clinical Oncology, 2014; 32(22): 2380–2385 [↩]
- Latimer NR, Abrams KR, Lambert PC, et al. Assessing methods for dealing with treatment switching in clinical trials: a follow-up simulation study. Stat Meth Med Res 2018; 27: 765–784 [↩]
- Latimer NR, White IR, Abrams KR, Siebert U. Causal inference for long-term survival in randomised trials with treatment switching: Should re-censoring be applied when estimating counterfactual survival times? Stat Methods Med Res. 2019 Aug;28(8):2475-2493. doi: 10.1177/0962280218780856. Epub 2018 Jun 25. PMID: 29940824; PMCID: PMC6676341 [↩]
- Latimer NR, Abrams KR, Siebert U. Two-stage estimation to adjust for treatment switching in randomised trials: a simulation study investigating the use of inverse probability weighting instead of re-censoring. BMC Med Res Methodol. 2019 Mar 29;19(1):69. doi: 10.1186/s12874-019-0709-9. PMID: 30935369; PMCID: PMC6444622 [↩]
- Latimer NR, Abrams KR, Lambert PC, et al. Adjusting Survival Time Estimates to Account for Treatment Switching in Randomized Controlled Trials—an Economic Evaluation Context: Methods, Limitations, and Recommendations. Medical Decision Making. 2014;34(3):387-402. doi:10.1177/0272989X13520192 [↩]
- Latimer NR, Dewdney A, Campioni M A cautionary tale: an evaluation of the performance of treatment switching adjustment methods in a real world case study. BMC Med Res Methodol 24, 17 (2024). https://doi.org/10.1186/s12874-024-02140-6 [↩]
- Le Tourneau, C., Delord, J. P., et al. Molecularly targeted therapy based on tumour molecular profiling versus conventional therapy for advanced cancer (SHIVA): a multicentre, open-label, proof-of-concept, randomised, controlled phase 2 trial. The Lancet Oncology, 2015; 16: 1324–1334 [↩]
- Lu, K. trtswitch: Treatment Switching. R package version 0.1.7, 2025. Available on CRAN [↩] [↩]
- Tian L, Zhao L, Wei LJ. Predicting the restricted mean event time with the subject’s baseline co variates in survival analysis. Biostatistics 2014, 15, 222-233. doi:10.1093/biostatistics/kxt050 [↩] [↩]
- Uno, H., Tian, L., Horiguchi, M., Cronin, A., Battioui, C., Bell, J. survRM2: Comparing Restricted Mean Survival Time. R package version 1.0-4, 2022. Available on CRAN [↩]
- White IR. Estimating treatment effects in randomized trials with treatment switching. Stat Med 2006; 25: 1619–1622 [↩] [↩]
- Latimer NR, Abrams K, Lambert P, et al. Adjusting for treatment switching in randomised controlled trials – A simulation study and a simplified two-stage method. Statistical Methods in Medical Research. 2014;26(2):724-751. doi:10.1177/0962280214557578 [↩]
- Sullivan TR, Latimer NR, Gray J, Sorich MJ, Salter AB, Karnon J. Adjusting for treatment switching in oncology trials: a systematic review and recommendations for reporting. Value in Health. 2020;23(3):388–96 [↩]
- Collet RJ, Ben ÂJ, Varga AN, van Leth F, El Alili M, Esser J, Bosmans JE, van Dongen JM. Statistical Methods to Adjust for Treatment Switching in Real-World Clinical Studies: A Scoping Review and Descriptive Comparison. Clin Pharmacol Ther. 2025 Jul 23. doi: 10.1002/cpt.70013. Epub ahead of print. PMID: 40698991 [↩]
- White IR and Goetghebeur EJT. Clinical trials comparing two treatment policies: which aspects of the treatment policies make a difference? Stat Med 1998; 17: 319–339 [↩]


