
Abstract
Background/Objective: To promote sustainability and reduce the carbon footprint of everyday actions, this project focuses on improving the recyclable content of household waste. Despite widespread awareness, individuals often struggle to determine whether a given item is recyclable, particularly when waste items are cluttered together and often in deformed states. This study aims to address this gap by developing an AI-driven tool for more accurate waste classification.
Methods: A two-step AI-based approach was implemented, integrating Vision Transformers (ViTs) for image segmentation and Convolutional Neural Networks (CNNs) for classification. The segmentation model was trained on 4500 waste images with different levels of diversity and complexity. Transfer learning image classification model VGG16, enhanced with five additional layers, was trained on 22,500 images of organic and recyclable objects. An optimal learning rate of 0.01 was used for stability and convergence.
Results: The classification model achieved a training accuracy of 93% and demonstrated strong performance on a test set of 2,511 images, achieving an F1 score of 83%. The model was deployed in a secure web application, RecycleBot, and successfully tested on real-world field images, validating its ability to improve the accuracy of recyclable object identification.
Conclusions: The developed AI models show significant promise for automating waste management processes and enhancing recycling efforts. Future work can focus on expanding the dataset and refining classification across broader waste categories.
Keywords: Sustainability; Waste Classification; Vision Transformers; Convolutional Neural Networks; Recycling Automation
Introduction
Background and Context
The rapid increase in disposable goods across various industries has led to a significant rise in municipal solid waste (MSW), presenting numerous environmental challenges. In 2018, the United States generated approximately 292.4 million tons of MSW, averaging about 4.9 pounds per person per day. This waste stream includes everyday items such as packaging materials, food scraps, furniture, and electronics, encompassing both hazardous and non-hazardous materials. Effective management of MSW is crucial to maintaining ecological balance, which has been increasingly disrupted over the past few decades1.
Recycling is an important mechanism to improve the sustainability of our ecosystem and despite increased awareness, only 13% of trash is currently recycled on the global level. Globally, 400 million tons of` plastic waste is produced annually. In the US only 6% of 40 million tons of plastics produced are recycled. Specifically, 85% of plastic packaging goes to landfill. In the US between 2019 and 2020, plastics recycling decreased by 5.7%2.
In addition to preventing pollution, recycling helps in preserving natural resources, saves energy, and protects the environment and human health, e.g. it takes 95% less energy to recycle aluminum than it does to make it from raw materials. As a leading example, Sweden only puts 1% of its waste in the landfill and recycles rest into reuse and generating energy. The rest of the world is lagging significantly in recycling metrics3.
Problem Statement and Rationale
A major obstacle in waste management is the widespread confusion about which items are recyclable. This uncertainty leads to improper disposal, where recyclable materials are often mixed with non-recyclables, complicating the recycling process. Such contamination can result in entire batches of recyclables being diverted to landfills, thereby diminishing the efficiency of recycling efforts. Improper separation not only causes the loss of valuable materials but also places an additional burden on sustainability initiatives. In real-world settings, waste items are often mixed, deformed, or partially obscured, making manual classification both challenging and error prone. When waste is excessively mixed, the recycling process becomes less efficient and more labor-intensive, diluting the recovery of precious materials.
Furthermore, the overaccumulation of waste in landfills poses significant environmental hazards. Hazardous chemicals can leach into groundwater, and the decomposition of organic materials produces methane—a potent greenhouse gas contributing to climate change. Implementing comprehensive waste classification practices can significantly reduce greenhouse gas emissions. For instance, adopting effective waste management and recycling solutions worldwide could lower emissions by between 2.1 and 2.8 billion tons of CO₂ per year by 2030, accounting for around 5% of global GHG emissions2.
Addressing these challenges requires a multifaceted approach. Educating and empowering consumers on proper recycling practices and tools can reduce confusion and improve waste separation at the source. Implementing advanced sorting technologies can efficiently separate mixed waste, recovering valuable materials and reducing contamination. By adopting these strategies, we can enhance the efficiency of recycling programs, conserve resources, and mitigate the environmental impacts associated with improper waste management. The challenge is not new; however, the opportunity is to leverage emerging technologies to address this4.
Although AI applications have been successfully deployed across various industries, their integration into everyday recycling practices remains limited. Current solutions often fall short when faced with cluttered or degraded visual inputs. Addressing this problem is critical to improving recycling efficiency and, by extension, reducing environmental harm. This project aims to fill this gap by developing a robust AI-driven system capable of accurately distinguishing recyclable items from organic waste in complex real-world scenarios.
Significance and Purpose
This research contributes to the growing field of sustainable technology by demonstrating the practical application of AI in household waste management. The system developed — RecycleBot — offers a scalable, accessible tool for improving individual recycling efforts. Beyond individual use, the underlying models have potential applications in municipal recycling programs, industrial waste sorting, and educational initiatives aimed at promoting environmental responsibility.
Theoretical Framework
Artificial Intelligence (AI) has the potential of revolutionizing waste management by enhancing efficiency, accuracy, and sustainability5,6. Traditional waste sorting methods often face challenges such as contamination and inefficiency, leading to increased landfill usage and environmental harm. AI addresses these issues by automating and optimizing waste processing. AI-powered systems can accurately identify and separate various waste materials, reducing contamination and increasing recycling rates. This automation not only improves operational efficiency but also minimizes human error and exposure to hazardous materials. Additionally, AI can predict waste generation patterns, enabling more efficient scheduling and routing of collection vehicles, thereby lowering operational costs and environmental impact7.
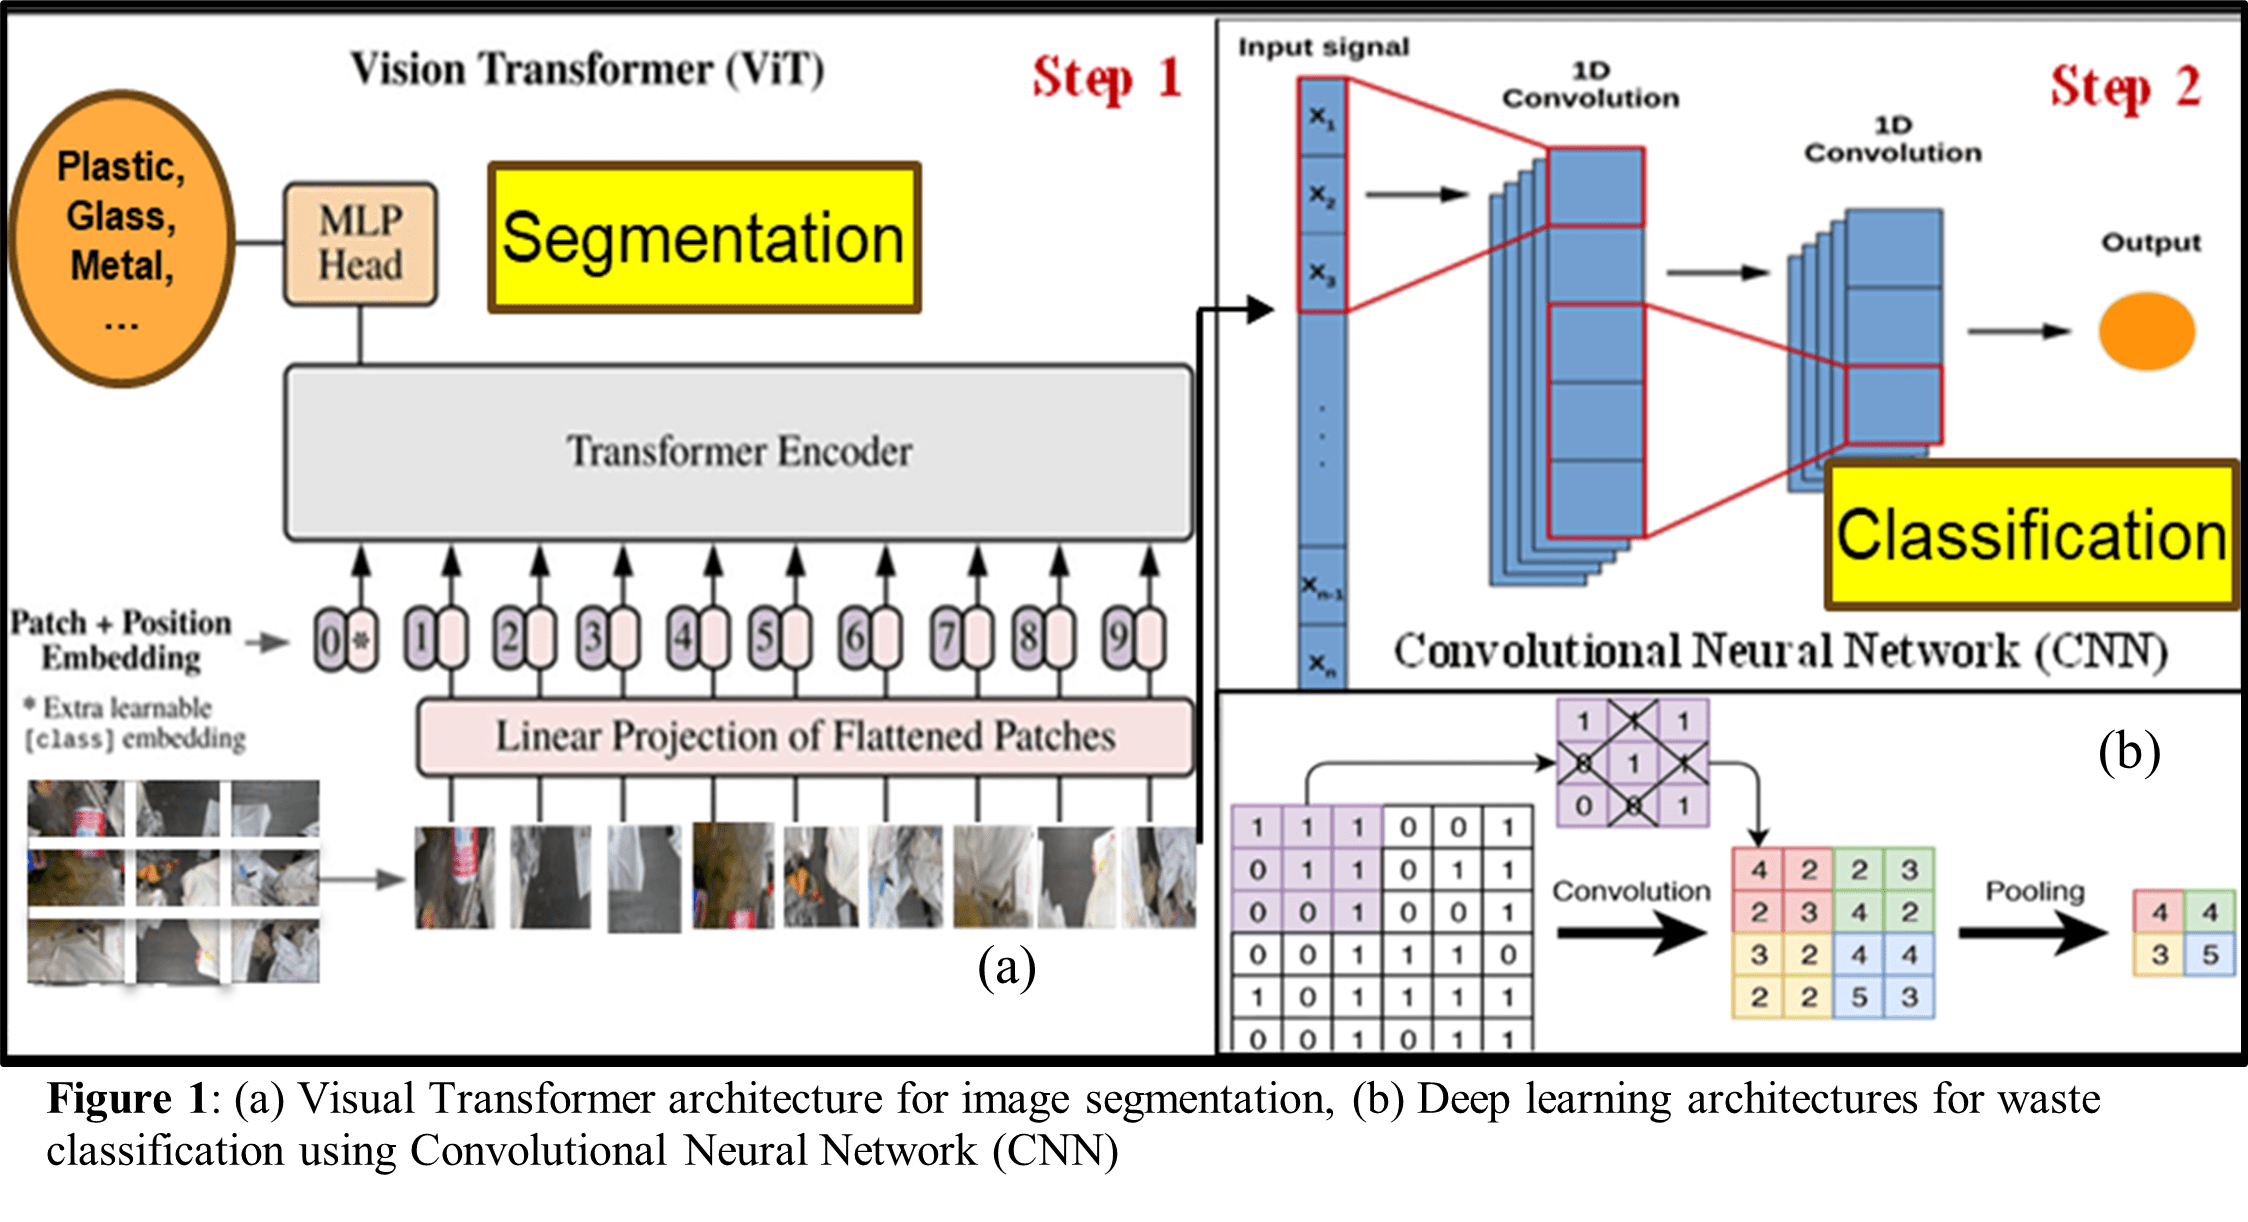
For image segmentation, Vision Transformers (ViT) offer a novel approach by dividing an image into a grid of equal-sized patches, like cutting a picture into puzzle pieces. Each patch is then transformed into a numerical representation, capturing its essential information8. The ViT processes these patches simultaneously, assessing the relationships and patterns between them to comprehend local details and the broader context of an image, enabling the recognition of complex patterns and structures (Fig. 1 (a)). This process of semantic segmentation, classifying each pixel or region of image to a particular waste category, is essential for robust waste classification9.
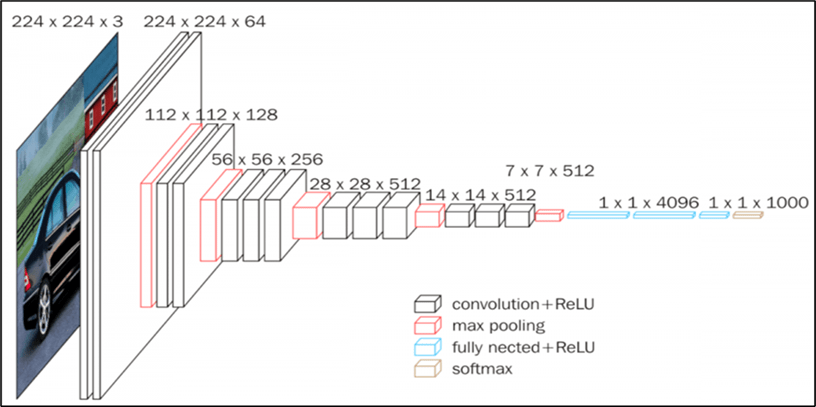
For waste classification, a computer vision approach called Convolutional Neural Network (CNN) is applied10. A CNN is a type of artificial intelligence designed to process visual information, much like the human brain interprets images. By training these networks on extensive datasets, AI systems learn to recognize and categorize materials such as plastics, metals, glass, and paper. CNN models contain many layers of neurons (combinations of variables and image features) used for building correlations. Each of the convolution layers acts as a specific filter applied to generate a feature map, extracting distinct characteristics or qualities of the original image (Fig. 1 (b)). CNN models rely on large amounts of training data to achieve high classification accuracies. However, datasets of this scale are not always available for waste classification. In such situations, transfer learning techniques have been employed to achieve higher prediction F1 score. Transfer learning is a class of deep learning techniques in which a CNN model trained on a different large dataset is used as a starting model. For instance, the VGG16 algorithm, trained on the ImageNet dataset containing images of fixed size of 224×224 pixels with RGB channels, has been explored for this purpose. Studies have shown that models like VGG16 can achieve high F1 score in classifying various types of trash objects (Fig. 2).
By integrating these advanced AI techniques, waste management systems can become more efficient, accurate, and sustainable, significantly contributing to environmental conservation efforts.
Objectives
The primary focus of this research study is to evaluate the effectiveness of the machine learning models in identifying and classifying trash items under real-world complex situations and optimize the accuracy of the classification by adjusting training parameters. Key objectives of this study are:
- To develop an AI-based system capable of classifying waste items into recyclable and organic categories.
- To implement and evaluate a two-step deep learning pipeline combining Vision Transformers for segmentation and CNNs for classification.
- To assess the real-world performance of the system using field images beyond the training dataset.
- To demonstrate the potential of AI-driven tools in supporting broader environmental sustainability goals.
This research introduces a novel two-step AI-driven approach for waste classification, integrating Vision Transformers (ViTs) for image segmentation and Convolutional Neural Networks (CNNs) for classification. By leveraging the strengths of both architectures, the proposed method aims to enhance the F1 score and robustness of automated waste detection in real-world settings. The best-in-class model will be implemented in an interactive web app that can be used by everyone at the point of disposal.
Key research questions addressed in this work are (1) How effective is the two-step ViT + CNN approach in detecting & classifying trash items? (2) What impact do algorithm parameters (e.g., learning rate, dropout fraction) and training cycles have on segmentation and classification F1 score?
Towards the goal of developing an AI-enabled waste classification system, current study hypothesizes: If the training data set is consistent, balanced and has sufficient diversity of features representing the different classes and varied levels of complexities, then combining ViT-based segmentation with CNN-based classification in terms of organic and recycle classes enhances overall F1 score by ensuring that only refined, segmented waste objects are classified, reducing misclassifications due to background clutter.
Scope and Limitations
This study focuses on the classification of waste items into two broad categories: recyclable and organic. Other waste types, such as hazardous materials or electronics, are not addressed. The dataset, while diverse, is limited to images readily available or collected in controlled settings, and field testing was conducted on a relatively small set of real-world samples. Limitations include possible biases in dataset composition, model performance variability under extreme conditions, and the need for further training to generalize across different regions with varying recycling rules.
Methodology Overview
A two-stage AI pipeline was implemented. First, a Vision Transformer model was trained for image segmentation on a dataset of 4,500 diverse waste images. Following segmentation, a CNN-based classifier, leveraging a VGG16 architecture enhanced with additional deep layers, was trained on 22,500 images of recyclable and organic items. An optimal learning rate was selected to stabilize training. The final system was evaluated on a test set of 2,511 images, and practical application was demonstrated via deployment in a web application, RecycleBot.
Results
The two-step AI approach using ViTs for segmentation and CNNs for classification—proved to be effective in handling complex, cluttered waste image data. The system achieved strong validation performance and retained high F1 score during real-world testing, supporting the hypothesis that segmentation prior to classification improves classification outcomes in challenging visual environments. For CNN models, several studies were performed with different network architectures to arrive at the optimal setting of the convolution templates, batch size and strides . The best model is selected, and corresponding weights are stored.
The decision to combine ViT with VGG16 reflects a strategic balance between robust segmentation and efficient classification. ViT’s self-attention mechanism enables effective pixel-level object localization by capturing global spatial relationships, making it particularly suitable for cluttered or overlapping waste images. This strength in handling visual complexity is leveraged during the segmentation stage. VGG16, on the other hand, provides strong performance on moderately sized datasets through transfer learning, offering faster convergence and lower risk of overfitting compared to deeper architectures, like ResNet50. While lighter model such as EfficientNet was considered, VGG16 was selected for balanced performance and easier integration within our two-stage pipeline. Together, the ViT+VGG16 pipeline integrates global scene understanding with reliable classification, optimizing the system for real-world waste analysis.
Confusion Matrix
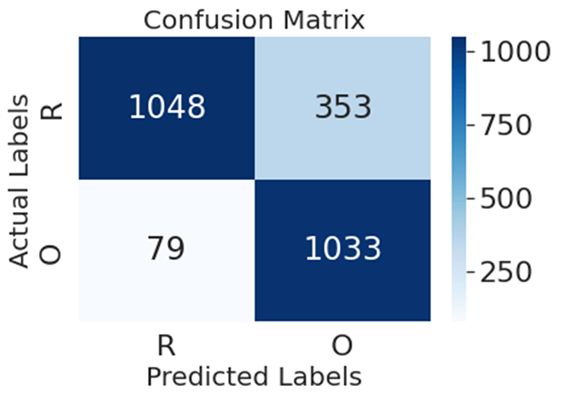
All the models were trained on standardized data following the same steps for data preparation and using optimal parameters as described in a later section. Trained model was used to predict the class labels for the validation data and a confusion matrix was generated using Scikit Learn. Figure 3 shows
the confusion matrices for the most promising AI algorithms for the classification system. The smaller the off-diagonal numbers, the better the F1-score for that model. The most common metric is classification accuracy; However, final classification accuracy is most reliable when the dataset contains an equal number of samples from each class. The unbalanced nature of the dataset requires evaluation of performance metrics.
Performance Metrics
| Binary Classification Algorithm | Accuracy | Precision | Recall | F1 Score |
| Convolutional Neural Network (CNN) | 0.71 | 0.88 | 0.6 | 0.71 |
| Transfer Learning (ResNet50) | 0.77 | 0.91 | 0.67 | 0.77 |
| Transfer Learning (VGG16) | 0.79 | 0.91 | 0.69 | 0.79 |
| ViT+ VGG16 | 0.83 | 0.93 | 0.75 | 0.83 |
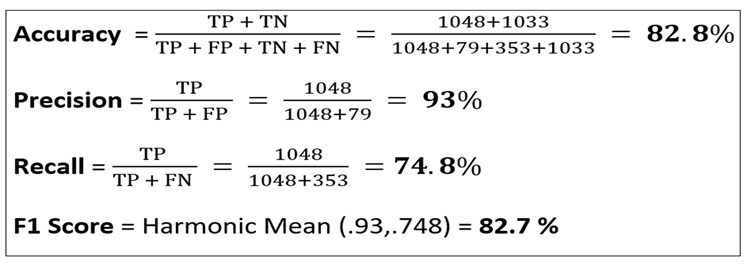
From the confusion matrix, the precision, recall, and F1-score were calculated for each of the algorithms. Table 1 summarizes the performance metrics for the validation data. VGG16 model augmented with five additional layers with optimal algorithm parameters resulted in a very high F1 score of 0.83 on the validation data as well as highest precision of 0.93. A dropout value of 0.2 is ideal. The training and testing times per epoch were also recorded and none of them were exceptionally high for the classification problem. Recall is the most critical statistic for improving the recycling content of the trash. Even high precision is important for making sure that organic is not mixed up with the recycled items. High accuracy is not always desirable as that may be based on overfitting, and it leads to lower F1 score. Performance metrics for various classification algorithms are summarized in table 2. It was interesting to find that hybrid algorithm performed best with the highest F1-score of at least 0.83.
To evaluate the individual contributions of the segmentation and classification components in the pipeline, ablation analysis conducted on the subset of images with low environmental complexity and diversity by modifying the architecture in the following ways:
- Classification without Segmentation: The VGG16 classifier was trained directly on full waste images (without prior segmentation by ViT). The F1 score dropped by 10 points, indicating that background clutter significantly reduces classification precision.
- Reduced VGG16 Depth: The number of added dense layers after VGG16 was reduced from two (Dense-128 and Dense-64) to one (Dense-64). This resulted in a 5-point drop in F1 score and increased overfitting on the training data, suggesting that deeper post-VGG layers improve generalization.
These findings validate the importance of both the segmentation stage for isolating relevant features and the added classifier depth for enhancing prediction robustness in complex real-world scenarios.
Field Trial
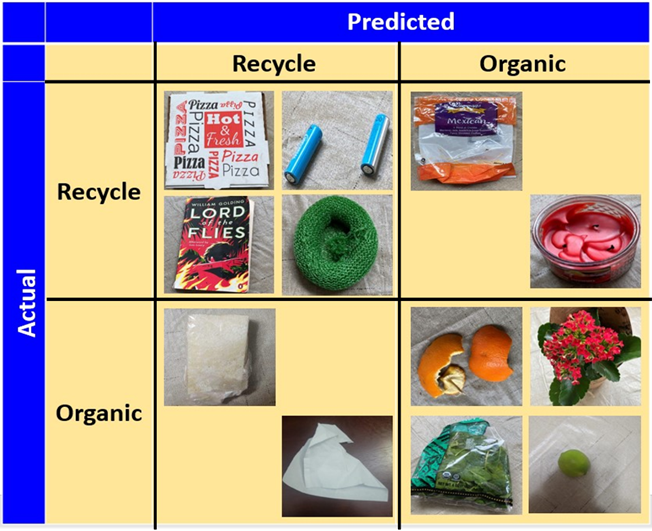
Before deploying the solution, the best model was tested on several field images to demonstrate the benefits of using a classifier to improve the fraction of the recycling objects correctly. To evaluate the model’s performance in realistic conditions, we conducted a field trial using 60 images of household and community waste collected under natural lighting conditions, with a range of backgrounds including kitchen countertops, bins, and outdoor grass or pavement. The test set included a mix of recyclables (e.g., plastic bottles, cardboard, cardboard, aluminum cans) and organic waste (e.g., fruit peels, food scraps, paper towels). Pictures for each of the items are taken in a consistent setting and they are uploaded to the web app to make a prediction. True class and predicted class for some of the selected samples are compared in the confusion matrix (Fig. 4). Model also provides the probability value for a given item to be recyclable, which is key for the user confidence. These results demonstrate technical feasibility in controlled field tests and offer a foundation for further exploration in real-world recycling applications. The current trial does not constitute a formal cross-domain generalization test and broader deployment will require additional testing across different regions, device types, and image conditions.
Misclassifications and Diagnostics
To better understand the limitations of the classification system, we analyzed misclassified images from the validation and field trial datasets. A notable number of false positives occurred with certain organic items, such as soiled paper or food-stained cardboard, which visually resembled recyclable materials. Conversely, dark-colored recyclable plastics and semi-transparent containers were occasionally misclassified as organic, especially under low-light conditions or in the presence of background clutter. These failure cases highlight two key challenges: (1) background interference and object occlusion during segmentation, and (2) insufficient visual distinction between certain organic and recyclable classes. Further model refinement could include class-specific data augmentation (e.g., lighting variations, rotations). Future versions of RecycleBot may also benefit from ensemble methods or a human-in-the-loop correction mechanism for ambiguous cases.

Web Application
Best-in-Class models for waste classification were implemented in a novel, easy-to-use web application, RecycleBot (https://recyclebot.streamlit.app). Streamlit library, which allows for easy linking of different python models was used to create a web interface with different end-user options. Figure 5 shows the application interface which is used to predict the class of a trash item in two simple steps:
- Upload a picture of a trash item from the computer or smart phone.
- Model is used to predict class: Recycle or organic and associated probability to be in the predicted class.
Users can choose to check the box on the left to get the model performance metrics and confusion matrix associated with the prediction.
To evaluate the feasibility of real-world deployment, runtime performance metrics were collected from the RecycleBot web application running on a mid-range consumer laptop (Intel Core i5 processor, 8 GB RAM). The average prediction latency (including preprocessing, segmentation, and classification) was approximately 0.8 seconds per image. Peak memory usage during active session was around 420 MB, and CPU utilization remained under 40% post-initialization. These results confirm that RecycleBot is lightweight enough for household deployment on standard devices.
Data Privacy and Safety Considerations
The RecycleBot web application does not store or share any user-uploaded images. All classification is performed in-session and images are processed temporarily for prediction. No personally identifiable information (PII) is collected or retained. While the current version does not handle sensitive categories (e.g., medical waste), future iterations, especially those intended for regulated environments will require formal risk assessments, data encryption, and compliance with data protection standards.
Discussion
Automating waste classification at the point of disposal addresses key barriers to effective recycling, particularly the contamination of recyclable materials due to human error. Image segmentation and classification approach using a combination of Visual Transformer (ViT) and Convolutional Neural Network (CNN) models is effective in classifying trash items into organic and recycling classes under real-world, cluttered conditions. The segmentation model achieved approximately 70% pixel accuracy in isolating waste items from complex backgrounds.
Data supported the original hypothesis that the transfer-learning based Convolutional Neural Network (CNN) classification models can be built on the training data which will effectively classify trash items. VGG16 enhanced with five deep layers performs at greater than 90% accuracy in predicting the recycled objects for training data. The classification model was applied on a validation data of 2511 images achieving accuracy of 83% (17% false positive & negatives). Learning rate is an important parameter in model training and an optimum value of 0.01 was used to arrive at the best predictive model (F1 score of 83%). Drop Out of 0.2 is optimal. Furthermore, this novel approach provides the recycle content of the real-world cluttered waste stream to help the users of the app to make an optimal decision in recycling as well as efficient waste management collection at the community level. The current model provides deterministic probability outputs without uncertainty estimation. To enhance reliability in real-world scenarios, there is an opportunity to integrate uncertainty quantification methods such as Monte Carlo Dropout in the future to provide confidence intervals alongside predictions.
As a final product of this work, best-in-class models for detection and classification were implemented in a novel, easy-to-use waste classification application, RecycleBot.It was used on several field images to demonstrate the benefits of using classifier to improve the fraction of the recycling objects correctly. Even though RecycleBot was tested on real-world waste images captured in varied household environments, the current evaluation focused solely on model performance. No structured user studies or behavioral trials were conducted to observe human interaction with the app or measure recycling outcomes. Therefore, although the web application is designed for ease of use, we do not claim to have demonstrated its effect on user decision-making or waste-sorting behavior. Assuming RecycleBot improves household sorting accuracy by just 10% and is adopted in 10,000 households, this could divert an additional estimated 500–700 tons of recyclable waste from landfills annually, based on EPA’s average per-household waste generation numbers11. Future work will include formal user trials to assess how effectively RecycleBot supports human recycling decisions in everyday contexts. These studies will explore metrics such as classification trust, behavioral changes in waste sorting, and user feedback on app usability features.
While the RecycleBot system demonstrated strong overall performance, several limitations were identified. Poorly lit images occasionally resulted in incomplete segmentation or misclassification, particularly for darker-colored waste items. Crushed, partially burnt, or heavily contaminated items were more challenging for the model to accurately classify. Although the segmentation model mitigated some clutter effects, scenarios with significant object overlapping or extreme background noise still impacted accuracy. While diverse, the datasets used may not fully represent the range of waste materials encountered globally, limiting the system’s applicability without further retraining.
RecycleBot, in its current form, is best suited for preliminary sorting at the consumer or household level. This phase of classification is nonetheless critical; incorrect separation at the source remains one of the leading causes of contamination in recycling plants. Future iterations may incorporate multiclass classification models or hierarchical pipelines to address more granular categories relevant to industrial use. This system is not yet equipped to identify specialized waste types such as electronics, biohazards, or multi-material composites, which are often encountered in industrial waste streams. As such, claims of applicability to industrial or municipal systems are limited to early-stage sorting and educational use.
Future Research
To improve the model robustness, images from the field trial could be included in training as well as there may be value in including additional data sets. As a next step, F1 score of the classifier can be improved by including multiple views of an object in the training as well as standardizing the image capture process in terms of zoom level, background, and lighting. Another idea for potential improvement in the F1-score is the fusion of diverse features from multiple transfer learning approaches. Besides improving the predictive power of the classifier, classification models can be extended to include other types of trash items to build comprehensive waste management tool12. To improve the confidence and explainability of the predictions, there is an opportunity to further extend the feature-extraction models based on multiple objects in a picture. This can be accomplished by implementing image segmentation in composite pictures as a precursor to image classification. To realize the true potential of this technology, there is work required to integrate RecycleBot into recycle bins to make the waste management activity fully autonomous. Smart recycling bins will enable faster adoption of this approach.
Environmental Applications
The implementation of RecycleBot offers practical applications across multiple environmental and public health domains:
1. Household Waste Management
RecycleBot enables individuals to identify recyclable and organic waste at the point of disposal, improving household recycling habits and reducing contamination in waste streams. This can ease the burden on municipal waste facilities and increase the rate of successful recycling.
2. Smart Recycling Infrastructure
The core models developed in this study can be integrated into smart recycling bins or kiosks, allowing real-time waste classification and automated sorting. This integration can streamline collection processes and support large-scale deployment in urban and campus environments.
3. Biohazard and Medical Waste Sorting
With appropriate retraining and safeguards, the model could be adapted to assist in the classification of medical or hazardous waste, an area where misclassification can have serious consequences. Further risk assessment and regulatory compliance would be essential before such applications.
4. Environmental Education and Awareness
RecycleBot can also be used as an educational tool to promote recycling literacy in schools and communities. By offering real-time feedback and visual explanations of waste classification, it can foster greater engagement with sustainability initiatives.
Methods
Research Design
This study employed an experimental cross-sectional design aimed at developing and optimizing an AI-driven system for waste classification to identify if something is recyclable or organic. This is achieved in two key steps:
- Develop a visual transformer based semantic segmentation approach to partition an image into meaningful segments to isolate individual waste items.
- Identify and implement an efficient algorithm using Convolution Neural Network (CNN) approach to detect and classify sub-images into two categories (organic or recyclable) along with estimating the recycled content of the waste.
For each of the above steps, partitioned test dataset is used for fine tuning the F1 score and speed of the segmentation and classification models by changing the training parameters. The effectiveness of model performance was evaluated under varying environmental complexities and waste diversities to simulate real-world waste stream conditions.
| Model Parameter | Range | Description |
| Learning Rate [LR] | (0.001,0.1) | Rate at which CNN move towars solution |
| Drop out [DO] | (0.1,0.4) | % of neurons left out of the prediction |
| Epoch | (2,10) | Iterations of model training on full set of images |
| Opt. Method | (Adam,SGD) | Search algorithm used to maximize accuracy |
As part of building an accurate and robust system, parametric studies on relevant training parameters were performed to arrive at the best models in terms of minimizing false positives and false negatives.
For the classification step, four distinct parameters were considered in this project, namely, (1) Learning Rate: which indicates the speed at which CNN algorithm moves towards solution (2) Drop-out: % of neurons left out of the prediction (3) Epoch: Number of times the CNN is trained on the full dataset of images (4) Optimization Method: Adam and Stochastic Gradient Descent (SGD) as the search approaches.
Variables and Measurements
For the research study, the following two independent variables were used to capture the real-world conditions of the waste stream:
- Environment Complexity: This is a categorical variable with two levels representing the cluttered-ness and state of deformation of waste items. Depending on the extent of clutter, obscurity of items and deformation, the waste scenes are labeled as [Low, High].
- Waste Diversity: This is a categorical variable based on the diversity in the waste stream [glass, plastic, cardboard, paper, organic, electronic, medical]. Low level represents one or two types of waste items; and High level indicates three or more types.
In designing robust and efficient models for segmentation and classification, several critical parameters are evaluated as part of the independent variables design space. Some of the key model parameters and their ranges or settings are described in table 3.
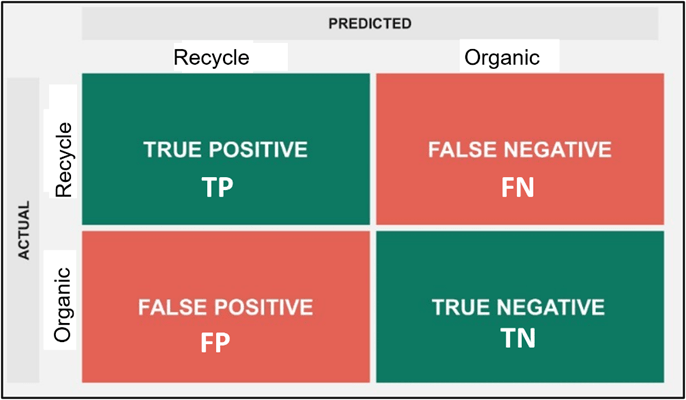
The performance of an algorithm for a given set of testing/validations images is summarized in a confusion matrix (fig. 6) that displays the number of accurate and inaccurate labeling of waste items based on model predictions13. Using the data from confusions matrix, model performance is calculated for the following four Dependent Variables:
1. Accuracy – measures the overall prediction performance of the model. It is the ratio of total correct instances to the total instances
![\[A = \frac{TP + TN}{TP + FP + TN + FN}\]](https://nhsjs.com/wp-content/ql-cache/quicklatex.com-bbd23dba3c255b9bb7c2dcfbe4d4263b_l3.png "Rendered by QuickLaTeX.com")
2. Precision– measures the accuracy of a model’s positive predictions (specific to target). It is the ratio of true positive predictions to the total number of positive predictions made by the model:
![\[P = \frac{TP}{TP + FP}\]](https://nhsjs.com/wp-content/ql-cache/quicklatex.com-b63d2d10c5dc2ae2082072ef48be3b93_l3.png "Rendered by QuickLaTeX.com")
3. Recall – measures the effectiveness of a classification model in identifying all relevant instances (targets) from a dataset. It is the ratio of the number of true positive (TP) instances to the sum of true positive and false negative (FN) instances:
![\[R = \frac{TP}{TP + FN}\]](https://nhsjs.com/wp-content/ql-cache/quicklatex.com-c61efc93d6194019dede027a2bdee004_l3.png "Rendered by QuickLaTeX.com")
4. F1-score – is used to evaluate the overall performance of a classification model. It is the harmonic mean of precision and recall:
![\[F_1 = \frac{2 \cdot P \cdot R}{P + R}\]](https://nhsjs.com/wp-content/ql-cache/quicklatex.com-3d9913c4852917a4957a9a098e83efae_l3.png "Rendered by QuickLaTeX.com")
The goal is to develop models that have high model F1 score but at the same time do not give too many false positives or false negatives. This is critical for building a robust prediction and F1 score is the most important metric used in selecting the best model. Additionally, it is important for model training and predictions to be computationally efficient. Training times are kept as a secondary dependent variable.
Controlled Variables: Models are trained on the same partitions of the data sets, following exactly similar standards for images with resolution of 224×224 pixels, augmentation and preprocessing of images.
Experimental Control: Model F1 score and precision achieved on the training partition is cross validated on the testing partition.
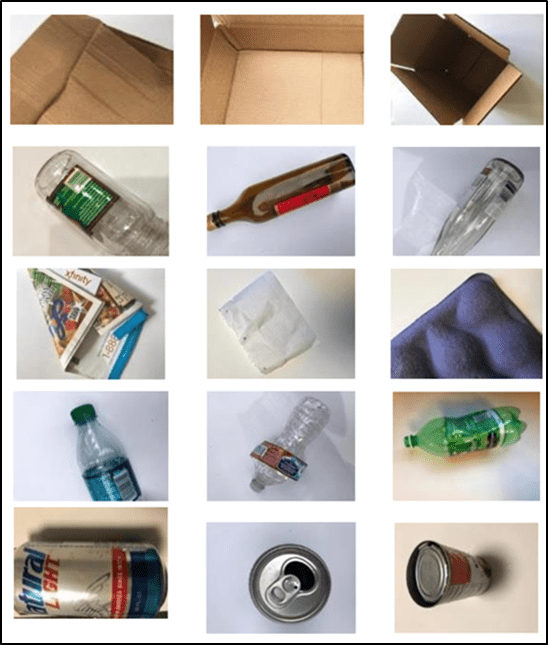
Data Sets
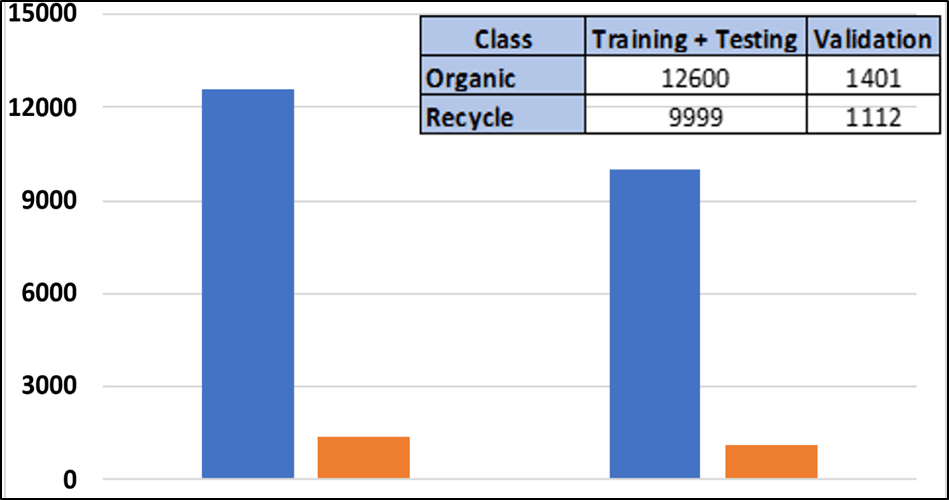
The dataset used in this study for classification was publicly available on Kaggle14, 22,500 images of organic and recyclable objects. Images for typical recyclable objects are shown in figure 7. In terms of target variable, each image is labeled as – “organic” or “recycle”. These images were collected in diverse environments, including indoor and outdoor settings, and exhibit a range of lighting conditions—natural daylight, indoor ambient light, and some low-light scenes. Backgrounds vary from plain white and gray surfaces to textured or cluttered backgrounds such as countertops, garbage bins, and soil. Camera angles also vary, with a mix of top-down, oblique, and side views, contributing to greater variability in item orientation and scale. These conditions, while realistic, may introduce unintended noise into the model training process. A chart summarizing the two classes for training and validation is shown in fig. 8. The represented in both the training and validation partitions, which prevents model bias toward the majority class. The validation dataset has 2511 images. Additionally, VGG16 model is trained on ImageNet data set with 14,197,122 annotated images.
For training the segmentation model on highly deformable and often translucent objects in cluttered scenes, Zerowaste dataset comprising 10,000 high-quality images, including ~4500 images with target labeling15. These images depict waste items in complex and cluttered environments, aiming to evaluate the performance of ViT in realistic waste segmentation scenarios. These images simulate practical challenges such as overlapping objects, partial occlusion, object deformation, and mixed material composition. They are representative of common household and municipal waste scenarios but may still underrepresent regional waste diversity, especially in rural or developing areas. To experiment and test the performance of different segmentation algorithms in a structured way, all these images were binned in two x-variables: Environment complexity (Low and High) as well as Waste Diversity (Low and High). Within these images, the areas were labeled into 6 classes: Background, Plastic, Metals, Cardboard, paper, organic.
While these datasets offer valuable training diversity, we acknowledge limitations. Both sources may have geographic and cultural biases in the types of waste featured (e.g., U.S.-centric packaging types). Additionally, specific waste categories like electronic or hazardous waste are underrepresented or excluded entirely. These biases suggest that while the models generalize well within the dataset domain, further real-world data collection and fine-tuning are needed for broader deployment.
Modeling Environment and Libraries
For model development and testing work, Python language was selected for its ease of use and availability of open-source functional libraries.
- Modeling and Computing Environment: Google Colab
- Numerical and Statistical Libraries: numpy, pandas, math, sklearn, keras, XgBoost
- Visualization Library: Matplotlib
- Web development environment: Streamlit
Procedure
Data collection and Preparation
Data preparation steps are key for building efficient ML/DL models16. Model development, execution and testing were performed in Google Colab high RAM python environment. The data sets are downloaded from Kaggle on Google Drive and files loaded into the model development file using operating system libraries. Following image pre-processing and standardization methods are used.
- Image Pre-processing and Normalization: As a first step, images were resized to 224×224 pixels and normalized to scale the intensity values between 0 and 1. For the Transfer learning, all the three channels of the original images were used.
- Target Labeling: For the Kaggle dataset, type labels were changed to numerical values by assigning 0 to organic, 1 to recycle. For the zero-waste data set, areas within the images were labeled in six target classes (0-5) for the (background, plastic, metals, cardboard, paper and organic respectively.
- Data Augmentation: Size of datasets is critical for improving the predictive power of the models. Towards this cause, horizontal reflection was used to double the size of the dataset.
Data Partition: The dataset was divided into 80% and 20% for training and testing, respectively based on randomized sampling.
Model Training
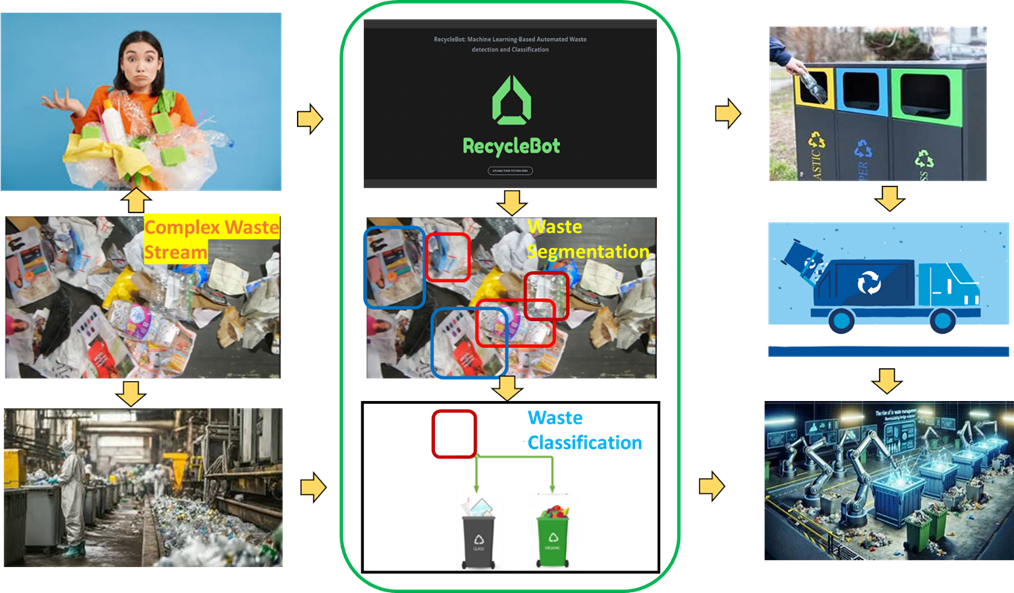
The model is developed and tested in python. Figure 9 describes the two-step AI-enabled process for waste segmentation and classification, leveraging advanced technologies like Vision Transformers (ViTs) for segmentation and Convolutional Neural Networks (CNNs) for classification.
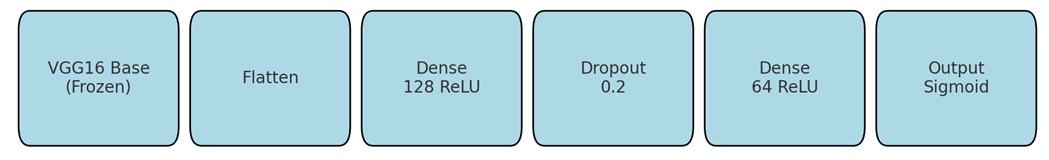
The objective of the first step is to detect and isolate individual waste items from a complex waste stream, separating relevant objects from cluttered backgrounds. A Vision Transformer (ViT)-based segmentation model is applied to analyze the input images from the zerowaste dataset with labeled areas. The model identifies regions of interest (ROIs) corresponding to distinct waste items. Each waste item is highlighted with bounding boxes or masks, separating it from the surrounding clutter. The segmented regions, containing individual waste items, are isolated and prepared for further classification. In the classification step, VGG16 model with 16 layers of neurons is imported from keras library and five additional layers are added to build a classifier for the binary target: Recycle vs. Organic. The VGG16 base model was initialized with ImageNet weights and its convolutional layers were frozen during training. Only the added fully connected layers were trainable. This strategy helped retain robust low-level visual features and mitigated overfitting due to the limited size of the custom dataset. The classification head appended to the frozen VGG16 base consists of a Flatten layer, followed by a Dense layer with 128 units and ReLU activation, a Dropout layer (rate = 0.2), another Dense layer with 64 units and ReLU, and a final Dense output layer with a sigmoid activation for binary classification. This architecture is illustrated in Figure 10. The flatten layer converts the output of CNN into a 1-dimensional array, input to fully connected /dense layer. In the final layer, the sigmoid activation normalizes the output of the network to a probability of an item being recycled. One of the key steps in converging to the optimal training parameters for the model is to perform parametric study to see how the performance metrics change with respect to these parameters.
Hyperparameter Optimization
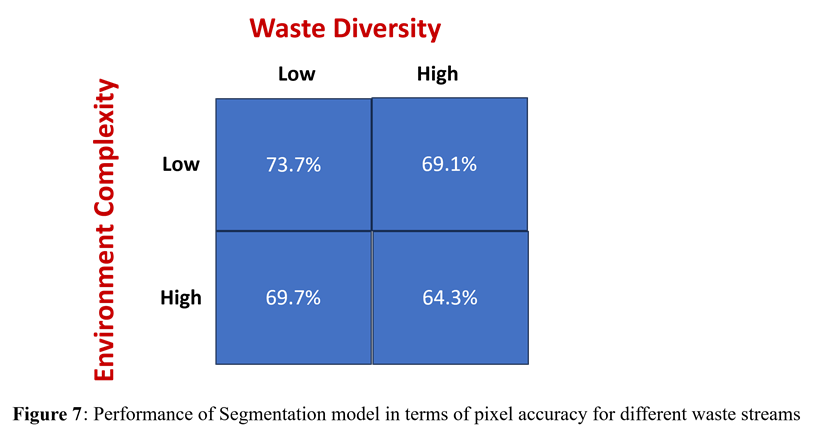
Vision Transformers (ViTs) have several important parameters that influence their performance, efficiency, and accuracy. In this study SeFormer visual transformer was used for its hierarchical transformer-based feature extraction from waste images with diverse object sizes. Also, it is lightweight and efficient in handling cluttered scenes17. Patch size, number of layers and attention head parameters were varied to optimize the accuracy of the segmentation model. Patch Size of 16×16, 18 layers, 11 heads were found to be optimal to give a pixel accuracy of ~70% for all 4 types of waste streams as shown in Figure 11. Even though metrics such as Dice score and mIoU were considered, pixel accuracy was selected as the evaluation metric for segmentation performance due to its computational simplicity and effectiveness in quickly verifying whether the model correctly isolates broad object regions. In this preprocessing step, precise boundary alignment or detailed object shape is less critical. Pixel accuracy thus serves as a practical and efficient first-pass measure to ensure reliable object extraction before proceeding to more complex classification stages.
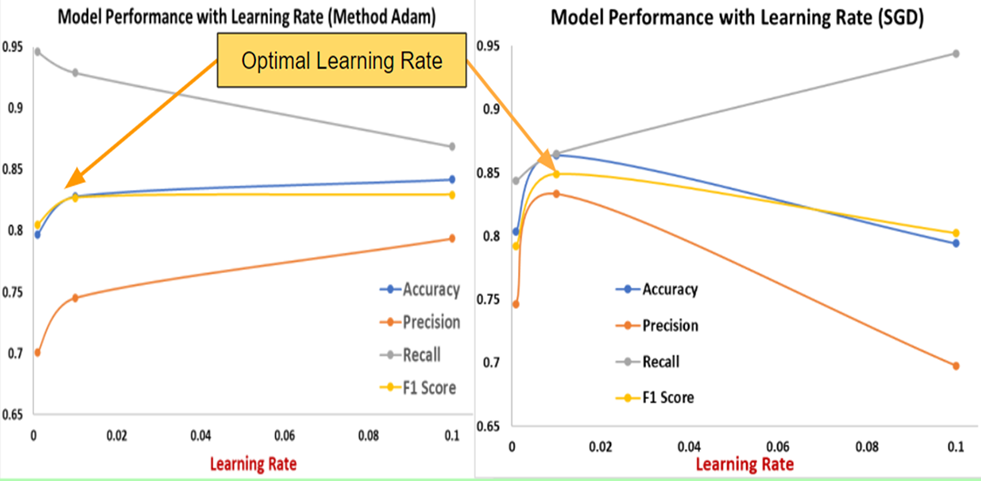
For transfer learning models, there are several parameters including epochs, dropout and optimizers that were varied to identify the optimal settings. Towards the goal of minimizing the false positives and false negatives, F1 Score was used as a key criterion to maximize. Figure 12 shows the model training with two different optimizer options.
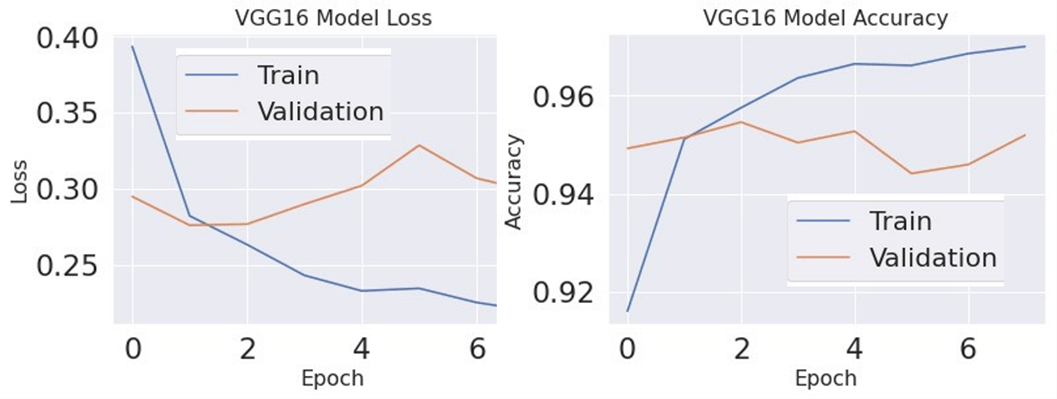
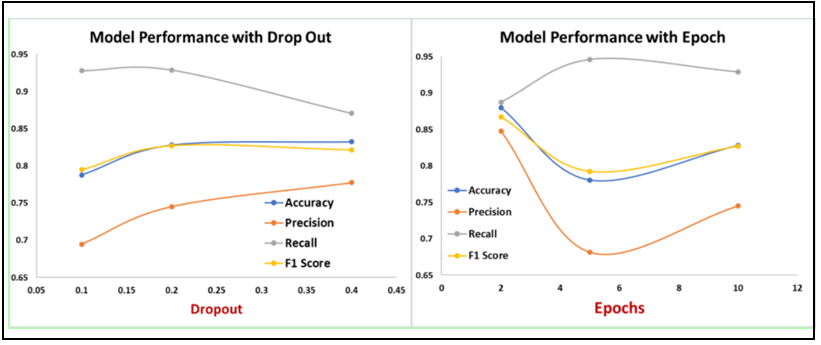
Figure 13 shows the variation of accuracy and model loss as a function of the epochs for the VGG16 model for both training and validation datasets. Performance metric in terms of F1 score is calculated for different learning rates. Optimal learning is based on maximizing the F1 score for test data. With both algorithms a learning rate of 0.01 gives the best outcome. Figure 14 shows the variation of the performance metrics as a function of the dropout and epochs for the VGG16 model. Five epochs were used as the optimal setting.
In this study, hyperparameters were selected manually based on empirical observations due to resource constraints. While this approach yielded strong performance, future work will incorporate automated tuning methods such as grid search or Bayesian optimization to more systematically explore the parameter space and potentially enhance model performance. Toolkits such as Optuna may be used to facilitate this process.
References
- O. Adedeji, Z. Wang. Intelligent waste classification system using deep learning convolutional neural network. Procedia Manufacturing. 35, 607–612 (2019). [↩]
- U.S. Environmental Protection Agency. Advancing sustainable materials management: 2020 fact sheet. https://www.epa.gov/sites/default/files/2022-12/documents/2020_facts_and_figures_fact_sheet_final.pdf (2022). [↩] [↩]
- Swedish Institute. Sweden recycles nearly all waste — and converts the rest to energy. Sweden.se. https://sweden.se/life/sustainability/recycling-in-sweden (2022). [↩]
- J. Zhang, H. Yang, X. Xu. Research on service design of garbage classification driven by artificial intelligence. Sustainability. 15(23), 16454 (2023). [↩]
- J. Zhang, H. Yang, X. Xu. Research on service design of garbage classification driven by artificial intelligence. Sustainability. 15(23), 16454 (2023). [↩]
- C. Ching. How to build an image classifier for waste sorting. Towards Data Science. https://towardsdatascience.com/how-to-build-an-image-classifier-for-waste-sorting-6d11d3c9c478 (2019) [↩]
- H. Zhou, X. Yu, A. Alhaskawi et al. A deep learning approach for medical waste classification. Sci Rep. 12, 2159 (2022). https://doi.org/10.1038/s41598-022-06146-2 [↩]
- A. Dosovitskiy, L. Beyer, A. Kolesnikov, D. Weissenborn, X. Zhai, T. Unterthiner, M. Dehghani, M. Minderer, G. Heigold, S. Gelly, J. Uszkoreit, N. Houlsby. An image is worth 16×16 words: Transformers for image recognition at scale. arXiv preprint arXiv:2010.11929 (2020) [↩]
- X. Li, Y. Ding, Q. Zhang. A vision transformer-based model for waste classification. Sustainability. 14(17), 11059 (2022) [↩]
- S. Poudel, P. Poudyal. Classification of waste materials using CNN based on transfer learning. In Forum for Information Retrieval Evaluation (FIRE 2022), December 9–13, 2022, Kolkata, India. ACM [↩]
- U.S. Environmental Protection Agency. Advancing sustainable materials management: 2020 fact sheet. https://www.epa.gov/sites/default/files/2022-12/documents/2020_facts_and_figures_fact_sheet_final.pdf (2022) [↩]
- J. Siegel, D. Dalbhanjan, C. He. RUcycle. Devpost. https://devpost.com/software/rucycle (2017) [↩]
- C. Ching. How to build an image classifier for waste sorting. Towards Data Science. https://towardsdatascience.com/how-to-build-an-image-classifier-for-waste-sorting-6d11d3c9c478 (2019) [↩]
- S. Sekar. Waste classification dataset. Kaggle. https://www.kaggle.com/datasets/techsash/waste-classification-data (2018) [↩]
- D. Bashkirova, M. Abdelfattah, Z. Zhu, J. Akl, F. M. Alladkani, P. Hu, V. Ablavsky, B. Çalli, S. A. Bargal, K. Saenko. ZeroWaste dataset: Towards deformable object segmentation in cluttered scenes. Proc IEEE Conf Comput Vis Pattern Recognit (CVPR), 21115–21125 (2022) [↩]
- C. Ching. How to build an image classifier for waste sorting. Towards Data Science. https://towardsdatascience.com/how-to-build-an-image-classifier-for-waste-sorting-6d11d3c9c478 (2019) [↩]
- X. Feng, H. Du, Y. Duan, Y. Liu, H. Fan. SEFormer: Structure embedding transformer for 3D object detection. Proc AAAI Conf Artificial Intelligence (2022) [↩]


