
Abstract
Maximal oxygen consumption (VO2max) strongly indicates an individual’s fitness level. However, traditional methods of measuring VO2max often require expensive equipment and controlled laboratory settings. This study explores the feasibility of estimating VO2max using physiological signals collected from seven subjects on a cycle ergometer. Data from multiple cycling protocols were processed to extract features, including power output, heart rate, cadence, and respiratory frequency. Average oxygen uptake over 20 seconds at peak power (AO20) was used to approximate VO2max and served as the primary target variable. A long short-term memory (LSTM) neural network was trained on these inputs, achieving a root mean square error (RMSE) of 0.1745 mL/Min and an R² score of 0.9693 on the test dataset. While the results indicate that the model can capture key relationships between cycling performance and aerobic capacity, the findings are limited by the small sample size and the controlled ergometer environment. These constraints mean further research with larger and more diverse datasets is required before real-world applicability can be fully assessed.
Keywords: Deep-learning, LSTM, Time-series Prediction, Physiological Signals, VO2max
Introduction
Maximal oxygen consumption (VO2max) represents the maximum amount of oxygen the body can utilize during intense exercise and is considered the standard for assessing aerobic fitness in an individual1,2. Accurate measurements of VO2max typically require specialized gas analysis equipment and controlled laboratory protocols, which may not always be available or practical to many3. Recent research has begun to explore whether wearable devices and/or machine learning can provide alternatives to lab-based testing; however, these approaches are still relatively new4,5,6.
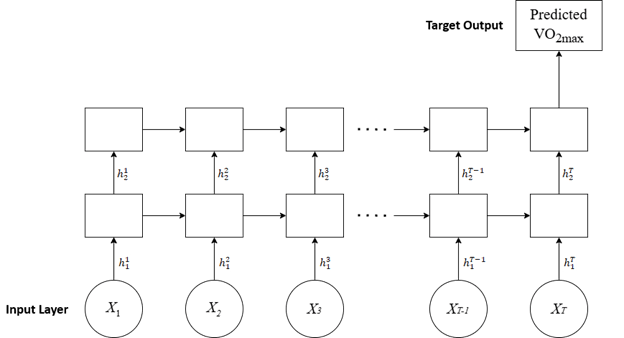
A common approach to predicting VO2max is through computational models created from real-world data. For example, a 2008 review by Akalan et al. uses VO2max prediction equations and compares them to numerous data collected across various activities, including walking, running, and cycling7. However, equations cannot account for the variability from subject to subject due to differences in populations, thus struggling to estimate the subject’s VO2max accurately1. In this scenario, a machine-learning algorithm can process the subject data and account for more variability. Another study, conducted by Borror et al., utilizes an Artificial Neural Network (ANN), more specifically a feed-forward neural network (FFNN), to predict an individual’s VO28. An FFNN processes inputs independently with no memory of past inputs9. However, in VO2max prediction, past data can be valuable because VO2max levels respond with a slight delay to changes in cardiac and muscular output10. This time-sensitive variability suggests that incorporating prior time-series data can improve prediction accuracy. For this reason, this study utilized a Recurrent Neural Network (RNN), as RNNs maintain a hidden state to recall past data and create patterns to predict VO2max readings accurately11.
More advanced architectures, such as the Attention-Enhanced CNN-LSTM model proposed by Wang et al. (2025), capture both temporal and spatial patterns in physiological data, which improves accuracy over traditional RNNs12. However, this approach relies heavily on large, curated datasets and primarily focuses on exercise metrics obtainable only using lab equipment. Similarly, Hsiao et al. (2025) demonstrated that a wrist-worn multiwavelength photoplethysmography (PPG) device combined with a machine learning model can estimate VO2 continuously13. However, their model is constrained by reliance on a single sensor modality, potentially missing physiological signals that could enhance prediction accuracy. In contrast, the present study addresses these gaps by integrating multiple physiological inputs, including heart rate and respiratory frequency, and using a smaller dataset within a sequential RNN-based framework.
This project aims to develop a machine learning model capable of predicting VO2max from physiological signals collected during cycling ergometer tests using the average oxygen uptake over 20 seconds at peak power (AO20), an approximate surrogate for VO2max used in the original paper. Short-duration rolling averages are a recognized method for reducing variability in VO2 measurements. A 20-second average has been reported as one accepted approach among exercise physiologists, alongside longer averages, such as 30s or 60s, which can correct up to 96-98% of variability14. However, AO20 should be regarded as an approximation rather than a direct measurement of VO2max. The goal is to provide an accurate and efficient alternative to direct VO2max testing. A Long Short-Term Memory (LSTM) neural network15,16 was used to take advantage of the flat regions of peak power output. These regions exhibit consistent physiological trends over time when the subject exerts maximum power, which benefits the LSTM, as it is designed to analyze sequential data. By modeling how the features evolve during the test, it was hypothesized that the LSTM can learn patterns to predict an individual’s VO2max without needing oxygen consumption data.
This study demonstrates a proof-of-concept showing that VO2max can be estimated from easily measurable signals (power, cadence, heart rate, respiratory frequency) obtained from wearable sensors instead of specialized gas equipment. This novel contribution addresses the unmet need for a practical, accessible, and scalable method to estimate aerobic fitness in real-world settings, without the cost, expertise, and equipment burden associated with laboratory-based cardiopulmonary testing.
Methods
Dataset
The data used in this study were obtained from a publicly available, anonymized dataset from Kaggle to ensure that no personal information was released. The dataset was uploaded to Kaggle by the first author of the original peer-reviewed publication from which the data originates, and the additional associated supplementary PDF confirms the experimental methods17. All subjects provided informed consent, and the experiment followed the guidelines of the Declaration of Helsinki18. The dataset consisted of physiological data sampled at a frequency of 1 Hz from seven subjects (six male, one female) each undergoing the same set of ergometric cycling tests, where power increased over time until the subject reached maximal effort. The subjects had a mean age of 32.69 years and a standard deviation of 10.56 years19.
Each subject’s data was labeled with their measured VO₂, determined from oxygen data, which was then translated into their VO2max using a rolling average method. Respiratory measurements, including respiratory frequency and VO2, were measured using a breath-by-breath method from an automated open-circuit gas analyzer (Quark CPET by Cosmed), ensuring measurement reliability19. The features used for prediction include power (in watts), cadence (in revolutions per minute), heart rate (in beats per minute), and respiratory frequency (in breaths per minute), all of which are commonly collected during fitness exercise tests.
The problem was treated as a supervised learning regression task using time-series inputs and a continuous target output–VO2max, which can be approximated using 20-second rolling averages of the subject’s VO2 during peak power output. This method helps to reduce the variability in VO2 readings20.
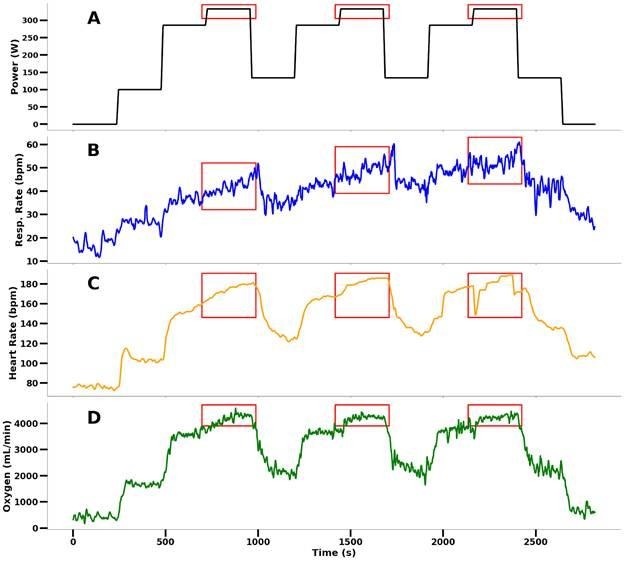
For each subject, the periods of maximal power output were identified (Figure 2, red bounding boxes) and used to calculate AO20 values by averaging the 20-second chunks of oxygen consumption data. A period of maximal power output can yield multiple time series of VO2 data and their corresponding averages (target values) via a 20-second moving window with one-second increments. This ensures that the model can learn to predict AO20 based on the physiological state during maximal effort. This yielded 4616 time series samples, each 20 seconds long.
The Wingate Anaerobic Test (WAnT) is a 30-second all-out cycle ergometer test used to evaluate anaerobic physiological responses21,22. The data from the WAnT (Figure 1) in this study provided a singular peak rather than constant, maximum power regions. This led to the test being excluded, as it was unsuitable for the model’s use.
Next, the heart rate and respiratory frequency features underwent standard scaling, transforming the data to have a mean of zero and a standard deviation of one across all subjects using the equation:
(1) 
Where  is the raw value,
  is the mean,
  is the standard deviation, and
  is the resulting standardized z-score. This enabled the model to learn physiological patterns more effectively. Power and Cadence were left in their original scales due to their relatively low and stable range of values. The data was split into 60% for training, 20% for validation, and 20% for testing. The split was performed at the sample (segment) level rather than the subject level, meaning that data from all individuals could appear in each partition. While this approach helped maximize the diversity of physiological states the model was exposed to, it does pose the risk of data leakage, as the model may have encountered similar subject-specific patterns across windows. However, this design was intentional for two reasons: (1) exposing the model to a larger distribution of physiological states during training, helping improve its generalization ability, given this small dataset, and (2) evaluating how well the model can predict outcomes on new recordings from the same individual, reflecting real-world applications such as continuous or repeated monitoring of subjects. While subject-level splitting would be required to assess strict cross-subject generalization, the focus of this study was on within-subject predictive performance.
The input to the model is a tensor composed of four physiological features recorded over a 20-second window (heart rate, respiratory frequency, power, and cadence), and the model outputs the VO2max (AO20) prediction for the next second.
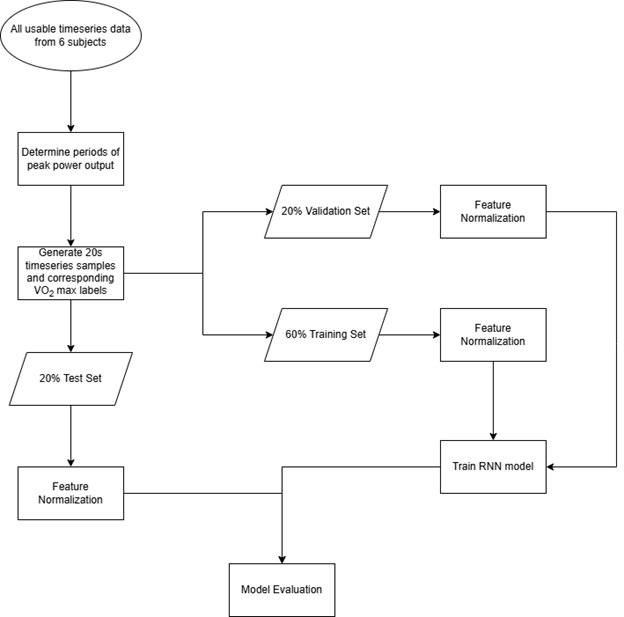
The data processing, model training, and evaluation workflow are shown in Figure 3.
Model Architecture, Training, and Evaluation
An LSTM network was employed to predict the VO2max of the subjects. LSTMs are particularly well-suited for handling time-series data due to their ability to preserve temporal dependencies and remember long-term relationships across sequential inputs23,24, which is essential for modeling physiological processes that change over time. Compared to Gated Recurrent Units (GRUs), LSTMs provide stronger performance on small to medium datasets. Their additional gating mechanisms allow more effective learning of complex patterns, making them a stronger proof-of-concept model choice. While transformers represent a more advanced alternative for sequential modeling, their performance advantage depends more heavily on large datasets25, which were not available for this study; therefore, using transformers would likely result in overfitting.
The deliberate choice of LSTMs balances its predictive power with a smaller dataset, making it appropriate for this application.
The model architecture consisted of two LSTM layers, each with a hidden vector size of 64. The output of the LSTM layer underwent layer normalization and was then passed through a fully connected layer to produce a single continuous output corresponding to the predicted AO20. The root mean square error (RMSE) and mean absolute percentage error (MAPE) were used to evaluate how well the model was performing, which are given as:
(2) 
Where  is the predicted VO
 max,
max,  is the actual VOmax, and
  is the total number of data points. The Adam optimizer26 was used to train the model with a learning rate of 0.001. Training was performed over 68 epochs, and convergence was determined via early stopping with a patience of five. A batch size of eight was used for training. All hyperparameters were optimized through hyperparameter tuning, including learning rate, hidden size, and the number of LSTM layers. A random search strategy was employed across a predefined search space (Table 1), with five-fold cross-validation used to evaluate each candidate configuration. RMSE on the validation folds was used as the optimization metric. Table 2 highlights the parameters and optimized hyperparameter values used in the study.
| Hyperparameter | Search Space Values |
| Learning rate | 0.1, 0.01, 0.001, 0.0001 |
| Hidden size | 32, 64, 128 |
| Number of LSTM layers | 1, 2, 3 |
| Batch size | 8, 16, 32 |
| Optimizer | Adam, RMSProp |
| Parameter / Hyperparameters | Value |
| Input Size | 4 |
| Hidden Size | 64 |
| Number of LSTM Layers | 2 |
| Output Size | 1 |
| Learning Rate | 0.001 |
| Batch Size | 8 |
The R2 value and the root mean square error were used to evaluate and determine the model’s accuracy. After training and during testing, the data were inversely scaled to restore the features to their original values. The source code and dataset used in this study are available on GitHub.
Results
The trained LSTM model showed encouraging predictive trends, with Figure 5 presenting the training and validation RMSE curves plotted against epochs, Figure 6 exhibiting the scatterplot comparing the predicted and actual VO2max values, and Figure 8 showing the corresponding residual plot to Figure 6.
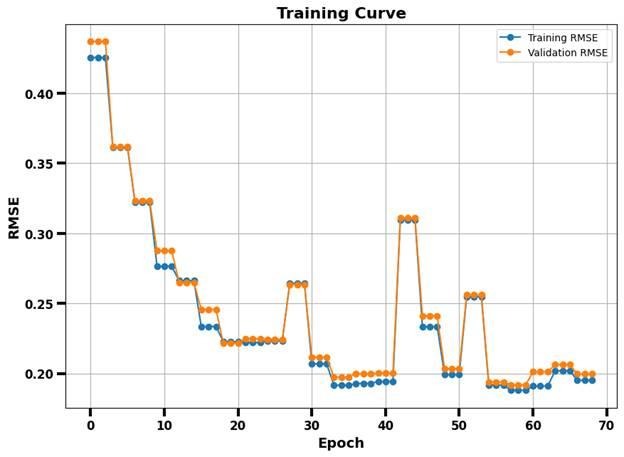
The training and validation RMSE curves are highlighted in Figure 5 and show the model’s RMSE during training over 68 epochs. The curves generally show a downward trend across epochs; however, RMSE spikes are observed. These fluctuations are expected given the small dataset size, the use of window-splits, and stochastic mini-batch training. With limited training samples, including a batch with harder-to-predict windows may temporarily increase error. Such spikes do not indicate model collapse, as the overall trajectory of the curve appears downwards.
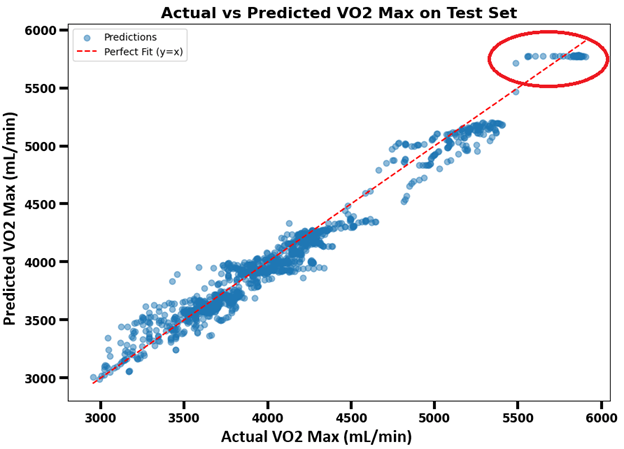
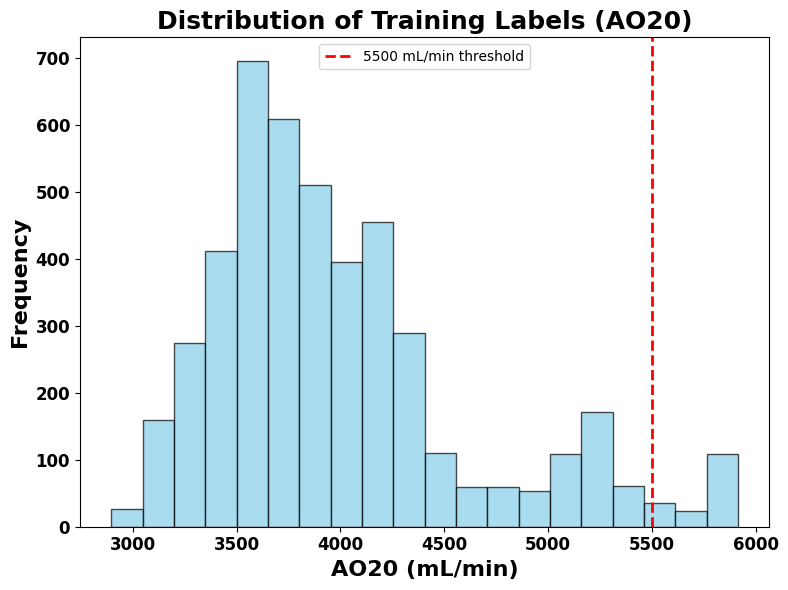
The scatter plot (Figure 6) demonstrates that the model was strong in estimating VO2max, achieving an R² of 0.9693, a MAPE of 2.47%, and an RMSE of 0.1961 mL/min. It shows that most predicted VO2max values fall close to the actual VO2max values as they cluster closely around the line. However, the model cannot accurately predict some data points inside the red circle. The R2 value indicates that approximately 97% of the variance in VO2max is accounted for by the LSTM regression model, with the remaining 3% because of factors outside the model’s scope. To better understand the flattening of the data above 5500 mL/min, Figure 7 presents a histogram revealing a minimal number of samples above this range, which likely caused the model to struggle generalizing beyond this threshold, leading it to predict a horizontal line of VO2max rather than capturing its variability.
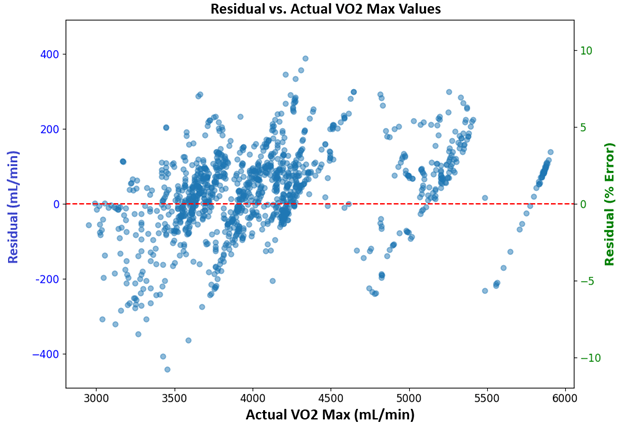
The residuals plotted in Figure 7 correspond to the scatterplot in Figure 6, displaying a generally random distribution around zero mL/min, except for the outlying points previously highlighted in the red circle. This suggests the model has a relatively low systematic bias when predicting VO2max.
To contextualize the LSTM’s results, a simple linear regression baseline was trained on the same dataset. The model achieved an R2 of 0.8621, an RMSE of 0.3725 mL/min, and a MAPE of 4.68% on the test set. These results suggest that the LSTM model provided more accurate and reliable VO2max estimations relative to the actual values compared to the baseline linear regression model.
Discussion
The results attained by the model suggest that temporal patterns in the four physiological features—Power, Cadence, Heart Rate, and Respiratory Frequency—are highly informative for predicting VO₂ max. The scatter plot (Figure 6) of predicted vs. actual AO20 values shows a strong linear relationship. The residuals vs. predicted values plot (Figure 8) shows patterns of left-to-right displays of residuals about the zero-error line (red dashed line). This indicates that the model can capture the mean VO2max values for each period of peak power output, but cannot always predict the variation precisely about the mean at each time step. This interpretation can be directly visualized in the circled region in Figure 6, where the predicted values line up in a horizontal line. Although the model does not capture the time-dependent variations around the mean with high accuracy, its predictions are sufficiently reliable for estimating an individual’s average VO2max values during periods of peak power output.
The LSTM model’s ability to detect patterns from time-series physiological signals makes it a favorable tool for approximating VO2max-related metrics in a more accessible manner. Since the target value AO20 reflects oxygen uptake, the model’s performance suggests that real-time fitness assessment could be feasible using wearable sensors alone in applied settings. This could be particularly impactful for athletes, clinicians, or fitness professionals seeking a practical, yet inexpensive and efficient method to assess aerobic capacity.
A study conducted by M. F. Akay et al. uses Generalized Regression Neural Networks (GRNN) to predict the VO2max of an individual27, which also showed high accuracy, achieving an R value of 0.81 and a standard error of estimate (SEE) of 4.87. While direct comparisons are difficult, the higher R2 values in this current study may be attributed to using an LSTM and its ability to capture long-term dependencies. It should be noted that the datasets and target variables used in the two studies are not identical; therefore, these results cannot be taken as proof of superiority, but rather as an indication that LSTMs can perform competitively in this research domain. At the same time, the high R² value reported in this study (0.9693) should be interpreted with caution. With only seven participants, the small dataset may bias the model’s performance and limit its generalization ability, as highlighted within the red circle in Figure 6. In addition, the lack of an independent external dataset prevented validation beyond the original dataset. These results should therefore be interpreted as preliminary evidence supporting feasibility rather than conclusive evidence. Furthermore, no statistical significance testing was conducted due to the limited sample size. Statistical tests would have been underpowered and potentially misleading with only seven subjects. Future work with larger datasets would be able to support both external validation and statistical significance testing, helping establish generalizability.
However, many improvements can still be made to the model, such as improving the time-specific VO2max predictions beyond the mean value. While the overall error remains low, improvements may be achieved by incorporating additional features, such as age or sex, to account for a more diverse sample of individuals. This demographic information is known to influence VO2max. Future work could integrate it by concatenating a demographic feature vector with the LSTM’s learned representation before the final feed-forward prediction. The present study deliberately excluded these features to emphasize a proof-of-concept scenario: testing whether VO2max could be accurately predicted using only wearable physiological data without needing personal information or specialized lab equipment.
The data set consists of only seven individuals, which may introduce slight bias in the model and decrease its accuracy when generalizing the results to a larger, more diverse population. In addition to the small sample size, the dataset carries limitations that affect generalizability; namely, the demographic imbalance (six males and one female), the lack of diversity in age and fitness, the small sample size, and the use of AO20 as a surrogate for VO2max. These limitations arise from the original structure of the dataset and should be considered when interpreting the results. Nonetheless, this research is intended as a proof-of-concept, demonstrating the feasibility and novelty of predicting VO2max from wearable signals using an LSTM model.
Despite the limited dataset, the model demonstrated promising predictive performance without the need for enhancement techniques such as transfer learning. A randomized train/validation/test split was employed, and all reported results were obtained from the test set, following standard machine learning workflow. Expanding the dataset with more subjects and a wider range of physiological conditions could resolve this and enhance the model’s ability to generalize the results to a larger population. These improvements can be made in future work, once more data is available.
Conclusion
This research aimed to develop a machine learning model that predicts VO2max using physiological time-series data. Using an LSTM neural network, the project aimed to model temporal dependencies in exercise signals to approximate oxygen usage during recovery, helping with the analysis of aerobic fitness.
The study’s methodology involved collecting incremental exercise data from seven subjects, creating labeled training data from 20-second rolling averages, and training the LSTM model on sequential inputs. After preprocessing and optimizing the architecture, the final model achieved an R² value of 0.9693, suggesting preliminary but favorable prediction ability in this proof-of-concept study. The model performed well due to the consistency of physiological responses during exercise recovery and the effectiveness of LSTM networks in modeling time-series data. The model is currently effective at predicting the mean VO2max values during periods of peak power output.
Future work will focus on enhancing its ability to capture the time-dependent fluctuations around these mean values, expanding the dataset to encompass broader population variability. Given the limited size of the current dataset, simpler and more data-efficient approaches, such as ensemble methods or shallow neural networks, may also be explored as a baseline comparison to interpret the LSTM’s results. Along with this, data augmentation techniques such as Gaussian noise injection, permutation of subsequences, magnitude warping, and synthetic oversampling methods like SMOTE for time-series may be employed to increase the functional sample size and reduce overfitting28. Demographic information could be incorporated into the model to improve generalization. Once more robust and diverse datasets become available, more complex architectures, such as transformers, could be evaluated. This model may then be implemented into an application or wearable device to help individuals understand their aerobic fitness without the need for lab testing, or be helpful to athletes whose training may be tailored based on their VO2max.
References
- K. Buttar, N. Saboo, S. Kacker, A review: Maximal oxygen uptake (VO2 max) and its estimation methods. International Journal of Physical Education, Sports and Health. 24-32, 30 (2019). [↩] [↩]
- G. Ranković, V. Mutavdžić, D. Toskić, A. Preljević, M. Kocić, G. Nedin-Ranković, N. Damjanović, Aerobic capacity as an indicator in different kinds of sports. Journal of the Association of Basic Medical Sciences. 10, 44-48 (2010). [↩]
- C. Gjestvang, T. Stensrud, L. A. H. Haakstad, How is rating of perceived capacity related to VO2max and what is VO2max at onset of training? BMJ Open Sport Exercise & Medicine. 3, 1-7 (2017). [↩]
- A. Smiley, J. Finkelstein, Smart wearable analytics for cycling: AI-based physical exertion prediction. Studies in Health Technology and Informatics. 328, 256-260 (2025). [↩]
- A. Smiley, J. Finkelstein, Dynamic prediction of physical exertion: leveraging AI models and wearable sensor data during cycling exercise. Diagnostics. 15, 52 (2025). [↩]
- S. Wiecha, P. S. Kasiak, P. Szwed, T. Kowalski, I. Cieśliński, M. Postuła, A. Klusiewicz, VO2max prediction based on submaximal cardiorespiratory relationships and body composition in male runners and cyclists: a population study. eLife. 12, e86291 (2023). [↩]
- C. Akalan, R. A. Robergs, L. Kravitz, Prediction of VO2max from an individualized submaximal cycle ergometer protocol. Journal of Exercise Physiology. 11, 1-17 (2008). [↩]
- A. Borror, M. Mazzoleni, J. Coppock, B. C. Jensen, W. A. Wood, B. Mann, C. L. Battaglini, Predicting oxygen uptake responses during cycling at varied intensities using an artificial neural network. Biomedical Human Kinetics. 11, 60–68 (2019). [↩]
- D. Svozil, V. Kvasnička b, J. Pospíchal, Introduction to multi-layer feed-forward neural networks. Chemometrics and Intelligent Laboratory Systems. 39, 43-62 (1997). [↩]
- D. C. Poole, A. M. Jones, Oxygen Uptake Kinetics. Comprehensive Physiology. 2, 933-996 (2012). [↩]
- I. D. Mienye, T. G. Swart, G. Obaido, Recurrent neural networks: a comprehensive review of architectures, variants, and applications. Information. 15, 517 (2024). [↩]
- Z. Wang, Y. Song, S. Li, G. Sun, Attention-enhanced CNN-LSTM model for exercise oxygen consumption prediction with multi-source temporal features. Sensors. 25, 4062 (2025). [↩]
- C. Hsiao, C. Tong, G. L. Coté, Machine learning-based VO2 estimation using a wearable multiwavelength photoplethysmography device. Biosensors. 15, 208 (2025). [↩]
- R. A. Robergs, D. Dwyer, T. Astorino, Recommendations for Improved Data Processing from Expired Gas Analysis Indirect Calorimetry. Sports Medicine. 40, 95-111 (2010). [↩]
- G. V. Houdt, C. Mosquera, G. Nápoles, A review on the long short-term memory model. Artificial Intelligence Review. 53, 5929-5955 (2020). [↩]
- A. Graves, Long short-term memory. Supervised sequence labelling with recurrent neural networks. 37-45, (2012). [↩]
- A. Zignoli, Cycling VO2, https://www.kaggle.com/datasets/andreazignoli/cycling-vo2/data (2020). [↩]
- WMA declaration of helsinki – ethical principles for medical research involving human subjects. World Medical Association. (2024). [↩]
- A. Zignoli, A. Fornasiero, M. Ragni, B. Pellegrini, F. Schena, F. Biral, P. B. Laursen, Estimating an individual’s oxygen uptake during cycling exercise with a recurrent neural network trained from easy-to-obtain inputs: A pilot study. PLOS One. 15, 1-15 (2020). [↩] [↩]
- R. A. Robergs, D. Dwyer, T. Astorino, Recommendations for Improved Data Processing from Expired Gas Analysis Indirect Calorimetry. Sports Medicine. 40, 95-111 (2010). [↩]
- H. Jaafar, M. Rouis, L. Coudrat, E. Attiogbé, H. Vandewalle, T. Driss, Effects of load on wingate test performances and reliability. The Journal of Strength and Conditioning Research. 28, 3462-3468 (2014). [↩]
- A. Castañeda-Babarro, The wingate anaerobic test, a narrative review of the protocol variables that affect the results obtained. Applied Sciences. 11, 7417 (2021). [↩]
- G. V. Houdt, C. Mosquera, G. Nápoles, A review on the long short-term memory model. Artificial Intelligence Review. 53, 5929-5955 (2020). [↩]
- S. Mao, E. Sejdic, A review of recurrent neural network-based methods in computational physiology. IEEE. 34, 6983-7003 (2023). [↩]
- A. Vaswani, N. Shazeer, N. Parmar, J. Uszkoreit, L. Jones, A. N. Gomez, Ł. Kaiser, I. Polosukhin, Attention is all you need. Proceedings of the 31st International Conference on Neural Information Processing Systems ( NIPS’17). 6000-6010, (2017). [↩]
- D. P. Kingma, J. Ba, Adam: A method for stochastic optimization. arXiv preprint arXiv:1412.6980 (2017). [↩]
- M. F. Akay, E. Çetin, İ. Yarım, Ö. Bozkurt, M. M. Özçiloğlu, Development of novel maximal oxygen uptake prediction models for Turkish college students using machine learning and exercise data. IEEE. 186-189 (2017). [↩]
- I. Annaki, M. Rahmoune, M. Bourhaleb, Overview of data augmentation techniques in time series analysis. International Journal of Advanced Computer Science and Applications. 15, 1 (2024). [↩]


