
Abstract
Ultrafine particles (UFP) exposure may pose serious health threat to passengers while driving on-road. To date vehicle cabin (inside) and on-road environment (outside) UFP concentrations were measured in this study for three new model year vehicles in Los Angeles, California along a commuting route under each vehicle’s available operation conditions: all ventilation systems off (All Off), air conditioning on (AC On), and Biodefense On. The peak inside and outside UFP had concentrations of 4.2*105 #/cm3 and 4.8*106 #/cm3, respectively, while the average inside and outside UFP concentrations reached as high as 6.6*104 #/cm3 and 1.4*105 #/cm3, respectively. Inside/Outside UFP concentration (I/O) ratios for the three vehicle are in the range of 25.2% ~ 71.8% under All Off and 19.9% ~ 28.3% under AC On, and this I/O ratio reached a surprisingly low value of 1.3% when one vehicle was operated under Biodefense On, highlighting the effectiveness the Biodefense technology in preventing outside particles from entering the vehicle cabin and protecting passengers against high on-road particle concentrations. Cabin UFP concentration in all three vehicles, once elevated after the vehicles experienced high and long periods of outside UFP concentrations, decayed slowly with a period lasting up to 20 ~ 30 minutes under the All Off scenario until the inside UFP concentration returned to values before elevation. To predict the inside UFP concentration and provide insight on vehicle infiltration and ventilation flows, we developed a mathematical model using measured outside UFP and vehicle parameters. The predicted and measured real-time inside UFP concentrations were compared and good correlations were achieved for both All Off and AC On operations.
Keywords: Ultrafine Particles, On-Road, Cabin UFP, Infiltration, Ventilation, Biodefense, Modeling
Introduction
Ultrafine particles (UFP), characterized by having an aerodynamic diameter of 100 nanometers or less, are most notably a product of a vehicle’s exhaust, brake wear, and tire wear while driving. UFP, due to their small size, poses many threats to the human body. According to Li et. al, the small size of UFP allows them to penetrate tissues and damage the structure of mitochondria by depleting intracellular glutathione, leading to oxidative stresses like pulmonary inflammation1. Another study by HEI 2013 found that UFP can traverse deeply into the brain and nervous system through penetration of deep-lung areas, which is hypothesized to lead to severe cardiovascular and respiratory damage, increasing the chance of disease and possibly death2. Human exposure to UFP occurs most frequently while being an occupant of a driving vehicle. According to the AAA Foundation for Traffic Safety, people spend an average of 60.2 minutes in a driving vehicle per day3. Consistent exposure to UFP for long periods of time while in a vehicle likely leads to higher respiratory morbidity.
Passenger exposure to UFP can be attributed to air entering the car through unsealed gaps and small cracks in the frame of the vehicle. Infiltration of UFP in this way poses serious issues relating to passenger health. If a car is not well sealed, unfiltered outside air with higher concentration of UFP than inside cabin UFP concentration will increase the vehicle’s interior UFP concentration which may expose the passenger to large amounts of UFP. Potential locations of infiltration vary between vehicles, and many studies have measured those areas for certain cars. Lesage et al. conducted many trials of infiltration areas and found infiltration amounts and locations vary between car design and geometry. They reported the main infiltration points are located at the bottom of the rear trunk door, above the rear wheels, and below the dashboard near the driver’s/passengers’ feet at the front of the vehicle. Moreover, they also found that infiltration flow rates increase at higher vehicle speeds4.
Exposure to UFP while being a passenger in a moving vehicle is also dependent on many factors like weather, geography, traffic, and car type. Additionally, the concentration of UFP in various areas are not consistent. A study conducted by Weichenthal et al. that focused on air pollution in Canadian metropolitan areas including Toronto and Vancouver measured on-road and in-vehicle concentrations of various types of pollutants including UFP. Their measured in-vehicle UFP concentrations were around 1.0*104 ~ 1.3*105 #/cm3 and 3.0*103 ~ 6.0*104 #/cm3 in the winter and summer, respectively. Their findings supported the idea that commuter exposure to air pollutants like UFP is strongly influenced by traffic intensity, magnitude of urbanization, and meteorology5.
Another study conducted by Zhu et al. in 2007 observed how different vehicles have various in-cabin to outside environment UFP concentration (I/O) ratios. By testing 3 cars on various highways in Los Angeles, they determined that for on road tests with all ventilation systems turned off, I/O ratios varied greatly from 0.2 to 0.8 which highlights how different models and types of vehicles influence cabin UFP concentrations relative to UFP concentrations in the outside environment6.
Technologies have been developed to reduce in-cabin UFP concentrations. Some cars are designed to equip with filters which remove UFP while air is ventilated into the cabin, albeit with varying success. Such filters include the High-Efficiency Particulate Air (HEPA) filters which according to Wei et al., removes 99% of UFP and PM2.5 entering the vehicle cabin through ventilation when used in conjunction with a normal cabin filter which removes 76% of UFP and PM2.5 by itself7. Other state-of-the-art technologies like inducing a positive pressure environment inside the vehicle’s cabin can mitigate exposure to UFP while driving. Certain Tesla models have utilized these technologies, including the Tesla Model Y, which included both a HEPA filter that can typically remove 99% of UFP and particles less than 0.3 μm from outside air and a positive pressure environment that reduces infiltration in its Biodefense mode8. Limited studies relating to Tesla’s Biodefense have reported data about its effectiveness in removing PM2.5 mass, granted only in a controlled laboratory chamber test. There is a lack of data reported about in-cabin UFP concentrations during on-road tests for Tesla’s Biodefense.
This study aims to measure and analyze the magnitude of cabin and outside UFP concentrations during vehicle driving on the surface streets and highways of Los Angeles in the summer of 2024. Through measuring UFP data while driving, we hope to provide further insights into the dynamics of UFP concentrations inside and outside of the cars. Vehicle cabin UFP concentration behaviors will be investigated at different operation conditions and the effectiveness of Tesla Biodefense technology on reducing vehicle cabin UFP count during on-road testing will be examined as well. Moreover, we aim to develop a mathematical model to predict cabin UFP concentrations and to estimate vehicle infiltration/ventilation flows. The observations and findings in this study may aid in understanding the mechanisms of the cabin UFP elevation and provide effective improvements in vehicle design and operations to reduce cabin UFP concentrations during on road driving which will protect people’s health.
Results and Discussions
Inside and Outside UFP Measurements
High outside and inside UFP concentrations were observed during the on-road testing in this study as shown in Table 1. Among 21 of our measurements, 7 tests had a maximum UFP concentration of over 1.0*106 #/cm3. The highest outside UFP peak reached a record of around 4.8*106 #/cm3 in a Tesla Model 3 test under All Off on 6/28/2024. In this test, the outside UFP stayed above 3.0*106 #/cm3 for only about 5 seconds, however, outside UFP concentration hovered over 4.5*105 ~ 4.8*106 #/cm3 for 68 seconds, and the average outside UFP concentration was 1.4*105 #/cm3. This average concentration highlights that the vehicle essentially drove through an area with an equivalent consistent high outside UFP concentration of 1.4*105 #/cm3 for the entire 23 minutes of the test. For another Tesla Model Y test under All Off on 9/12/2024, the average inside concentration soared to 6.6*104 #/cm3 which implies that the passenger was exposed to an equivalent UFP concentration of 6.6*104 #/cm3 inside the cabin for the entire 55 minutes of the test. For comparison, the UFP exposure of 6.6*104 #/cm3 in this test is ~13 times of the UFP concentration in the residential areas around 5.0*103 #/cm3.
The outside on-road and inside cabin UFP concentrations measured in this study, at least in some tests, appear to be drastically higher than those reported in other studies. For example, our highest outside UFP concentrations of 4.8*106 #/cm3 is about 8 times of the highest outside UFP concentration reported by Zhu et al. on the freeways of Los Angeles, which was about 6.0*105 #/cm36. Their measurements also showed that high outside UFP concentrations remained between 2.2*105 ~ 6.0*105 #/cm3 for 37 seconds, lower than the concentration and duration of high outside UFP measured in this study. For inside UFP concentrations, we observed a maximum peak of 4.0*105 #/cm3, about twice that of reports from Zhu et al.6 of 2.0*105 #/cm36, and about three times that of reports by Weichenthal et al. of 1.3*105 #/cm3 in Canadian Metropolitan areas5. The three vehicles tested in this study are relatively new model year vehicles. The tested vehicle has little, if not no, effect on the outside UFP concentrations because our sampling port was near the window and away from the exhaust pipe. The inside UFPs may be affected by vehicle geometry, model, and age. Higher inside UFP concentrations are expected in aged vehicles. More vehicles may be tested in future studies to account for these effects and provide more data.
Outside UFP concentrations of over 1.0*106 #/cm3 can be attributed to passing by high emitting vehicles like large diesel trucks or old cars. According to Park et al., one high emitting vehicle can result in on-road UFP concentration reaching approximately 2.0*106 #/cm39. Moreover, car density in a given area can increase average outside UFP concentration, as there are more cars that constantly emit UFP particles into the local microenvironment simultaneously. Roadways with elevated slopes may also cause vehicles to have more UFP emissions due to an increased engine load when the vehicles climb up the slope.

Inside to Outside UFP Ratios
For each car, we investigated the average I/O ratios under different operations to examine the car’s sealing and UFP filtering. As shown in Table 1, each overall I/O ratio average is calculated from the average I/O ratios under the same ventilation setting (e.g. AC On or All Off for the same vehicle). When Mercedes Benz is operated at All Off, the I/O ratio is about 30.8%, which is higher than its AC On ratio of about 19.9%. The Tesla Model Y had an I/O ratio of about 71.8% and 28.3% when it was operated under All Off and AC On, respectively. Unlike Mercedes Benz and Tesla Model Y, Tesla Model 3 has a slightly lower All Off I/O ratio of 25.4% than its AC On ratio of 28.1%. Among the three vehicles, Tesla Model 3 has the lowest I/O during All Off which could be attributed to better sealing of the entire car that minimizes UFP infiltration; and Mercedes Benz has the lowest I/O during AC On, which indicates this car may have a higher efficiency filter to remove UFP in the ventilation air.
While most of the I/O ratios for the three cars are about 20-30% under All Off and AC On, the Tesla Model Y had a higher average I/O ratio of 71.8% under All Off, which is equivalent to the passenger being consistently exposed to 71.8% of the outside UFP concentration during commuting on-road in this car. When the vehicle is driving under All Off, outside air enters vehicle cabin through infiltration without any filtering. Therefore, the high 71.8% I/O ratio of the Tesla Model Y under All Off indicates that this car may have many leakage points for outside UFP to enter the cabin through uncontrolled infiltration. The lower I/O ratio of 28.3% during AC On can be explained by the effective filtering in the Tesla Model Y ventilation system that removes UFP when the outside air passes through the air conditioner and enters the cabin.
The Tesla Model Y’s Biodefense, a technology that enables protection from outside pollutants, reduced the UFP I/O ratio dramatically to around 1.3%, which is much lower than most of the I/O ratios of 20-30%, as well as an outlier of 71.8%, during All Off and AC On for all three vehicles in this study. Compared to the I/O findings from Zhu et al. of 20% ~ 80%6 and Weichenthal et al. of 14% ~ 150%5, Tesla’s Biodefense technology potentially can lower inside UFP concentration by a factor of 10 ~ 115 times. While there is lack of vehicle cabin UFP data for on-road testing in other literature reports for Tesla Model Y, the UFP I/O ratio of 1.3% in this study reveals that its Biodefense technology can effectively prevent most of UFP entering the cabin and greatly lower cabin UFP concentration.

Vehicle Cabin UFP under All Off (All Vehicles)
Under the All Off condition, all ventilation systems are turned off and only infiltration occurs to cause air exchange, which leads to lower air exchange ratio (AER) between the cabin and outside environment than the AC On mode. For traditional gasoline vehicles like Mercedes Benz, air is exchanged through the openings such as the pressure release valve and poorly sealed gaps in the vehicle. According to Lesage et al. openings in the vehicle frame are major hubs of infiltration4. For the newer model year Tesla that is driven by electric batteries, there is no pressure release valve, therefore, unsealed portions of the Tesla vehicle are the only sources of air exchange during All Off.
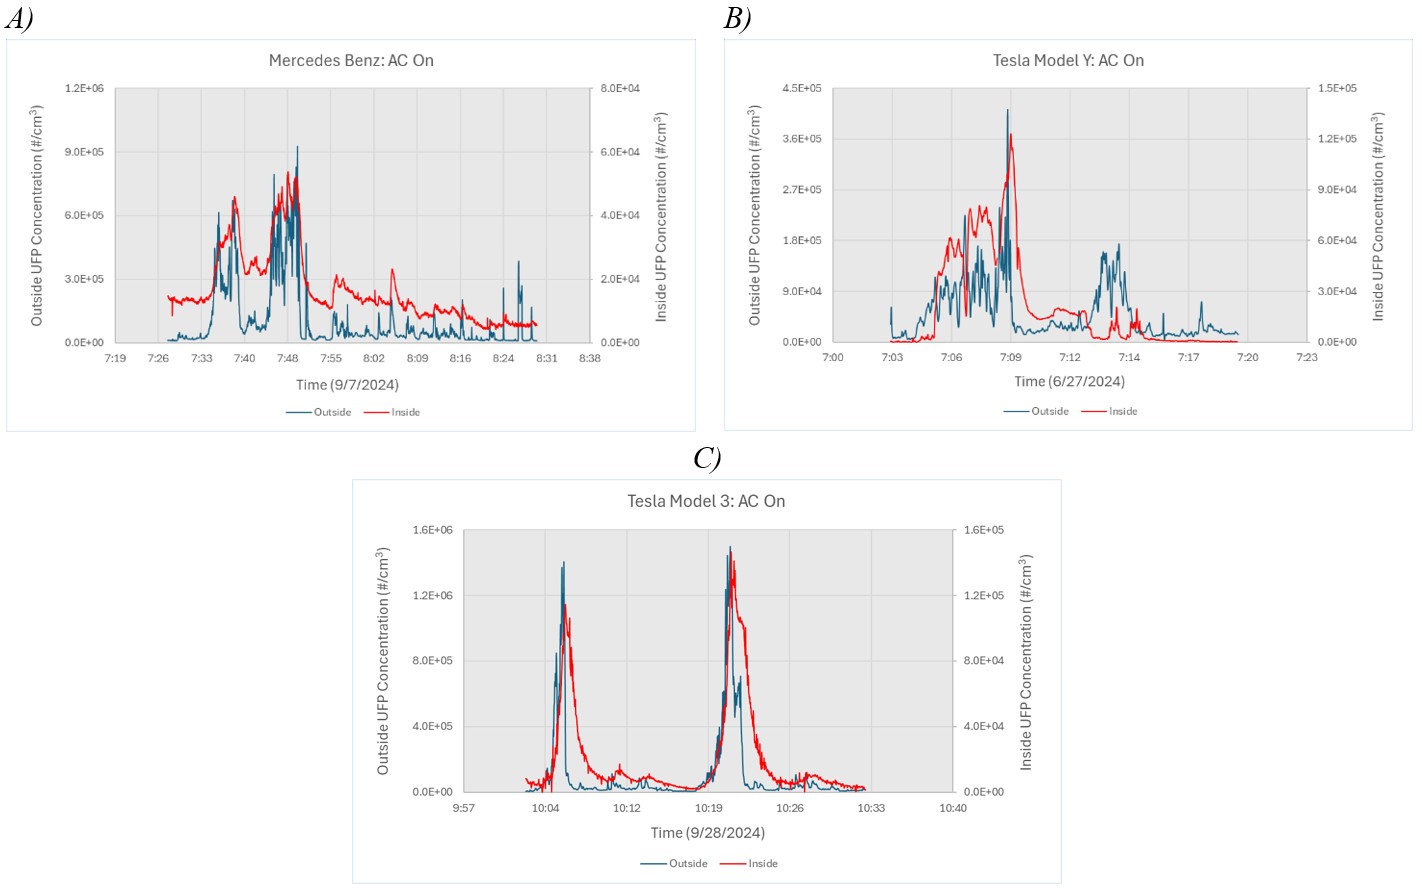
An interesting phenomenon was observed for all three vehicles that showed slow inside UFP concentration decay after it peaks from experiencing high outside UFP concentration, as shown in Figure 2. For the Mercedes Benz, exposure to outside UFP concentration of over 2.0*105 #/cm3 for 68 seconds leads to an in-cabin UFP concentration that peaks at around 2.9*104 #/cm3 and then decays down to around 1.3*104 #/cm3 in ~15 minutes (Figure 2 A). Similarly, for the Tesla Model Y, exposure to high outside UFP of 2.0*105 ~ 1.6*106 #/cm3 for 140 seconds leads to high inside UFP peaks at 4.0*105 #/cm3 which then steadily decays for ~30 minutes until it returns to 2.1*104 #/cm3 (Figure 2 B). Mercedes Benz appears to have a quicker inside UFP decay rate than the Tesla Model Y, which may be caused by Mercedes Benz having a pressure release valve causing higher AER.
In one Tesla Model 3 test as shown in Figure 2 C, multiple inside UFP peaks and slow decays can be observed. The inside UFP concentration started to increase from 8:25 and reached the 1st peak of 6.5*104 #/cm3 at around 8:31. During this period, the outside UFP concentrations were over 1.0*105 #/cm3 and had a couple of spikes above 1.0*106 #/cm3 which were much higher than the inside UFP concentration. This caused inside UFP to continuously increase during outside and inside air exchange. At 8:31, the inside UFP concentration was much higher than the outside UFP concentration. The exchange of air then caused the inside UFP to decrease and decay for about 4 minutes until it reached around 3.0*104 #/cm3. High outside UFP concentration of over 2.0*105 #/cm3 experienced for certain periods of times like measurements from 8:43 – 8:45 and 8:57 – 8:58 caused another two inside UFP concentration peaks of 5.7*104 #/cm3 and 4.7*104 #/cm3, respectively, and decay lasting around 11 and 15 minutes, respectively. Decay after 8:45 and 8:58 stopped due to the exposure to high concentration of outside UFP particles again at around 8:57 and 9:17 which increased inside UFP concentration (Figure 2 C). Note that the 4th outside UFP peak of 1.7*106 #/cm3 at 9:17 is higher than the earlier outside UFP peaks but only caused a small elevation of the cabin UPF due to its short duration of 7 seconds.
The slow decay seen in Figure 2 can be explained by the low AER under All Off condition and the magnitude of inside/outside UFP concentration difference. When a vehicle drives through an area with much higher outside UFP concentration, large amounts of UFP enters the cabin through infiltration which causes the inside UFP concentration to increase. Even when the AER is low (i.e. the outside air flow entering the cabin is low), the extremely high UFP concentration difference between the outside and inside, which can be up to 3 magnitudes of order, as well as the duration of high outside UFP occurrence, may cause cabin UFP concentration increase rapidly and reach a high level. When the vehicle enters an area with lower outside UFP concentration than inside UFP concentration (i.e. outside air is cleaner than the air inside the cabin), air exchange leads to in-cabin air with high UFP concentration slowly flowing out of the vehicle, and outside air with lower UFP concentration slowly flowing into the vehicle which lowers the inside UFP concentration causing the decay seen in Figure 2. Beyond the influence of AER, the inside UFP concentration decay rate is determined by the difference between inside and outside UFP concentrations and slow decay of inside UFP is usually attributed to a relatively small difference of inside and outside UFP concentration of around 1 magnitude. The slow decay of high cabin UFP indicates that passengers may be exposed to high concentrations of UFP for long durations, which poses health risks.

Vehicle Cabin UFP under AC On (All Vehicles)
While driving on road with the AC turned on, AER could be higher due to higher ventilation flow compared to All Off condition. Therefore, inside UFP can follow the change of outside UFP faster (i.e. the elevated high inside UFP concentration can linger for a much shorter period compared to the All Off scenario), as displayed in Figure 3. For the Mercedes Benz in Figure 3 A, the AC On condition led to around 4 minutes of lingering high inside UFP concentration, which is significantly shorter than the 15 minutes of lingering time measured in Figure 2 A under All Off. For the Tesla Model Y in Figure 3 B, high inside UFP concentration lingered from 1.2*105 #/cm3 to 1.5*104 #/cm3 for around 2 minutes compared to the 30 minutes under the All Off condition in Figure 2 B. The Tesla Model 3 in Figure 3 C also followed a similar pattern of high inside UFP concentration lingering for around 5 minutes compared to 11 and 15 minutes as depicted in Figure 2 C.
Overall, conditions measured for all 3 cars under All Off and AC On highlight how different ventilation settings can affect cabin UFP concentrations depending on the outside UFP concentrations. If the vehicle were to pass by an area with high outside UFP concentration for a period that caused inside UFP concentration to increase, and then pass by an area with outside UFP concentration that is lower than the elevated inside UFP concentration, AC On would be the better setting to quickly exchange high concentration cabin air with cleaner outside air. When driving on road, the oncoming outside UFP concentration changes dynamically and is not predictable, and people may not be able to realize if the inside UFP concentration is elevated or not. Hence, determining a systematic method to prevent and minimize outside UFP entering the cabin under both ventilation settings is crucial to keep passengers in a healthy environment with limited UFP exposure while driving.
Vehicle Cabin UFP for Biodefense On (Tesla Model Y Only)
From our on-road tests with the Tesla Model Y under the biodefense mode, the UFP I/O ratio is measured to be as low as around 1.3%, a large decrease compared to the UFP I/O ratio of 72% and 28% for the same car under All Off and AC On, respectively. As shown in Figure 4, after passing through an area with high outside UFP concentration of 1.2*106 #/cm3, inside UFP concentration of this car peaked slightly at around 1.1*104 #/cm3, dropped to below 3.0*103 #/cm3 in 4 seconds, and then decayed to about 800 #/cm3 in 67 seconds under the Biodefense On mode. The decay rate is much faster compared to that of the Mercedes Benz, Tesla Model 3, and Tesla Model Y under the AC On condition of 4, 5, and 2 minutes, respectively. Under the Biodefense On mode, the inside UFP concentration seems to increase and decrease at the same pace as the outside UFP concentration. Moreover, it appears that the HEPA filter equipped in this car can remove the UFP in the ventilation air with extremely high efficiency (i.e. the outside air enters the cabin with very low UFP concentration). This can be seen through inside UFP concentration staying at around 800 ~ 1,000 #/cm3 when the outside UFP concentration was between 1.0*104 ~ 2.0*104 #/cm3. This means that the passengers are exposed to inside UFP concentration while driving with the Biodefense on at a level about 5 times cleaner than what passengers will experience if they were at home or walking in a residential area. These observations therefore exemplify how the Biodefense technology on the Tesla Model Y is not only able to reduce inside UFP concentration drastically but also can create a large AER that can quickly bring cleaner air into the cabin. Note that after long exposure to high outside UFP concentration, the cabin UFP concentration only increase slightly as well. Both these factors benefit the passenger and reduce their exposure to UFP particles to magnitudes even lower than what they experience in residential areas.

Modeling of Inside UFP Concentrations
Our tests for the Mercedes Benz, Tesla Model 3, and Tesla Model 3 under All Off, AC On, and Biodefense On conditions have shown that the three vehicles behave differently under various ventilation conditions. To be able to evaluate factors affecting inside UFP concentration like infiltration, ventilation, and deposition, we propose a model that can predict the inside UFP concentration accurately for all ventilation settings as shown in Equation (1).
To predict the inside UFP concentration, we modeled under the assumption that each car has a fixed cabin air volume that does not change with an increase in passengers. Moreover, as Lesage et al. have found, infiltration flow rate increases with vehicle speed4. Since real-time vehicle speed was not measured in our tests, we assumed vehicle speed stayed constant throughout the entire test and used a constant infiltration flow in our modeling.
(1) 
Where Icurrent is the predicted current in-cabin UFP concentration (#/cm3), Ocurrent is the measured current outside UFP concentration (#/cm3), v is the volume of the cabin air (m3), Iprevious is the predicted in-cabin concentration at the previous timestep (#/cm3), and f is an equivalent flow rate of outside UFP concentration entering the in-cabin (m3/s). For our model to predict the inside UFP concentration, the first measurement of inside UFP concentration is used as our initial Iprevious. For the All Off condition, this model assumes that f is the amount of outside air entering the cabin through infiltration. For the AC On condition, f is the amount of air entering the cabin through infiltration and ventilation. Under AC On, the vehicle cabin filter may remove UFP in the ventilation air. The moment the air exits the HVAC and enters the vehicle cabin, its UFP concentration may be lower than the measured outside UFP concentration. This particle filtering effect is not explicitly included in the model and instead is merged into the equivalent outside UFP concentration flow rate f. Δt is the measurement resolution and is 1 second in this study. d is a retention coefficient of the inside UFP concentration considering the UFP loss. When particles move around randomly in cabin due to Brownian motion, some particles can settle onto the nearby surface, and in turn, cause loss of particles and decrease of particle concentration. The loss of cabin UFP can be indicated by deposition velocity which is reported by Gong et al. to be around 0.001 ~ 0.01 cm/s10. For our model, we approximate the retention coefficient d=1-deposition velocity.
This study’s model describes and enhances our understanding of the physical process of dynamic cabin UFP concentration changes corresponding to the infiltration, outside UFP concentrations, and the particle losses inside the vehicle. When a small stream of outside air with the high UFP concentration enters the cabin through infiltration, it mixes with the cabin volume. This causes some loss due to particle diffusion, and then an equal stream of mixture will flow out the vehicle to maintain the same pressure. If the air that enters the vehicle through infiltration has a higher UFP concentration than the current cabin UFP concentration, the cabin UFP concentration increases. If this phenomenon persists for a long time, it will continuously increase cabin UFP concentration to high levels. The difference in UFP concentration between the air that enters the vehicle and the air that exits the vehicle will determine the rate at which the cabin UFP concentration grows or decays.
One function of the modeling is to find the unknown values of f and d. Using physical understanding to get a range of arbitrary values of f and d, inside UFP can be predicted for a test, compared to the measured inside UFP, and have its linear regression between predicted and measured recorded. The values of f and d are tuned until the predicted and measured inside UFP concentration curves overlap well and the inside UFP concentration correlation reaches a maximum value, indicating the values of f and d are close to the real testing conditions.
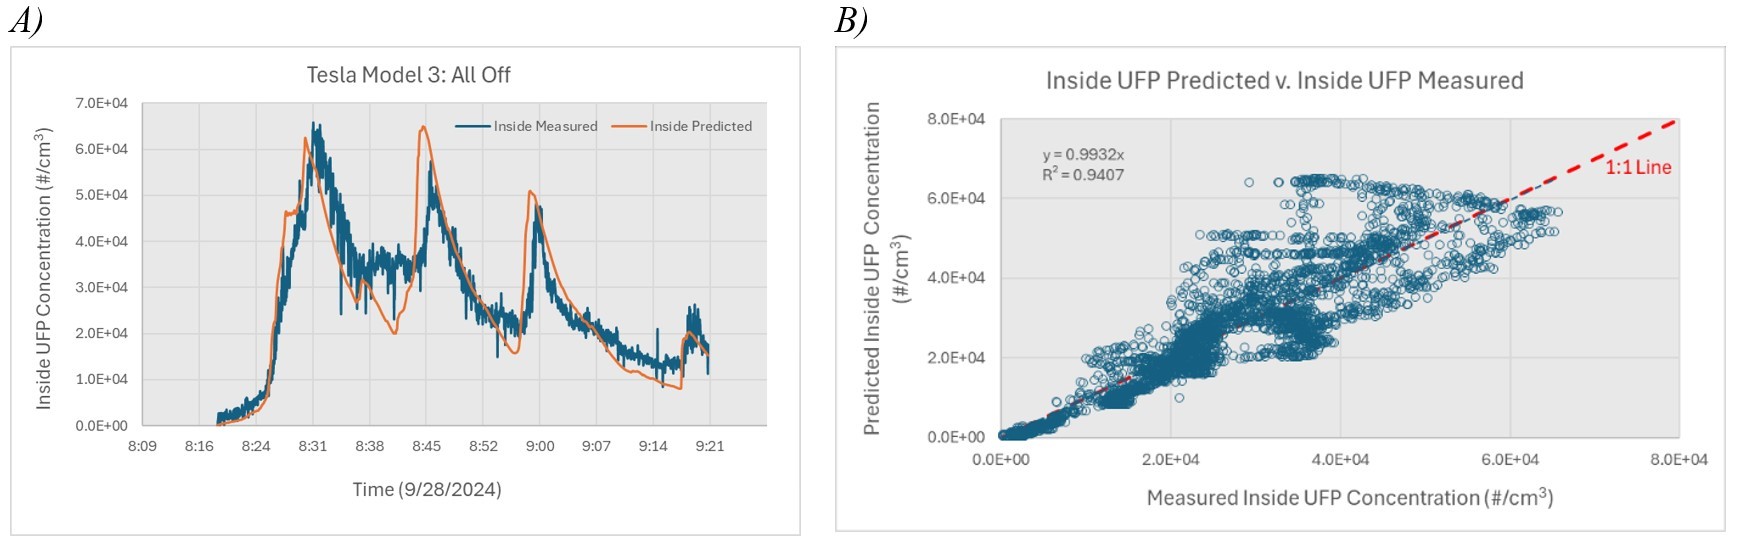
Figure 5 A highlights the accuracy of the model for the Tesla Model 3 operating under All Off when v, f, and d are tuned to be 3.2 m3, 0.003 m3/s, and 0.998, respectively. From experience, the predicted UFP is very sensitive to the retention coefficient so d must be very precise and within the range of 0.001 ~ 0.01 cm/s, which we found to be 0.002 in our All Off model. If d is not tuned well and even off by a small value of ±0.001, the entire predicted UFP curve will shift, causing extreme inaccuracy. By analyzing the linear regression of the measured and predicted inside UFP concentrations, Figure 5 B implicates a high positive correlation with a slope of 0.9932, which is close to 1, and a R2 of 0.9407, which is also close to 1.
Using the same values of f and d found in a test, the modeling can be validated by applying these two values to predict inside UFP concentrations in another test and then comparing those predictions to the measured UFP concentrations using linear regression. Among all the linear regressions performed, all showed R2>0.9 which indicates the accuracy of the modeling.
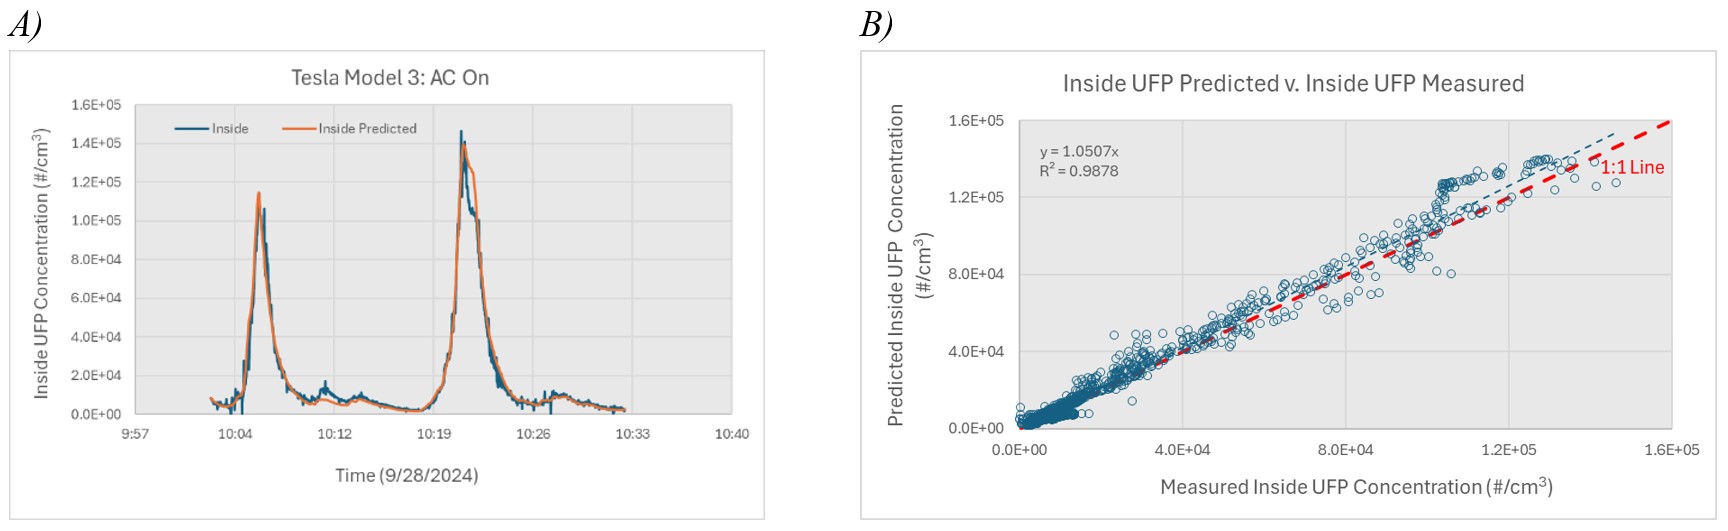
Model results for the AC On condition behave differently due to ventilation from the AC that blows air into the cabin. As air blows into the cabin, it mixes with existing air inside the cabin and continues to flow. The motion of the mixture of inside air may induce higher UFP deposition inside the cabin. Our model under the AC On condition highlights this phenomenon, as our d was tuned to be 0.985, a 0.013 cm/s increase of deposition velocity compared to that under the All Off condition. Moreover, since the AC blows air into the cabin, f increases as well. For our model, f is tuned to be 0.011 m3/s, 0.008 m3/s higher than that under the All Off condition. Figure 6 A highlights our model prediction of cabin UFP compared to the measured cabin UFP concentration when v, f, and d are tuned to be 3.2 m3, 0.011 m3/s, and 0.985, respectively. The real-time curves of UFP overlap almost perfectly among the 30-minute duration of the test. Figure 6 B shows the majority of predicted and measured UFP points are distributed along the 1:1 line and scatter in a small range, indicating that our prediction matches the measured value to great extent with a slope of 1.0507, which is close to 1, and a R2 of 0.9878.
A higher accuracy for the AC On model is explained by the outside air entering the cabin being dominated by ventilation that limits the impact from infiltration. As air from the air conditioner is blown into the cabin under AC On, inside cabin pressure may increase slightly and will be higher than the outside environment pressure. Thus, inside air flows to the outside environment through the designed exit route as well as the unsealed areas which reduces the amount of uncontrolled UFP entering the cabin through infiltration. Infiltration flow depends on vehicle velocity, which our model did not account for but rather assumed to be constant. Because inside UFP concentration due to infiltration flow is limited in the AC On scenario, errors due to changes in vehicle velocity are reduced as well, which explains why the AC On model results are very accurate. By contrast, f was solely based on infiltration amounts under All Off and changes with vehicle speed during measurement, which may cause error in the cabin UFP predictions as velocity was assumed to be constant. The heteroscedasticity of the scatterplot in Figure 5 B highlights accumulated error due to varying infiltration based on changing velocity, albeit the model prediction for All Off was still accurate.
Conclusion
This paper presented to date UFP concentration data for the inside cabin and outside environment of the Mercedes Benz, Tesla Model Y, and Tesla Model 3 as well as their inside to outside UFP concentration ratios (I/O). High vehicle outside UFP concentrations above 106 #/cm3 were frequently encountered on freeways in our testing, causing the cabin UFP concentration to reach higher than 105 #/cm3. From our data, we determined that the Mercedes Benz seems to have a stronger filter to reduce UFP in the outside air entering the cabin than the Tesla Model 3 and Model Y and that the Tesla Model Y seems to be not well sealed. We also observed that inside and outside air exchange and the difference between inside and outside UFP concentrations lead to different durations of inside UFP decay, and the decay period of an elevated inside UFP can be as long as 30 minutes during All Off. A lower UFP I/O ratio indicates a lower passenger exposure to UFP given the on-road outside UFP concentration remains the same. From the extremely low UFP I/O ratio of 1.3% for the Tesla Model Y under the Biodefense On scenario, it is shown that the Biodefense technology is very effective at preventing passengers from exposure to UFP despite the car itself not being well sealed. Additionally, our model for predicting cabin UFP demonstrated accurate results for both AC On and All Off ventilations settings, and the model supports how infiltration is dependent on vehicle velocity. Taking vehicle velocity into account for this mathematical model may provide greater accuracy and precise estimation of infiltration flows as well as ventilations and particle depositions.
The Biodefense technology shows great effectiveness and is a feasible method for preventing outside UFP from entering vehicle cabin. The intricacies of Tesla’s Biodefense technology are not open to the public, which could imply that the technology may have cost and design concerns which is why not many vehicles have it. A combination of the vehicle design using a HEPA filter to remove particles in the ventilation air and providing positive cabin pressure to limit uncontrolled UFP infiltration flows is a promising direction to drastically reduce passenger UFP exposure. Specifically, being able to manipulate the amount of exchange between inside and outside air will allow a car to consistently create a positive cabin pressure through a closed-feedback loop at low cost. Reducing infiltration to negligible amounts will narrow down the source of passenger UFP exposure solely to outside ventilation air which can be controlled by using high quality filters to remove UFP. As reported in this study, high outside UFP still exists on freeways and cabin UFP may elevate greatly. While significant reduction of outside UFP may not be expected in a short term for all vehicles, it will be very meaningful to investigate and implement improvements in vehicle designs to reduce the vehicle cabin UFP during on road driving under all operation conditions. With the findings and understandings about UFP entering vehicle cabin in this study, the cost-effective and feasible methods will be further investigated in future studies with the goal to limit passenger exposure to UFP and to benefit people’s health in their daily commutes.
Methods
This study obtains the total UFP concentrations using two Testo DiSCmini (Device A, Device B), nanoparticle measuring instruments that measure particle sizes ranging from 10 to 300 nanometers. The size distribution of on-road particles, according to Zhu et. al, shows that particles in the UFP category make up approximately 90% of all particles in the sizes of 10-300 nanometers6. Even though some measured sizes (100-300 nm) may fall outside of the UFP definition, its contribution of 10% to the total particle count is a small fraction. Thus, in this study, the particle concentrations measured by the Testo DiSCmini is reported as the UFP concentration. The reported UFP concentrations (covering 10-300nm) may be approximately 10% higher than the defined UFP (10-100nm) for both inside and outside UFP data, and the influence on the UFP I/O ratio will be ignorable.
For the in-cabin UFP concentration measurement, an EZ-FLO 1/4” ID (3/8” OD) PVC clear vinyl tube was attached to the ¼” inlet of the DiSCmini and both are placed inside the car while driving. To measure the outside UFP concentration, the vehicle’s window was rolled down about 2.5” and the gap was closed with a thick neoprene rubber sheet. The neoprene rubber sheet was drilled to create 3/8” holes that allowed the vinyl tube to pass through. One end of the vinyl tube extends about 1” out of vehicle as sampling port of the outside environment, and another end of the vinyl tube connects to the inlet of DiSCmini located inside the vehicle. Heavy-duty duct tape was used to secure the neoprene rubber sheet on the vehicle window edges and seal all possible gaps between the window, neoprene sheet, and vinyl tube. Hence, the cabin and outside environments are isolated from each other by the neoprene rubber sheet. The single point of sampling vehicle outside UFP concentrations is used in this study and it is assumed that the vehicle outside UFP is the same in the microenvironment the vehicle encounters. When the hole(s) is not used in the measurement, it is sealed with duct tape to avoid outside air entering the vehicle cabin.
To ensure the two DiSCmini units were measuring UFP concentrations equally, we compared their reading of real-time outside UFP concentrations measured at the same time, as shown in Figure 7 as a coordinate. The scatterplot shows that the UFP readings from the two units have high correlation close to 1, with a slope of about 1.10, and R2 of 0.9894. Most of the measured data points located on the 1:1 line which indicates that the two DiSCmini units will provide nearly equivalent UFP concentration measurements. Because the difference between Device A and B is only around 10%, our analysis of UFP concentrations presented in this study did not use corrected data but rather used raw measurement.

For on-road tests, we measured the vehicle cabin (inside) and on-road (outside) UFP concentration for three vehicles: Mercedes Benz ML 350 (Model year 2015), Tesla Model 3 (Model year 2023), and Tesla Model Y (Model year 2023). The three vehicles are relatively new model years and represent typical vehicle technologies that we plan to investigate to understand the current performance of UFP prevention. The Mercedes Benz ML 350 is an internal combustion engine vehicle. The Tesla Model Y is an electric vehicle and possesses an advanced UFP-prevention solution (Biodefense). The Tesla Model 3 is also an electric vehicle, but it doesn’t have a UFP-prevention solution. Each of the three vehicles drives on-road under two scenarios used most while driving: all ventilation systems off (All Off) and air conditioning on only (AC On). Inside and outside UFP concentrations were measured simultaneously for each of the two scenarios. For the Tesla Model Y an extra biodefense-on condition (Biodefense On) scenario was tested. Repeated tests are conducted for each vehicle under each scenario.
The test route is shown in Figure 8 which includes freeways I-10, I-71, I-60 and short sections of local surface streets and residential areas. This route is for commuting between Temple City and Riverside, California. Tests occurred during various times throughout the day and were conducted from late June to early September of 2024. The vehicle operation mode is selected depending on the weather and outside temperature and the test length may vary depending on vehicle availability and testing condition.

References
- N. Li, C. Sioutas, A. Cho, D. Schmitz, C. Misra, J. Sempf, M. Wang, T. Oberley, J. Froines, A. Nel. Ultrafine particulate pollutants induce oxidative stress and mitochondrial damage. Environmental Health Perspectives 111, 455-460 (2003). [↩]
- Particles, HRPoU. Understanding the health effects of ambient ultrafine particles. HEI Perspectives, 32013 (2013). [↩]
- AAA Foundation for Traffic Safety. American Driving Survey: 2022 https://aaafoundation.org/wp-content/uploads/2023/09/202309_2022-AAAFTS-American-Driving-Survey-Brief_v3.pdf (2022). [↩]
- M. Lesage, D. Chalet, J. Migaud. Experimental analysis and quantification of air infiltration into a passenger car cabin. Transportation Research Part D: Transport and Environment 99, 103006 (2021). [↩] [↩] [↩]
- S. Weichenthal, K. V. Ryswyk, R. Kulka, L. Sun, L. Wallace, L. Joseph. In-vehicle exposures to particulate air pollution in Canadian metropolitan areas: the urban transportation exposure study. Environmental Science & Technology 49, 597-605 (2015). [↩] [↩] [↩]
- Y. Zhu, A. Eiguren-Fernandez, W. C. Hinds, A. H. Miguel. In-cabin commuter exposure to ultrafine particles on Los Angeles freeways. Environmental Science & Technology 41, 2138-2145 (2007). [↩] [↩] [↩] [↩] [↩]
- D. Wei, A. Löfvendahl. HEPA filters to improve vehicle cabin air quality–advantages and limitations. AIVC (2023). [↩]
- Not a Tesla App. Tesla Bioweapon Defense Mode: What It Is and How It Works https://www.notateslaapp.com/tesla-reference/1273/tesla-bioweapon-defense-mode-what-it-is-and-how-it-works (2023). [↩]
- S. S. Park., K. Kozawa, S. Fruin, S. Mara, Y. K. Hsu, C. Jakober, A. Winer, J. Herner. Emission factors for high-emitting vehicles based on on-road measurements of individual vehicle exhaust with a mobile measurement platform. Journal of the Air & Waste Management Association 61, 1046-1056 (2011). [↩]
- L. Gong, B. Xu, Y. Zhu. Ultrafine Particles Deposition Inside Passenger Vehicles. Aerosol Science and Technology 43, 544–553 (2009). [↩]


