
Abstract
Pulse shape discrimination (PSD) is a critical technique for suppressing background events in high-purity germanium (HPGe) detectors. The LEGEND collaboration, in particular, searches for neutrinoless double beta decay ( ) using
  Ge detectors. The
  parameter is frequently used as a method of PSD, showing promising results in the rejection of multi-site, p+, and n+ events. However, a systematic study of how various front-end electronics settings affect this parameter’s PSD performance remains lacking. This study addresses this gap by investigating the impact of electronic response parameters on discrimination power. Realistic models of charge-sensitive amplifier responses, low-pass filters, and noise were applied on simulated charge pulses from
  Tl events in Ge detectors. The effects of these parameters on and pulse shape parameters were then studied. Simulations were implemented using Python with well-established signal processing techniques. Optimal discrimination was observed for low-pass cutoff frequencies near 3-5 MHz. Additionally, excessive filtering and electronic ringing significantly degraded discrimination and the corresponding cut’s figure of merit. The triangle filter’s rise time and noise amplitude were also found to strongly affect PSD effectiveness. These findings provide additional direction for tuning LEGEND-200 electronics to maximize background rejection. Improved awareness of these dependencies improves event classification and increases sensitivity to rare single-site event signals.
Keywords: Neutrinoless double beta decay, pulse shape discrimination, LEGEND Collaboration, electronic response functions.
Introduction
Background and Motivation
Double beta decay is a rare nuclear process in which a nucleus converts two neutrons into two protons while maintaining its mass number. It occurs in two modes: two-neutrino double beta decay ( ), which has been observed experimentally1, and neutrinoless double beta decay (), which has not2.
Discovery of would confirm the Majorana nature of neutrinos, implying they are their own antiparticles2 and that lepton number is violated. Such a result would have profound implications for the matter–antimatter asymmetry of the universe and the absolute neutrino mass scale, since the decay rate is linked to the effective Majorana mass3,4,5.
The physics reach of searches depends on suppressing backgrounds while retaining signal efficiency. In HPGe detectors, this relies on pulse shape discrimination (PSD), whose performance is set by the readout electronics. Thus, electronics tuning is directly tied to the sensitivity of these experiments.
Experimental Signatures and Isotope Choices
The experimental signature of is given by a singular peak at the energy, or Q-value, of the decay on the energy spectrum of the summed electron energies (since the two electrons carry all the decay energy in ). This differs from the signature of , which is a spectrum of energy levels resulting from the emission of two antineutrinos that share the available decay energy with the electrons. In recent years, many programs have launched initiatives with the goal of a observation in isotopes such as  6,7,
6,7,  8,9,10,
  11,12, and
  13,14. Each isotope has a respective
  , which is a crucial consideration in choosing which isotope to potentially observe this process in, as a higher typically indicates lower backgrounds.
The LEGEND Collaboration
The LEGEND (Large Enriched Germanium Experiment for Neutrinoless Double Beta Decay) collaboration searches for in , with  keV15,16. Building on GERDA and MAJORANA DEMONSTRATOR6,7, LEGEND proceeds in two phases: LEGEND-200, now operating at LNGS with 200 kg of enriched detectors17, and LEGEND-1000, which will scale to 1000 kg15. A central challenge is distinguishing true single-site events (SSE) from gamma-induced multi-site events (MSE), a dominant source of background18. Pulse shape discrimination, especially through the parameter—the ratio of maximum current amplitude to total energy—remains the primary technique for suppressing MSE19,20.
However, the effectiveness of is not intrinsic to the crystal alone but strongly depends on the readout electronics. Variations in charge-sensitive amplifier design, filter cutoff frequencies, shaping times, and noise coupling can distort , shifting thresholds and broadening SSE/MSE distributions. Despite its importance, no systematic study has quantified how these electronic response parameters influence PSD in HPGe detectors. Since LEGEND’s sensitivity depends directly on maximizing background rejection while retaining  of SSE, even modest degradation in separation reduces the attainable half-life reach. This work addresses this gap by systematically simulating how electronics response shapes discrimination in LEGEND-style detectors.
Scope
This study addresses this gap by simulating charge pulses from Ge double-beta decay events and systematically varying electronic response and signal processing parameters, including low-pass filter cutoff frequency, triangle filter rise time, and noise levels. The effects of these parameters on A/E distributions and pulse shape features are then studied, providing additional information regarding the optimization of electronics settings for maximal event discrimination power in LEGEND and similar experiments.
Methods
Event Data and Signal Construction
For PSD optimization  Tl
Tl  rays were used from a
  Th source. The 2615~keV transition produces the Double Escape Peak (DEP,
  1593~keV), Single Escape Peak (SEP, 2103~keV), and Full Energy Peak (FEP, 2615~keV)21. DEP events are dominated by single-site energy depositions, while SEP and FEP are enriched in multi-site interactions. This clear contrast provides well-defined samples for training and testing PSD, where the goal is to efficiently retain single-site events while rejecting multi-site backgrounds. A set of simulated Tl event waveforms was obtained from prior Monte Carlo studies of energy depositions in LEGEND-200 detectors22. For each event, the deposited charge as a function of time,
  , was provided. These signals were padded with a zero baseline until 45000 ns, then padded with the maximal charge value to best replicate real signals. The corresponding current waveform was calculated via numerical differentiation, and it can be viewed in Figure 1.

Detector Impulse Response Functions
To model the detector readout chain, each input current signal was convolved with an impulse response,  , representing the front-end charge-sensitive amplifier and associated shaping electronics.
The total response function is the convolution:
![\[h_{\mathrm{CSA}}(t) = h_{\mathrm{FB}}(t) * h_{\mathrm{LP}}(t)\]](https://nhsjs.com/wp-content/ql-cache/quicklatex.com-e4e2c0be30e69593ee3695de8157a1bd_l3.png "Rendered by QuickLaTeX.com")
where  is the feedback decay response and
  is the low-pass filter response.
Feedback Decay Response:
The feedback network (parallel  and
and  ) is modeled as a single-pole exponential decay21:
![\[h_{\mathrm{FB}}(t) = \frac{1}{\tau_f} e^{-t/\tau_f},\quad \text{for } t \geq 0\]](https://nhsjs.com/wp-content/ql-cache/quicklatex.com-48a0f7e3c5330a0896c8e79aa8eca874_l3.png "Rendered by QuickLaTeX.com")
where  is the decay time constant. Here
  ms, which is much longer than the 100 ns rise time of the signals. This parameter controls the long tail decay of the CSA output, and was chosen to be much longer than the rise time of the signals such that it does not distort short-timescale pulse features and allows the trapezoidal filter to provide an unbiased energy estimate. It essentially acts as a pole–zero correction, flattening the waveform top so that the trapezoidal filter can provide an unbiased energy estimate.
Second-Order Butterworth Low-Pass Response:
The dominant signal shaping is modeled by a second-order Butterworth low-pass filter with cutoff frequency  23:
23:
![\[h_{\mathrm{LP}}(t) = \frac{\sqrt{2}}{\tau} \sin\left( \frac{t}{\sqrt{2}\tau} \right) e^{-t/(\sqrt{2}\tau)},\quad \text{for } t \geq 0\]](https://nhsjs.com/wp-content/ql-cache/quicklatex.com-151a35ef39fb08189c325f93cb4ca99a_l3.png "Rendered by QuickLaTeX.com")
where the shaping time,  . This filter was chosen as it provides stronger high-frequency suppression than a first-order RC while remaining analytically simple for isolating cutoff effects. The typical cutoff frequency incorporated in LEGEND-200 ranges on the order of a few MHz, and is one of the parameters that will be modified in this study. The final impulse response of the CSA is normalized such that it has unit area.
Waveform Generation and Electronic Noise}
The output CSA waveform,  , is calculated as:
![\[V_{\mathrm{CSA}}(t) = I_{\mathrm{in}}(t) * h_{\mathrm{CSA}}(t)\]](https://nhsjs.com/wp-content/ql-cache/quicklatex.com-be5f4633fa1107d980e2adfcdb5a3343_l3.png "Rendered by QuickLaTeX.com")
To simulate experimental conditions, additive Gaussian noise with amplitude  was included, with ranging from
  to
to  a.u., levels
  the CSA waveform’s height. This low amplitude reflects the excellent noise performance of HPGe detector electronics, which is essential for achieving superior energy resolution in rare event searches like neutrinoless double-beta decay15. Also, a sinusoidal “ringing” noise term of frequency
  and amplitude
  was superimposed to model electronic pickup.
Digital Filtering and Feature Extraction
To determine the parameter, the energy  for each event was first estimated by applying a digital trapezoidal filter to . The trapezoidal filter estimates the peak of the pulse over a specified shaping interval by averaging the signal and subtracting delayed copies of itself, resulting in a flat-topped output whose maximum value is proportional to the total deposited charge (and thus the energy of the event)24. This requires two parameters: the rise time (how long the filter takes to peak) and the flat-top time (how long the filter stays at its peak), which were chosen to be 4
  s and 2.5 s, respectively. At the sampling step of
  ns, these correspond to
  samples and
  samples. The trapezoidal filter can be expressed recursively as:
![\[Y[k] = Y[k-1] + x[k] - x[k-L_{\text{trap}}],\]](https://nhsjs.com/wp-content/ql-cache/quicklatex.com-4f11153c17730e170f60dbfbb2b0af77_l3.png "Rendered by QuickLaTeX.com")
![\[S_{\mathrm{trap}}[k] = \tfrac{1}{L_{\text{trap}}}\big(Y[k] - Y[k-G_{\text{trap}}-L_{\text{trap}}]\big)\]](https://nhsjs.com/wp-content/ql-cache/quicklatex.com-ac5351922cfb8179922a437cbe7d9e28_l3.png "Rendered by QuickLaTeX.com")
where ![x[k]](https://nhsjs.com/wp-content/ql-cache/quicklatex.com-6796c909001594da892f2d533d18ddb9_l3.png "Rendered by QuickLaTeX.com") is the discrete CSA waveform,
is the discrete CSA waveform, ![Y[k]](https://nhsjs.com/wp-content/ql-cache/quicklatex.com-e06d2a3c58209082457658409b4bf0de_l3.png "Rendered by QuickLaTeX.com") is the running sum over the last
is the running sum over the last  samples (boxcar integrator),
  is the rise (or integration) time, and
  is the flat-top (or gap) time21. The FIR kernel is equivalent to the difference of two length- boxcars separated by
  samples.
A triangular filter was then applied on the trapezoidal filter’s output to extract the shaped value of the maximal current amplitude,  . This method is often used in experiments to approximate the point-to-point derivative of the CSA output. The triangle filter is mathematically equivalent to a trapezoidal filter with no flat top time, acting as a finite difference operator24. For the triangular filter, the rise length was varied from
  to
to  samples (16–240 ns). The recursion was implemented as:
![\[T[k] = T[k-1] + S[k] - S[k-2L_{\text{tri}}]\]](https://nhsjs.com/wp-content/ql-cache/quicklatex.com-80c5e55f47df5147dccbc05d40e18977_l3.png "Rendered by QuickLaTeX.com")
![\[S_{\mathrm{tri}}[k] = \tfrac{T[k]}{2L_{\text{tri}}}\]](https://nhsjs.com/wp-content/ql-cache/quicklatex.com-60a315bf7d7422641537426eb3dfd6ef_l3.png "Rendered by QuickLaTeX.com")
This corresponds to convolution with a symmetric triangular kernel of width  . The rise time of the triangle filter ideally should be as short as possible, being 1 sample (or 16 ns) for the best approximation of a derivative. However, the effect of noise on the triangle filter output is amplified with a shorter rise time, causing an eventual trade-off for a larger rise time at high-enough noise levels.

A/E Distribution and Pulse Shape Discrimination
The value has been frequently used as a method of pulse shape discrimination since it is systematically lower for MSE when compared to SSE25,26. This occurs because MSE pulses rise more slowly and are spread out in time, reducing the peak value measured by the triangle filter relative to the pulse’s total energy. As such, when an A/E histogram was constructed for large ensembles ( ) of simulated events, it’s expected that the histogram sees a sharp peak at a higher value representing the peak of the SSE distribution. Figure 3 shows the generated distribution, which forms the basis for event selection.
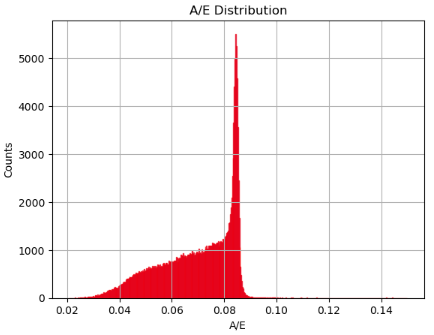 values for all simulated events. peak corresponds to high number of SSE at that value.
Event Classification and Energy Resolution
DEP/SEP/FEP events were classified directly from the true deposited energies in the Monte Carlo, yielding distinct peaks without overlap from other lines. For Tl-208, these categories correspond to energy depositions at approximately 1593 keV (DEP), 2102 keV (SEP), and 2615 keV (FEP), respectively21. DEP events are predominantly single-site (SSE), whereas SEP and FEP events are primarily multi-site (MSE) due to the involvement of annihilation photons. This allows the use of energy deposition as an accuracy metric of the discrimination power while certain parameters are changed. Figure 4 shows the classification of events based on their energy deposition. These peaks can be ignored for the purposes of this study, as the focus lies on event-based discrimination using only the DEP, SEP, and FEP regions.
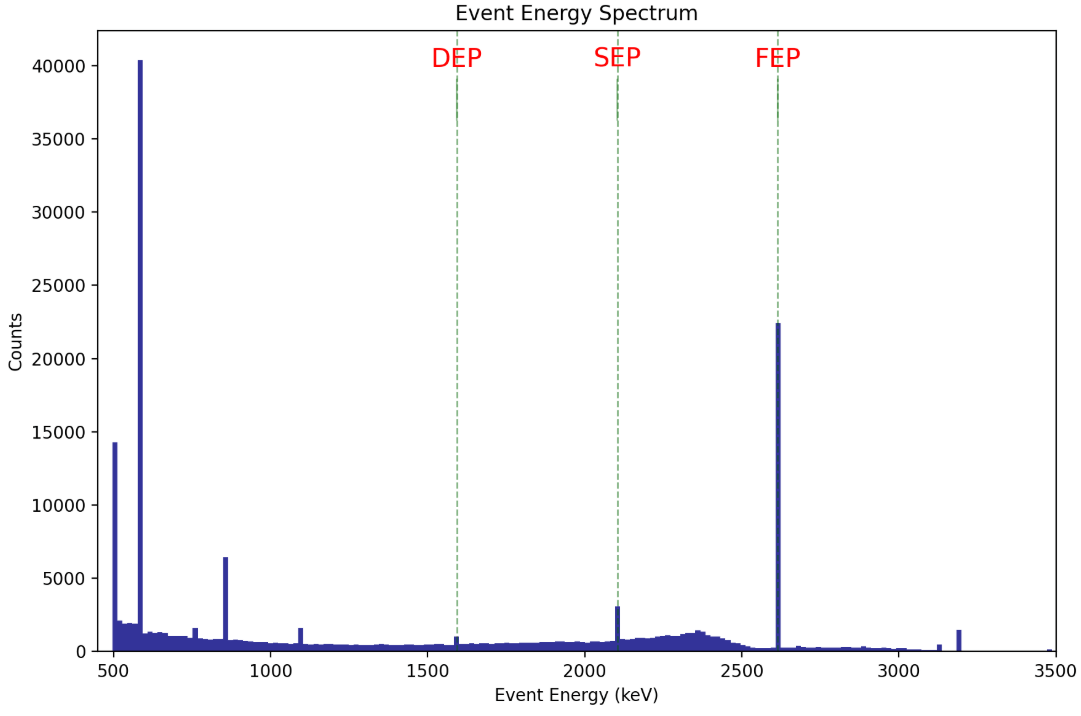
Figure of Merit Determination and Optimization
Once the energy deposition spectrum was created, an energy mask of  keV was produced around the DEP, SEP, and FEP peaks to fully capture the peaks and minimize contamination from other lines and fully isolate SSE/MSE events. The
  ~keV energy window is wide enough to contain all simulated peak populations, while remaining narrow enough to suppress contributions from the surrounding Compton continuum and unrelated events. Table 1 summarizes the sensitivity of events counted for each mask width.
| Peak | ±2 keV | ±5 keV | ±10 keV |
| DEP | 582 | 793 | 1142 |
| SEP | 2436 | 2791 | 3285 |
| FEP | 21232 | 22312 | 22473 |
 , , and
  keV selection windows for DEP, SEP, and FEP
Additional peaks in the spectrum arise from other gamma-ray emissions of Tl-208, as well as other annihilation processes within the detector. Figure 5 shows the resulting histogram when all other energy events are filtered and each event is properly classified. There is quite a significant overlap between the values of SSE and MSE events, so this study also investigates factors that would help reduce this overlap and therefore better signal discrimination.
 histogram.
A commonly used Figure of Merit (FoM) in PSD studies was used to quantify how well the DEP/SSE events were discriminated from background/MSE events, given by:
![\[\mathrm{FoM} = \frac{\text{Signal Acceptance}}{\sqrt{\text{Background Acceptance}}}\]](https://nhsjs.com/wp-content/ql-cache/quicklatex.com-85b2bf6157c6a9fd5b99e3bdd9298a13_l3.png "Rendered by QuickLaTeX.com")
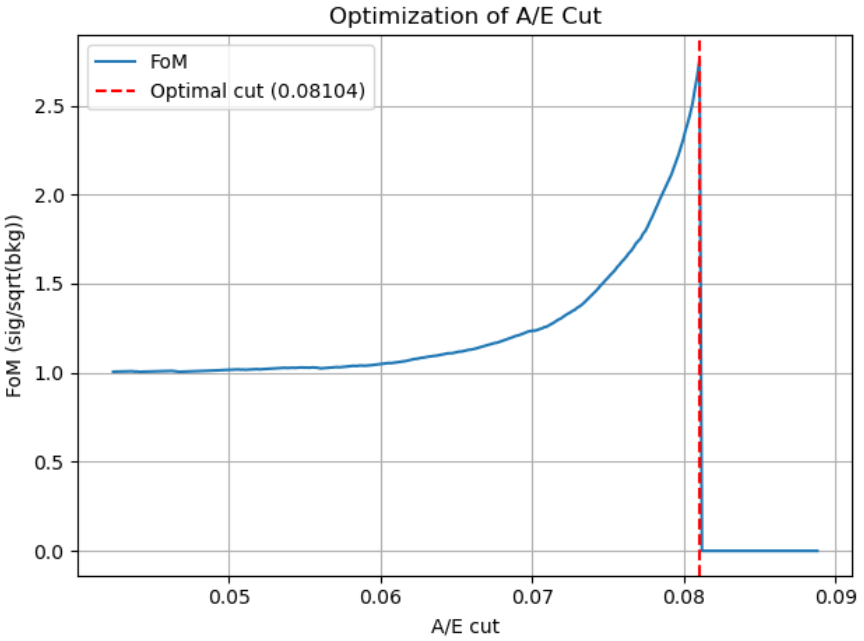
where signal acceptance corresponds to the fraction of DEP events retained after an cut (eliminating all events greater than a certain value), and background acceptance to the fraction of SEP and FEP events that survived the threshold. This formula is widely used in the context of rare-event searches27.
Other formulas were also tried, but this expression provided the most reasonable signal acceptance while keeping the background acceptance relatively low. A higher FoM indicates better event discrimination, with the overall goal of PSD to maximize the FoM. For each set of parameters, various cuts were iterated, providing an optimization curve as seen in Figure 6. A minimum signal acceptance of 0.85 was implemented to ensure that the FoM was not too heavily weighted by an unnecessarily small background acceptance. This aligns with typical values used in LEGEND, which aims for ~90% signal efficiency and 5-10% background efficiency.15 The maximal FoM value was then compared across different sets of parameter values, with the greatest FoM value among those being ideal.
 cuts.
cuts.A full range of parameters tested in this study can be found in Table 2.
| Parameter | Range | Step Size |
| 1.0 – 10.0 MHz | 0.1 MHz |
 | 16 – 240 ns | 16 ns |
| 4 s | Fixed |
| 2.5 s | Fixed |
 | 0,  – –  | Decade Steps |
| 0.009 a.u. | Fixed |
| 0 – 3.6 MHz | 0.025 MHz |
Results
CSA Overshoot
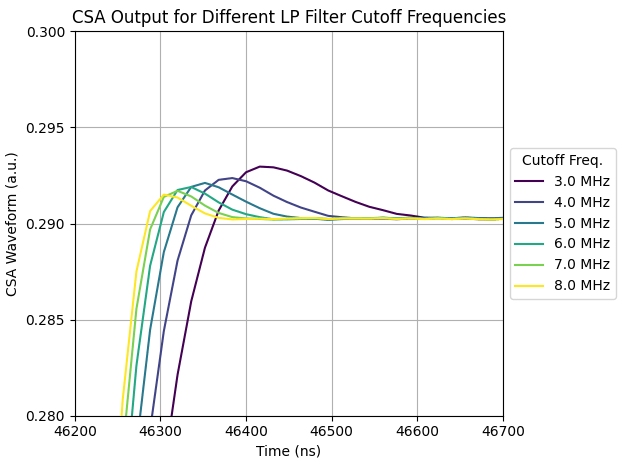
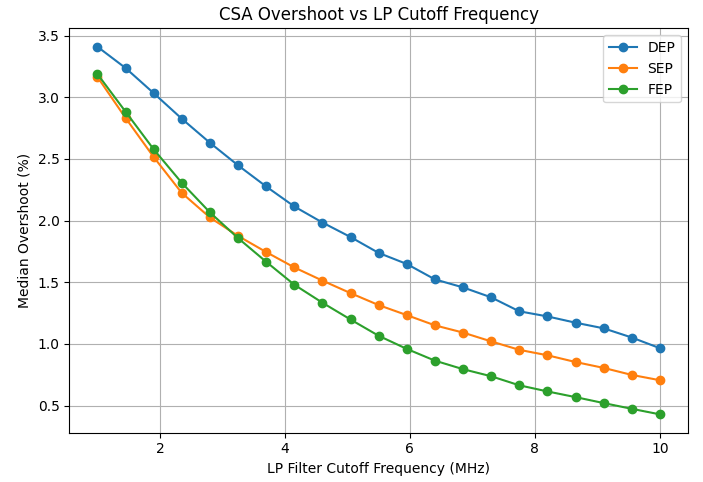
Varying the low-pass filter cutoff frequency significantly alters the pulse shape characteristics and the distribution. One noticeable aspect of the CSA waveform was the initial overshoot peak. When testing different parameters’ effects on this overshoot, the low-pass filter’s cutoff frequency exacerbated this occurrence with lower cutoff frequencies. Figure 7 shows the CSA outputs for varying cutoff frequencies, and Figure 8 quantifies the median of this overshoot for different types of events. For example, DEP overshoot decreases from about 3% at 1 MHz to below 1% at 10 MHz, with SEP and FEP following the same trend. The uncertainties on these medians are <0.1% and do not affect the observed monotonic trend.
The overshoot is shown to be systematically greater for SSE (DEP events) compared to MSE (SEP and FEP events). This is expected because the low-pass filter is less capable of keeping up with the rapid and steep rise of single-site events, resulting in a more pronounced overshoot. In contrast, multi-site events typically produce slower pulses, which are less affected by the filter’s limited response time. Since there is a noticeable effect of the low-pass filter on the overshoot, the effects of this parameter on the FoM were then studied as the overshoot potentially modifies the value of .
Impact of Low-Pass Filter Cutoff Frequency
For each different cutoff frequency, an histogram, like the one in Figure 5, was produced. The median for each type of event (DEP, SEP, and FEP) was then measured and plotted against cutoff frequency, as seen by Figure 9. A greater difference between SSE and MSE medians indicates better discrimination between the two events, and it appears this difference is optimized past approximately 5 MHz. A FoM analysis was then conducted with this same variable to produce Figure 10, yielding two distinct peaks near 3 MHz and 5.4 MHz.
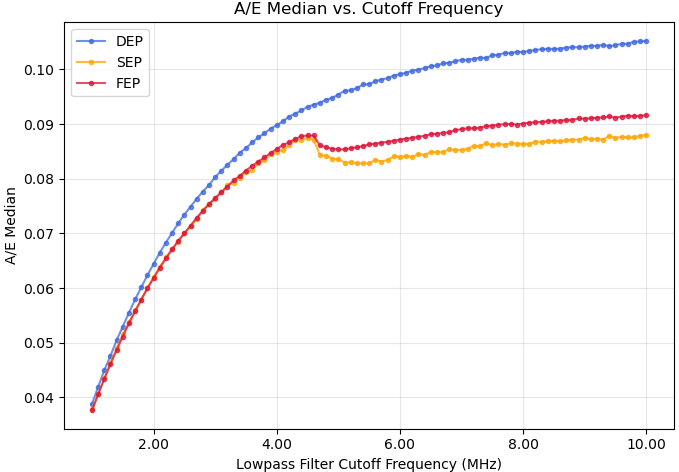 median for different cutoff frequencies while simultaneously manipulating the type of event.
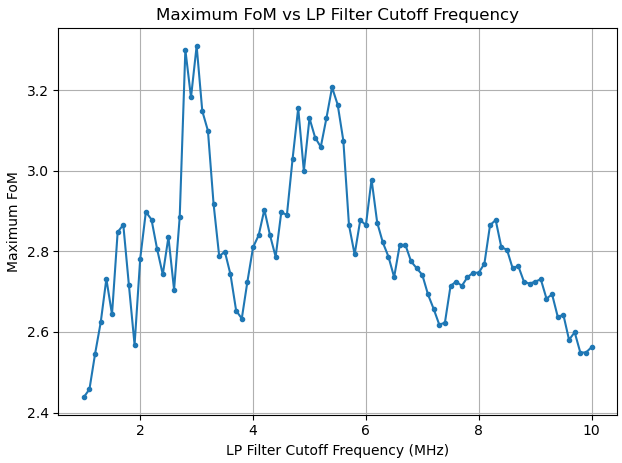
These optimal values arise because lower cutoff frequencies stretch out the fast SSE pulses and reduce the extracted peak current , while higher cutoffs transmit additional high-frequency components that broaden the distribution. The MHz-scale maxima therefore reflect the balance between preserving SSE edge sharpness and limiting waveform distortion. To validate the findings from the FoM analysis, a plot of signal efficiency vs. cutoff frequency was incorporated at a fixed background acceptance of 7.5%, yielding Figure 11.

Triangle Filter Rise Time Optimization
Acting as a point-to-point derivative of the CSA output with a rise time of only 1 sample (16 ns), a triangle filter’s rise time – under the presence of no noise – should ideally always be as short as possible. However, under the presence of noise, there’s a balance that must be achieved: very short rise times act like near point-to-point derivatives, which maximize sensitivity to SSE edges but also make the output highly sensitive to random noise. Longer rise times suppress those fluctuations by averaging over more samples, but at the cost of smearing the true peak current . The observed maximum FoM then reflects the compromise between noise averaging and signal fidelity, and that tradeoff can be viewed in Figure 12.
Table 3 demonstrates how noise (amplitude represents standard deviation of gaussian-appproximated noise) degrades PSD performance, but a further study should be conducted into measuring realistic noise from HPGe detectors and providing a standardized model of the varying sources.

| Noise Amplitude | Best FoM | Rise Time (ns) |
| 0 | 3.0991 | 16 |
| 5e-6 | 3.0833 | 16 |
| 5e-5 | 2.7262 | 48 |
| 5e-4 | 2.7877 | 16 |
| 5e-3 | 2.0946 | 96 |
| 5e-2 | 1.1811 | 224 |
Ringing Response Function
Oscillatory (‘ringing’) features in the output response of HPGe charge-sensitive amplifiers can arise from under damped electronic response functions, parasitic circuit resonances, or—in some cases—pickup of high-frequency (MHz) noise from external sources. To model this, a sinusoidal ringing term with variable frequency and amplitude was added to the CSA long-tail feedback response function, given by:
![\[h_{\mathrm{ring}}(t) = e^{-t/\tau_1} + A_{\mathrm{ring}}, e^{-t/\tau_2} \sin\left(2\pi f_{\mathrm{ring}}, t\right)\]](https://nhsjs.com/wp-content/ql-cache/quicklatex.com-c1550eb573d755c2e6a9e69d3a7d4f29_l3.png "Rendered by QuickLaTeX.com")
where  is the main decay constant (3 ms),
  is the damping time of the ringing (50 s),
  is the amplitude of the oscillatory term (0.009 a.u.), and
  is the ringing frequency. The sinusoidal model reflects how underdamped circuits and external MHz pickup appear in HPGe electronics as damped oscillations, capturing the main frequency and amplitude of the ringing without modeling full circuit complexity.
 FoM.
FoM.Discussion
Summary of Results
This study systematically investigated how variations in electronic response parameters—including low-pass filter cutoff frequency, triangle filter rise time, and simulated electronic ringing—affect the performance of pulse shape discrimination (PSD) in LEGEND-200 HPGe detector signals. Errors on signal and background acceptance were estimated by counting statistics, using the standard formula  , where
  is the measured fraction, and
  is the number of events. Typical statistical uncertainties were about 1–3% due to the large number of events sampled. Using Monte Carlo simulations of Tl events, the following key results were obtained:
- Novel observation of CSA overshoot: A systematic “overshoot” in the CSA output tail was observed when lowering the low-pass filter cutoff frequency, most pronounced for SSE events. The overshoot magnitude increased at lower bandwidths, especially for rapid-rising SSE signals, and diminished at higher cutoffs. This effect directly altered the distribution and, by extension, discrimination power.
- Discrimination power maximized at MHz-scale cutoffs: The Figure of Merit (FoM) for A/E-based PSD was maximized at low-pass filter cutoff frequencies above 5~MHz, with two broad peaks observed around 3~MHz and 5.4~MHz. The FoM increased by up to 40% relative to sub-MHz settings. This relative increase corresponds to nearly a factor-of-two reduction in surviving background acceptance at fixed signal efficiency (e.g., at 85% SSE acceptance, MSE leakage is reduced by approximately 50%). Thus, even small relative improvements in FoM have a significant practical impact on PSD performance.
- Triangle filter rise time: The PSD performance depended sensitively on the rise time of the triangle filter. Optimal FoM values of 16 and 48 ns were found for noise levels similar to those in HPGe detectors.
- Impact of electronic ringing: Simulating a damped, sinusoidal “ringing” term in the CSA response revealed that ringing frequencies near 1–2~MHz led to a significant broadening of the A/E distribution and a 25% reduction in FoM. This illustrates the real risk posed by electronic pickup and mechanical coupling at specific frequencies, which can substantially undermine PSD effectiveness if not properly controlled.
- Sensitivity to shaping vs. noise: Across all tested scenarios, the tuning of electronic response functions (shaping, filtering, and ringing mitigation) had a greater impact on event discrimination than moderate variations in baseline noise amplitude. At very large, unrealistic noise amplitudes (
 a.u.), Table 3 shows that PSD performance degrades sharply; however, within the realistic LEGEND regime (
 a.u.), shaping and ringing parameters remain the dominant factors.
| Parameter | FoM Range | % Change |
| (1–10 MHz) | 1.9 – 3.1 | +63% |
| (16–240 ns) | 1.2 – 3.1 | +158% |
( — —  ) ) | 1.2 – 3.1 | +160% |
| (0–3.6 MHz) | 2.3 – 3.1 | +35% |
 .
.Interpretation and Physical Implications
The observed dependence of PSD performance on filter parameters can be attributed to the interplay between signal bandwidth, electronic noise, and pulse shape characteristics. Short triangle filter rise times enable more precise extraction of the current peak but are more susceptible to noise, explaining the observed degradation in FoM at higher noise levels. The optimal low-pass cutoff arises from the need to preserve fast signal features while minimizing noise amplification. Ringing introduces oscillatory distortions that broaden the A/E distribution, worsening signal discrimination power.
Implications for LEGEND-200 and PSD Optimization
The observed dependence of PSD performance on filter parameters can be attributed to the interplay between signal bandwidth, electronic noise, and pulse shape characteristics. Short triangle filter rise times enable more precise extraction of the current peak but are more susceptible to noise, explaining the observed degradation in FoM at higher noise levels. The optimal low-pass cutoff arises from the need to preserve fast signal features while minimizing noise amplification. Ringing introduces oscillatory distortions that broaden the A/E distribution, worsening signal discrimination power.
Limitations
Several limitations must be noted. First, the analysis is based on Monte Carlo simulated events and idealized detector geometry. Effects like charge trapping and cloud charges were not included in these simulations. The effects of cloud charges would further smear the distribution due to cloud charge repulsion and diffusion. The noise model used is also simplified and may not reflect the true spectral composition of noise sources in experimental setups. Also, the detector response function was only an approximation that simplified the incredibly complex electronics makeup of HPGe detectors. There is currently not a widely standardized response function for these detectors, as it is an ongoing work of study.
Future Work
Future efforts should focus on incorporating measured noise traces from operating HPGe detectors to develop a more realistic noise model. Additionally, investigating a more accurate response function using circuit analysis of the LEGEND-200 CSA would be incredibly valuable. Further studies could also explore the impact of these variables on the alternative late-charge (LQ) PSD parameter28. Incorporating sideband subtraction to improve the classification of DEP/SEP/FEP events is also recommended. Finally, future studies should include parasitic capacitances and inductances in their electronic models to assess their impact on PSD performance.
Conclusion
In summary, this work demonstrates the sensitivity of A/E-based PSD and pulse shape features, to the details of electronic response in HPGe detectors. The findings provide actionable guidance for electronics optimization in LEGEND-200 and similar experiments, emphasizing the need for careful control of noise, filter parameters, and pickup mitigation to achieve maximal background rejection and sensitivity to rare event signals.
Acknowledgements
This research wouldn’t have been possible without the crucial support of Dr. Reyco Henning and the entire Experimental Nuclear and Astroparticle Physics (ENAP) Group at UNC Chapel Hill.
References
- S. R. Elliott, A. A. Hahn, and M. K. Moe, Direct evidence for two-neutrino double-beta decay in , Phys. Rev. Lett. 59, 2020 (2008). [↩]
- E. Majorana, Teoria simmetrica dell’elettrone e del positrone, Nuovo Cim 14, 171 (1937). [↩] [↩]
- M. Fukugita, T. Yanagida, Baryogenesis without grand unification, Phys. Letter B 174, 45 (1986). [↩]
- M. Agostini, G. Benato, J. A. Detwiler, J. Menéndez, and F. Vissani, Toward the discovery of matter creation with neutrinoless
 decay, Rev. Mod. Phys. 95, 025002 (2023). [↩]
 - J. Schechter and J. W. F. Valle, Neutrinoless double-
 decay in SU(2)
 U(1) theories, Phys. Rev. D 25, 2951 (1982). [↩]
 - MAJORANA Collaboration, Final Result of the MAJORANA DEMONSTRATOR’s Search for Neutrinoless Double- Decay in , Phys. Rev. Lett. 130, 062501 (2023). [↩] [↩]
- GERDA Collaboration, Final Results of GERDA on the Search for Neutrinoless Double- Decay, Phys. Rev. Lett. 125, 252502 (2020). [↩] [↩]
- AMoRE Collaboration, Improved Limit on Neutrinoless Double Beta Decay of from AMoRE-I, Phys. Rev. Lett. 134, 082501 (2025). [↩]
- CUPID Collaboration, Final results on the decay half-life limit of from the CUPID-Mo experiment, Eur. Phys. J. C 82, 1033 (2022). [↩]
- NEMO Collaboration, Results of the search for neutrinoless double- decay in with the NEMO-3 experiment, Phys. Rev. D 92, 072011 (2015). [↩]
- CUPID Collaboration, Final Result on the Neutrinoless Double Beta Decay of with CUPID-0, Phys. Rev. Lett. 129, 111801 (2022). [↩]
- NEMO Collaboration, Final results on double beta decay to the ground state of
 from the NEMO-3 experiment, Eur. Phys. J. C 78, 821 (2018). [↩]
 - CUORE Collaboration, With or without
 ? Hunting for the seed of the matter-antimatter asymmetry, (2024). [↩]
 - CUORE Collaboration, Search for Majorana neutrinos exploiting millikelvin cryogenics with CUORE, Nature 604, 53 (2022). [↩]
- LEGEND Collaboration, The Large Enriched Germanium Experiment for Neutrinoless Decay: LEGEND-1000 Preconceptual Design Report, (2021). [↩] [↩] [↩] [↩]
- B. J. Mount, M. Redshaw, and E. G. Myers, Double- decay Q-values of
 and , Phys. Rev. C 81, 032501 (2010). [↩]
 - L. Baudis, G. Benato, E. M. Bond, P. J. Chiu, S. R. Elliott, R. Massarczyk, S. J. Meijer, and Y. Müller, Calibration sources for the LEGEND-200 experiment, JINST 18, P02001 (2023). [↩]
- GERDA Collaboration, Modeling of GERDA Phase II data, JHEP 2020, 139 (2020). [↩]
- GERDA Collaboration, Pulse shape analysis in Gerda Phase II, Eur. Phys. J. C 82, 284 (2022). [↩]
- MAJORANA Collaboration, Multisite event discrimination for the MAJORANA Demonstrator, Phys. Rev. C 99, 065501 (2019). [↩]
- G. F. Knoll. Radiation Detection and Measurement, 4th Ed., Wiley (2010). [↩] [↩] [↩] [↩]
- S. Giri, Emulating PSD Parameters using IQN, Pulse Shape Simulation Workshop, University of Zurich (2010). [↩]
- S. Butterworth, On the Theory of Filter Amplifiers, Experimental Wireless and the Wireless Engineer 7, 536 (1930). [↩]
- V. Radeka, Trapezoidal Filtering of Signals from Large Germanium Detectors at High Rates, IEEE Trans. on Nucl. Sci. 19, 412 (1972). [↩] [↩]
- GERDA Collaboration, Modeling of GERDA Phase II data, JHEP 2020, 139 (2020). [↩]
- GERDA Collaboration, Pulse shape analysis in Gerda Phase II, Eur. Phys. J. C 82, 284 (2022). [↩]
- S. P. MacMullin, Elastic and inelastic scattering of neutrons from neon and argon: Impact on neutrinoless double-beta decay and dark matter experimental programs, Ph.D. thesis, University of North Carolina at Chapel Hill (2013). [↩]
- MAJORANA Collaboration, Final Result of the MAJORANA DEMONSTRATOR’s Search for Neutrinoless Double- Decay in , Phys. Rev. Lett. 130, 062501 (2023). [↩]


