
Abstract
Breast cancer is the second leading cause of cancer death in women worldwide. This study examines the risk factors of breast cancer and hormone replacement therapy (HRT) usage using the Breast Cancer Surveillance Consortium (BCSC) dataset. Random forest and decision tree machine learning models were employed to assess predictive factors and inform personalized treatment strategies. Key variables, including age, race/ethnicity, family history, age at menarche, age at first birth, breast density, HRT usage, menopausal status, and BMI, were analyzed to predict breast cancer risk. The study hypothesized that menopausal status would be the primary risk factor influencing HRT usage and that the Random Forest model would achieve higher accuracy than the Decision Tree model. In evaluating these models, the Decision Tree identified menopausal status as the leading predictor of HRT use among breast cancer patients. However, both models performed similarly, each achieving an accuracy of 93%, indicating that the simpler Decision Tree model was equally effective for this dataset. The insights gained from this study provide a strong foundation for more personalized breast cancer treatment approaches. They also enable healthcare providers to assess individual risk better and make informed decisions about HRT use. Through this machine-learning approach, treatment plans can be more precisely tailored, potentially improving patient outcomes by addressing unique risk profiles and optimizing care.
Introduction
Breast cancer is a multifactorial disease1 caused by genetic, hormonal, environmental, and lifestyle factors combined2 It is also highly heterogeneous and separated into several subtypes based on biological behavior, clinical manifestation, and responsiveness to treatment3. These subtypes are then classified according to the presence or absence of hormone receptors-such as estrogen and progesterone receptors-and HER2, the human epidermal growth factor receptor4. The main subtypes include the (i) HR+/ PR+ subtype, driven by the female hormones, estrogen and progesterone. Almost 70% of breast cancers are HR+. (ii) HER2+ subtype, stimulated by the human epidermal growth factor. HER2+ cancers usually grow fast, are more aggressive, and require targeted therapy. (iii) Triple-Negative Breast Cancer (TNBC): These are ER-, PR-, and HER2-, TNBC is harder to treat and is usually associated with a poorer outcome. According to the World Health Organization, an estimated 2.3 million cases of breast cancer were diagnosed in women, and 685,000 deaths resulted globally in 20205.
The progression of breast cancer is influenced by several factors which are crucial in determining risk and treatment strategies. First, genetic alterations of genes BRCA1 and BRCA2 lead to a high incidence of breast cancer. The lifetime risks for carriers of these mutations are as high as 72% for breast cancer, compared to the general population risk-about 13%6. Second, estrogen and progesterone are two major female sex hormones involved in the induction of breast cancer. Early menarche, late menopause, or HRT increases the exposure to estrogen and enhances the risk for HR+ breast cancers. Third, estrogen makes breast cells proliferate, and therapies targeted against the action of estrogen are widely applied for the treatment of HR+ breast cancers7. Other exogenous factors that also influence breast cancer risk include environmental and dietary factors, alcohol, physical inactivity, and environmental toxins6. Fourth, obesity majorly increases the risk of developing breast cancer in postmenopausal women due to the production of higher estrogen levels by adipose tissue8. Fifth, breast density is also considered one of the important risk factors for breast cancer. Dense breast tissue is when a breast contains more fibrous tissue compared to fatty tissue, thereby making tumors hard to detect through mammography and increasing the possibility of breast cancer development.9. Women with dense breasts have an increased risk of 4-6-fold in the development of breast cancer compared to those that have low breast density10. Recent meta-analyses have further confirmed that prolonged hormone replacement therapy (HRT), especially combined estrogen-progestin regimens, is associated with a significantly elevated risk of breast cancer, particularly in postmenopausal women11. These findings underscore the need for better understanding and surveillance of HRT-related risk patterns in clinical populations.
Medical databases are growing rapidly and accumulating data from measurements, examinations, prescriptions, and other sources. The volume of the data has outpaced traditional methods of analyzing it. Consequently, advanced tools are needed to extract useful information from the vast data. This study examined publicly available risk factors datasets from the BCSC using machine learning models to analyze the multifactorial behavior of breast cancer, particularly the impact of HRT and other related factors including only participants with complete data.
Breast cancer involves a wide range of biological and demographic factors that often interact in complex ways. Traditional statistical methods may not fully capture these interactions, especially when the relationships between variables are nonlinear12. Machine learning models, such as Decision Trees and Random Forests, are particularly effective in this context.13 They can accommodate different types of data, identify patterns that are not immediately apparent, and reveal how multiple risk factors contribute to outcomes. This makes them a strong choice for analyzing the relationship between hormone replacement therapy and breast cancer risk.14
Recent studies have applied machine learning to breast cancer prediction with promising results. For instance, one used deep learning to model complex risk patterns15, while Yala et al. developed a hybrid imaging and clinical model for individualized prediction16. These works highlight the importance of multimodal data, which this study complements through an interpretable, clinical-data-based approach. While this study does not predict breast cancer outcomes directly, it leverages machine learning models to understand patterns in HRT usage which is an established and modifiable risk factor for breast cancer. By identifying high-risk HRT profiles, the goal is to support preventive strategies and more personalized screening approaches.
Materials and Methods
Datasets
The risk factor dataset is a publicly available dataset from BCSC. The dataset spans from 2005 to 2017, a period during which clinical practices in HRT prescribing evolved in response to studies like the WHI trials. While we did not model these temporal shifts directly, our inclusion of date-filtered data ensures representation across guideline changes. The dataset includes information from 6,788,436 mammograms in the BCSC between January 2005 and December 2017. The dataset includes participant characteristics previously shown to be associated with Breast Cancer risk such as Patient Age at the time of screening, as the risk of Breast Cancer increases exponentially with age; Breast Density, the amount of dense tissue within the breast; HRT Usage, which records whether the patient was undergoing HRT at the time of screening; Family History of Breast Cancer, as a positive family history increases the risk for Breast Cancer; Body Mass Index, as Higher BMI presents a higher risk for the development of Breast Cancer since the BMI scale is divided into classes; and Menopausal Status, as menopause whether pre- or post, influences Breast Cancer risk and the efficiency of treatment options.
The choice to include each of these variables was based on their relevance to the multifactorial nature of Breast Cancer and provided a robust base for building predictive models. The key to the different variables in the dataset is provided in Table 1.
| Variable | Description | Code Values |
| age_group_5_years | Age in 5-year groups | 1 = 18-29, 2 = 30-34, 3 = 35-39, 4 = 40-44, 5 = 45-49, 6 = 50-54, 7 = 55-59, 8 = 60-64, 9 = 65-69 |
| race_eth | Race/ethnicity | 1 = non-Hispanic white, 2 = non-Hispanic black, 3 = Asian/Pacific Islander, 4 = Native American, 5 = Hispanic, 6 = Other/mixed, 9 = Unknown |
| first_degree_hx | Family history of breast cancer in a first-degree relative | 0 = No, 1 = Yes, 9 = Unknown |
| age_menarche | Age at menarche | 0 = >14, 1 = 12-13, 2 = <12, 9 = Unknown |
| age_first_birth | Age at first birth | 0 = <20, 1 = 20-24, 2 = 25-29, 3 = >30, 4 = Nulliparous, 9 = Unknown |
| BIRADS_breast_density | BI-RADS breast density | 1 = Almost entirely fat, 2 = Scattered fibroglandular densities, 3 = Heterogeneously dense, 4 = Extremely dense, 9 = Unknown |
| current_hrt | Use of hormone replacement therapy | 0 = No, 1 = Yes, 9 = Unknown |
| menopause | Menopausal status | 1 = pre-/perimenopausal, 2 = post-menopausal, 3 = Surgical menopause, 9 = Unknown |
| bmi_group | Body mass index (kg/m²) | 1 = 10-24.99, 2 = 25-29.99, 3 = 30-34.99, 4 = 35+, 9 = Unknown |
During the data cleaning process, some adjustments were necessary. Exploratory data analysis was conducted to assess missingness, distribution of key variables, and potential outliers. For variables encoded with “9” as a missing placeholder, these were replaced with the mean of the non-missing values. Categorical distributions were reviewed for imbalance, and numerical features were plotted using histograms to check for skew. Outliers beyond 3 standard deviations were also identified, but retained unless clearly erroneous due to their clinical plausibility. The exclusion of Group 9 was crucial in ensuring the integrity of the models. Missing values could reduce the model’s ability to generalize effectively. Additionally, including incomplete data might have skewed the results and led to inaccuracies in predicting the necessity of HRT or the risk of Breast Cancer. By excluding these cases, more reliable models were created that reflect the patterns in fully documented cases.
After cleaning, a total of 341,974 valid samples remained. While this represents a small fraction of the original 6.8 million mammograms in the full Breast Cancer Surveillance Consortium dataset, it includes only those with complete and relevant clinical information for this study. The cleaned subset maintained proportional representation across menopausal status and HRT exposure groups, supporting its use as a representative sample for predictive modeling (Table 2).
| Dataset Stage | Number of Samples |
| Original dataset (aggregated) | 6,788,436 |
| After filtering for unknowns | 683,948 |
| Final training set (50%) | 341,974 |
| Final testing set (50%) | 341,974 |
Data visualization was essential in identifying patterns within the Breast Cancer dataset, particularly in understanding relationships between various risk factors. All visualizations were generated using Google Colab, utilizing Python and its libraries.
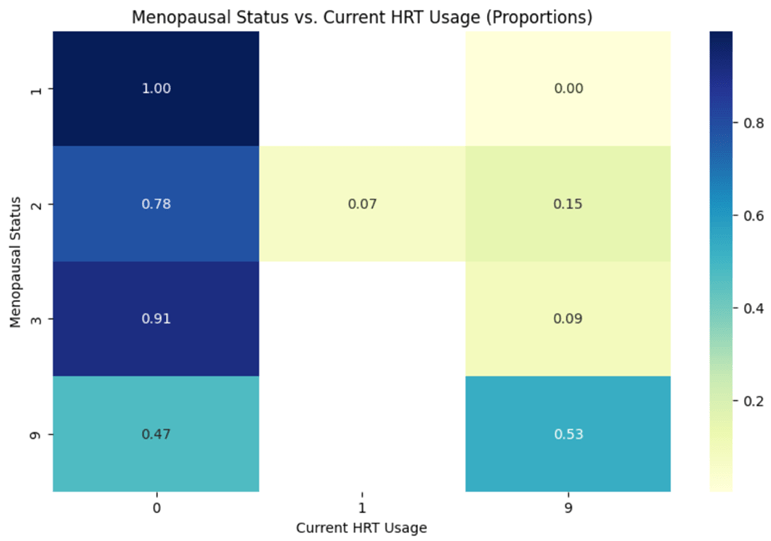
Heatmaps were created using Seaborn to visualize the relationships between risk factors, such as menopausal status and HRT usage. Data was processed and normalized using Pandas to display proportions instead of raw counts, providing a clearer understanding of the distribution of risk factors across different groups.
Histograms for key variables such as patient age, BMI, and breast density were generated using Matplotlib. These visualizations were useful for exploring the frequency distributions of these critical Breast Cancer risk factors in the dataset.
The Scikit-learn library was used in Google Colab to build both the Decision Tree and Random Forest models. DecisionTreeClassifier was employed to develop an interpretable tree structure, while RandomForestClassifier was utilized to enhance predictive accuracy and assess feature importance. The visual representations of the Decision Tree and the Random Forest were also generated using Matplotlib. Both the Random Forest and Decision Tree models were trained using a maximum depth of 3 to prioritize interpretability and prevent overfitting on a relatively small subset of filtered, imputed data. A shallow depth allows for clearer visualization of decision boundaries while maintaining reasonable classification performance. Additional parameters such as the number of estimators for Random Forest were left at default values to reduce complexity, as the goal was to explore variable influence rather than fine-tune predictive performance.
Model Selection Rationale:
Tree-based models, such as Decision Trees and Random Forests, were selected due to their interpretability, ability to handle both categorical and continuous variables, and robustness to missing data. In the context of healthcare data with complex, nonlinear relationships and potential interactions between factors (e.g., menopausal status and BMI), these models provide clear decision rules that can be interpreted by clinicians.
Preliminary testing was also conducted with logistic regression and support vector machines (SVM). However, logistic regression struggled to capture the nonlinear relationships present in the dataset, and SVMs, while more powerful in some high-dimensional contexts, were less interpretable and computationally intensive with our dataset size. Due to these considerations, tree-based models were prioritized for their balance of performance and interpretability.
Although the dataset does not contain a labeled outcome for breast cancer diagnosis, we used Random Forest and Decision Tree models to predict current HRT usage as a proxy of interest. HRT is a well-established modifiable risk factor for breast cancer, particularly in postmenopausal women using combined estrogen-progestin therapy17. Understanding its association with reproductive and demographic variables can offer indirect insights into population-level exposure risk and behavioral predictors of breast cancer risk. Predictor variables included age at menarche, age at first birth, BMI group, and menopausal status. Model performance metrics such as accuracy, precision, recall, and F1-score are reported in the Results section (Fig 6 and 7). These metrics help evaluate how effectively the models classify HRT usage, a behavior with clinical relevance in breast cancer prevention research.
Results
The BCSC risk factors data set provides information on personal factors (age, race, body mass index (BMI)), reproductive history (age at menarche, age at first birth, HRT status), and medical history (genetic predisposition, and menopausal status) from 6,788,436 mammograms in females with and without breast cancer. Group 9 represented patients for whom data was not available. Initial analysis (Fig 1, 2, 3) shows the distribution of key breast cancer risk factors, such as patient age, BMI, and breast density, and how these variables contribute to the overall risk landscape. For example, the age distribution showed a high proportion of patients in the 50-60 age range, which correlates with the peak incidence of breast cancer (Fig 1). This pattern reinforced the need for regular screenings for women in this demographic. The BMI histogram (Fig 2) revealed that a large proportion of women in the study population were classified as overweight or obese (groups 1 and 2), underscoring BMI as a major contributor to breast cancer risk. The breast density distribution also highlighted that a portion of the population had more dense breast tissue (Fig 3), making them more susceptible to breast cancer. These histograms were key in identifying the high-risk sub-populations in the dataset, guiding my recommendations for prevention strategies
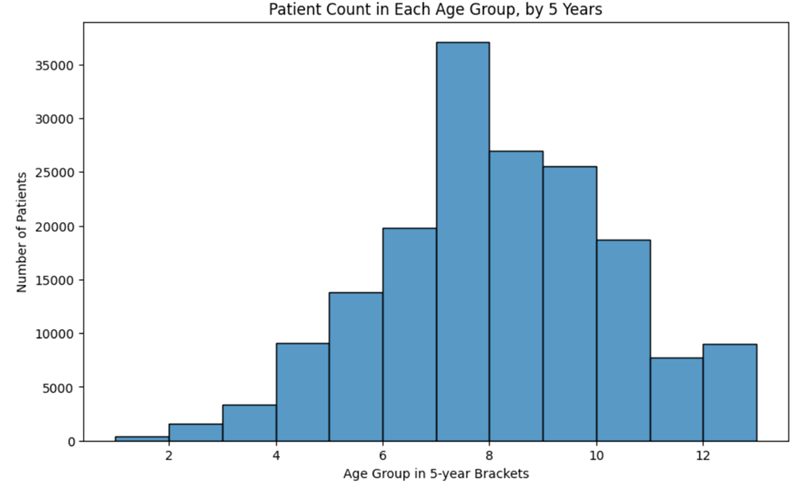
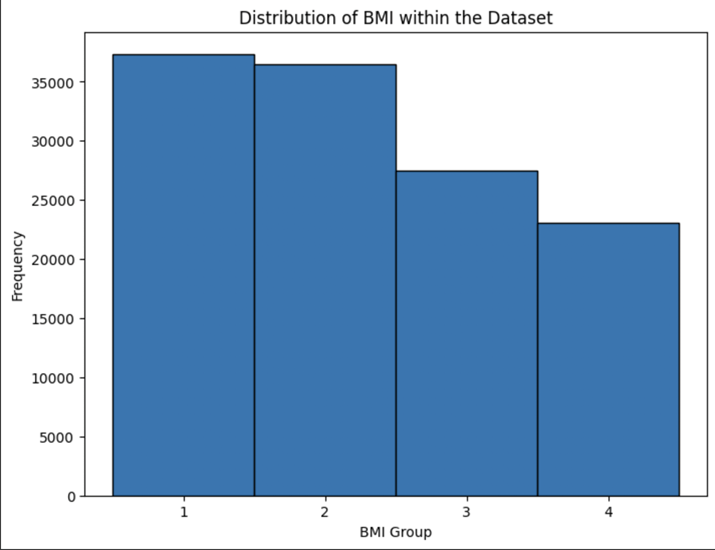
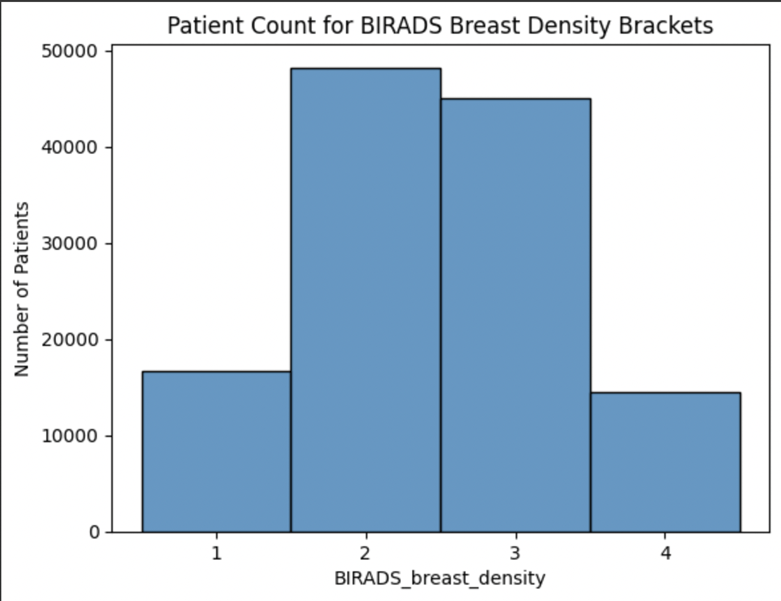
Fig 4 is a full correlation matrix showing the relationships between all input variables. Each cell in the matrix represents the correlation coefficient between two of those variables, ranging from -1 to 1. The strongest correlation was seen between age at menarche and HRT usage (0.23), supporting the hypothesis that HRT is more commonly used by postmenopausal women. Other associations included a mild correlation between age group and HRT use (0.18), and a small negative correlation between BMI and breast density (-0.11). While the correlation coefficients were generally low due to the categorical nature of the data, these relationships helped guide model development and confirmed relevant clinical patterns.
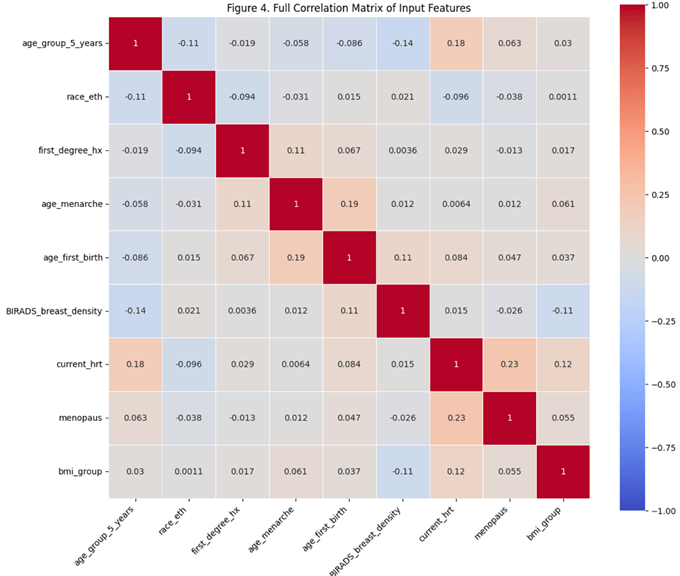
Heatmap showing pairwise Pearson correlations between the study’s variables. Variables were numerically encoded for analysis. The strongest observed relationship was between menopausal status and HRT usage (r = 0.23), with several additional low-to-moderate correlations among age group, BMI, and breast density.
In Fig 5, the strong positive correlation between menopausal status and HRT usage revealed that postmenopausal women were more likely to use HRT, a factor closely linked to an increased risk of HR+ breast cancers. This finding reinforces the importance of menopausal status as an important predictor in breast cancer risk assessment. Additionally, correlations between breast density and breast cancer risk confirmed that higher breast density complicated cancer detection and increased cancer susceptibility. The heatmaps provided visuals of these relationships that helped us focus the predictive models on these critical variables.
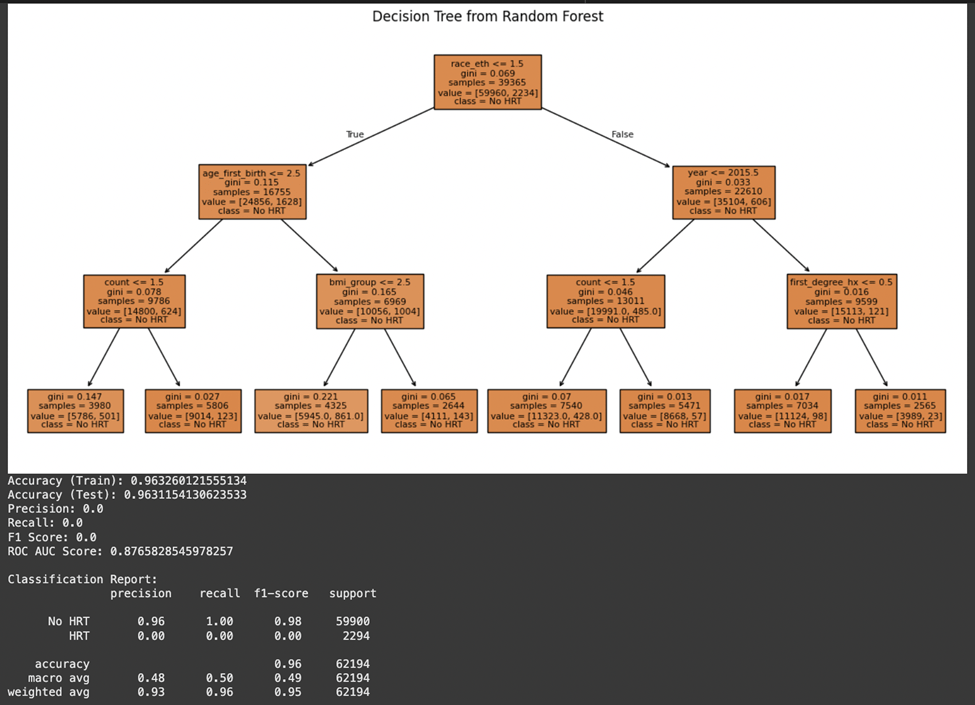
A random forest model was employed to predict the necessity for HRT in a patient based on their medical profile because of its capability to manage datasets and its resilience in handling noisy data. Variables such as menopausal status, race/ethnicity, and age of menarche that represented a patient’s physical characteristics were used based on their known associations with hormone levels and breast cancer risk. A history of breast cancer or a strong family history of the disease was a notable predictor of HRT necessity. Women with such histories were less likely to be recommended HRT, given the increased risk. Likewise, higher BMI and specific physical features, like breast tissue were associated with a higher probability of needing HRT, especially for addressing menopausal symptoms. The model also considered the patient’s menopausal status and age group, with postmenopausal women in specific age brackets being more likely to require HRT. The model demonstrated an accuracy rate of around 96%, which rendered it reliable for predicting the need for HRT. However, further evaluation metrics revealed notable class imbalance. While the model accurately identified the majority class (“No HRT”) with a precision of 0.96 and recall of 1.00, it failed to correctly classify any instances of the minority class (“HRT”), resulting in a precision, recall, and F1-score of 0.00 for that class. The ROC AUC score of 0.88 suggests the model does have discriminatory power overall, but this is skewed due to the imbalance in the dataset. These limitations underscore the need for resampling strategies or cost-sensitive learning in future iterations. (Fig 6)
The impact of HRT on the incidence of breast cancer and how the feature variables affect this relationship was studied. Similar patterns were observed in the decision tree model, which achieved a test accuracy of 96.3% and ROC AUC of 0.80. As with the Random Forest, performance on the minority class was poor, highlighting the need for further tuning. (Fig 7).
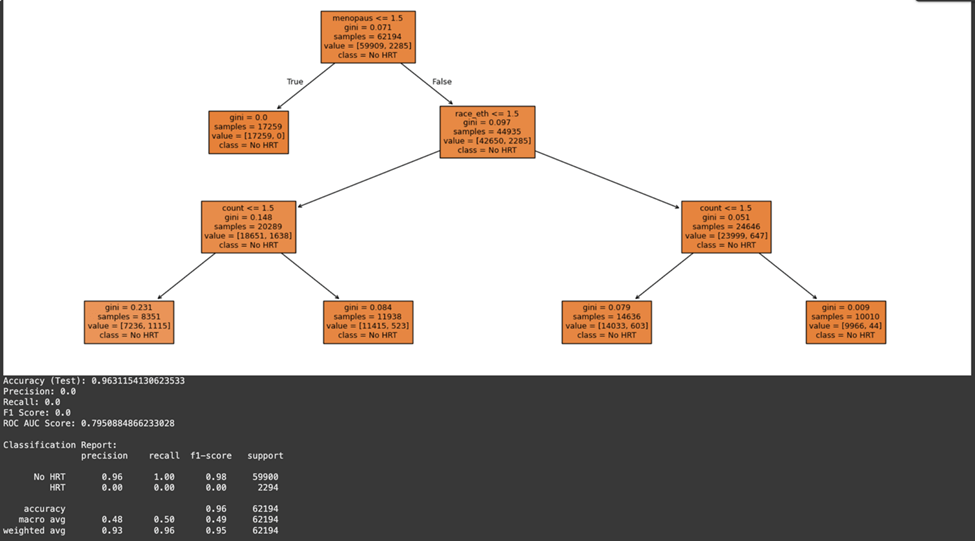
The model used all variables to study how factors like age at first menstruation, BMI, and menopausal status impact the likelihood of developing breast cancer when considering HRT. As expected, menopausal status was an important predictor of HRT’s impact on breast cancer risk. Postmenopausal women who were more likely to use HRT, particularly those with elevated BMI and breast density, showed a higher incidence of breast cancer. The start of menstruation in women also affected the model’s predictions as women with early menarche were exposed to estrogen for an extended period and faced a higher likelihood of developing HR+ breast cancer.
While the current study did not implement formal bias quantification techniques, exploratory data analysis indicated uneven distribution across certain demographic groups, such as a higher representation of postmenopausal white women. This imbalance could impact model generalizability. A stratified K-Fold cross-validation approach (e.g., K=5) was applied to validate model stability, and results remained consistent across folds, suggesting robustness despite the potential for dataset bias. Future work should incorporate fairness-aware metrics and resampling techniques to directly measure and mitigate such bias.
Discussion
Machine learning techniques are practical ways to study breast cancer incidence and its risk factors. In this study, the Decision Tree and Random Forest models were chosen to address the research questions because of the Decision Tree’s capability to manage relationships between feature variables clearly18. It provides a simple, interpretable model that physicians can easily follow for decision-making. However, to increase accuracy, a Random Forest model was also employed. The Random Forest model, as it is a group of multiple decision trees, helps solve overfitting issues and improves predictive power, especially in more complex data.
To achieve the current accuracy levels (~96% for the Decision Tree and ~96% for the Random Forest), several rounds of hyperparameter tuning were necessary to control the depth of the trees in the decision tree model and the number of estimators in the Random Forest model. Utilizing the same features for both models led to similar accuracy scores. Addressing class imbalances and ensuring proper patient subgroup representation were also key troubleshooting steps that helped improve model performance.
The results of this study with the Decision Tree model revealed insights into the relationship between HRT and breast cancer risk. Specifically, it demonstrated that postmenopausal women with a higher BMI and dense breast tissue have an elevated risk of developing breast cancer when undergoing HRT. This finding is consistent with existing literature19, which shows that these factors exacerbate the risk due to their influence on hormonal activity. Additionally, early menarche and prolonged exposure to estrogen were shown to increase the probability of developing HR+ breast cancers, a finding that is also seen in the literature20, further emphasizing the necessity of personalized HRT prescriptions based on individual patient profiles.
In terms of clinical applications, the Decision Tree model’s simplicity and accuracy (~93%) offer potential. This model allows for a clear interpretation of risk factors, enabling healthcare providers to make informed decisions when prescribing HRT. For instance, clinicians can identify high-risk patients based on their menopausal status, BMI, and breast tissue density. The model also emphasizes the importance of age at menarche and other reproductive factors, making it a valuable tool for doctors to assess long-term estrogen exposure in their patients. Moreover, the Random Forest model’s accuracy (~93%) can offer personalized treatment recommendations by factoring in multiple variables at once, allowing healthcare professionals to make precise decisions. For instance, the model could help predict whether a postmenopausal woman with a higher BMI and dense breast tissue is a candidate for HRT while considering her risk of Breast Cancer. Although this study noted no major differences in the prediction accuracies of the Decision Tree model and the Random Forest model, their implications in identifying causes of risk for breast cancer is an important starting point in developing future therapies and treatments. As an initial exploratory step, we analyzed model performance across subgroups such as menopausal status and BMI. We observed consistent prediction accuracy across groups. However, a comprehensive subgroup error analysis by age, race, and risk category is planned as future work. The prediction accuracy of these models can continue to improve and by investigating the various machine learning models that have applications within improving early diagnosis, there could be significant advancements in breast cancer prognosis. While this study does not predict breast cancer directly, predicting HRT usage remains clinically valuable. Since HRT is a modifiable risk factor for breast cancer, being able to identify individuals likely to undergo HRT can allow clinicians to counsel patients on alternatives, adjust screening intervals, or tailor lifestyle interventions.
The findings of this research provide the basis for future research in further developing strategies to prevent and treat breast cancer. Some further research and developments are suggested for the following:
Addressing Dataset Biases: Although direct bias metrics were not computed, the class imbalance and demographic skew in the dataset highlight the need for future studies to use fairness-aware evaluation strategies. More research should be conducted on a dataset’s potential biases surrounding demographic groups, such as racial minorities or younger women, being included in the survey population. Different techniques for balancing this dataset can be applied, including oversampling and under sampling.
Evaluating Additional Datasets: Studies of other datasets would enrich the models and make them more generalizable. This would then validate the models across various populations and possibly reveal more factors or patterns that are not represented by this dataset.
Developing Time-Series Models: Time series analysis of breast cancer development and the outcomes after treatment may explain the dynamics at a more profound level. For example, time-series models could quantify how changes in hormone levels over time influence breast cancer risk, or how the timing of HRT initiation relative to menopause affects the outcome.
Ethical Considerations and Patient Education: Future research should address the ethical implications of using machine learning models in healthcare, particularly in terms of patient consent, data privacy, and the potential for algorithmic bias. Additionally, patient education initiatives could be developed to help individuals understand the risks and benefits of HRT based on personalized assessments generated by these models.
Although the dataset does not include confirmed breast cancer diagnoses, predicting patterns of HRT usage can still offer valuable insights. HRT is a known contributor to breast cancer risk in postmenopausal women, and machine learning can help identify demographic and clinical characteristics associated with higher likelihood of current HRT use. These insights may guide further risk stratification in public health interventions.
| Variable | Type | Encoding Description |
| Age at Menarche | Continuous | Used as-is (mean-imputed if missing) |
| Age at First Birth | Continuous | Used as-is (mean-imputed if missing) |
| BMI Group | Categorical | Integer-coded groupings (e.g., 1: Normal, 2: Overweight) |
| Menopausal Status | Categorical | Encoded as 0: Premenopausal, 1: Postmenopausal, 9: Unknown (imputed) |
| Current HRT Use | Continuous | Binned into 3 categories for classification (low, medium, high) |
| Race/Ethnicity | Categorical | Label-encoded into integer values |
References
- Ethier, S. P. (1995). Growth factor synthesis and human breast cancer progression. Journal of the National Cancer Institute, 87(13), 964–973. https://doi.org/10.1093/jnci/87.13.964 [↩]
- Sharma, G. N., Dave, R., Sanadya, J., Sharma, P., & Sharma, K. K. (2010). Various types and management of breast cancer: an overview. Journal of advanced pharmaceutical technology & research, 1(2), 109–126 [↩]
- Polyak K. (2011). Heterogeneity in breast cancer. The Journal of clinical investigation, 121(10), 3786–3788. https://doi.org/10.1172/JCI60534 [↩]
- Orrantia-Borunda, E., Anchondo-Nuñez, P., Acuña-Aguilar, L. E., Gómez-Valles, F. O., & Ramírez-Valdespino, C. A. (2022). Subtypes of Breast Cancer. In H. N. Mayrovitz (Ed.), Breast Cancer. Exon Publications. https://doi.org/10.36255/exon-publications-breast-cancer-subtypes [↩]
- World Health Organization. (2024, August 28). Breast cancer. Retrieved August 19, 2025, from https://www.who.int/news-room/fact-sheets/detail/breast-cancer [↩]
- Sun, Y. S., Zhao, Z., Yang, Z. N., Xu, F., Lu, H. J., Zhu, Z. Y., Shi, W., Jiang, J., Yao, P. P., & Zhu, H. P. (2017). Risk Factors and Preventions of Breast Cancer. International journal of biological sciences, 13(11), 1387–1397. https://doi.org/10.7150/ijbs.21635 [↩] [↩]
- Momenimovahed, Z., & Salehiniya, H. (2019). Epidemiological characteristics of and risk factors for breast cancer in the world. Breast cancer (Dove Medical Press), 11, 151–164. https://doi.org/10.2147/BCTT.S176070 [↩]
- Kamińska, M., Ciszewski, T., Łopacka-Szatan, K., Miotła, P., & Starosławska, E. (2015). Breast cancer risk factors. Przeglad menopauzalny = Menopause review, 14(3), 196–202. https://doi.org/10.5114/pm.2015.54346 [↩]
- Checka, C. M., Chun, J. E., Schnabel, F. R., Lee, J., & Toth, H. (2012). The relationship of mammographic density and age: implications for breast cancer screening. AJR. American journal of roentgenology, 198(3), W292–W295. https://doi.org/10.2214/AJR.10.6049 [↩]
- Wang, A. T., Vachon, C. M., Brandt, K. R., & Ghosh, K. (2014). Breast density and breast cancer risk: a practical review. Mayo Clinic proceedings, 89(4), 548–557. https://doi.org/10.1016/j.mayocp.2013.12.014 [↩]
- Collaborative Group on Hormonal Factors in Breast Cancer (2019). Type and timing of menopausal hormone therapy and breast cancer risk: individual participant meta-analysis of the worldwide epidemiological evidence. Lancet (London, England), 394(10204), 1159–1168. https://doi.org/10.1016/S0140-6736(19)31709-X [↩]
- Delen, D., Walker, G., & Kadam, A. (2005). Predicting breast cancer survivability: a comparison of three data mining methods. Artificial intelligence in medicine, 34(2), 113–127. https://doi.org/10.1016/j.artmed.2004.07.002 [↩]
- Tice, J. A., Miglioretti, D. L., Li, C. S., Vachon, C. M., Gard, C. C., & Kerlikowske, K. (2015). Breast Density and Benign Breast Disease: Risk Assessment to Identify Women at High Risk of Breast Cancer. Journal of clinical oncology : official journal of the American Society of Clinical Oncology, 33(28), 3137–3143. https://doi.org/10.1200/JCO.2015.60.8869 [↩]
- Kourou, K., Exarchos, T. P., Exarchos, K. P., Karamouzis, M. V., & Fotiadis, D. I. (2014). Machine learning applications in cancer prognosis and prediction. Computational and structural biotechnology journal, 13, 8–17. https://doi.org/10.1016/j.csbj.2014.11.005 [↩]
- Ching, T., Himmelstein, D. S., Beaulieu-Jones, B. K., Kalinin, A. A., Do, B. T., Way, G. P., Ferrero, E., Agapow, P. M., Zietz, M., Hoffman, M. M., Xie, W., Rosen, G. L., Lengerich, B. J., Israeli, J., Lanchantin, J., Woloszynek, S., Carpenter, A. E., Shrikumar, A., Xu, J., Cofer, E. M., … Greene, C. S. (2018). Opportunities and obstacles for deep learning in biology and medicine. Journal of the Royal Society, Interface, 15(141), 20170387. https://doi.org/10.1098/rsif.2017.0387 [↩]
- Yala, A., Lehman, C., Schuster, T., Portnoi, T., & Barzilay, R. (2019). A Deep Learning Mammography-based Model for Improved Breast Cancer Risk Prediction. Radiology, 292(1), 60–66. https://doi.org/10.1148/radiol.2019182716 [↩]
- Beral, V., & Million Women Study Collaborators (2003). Breast cancer and hormone-replacement therapy in the Million Women Study. Lancet (London, England), 362(9382), 419–427. https://doi.org/10.1016/s0140-6736(03)14065-2; Chlebowski, R. T., Manson, J. E., Anderson, G. L., Cauley, J. A., Aragaki, A. K., Stefanick, M. L., Lane, D. S., Johnson, K. C., Wactawski-Wende, J., Chen, C., Qi, L., Yasmeen, S., Newcomb, P. A., & Prentice, R. L. (2013). Estrogen plus progestin and breast cancer incidence and mortality in the Women’s Health Initiative Observational Study. Journal of the National Cancer Institute, 105(8), 526–535. https://doi.org/10.1093/jnci/djt043 [↩]
- Azar, A. T., & El-Metwally, S. M. (2013). Decision tree classifiers for automated medical diagnosis. Neural Computing and Applications, 23(7-8), 2387–2403. https://doi.org/10.1007/s00521-012-1196-7 [↩]
- Schreer I. (2009). Dense Breast Tissue as an Important Risk Factor for Breast Cancer and Implications for Early Detection. Breast care (Basel, Switzerland), 4(2), 89–92. https://doi.org/10.1159/000211954 [↩]
- MacMahon, B., Trichopoulos, D., Brown, J., Andersen, A. P., Cole, P., deWaard, F., Kauraniemi, T., Polychronopoulou, A., Ravnihar, B., Stormby, N., & Westlund, K. (1982). Age at menarche, urine estrogens and breast cancer risk. International journal of cancer, 30(4), 427–431. https://doi.org/10.1002/ijc.2910300408 [↩]


