
Abstract
Dry eye disease (DED) causes dryness, pain, fatigue, and irritation in the eye and affects up to 30% of adults over 50. Although adolescents spend many hours per day on screens, DED studies focus mainly on adults. This study investigated the prevalence and risk factors of adolescent dry eye disease to inform preventive strategies that aim to improve ocular health among adolescents. This study first conducted a meta-analysis of past studies on children (6-18 years) to identify DED prevalence and risk factors. Using the same risk factors identified in the meta-analysis, high school students in Illinois, USA, were surveyed. 28 studies yielded a pooled DED prevalence of 32% (95% CI, 21%–46%) among children aged 6-18 years. Digital screen use (63%) was found to have a strong positive correlation with DED, while contact lens wear, allergies, stress were identified to have a weak positive correlation with DED. Based on the survey of local high school students, 39.7% (95% CI 28.1-52.5%) reported DED symptoms. Digital device use over six hours was found to have a statistically significant correlation (OR 7.33, 95% CI 2.25-23.85) with DED. Other factors (contact lens wear, allergies, stress) were found to be statistically insignificant. DED is common among adolescents and is strongly linked to prolonged exposure to digital screens. Schools should promote eye health education, and high school students who are heavy device users must be screened for dry eye disease to enable early diagnosis.
Key Words: Dry Eye Disease, Adolescents, Digital device use, Meta-analysis, Survey-research
Introduction
Keratoconjunctivitis sicca, also known as dry eye disease, is characterized by symptoms such as dryness, pain, fatigue, and irritation in the eye1. Dry eye disease (DED) is a significant public health issue that affects approximately 344 million people worldwide and 20 million in the United States2. DED results in reduced quality of life and affects daily activities such as reading and driving. Studies report DED prevalence of 5% to 30% among adults aged 50 years and older, with a narrower focus on younger age groups3.
Adolescents experience DED symptoms similar to adults, and the impact of dry eye disease on them is significant, with consequences such as absenteeism and reduced performance at school and activities such as reading and playing. Known risk factors for DED among adults that include digital device use, contact lens wear, anxiety, and allergies, also affect adolescents4. Changing levels of hormones like progesterone and estrogen during puberty also affect oil glands in the eye, leading to dry eyes among adolescents. The young population has a different lifestyle than a few years ago, especially since the COVID-19 pandemic, with a significant shift towards a significant dependence on digital device use for academic purposes5. This increase in screen time and the widespread use of portable digital devices is attributed to the rise in dry eye symptoms among adolescents. With the increasing academic burden on high school students, there is a higher need to maintain good eye health6. Eye fatigue and reduced vision negatively affect schoolwork, highlighting the need to understand the prevalence of DED and its related risk factors among high school students7. When better understood, early diagnosis and development of effective preventive measures can help facilitate good long-term ocular health in adolescents.
Today, studies group children aged 6-18 together and report DED prevalence broadly (5.5% to 23.1%)2. The limited studies that specifically focus on adolescents are mainly from Japan, China, and Thailand. Therefore, there is a critical gap in understanding both the prevalence and specific risk factors associated with DED among high school students, more specifically in the United States. Risk factors prevalent among children, such as contact lens wear, allergies, stress, and excessive digital device use, are underexplored2. Allergy affects one in five adolescents; however, its relationship with DED has only been studied among adults8. Despite high school students spending an average of 7.5 hours per day on screens, DED has been primarily studied among adults or in limited regions such as Asia, leaving a gap in knowledge regarding adolescents in the United States9.
To address this gap in research, the Tear Film and Ocular Surface Society (TFOS) Dry Eye Workshop II (DEWS II) Epidemiology subcommittee has recommended that future DED research focus on school-aged children and investigate potential risk factors, such as the use of digital screen devices2. This study, therefore, aims to explore the prevalence of dry eye disease and its risk factors among high school students in Illinois. By focusing on this specific group, this research will address the gap in understanding the prevalence and risks of adolescent dry eye disease, which can then inform preventive strategies and policy updates aimed at improving and sustaining ocular health among adolescents in the United States.
2. Literature Review
2.1 Pathophysiology of DED
Dry eye disease can be classified into two types: reduced production of tears and increased evaporation of the tear film. Both types of DED result from a loss of homeostasis in the human body, leading to a cycle of instability in the tear film, damage and inflammation to the ocular surface, and sensory abnormalities10. Tears keep eyes wet, help focus light to see clearly, and protect eyes from irritants like dirt and dust. When we blink, a thin layer of tears called a “tear film” forms on the surface of the eye. Loss of homeostasis can result in the tear film becoming unstable and breaking up after blinking. This breakdown of the tear film occurs due to reduced tear secretion, leading to drying and hyperosmolarity of the tears. Tear hyperosmolarity (THO) or “salty tears” occurs when tear salt concentration is abnormally high. It is found to result in the death of epithelial cells and inflammation, which leads to further loss of tear-producing cells11. This exacerbates tear film instability and contributes to the circle of events that perpetuate DED12. Most studies report THO as the critical initiating factor of DED, even in cases where there are no other comorbidities13.
2.2 Known Risk Factors
Studies suggest that the instability of the tear film and inflammation of the ocular surface are triggered by factors such as digital device use, stress, contact lens wear, allergies, and inadequate sleep2. Digital screen use is reported to cause reduced blink rates and incomplete blinking, both of which lead to ocular surface dryness. Tears evaporate between each blink, and complete blinking is necessary to replenish the tear film; reduced blinking results in increased tear evaporation, which initiates the DED cycle14. Similarly, tear evaporation rates associated with contact lens use are reported to be high. When contact lenses are placed on the eyes, two layers of tear film form: a pre-lens tear film and a post-lens tear film. The post-lens tear film is reported to interact with the ocular surface, affecting comfort during contact lens wear15. Reports also indicate that a lack of sleep can reduce tear secretion and that dry eye symptoms are alleviated due to the composition of tears during sleep16.
Closed-eye tears that collect immediately after sleep have a composition that serves a defensive function by releasing enzymes. People who experience stress often find it difficult to sleep, and the disruption of their sleep cycles aggravates dry eye symptoms17. Individuals with allergies are also shown to develop allergic conjunctivitis, which reduces tear break-up time, thereby decreasing epithelial cell density and leading to dryness.
2.3 DED in Adolescent Populations
Studies estimate the overall prevalence of DED in children is slightly lower than that in adults (5.5% and 26.6%)2. Research suggests that DED has been studied more among adults, while it has been understudied among children, especially adolescents. Studies report that DED among children is associated with similar factors as in adults; however, studies are sparse, and significant variability exists across them. Pediatric DED prevalence is traditionally underestimated because diagnosing DED in children presents unique challenges. Standardized diagnostic criteria for children are not available, which leads to inconsistent prevalence estimates. However, research has shown that, physiologically, the pediatric ocular surface is more prone to environmental and behavioral influences than in adults. Inconsistencies in diagnostic methods raise concerns about underreported chronic DED in children and highlight the need for awareness and interventions to safeguard children’s ocular health.18.
Studies show that DED prevalence increases with age during childhood possibly due to an increase in environmental exposures such as digital device use and contact lenses2. Some studies show a moderate relationship between digital device use and DED among children in Turkey and India. In contrast, a Japanese study found no association between duration of screen use and DED. Similarly, some studies in Japan and China have shown contact lens wear as a risk factor for DED, but another study in Ohio reports fewer complaints of DED among children who wear contacts19. Among the pediatric population, high school students are particularly relevant for studying DED because they undergo significant physical and cognitive changes during adolescence. They also undergo the stress of intense academic pressure accompanied by an increased use of digital screens and a reduced amount of sleep20. Contact lens wear is also common among high school students for both corrective and cosmetic purposes and they are also exposed to a large number of allergens. Studies have also reported that female students have a higher likelihood of having DED symptoms than males, likely due to hormonal changes in estrogen and progesterone that affect the quantity and quality of the tear film. However, these patterns are not consistent across studies, with minimal focus on risk factors among adolescents. All these factors increase their risk for developing DED. Symptoms of DED can severely impact academic performance, social interactions, and overall quality of life. Yet, no existing studies focus on the prevalence of DED among high school students in the United States, and the limited studies that do exist reflect a high degree of variability among them2. Ethnicity, geographical variations, and study methodology are likely reasons for the variations in their results. By targeting high school students, this study aims to identify age-specific risk factors and suggest preventive strategies tailored to their unique context.
2.4 Objectives of this study
Review of existing literature shows that there is no clear understanding of DED among children, and there is a lack of data about its prevalence and associated risk factors among high school students. This research, therefore, first integrates the results of the highly variable existing studies and systematically analyzes the risk factors related to DED among children. Using these findings, this study then answers the question: What lifestyle factors contribute to the prevalence of DED among high school students in Illinois? It is hypothesized that more than six hours of digital device usage and usage of contact lenses are significantly associated with DED symptoms among high school students in Illinois.
3. Methods
3.1 Study Design
To accomplish these objectives, this correlational research collected quantitative data to establish patterns that explain the prevalence of dry disease and its risk factors among high school students. Data from existing research is highly variable, making it hard to determine the specific factors that could affect high school students. Conducting a meta-analysis of risk factors therefore, helped integrate results from past studies, which were then assessed among local high school students21. The meta-analysis’s quantitative approach enabled the statistical analysis of estimates, which were then used to inform the collection of survey data. Survey research helped quantitatively describe the prevalence and risk profiles of the high school population. The survey approach enabled comparisons between students with positive symptoms and those without symptoms. The meta-analysis part of this research was necessary to understand which risk factors were significantly associated with DED among children. Without the meta-analysis, this study would have lacked a comparative framework to assess how the risk profile of local high school students aligns with trends observed in previous research.
3.2 Meta-Analysis
3.2.1 Literature Search Strategy
A literature search was conducted to perform a meta-analysis of risk factors associated with DED. The research database PubMed was searched for studies from January 1990 until January 202521. The search keywords used to obtain articles related to DED among children were “”Dry Eye Syndrome” or “Keratoconjunctivitis Sicca” or “dry eye disease” and “Adolescent” or “Pediatric” or “Child.” Additional search terms “risk factors” or “environmental exposure” or “environmental factor” or “lifestyle” or “behaviors” to make the results relevant to risk factors.
3.2.2 Inclusion and Exclusion Criteria
All studies returned from the search were reviewed. This meta-analysis included cross-sectional, cohort, and case-control studies that addressed the prevalence of DED and risk factors among children. These studies provided information on sample size, DED prevalence, and risk factors in individuals aged 6-18. Ages 6-18 were grouped together in this meta-analysis because studies commonly report children and adolescents as a single cohort. A 6-13 and 14-18 subgroup analysis was attempted, but overlapping ranges in the studies and high heterogeneity limited the feasibility of separate pooled estimates. Duplicate and non-human studies were excluded22. Research papers were organized into categories using the literature management software EndNote 21, which was obtained from its website. Screening of studies was conducted by reading the titles, abstracts, and full texts of articles to confirm relevance and ensure they met the PRISMA standard guidelines for reporting systematic reviews23.
3.2.3 Data Extraction
The information extracted from the included studies included authors’ names, region, sample size of participants, age groups, risk factors under study, and the prevalence of DED. The extracted data was stored in a Google Sheet and downloaded as a CSV file for later statistical analysis.
3.2.4 Statistical Analysis
The proportion of a population with a condition such as DED at a specific point in time is measured as the prevalence estimate. A confidence interval is the range of values one can expect the estimate to fall within if the study were conducted multiple times. In the meta-analysis, prevalence estimates and confidence intervals were measured statistically based on data extracted from the included studies24. These measurements were performed using R (version 4.4.2), a programming language used for statistical analysis. The CSV file with data extracted from studies was used to call metaprop(), a function in R. This returned forest plots (graphical displays of results from multiple studies in one chart), prevalence estimates, and confidence intervals for each risk factor under study. Since the studies included were found to be heterogeneous (ie, varying in sample size and prevalence), the metaprop() function was asked to use the random effects model in its calculations. The random-effects model assumes that differences in estimates reported by the included studies are due to variations in the populations used25. When a random effects model is used in metaprop(), heterogeneity in the studies is reported as an i2 estimate, which is an estimate of variability among studies included in the meta-analysis21. A high i2 statistic (>30%) confirmed heterogeneity, while a low i2 value (<30%) implied homogeneity of the studies, which was used in the interpretation of the results as well as confirmation of the random-effects model used.
The meta-analysis synthesized data from existing pediatric studies to estimate DED prevalence and identify candidate risk factors among the pediatric population (6-18 years). Existing literature, however, could not address the adolescent specific question this study aims to answer because the studies were highly heterogeneous, the age bands reported in them were inconsistent, and several risk factors were sparsely reported. A survey in a US high school setting was therefore used to study adolescent specific prevalence and risk factors. It enabled an estimation of odds ratios for DED in adolescents and a direct comparison of signals found in the meta-analysis.
3.3 Survey Research
The tool used in this study was adapted from the Ocular Surface Disease Index (OSDI) questionnaire, which assesses the severity of DED symptoms and measures the presence of risk factors identified using the meta-analysis26. This questionnaire is commonly used to assess the symptoms of DED and their impact on daily functioning27. The questionnaire consisted of two sections: vision symptoms and environmental triggers, all of which were relevant to the present study. The triggers section of the questionnaire was modified to list the factors identified in the meta-analysis, as this study aims to confirm whether risk factors among local high school students align with previous research analysis26. The OSDI-based survey was a self-administered questionnaire in Google Form format that targeted high school students between the ages of 14 and 18 in Illinois. This allowed for an accurate representation of symptoms and triggers among high school students, as students come from diverse backgrounds and have varied exposures. Triggers such as digital device usage hours, allergies, numbers of hours of sleep, and contact lens wear were self-reported in the google form by the respondents.
Informed consent was obtained before the survey. The questions in the ocular symptoms part of the questionnaire were each scored on a five-point Likert scale, with 0 = “Never” and 4 = ”Always”28. OSDI scores were calculated by summing the scores of each section. Raw OSDI scores ranging from 0 to 48 were then used to measure the final percentage score using the formula (raw OSDI score * 25)/total questions answered. This method of scoring the responses helped identify the presence of DED among the participants and its severity. Participants with an OSDI score of 0-12 were considered to have normal eyes. A Score of 13-22 was considered as mild DED, 23-32 as moderate, and greater than 33 as severe26. The OSDI questionnaire and the associated cut-off scores of >12 are used for measurement among adults and have not been validated for use with adolescents. To increase confidence in the measured outcomes from the survey, a sensitivity analysis using OSDI cut-off scores >9 and >15, was performed to analyze if DED prevalence remained similar to original cut-off scores. Stress assessment among participants was conducted using the Perceived Stress Scale-4 (PSS-4) survey questionnaire, which consisted of four questions that quantified perceived stress on a scale of 0-16. PSS-4 scores of 0-4, 5-8, 9-12, and 13-16 were interpreted to be stress levels of None, Mild, Moderate, and Severe17. In addition, the number of hours of sleep and digital device use, the presence of allergies, and contact lens use were also collected.
The data obtained was statistically analyzed using the Statistical Package for the Social Sciences (SPSS) (IBM Statistics for macOS Version 30.0.0), a trial version of which was downloaded and installed from the IBM website. Categorical data (sleep, digital device use) was expressed using frequencies and percentages, while numerical data (OSDI score) was expressed as medians. The association between DED and risk factors was investigated for each factor using univariate logistic regression, as the outcome was expected to be binary. The logistic regression calculated the probability or p-value of the correlation, which, when <0.05 was used to indicate statistical significance29. In addition, odds ratios were calculated to assess the strength of the associations between risk factors and DED. 95% confidence intervals were also calculated for the odds ratios, indicating the range within which the true odds ratio would likely fall. If the confidence interval included a value of one, then the odds ratio and hence the association were considered statistically insignificant30. Additionally, a multivariable adjusted binary logistic regression was also run using SPSS, to find the association between each risk factor (sex, contact lens wear, stress, allergies, sleep, and digital device use) and DED, after accounting for all listed risk factors simultaneously. Similar to the univariate analysis, the probability of the association, the adjusted odds ratio, and the 95% confidence intervals were calculated.
4. Results
4.1 Meta-Analysis
4.1.1 Characteristics of Included Studies
A total of 968 studies were identified using a PubMed search (Fig. 1). Of these studies, 64 were found to be relevant to the analysis needed for this study. However, after retrieving the complete text, only 28 studies were identified that met the inclusion criteria.

4.1.2 Synthesis of Data
For each article included, the authors’ names, year, study type, country, age of participants, sample size, DED prevalence, and risk factors were recorded as seen in Table 1. Each study compared a control group with a group that had been diagnosed with dry eye symptoms. Prevalence estimates reported in each study were extracted and reported (Table 1).
| Study | Year | Study Type | Country | Age (yrs) | Sample Size (n) | Prevalence of DED(%) | Factors Studied |
| Abbott, K. et. al.31 | 2024 | retrospective | United States | 6-19 | 112 | 3.57% | Overall DED Prevalence |
| Alnahdi, W. et. al.32 | 2022 | cross-sectional | Saudi Arabia | 12-18 | 330 | 76.06% | Allergies |
| Li, S. et al.33 | 2018 | cross-sectional | China | 17-18 | 94 | 18.09% | Overall DED Prevalence |
| Temeltürk, R. D. et. al.34 | 2024 | cross-sectional | Turkey | 11-15 | 85 | 44.71% | Allergies, Digital Device Use |
| Akil, H. et. al35 | 2015 | cross-sectional | Turkey | 6-18 | 25 | 12.00% | Contact Lens, Digital Device Use |
| Ayaki, M. et al.36 | 2018 | cross-sectional | Japan | 10-19 | 323 | 21.67% | Overall DED Prevalence |
| Chen, Z. et. al.37 | 2022 | cross-sectional | China | 8-16 | 98 | 31.63% | Diabetes |
| Chen, L. et. al.38 | 2016 | cross-sectional | China | 3-6 | 80 | 62.50% | Allergies |
| Douglas, V. P. et. al.39 | 2024 | retrospective | United States | <18 | 4,795,979 | 4.24% | Allergies |
| Jadeja, J. N. et. al.40 | 2024 | cross-sectional | India | 10-13 | 564 | 74.47% | Digital device use |
| Mineshita, Y et. al.41 | 2021 | cross-sectional | Japan | 6-12 | 7,041 | 18.59% | Overall DED Prevalence |
| Kim, T. H., & Moon, N. J.42 | 2013 | cross-sectional | South Korea | 6-15 | 916 | 6.55% | Contact Lens |
| Tonkerdmongkol, D. et. al.43 | 2023 | cross-sectional | Thailand | 12-18 | 603 | 62.52% | Contact Lens |
| Garza-León. et. al.44 | 2021 | cross-sectional | Mexico | 16-17 | 759 | 5.67% | Diabetes |
| Rojas-Carabali, W. et. al.45 | 2024 | cross-sectional | Argentina | 7-17 | 60 | 33.33% | Digital device usage |
| Greiner, K. L., & Walline, J. J.46 | 2010 | cross-sectional | United States | 10-14 | 94 | 4.26% | Digital device usage, sleep |
| Hwang, Y. K. et. al.47 | 2024 | retrospective cohort study | South Korea | 13-18 | 129,445 | 6.57% | Diabetes |
| Alrabghi, D. A et. al.48 | 2023 | cross-sectional | Saudi Arabia | <20 | 58 | 37.93% | Contact Lens, Digital device usage |
| Uchino, M. et. al.49 | 2008 | cross-sectional | Japan | 14-18 | 912 | 37.83% | Digital device usage |
| Akinci, A. et. al.50 | 2007 | cross-sectional | Turkey | 7-18 | 104 | 15.38% | Digital device usage |
| Moon, J. H. et. al.51 | 2014 | cross-sectional | South Korea | 6-18 | 28 | 71.43% | Digital device usage |
| Muntz, A. et. al.52 | 2022 | cross-sectional | New Zealand | 14-24 | 456 | 89.91% | Digital device usage |
| Pavel, I. A. et. al.53 | 2022 | cross-sectional | Romania | 7-14 | 35 | 77.14% | Digital device usage |
| Rao, B. V. et. al.54 | 2022 | cross-sectional | India | 7-18 | 3,096 | 59.98% | Digital device usage |
| Uzun, S. L. et. al.55 | 2022 | cross-sectional | Turkey | 15-25 | 44 | 36.36% | Contact Lens, Digital device use, Stress |
| Zhang, Y. et. al.56 | 2012 | cross-sectional | China | 14-18 | 447 | 82.10% | Contact Lens |
| Bisetty, & Khan, E.57 | 2024 | cross-sectional | South Africa | 11-18 | 77 | 24.68% | Digital device usage |
| Donthineni, P. R. et. al.58 | 2019 | cross-sectional | India | 3.7-13.5 | 925 | 45.95% | Contact Lens, Stress |
As seen in Table 1, sample sizes varied from 28 to 4,795,979. The ages of the population under study ranged from 6 to 19; the studies were conducted across the globe and reported varying levels of prevalence. The risk factors studied also vary between studies, with digital device use being the most frequently reported factor, and no studies reported data on sleep deprivation among children.
Due to the variability of DED prevalence in the studies, a pooled estimate was calculated and a forest plot was drawn to visually inspect how the estimates of each study were distributed (Fig. 2). The overall estimate of DED prevalence was determined to be 32% (95% CI 21%–46%, p =0). The 95% confidence interval is where the true effect lies, and since the range of 21% to 46% is not too wide, DED prevalence among children must fall in that precise range (Cochrane). In addition, heterogeneity of data i2 and p-value were also measured. As expected, the i2 value of 99.9% indicates high variability in the studies. In the forest plot, the length of the horizontal lines represents confidence intervals, with shorter lines indicating higher confidence in the results. The blue diamond at the bottom of the forest plot is called the summary estimate, reported to be 32%, as seen in Figure 2.

Figures 3 to 7 represent similar forest plots for DED risk factors obtained from the studies. Through these plots, the percentage of dry eye patients subject to risk factors, such as digital device use, contact lens wear, allergies, and stress, as reported in the studies, is measured.
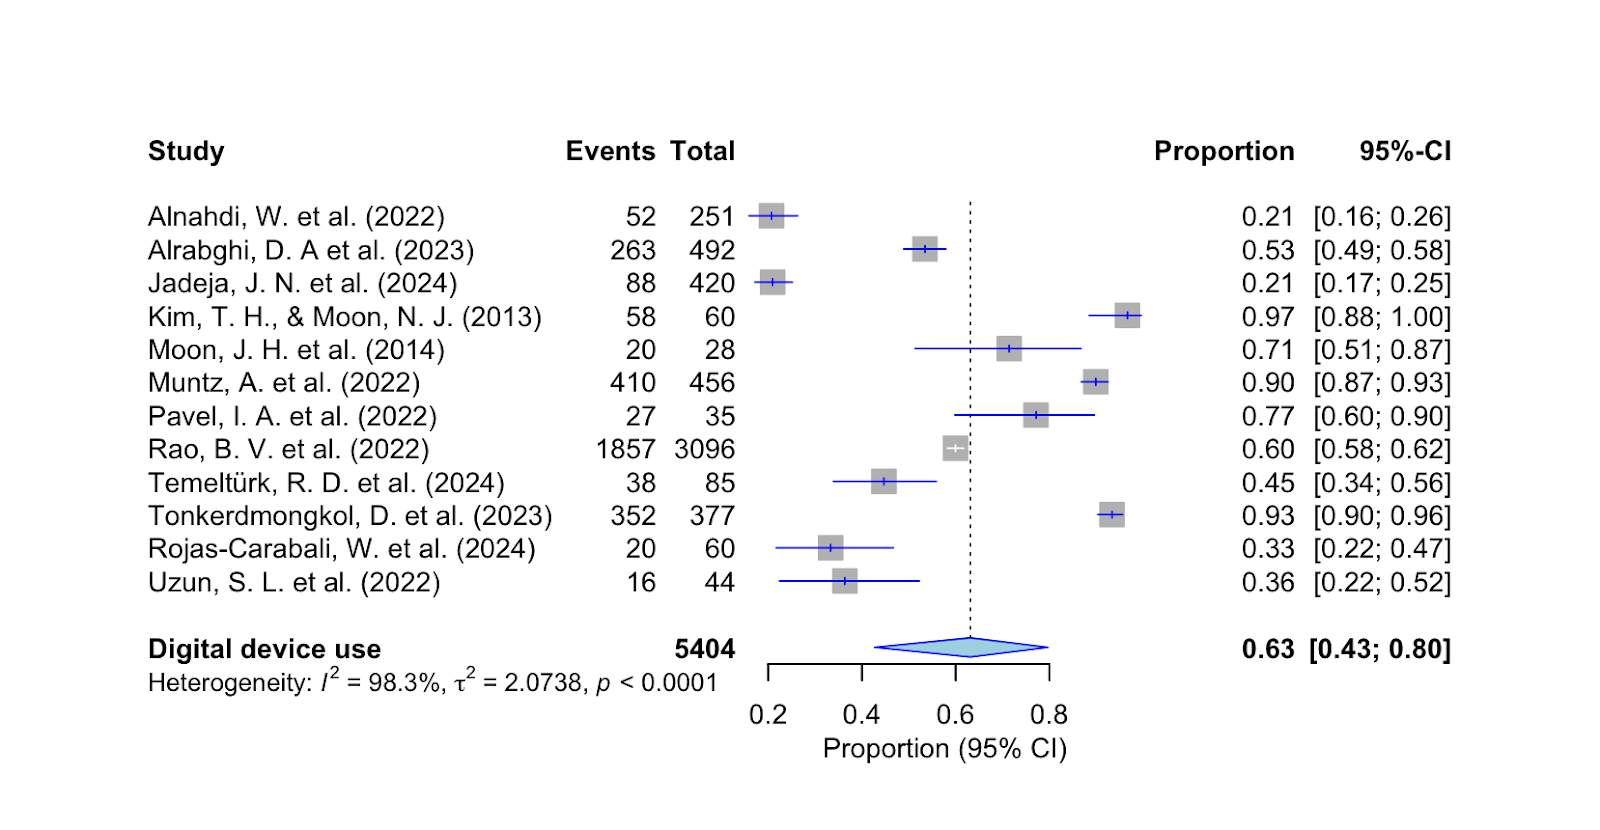
As shown in Fig. 3 above, the prevalence of digital screen use for more than 6 hours among individuals with DED is 63% (95% CI, 43%-80%, p < 0.001). The estimate of 63% and the relatively narrow confidence interval indicate a strong correlation between digital device use and dry eye symptoms among children.
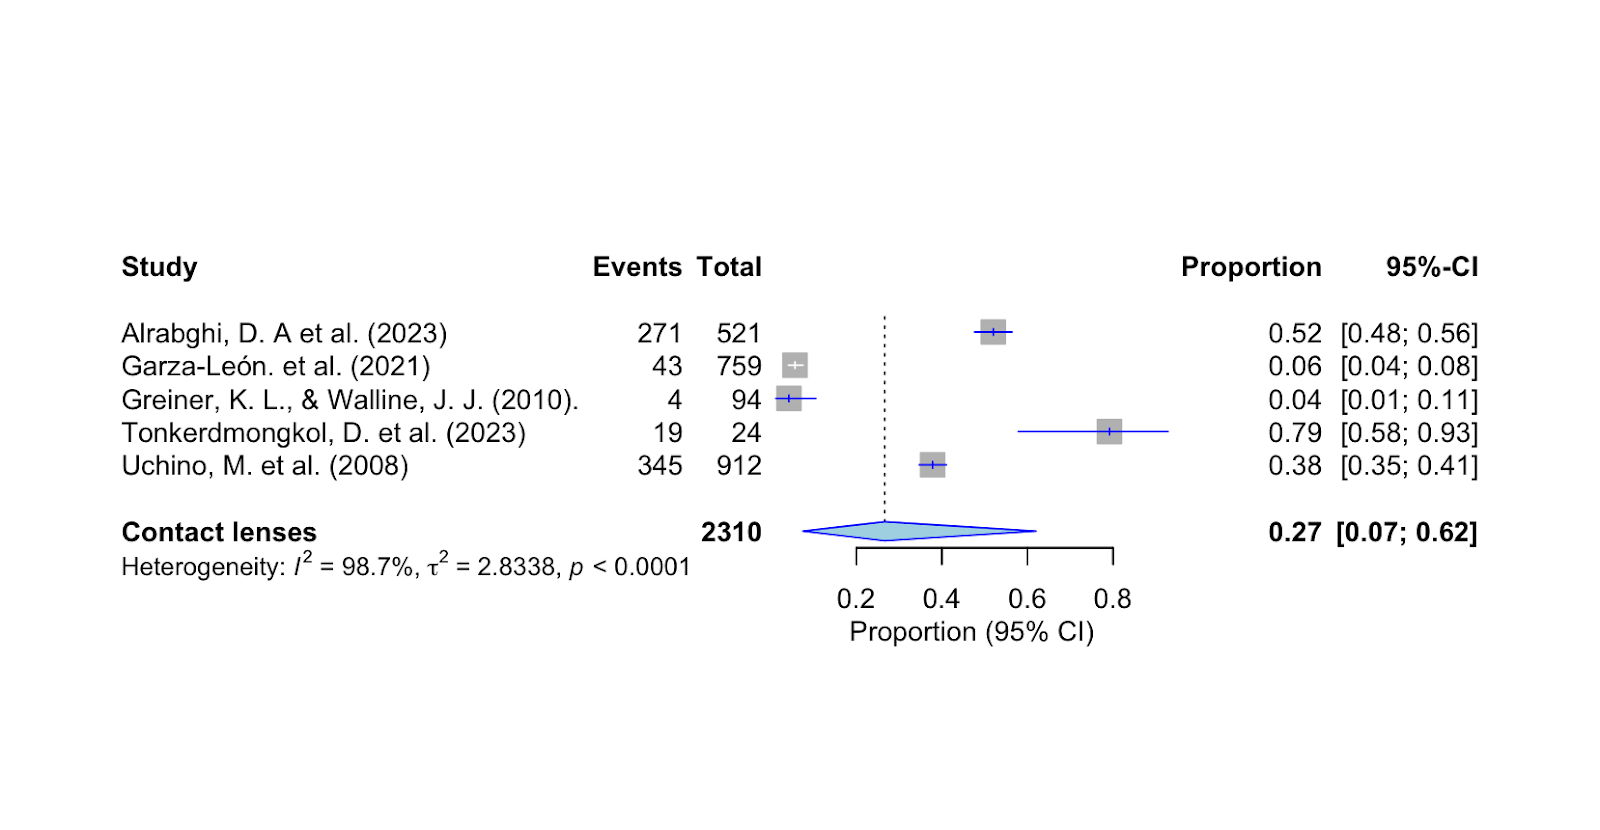
As seen in Figure 4 above, the pooled estimate for patients with DED who wear contact lenses is 27% (95% CI, 7%-62%, p < 0.001).
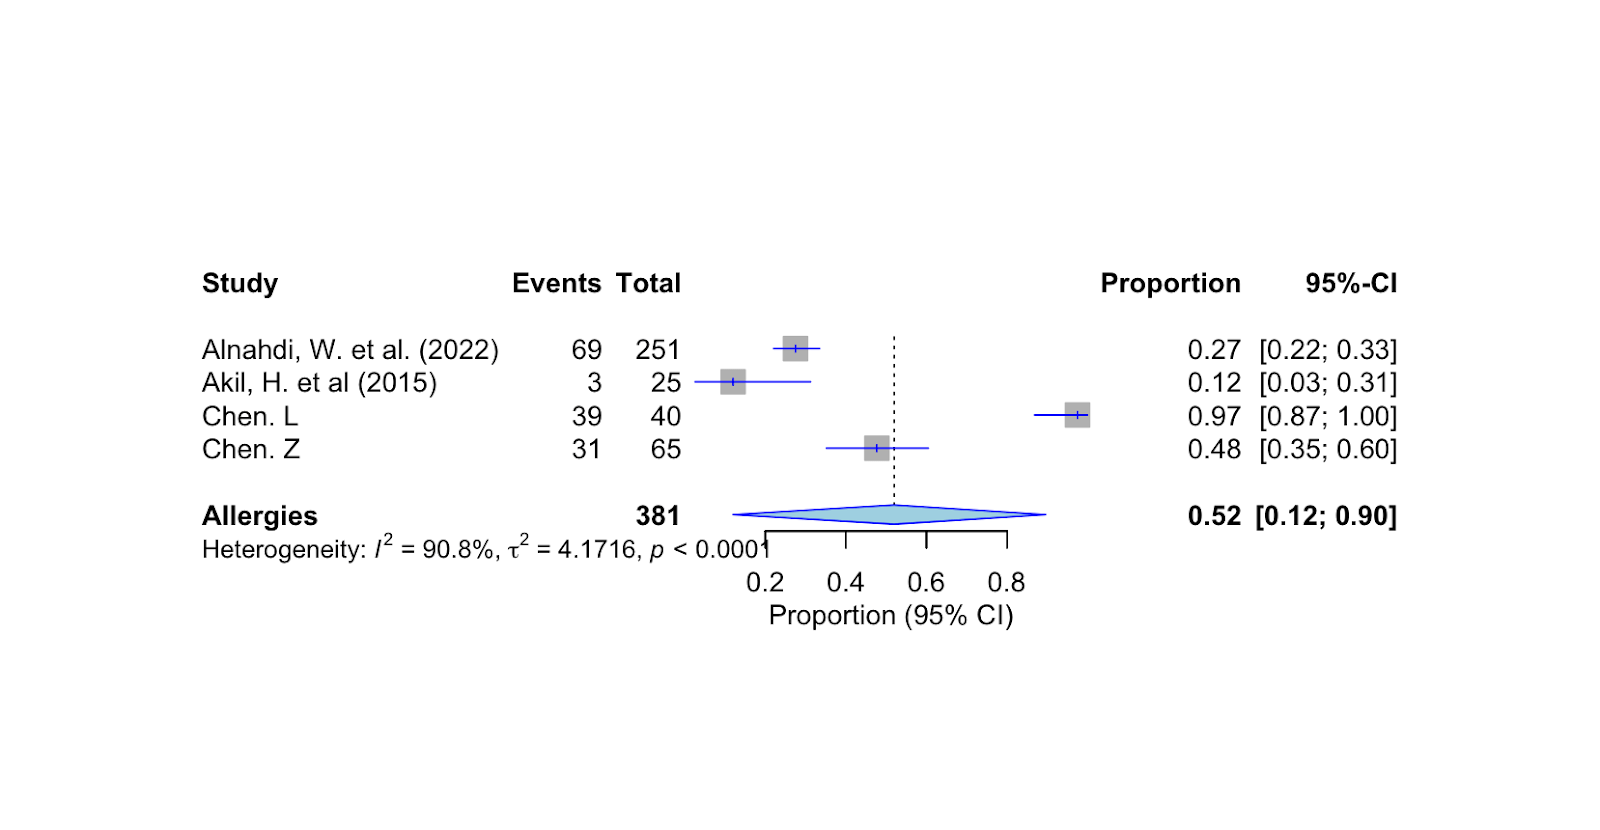
As seen in Figure 5 above, the pooled estimate for patients with DED who also have allergies is 52% (95% CI 12%-90%, p < 0.001).

As seen in Fig 6 above, the pooled estimate of patients with DED who also report anxiety and stress is 63% (95% CI 32%-87%, p<0.001).
| Risk Factor | DED Prevalence Estimate % | 95% Confidence Interval | Correlation with DED |
| Digital Device Use Over 6 hours | 63% | 43%-80% | Strong |
| Contact Lens Wear | 27% | 7%-62% | Weak |
| Allergies | 52% | 12%-90% | Weak |
| Stress | 63% | 32%-83% | Weak |
Based on the meta-analysis conducted on current literature and the data collected from them, it can be observed that the prevalence of DED among children (ages 6-18) is about 32% and as can be seen from Table 2 the most significant risk factor correlated with DED is digital screen use (63%). Although the pooled prevalence estimates of contact lens wear, allergies, and stress as risk factors show a positive correlation with DED, the confidence intervals are too wide making them less reliable.
4.2 Results from Survey
Fifty-eight high school students in Illinois responded to the questionnaire. Of these, all 58 consented to participate in this study. No data were excluded from this study. There were no missing responses among the 58 surveyed. This was possible because the google form made all entries of the survey mandatory. The respondents were 61.4% (95% CI 49.2-73.4%) males, 35.1% (95% CI 23.6-47.3%) females, and 3.5% (95% CI 1.0%-11.7%) who preferred not to disclose their gender. Their ages ranged from 14 to 18, with the majority of them being 16 or 17 years old (73.7%). Among the respondents, 33.3% % (95% CI 23.6-47.3%) wore contact lenses, 34.1% % (95% CI 25.1-49.1%) reported allergies, 70.7% experienced some level of stress, 56.9% (95% CI 44.1-68.8%) reported getting less than 6 hours of sleep, and 51.7% (95% CI 39.2-64.1%) used digital devices for more than 6 hours a day. Complete characteristics of the respondents are listed in Table 3.
| High School Students | n (%) | 95% CI | |
| Gender | |||
| Male | 37 (61.4) | 49.2%-73.4% | |
| Female | 20 (35.1) | 23.6%-47.3% | |
| Prefer not to say | 2 (3.5) | 1.0%-11.7% | |
| Age | |||
| 14 | 4 (10.5) | 4.8%-20.8% | |
| 15 | 7 (12.3) | 6.0%-22.9% | |
| 16 | 20 (35.1) | 23.6%-47.3% | |
| 17 | 24 (38.6) | 28.1%-52.5% | |
| 18 | 2 (3.5) | 1.0%-11.7% | |
| Contact Lens Wear | |||
| No | 38 (66.7) | 52.7%-76.4% | |
| Yes | 20 (33.3) | 23.6%-47.3% | |
| Allergies | |||
| No | 37 (65.9) | 52.7%-76.4% | |
| Yes | 21 (34.1) | 25.1%-49.1% | |
| Stress | |||
| None | 17 (29.3) | 13.6%-34.7% | |
| Mild | 19 (32.76) | 9.6%-28.9% | |
| Medium | 9 (15.52) | 20.6%-43.8% | |
| Severe | 13 (22.41) | 19.2%-42.0% | |
| Sleep | |||
| greater than 6 hours | 25 (43.10) | 31.2%-55.9% | |
| less than 6 hours | 33 (56.90) | 44.1%-68.8% | |
| Digital Device Use | |||
| 3-6 hours | 28 (48.28) | 35.9%-60.8% | |
| 6-8 hours | 23 (39.66) | 28.1%-52.5% | |
| > 8 hours | 7 (12.07) | 6.0%-22.9% | |
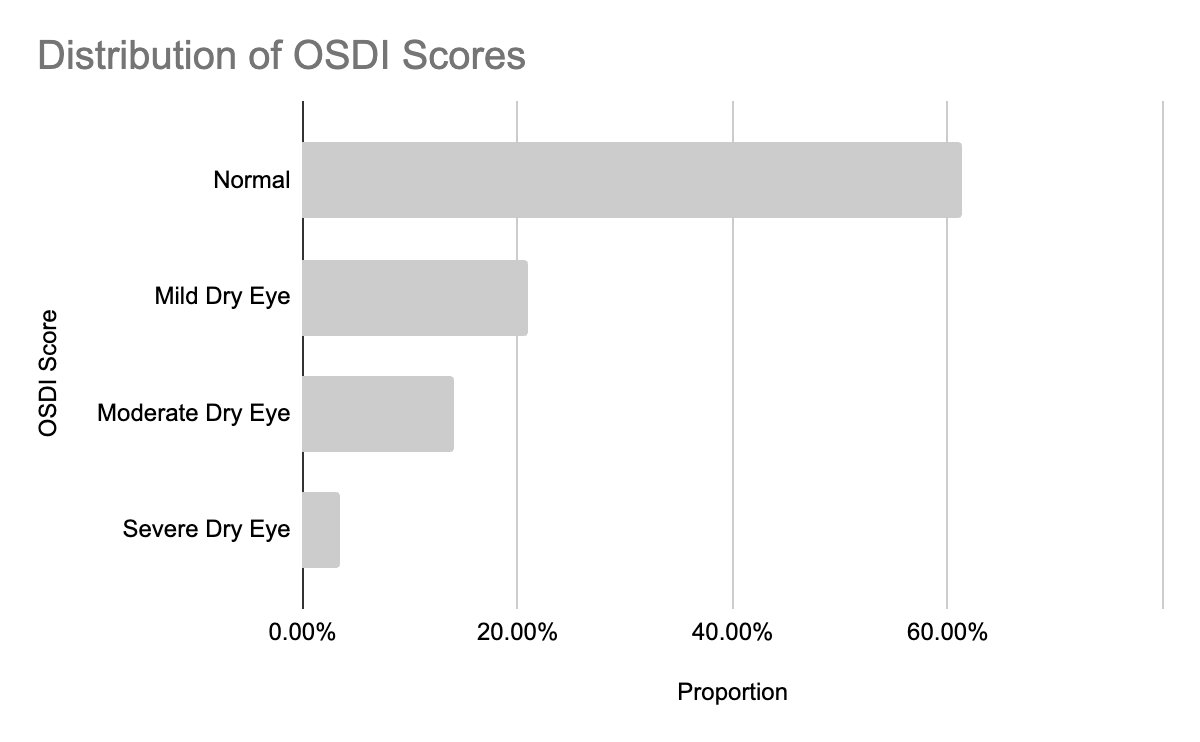
In this study, the prevalence of dry eye disease symptoms among high school students was measured to be 39.65% (95% CI 28.1-52.5%). 20% (95% CI 12.3-32.8 of respondents reported mild symptoms, 16% (95% CI 8.4-26.9%) reported moderate symptoms, and approximately 3% (95% CI 1.0-11.7%) reported severe symptoms, as shown in Figure 7.
The differences between the healthy students and those with symptoms of DED are reported in Table 4. Their demographics are also included. The prevalence of DED symptoms was higher among female students (45%) than among males (35.1%). Students using contact lenses were found to have a DED prevalence rate of 25% and those with allergies had a 47.62% prevalence rate. 39.02% of students who reported experiencing some stress also had dry eye-related symptoms. 39.39% of students who reported getting less than 6 hours of sleep per night experienced dry eye symptoms. The most significant DED prevalence (66.67%) was found among respondents who used digital devices for more than 6 hours (Table 4).
| Variables | Healthy | Dry Eye Symptoms | p-value | OR (95% CI) | p-value | aOR (95% CI) | |||
| (n, %) | (n, %) | ||||||||
| Female | |||||||||
| No | 23 (63.9) | 13 (36.1) | |||||||
| Yes | 11 (55) | 9 (45) | 0.55 | 1.40 (0.47–4.21) | 0.66 | 1.30 (0.40–4.20) | |||
| Contact Lens Wear | |||||||||
| No | 24 (63.16) | 14 (36.84) | |||||||
| Yes | 15 (75.0) | 5 (25.0) | 0.277 | 0.57 (0.17-1.91) | 0.52 | 0.65 (0.18-2.39) | |||
| Allergies | |||||||||
| No | 33 (89.19) | 4 (10.81) | |||||||
| Yes | 19 (90.47) | 2 (9.52) | 0.932 | 0.87 (0.15-5.20) | 0.90 | 1.08 (0.32-3.63) | |||
| Stress (PSS-4) | |||||||||
| None | 11 (64.7) | 6 (35.5) | |||||||
| Mild | 11 (57.89) | 8 (42.11) | 0.822 | 0.90 (0.30-2.69) | 0.93 | 0.98 (0.60-1.60) | |||
| Medium | 6 (66.67) | 3 (33.33) | |||||||
| Severe | 8 (61.54) | 5 (38.46) | |||||||
| Sleep | |||||||||
| greater than 6 hours | 16 (64.0) | 9 (36.0) | |||||||
| less than 6 hours | 20 (60.61) | 13 (39.39) | 0.371 | 1.16 (0.39-3.38) | 0.88 | 1.10 (0.34-3.51) | |||
| Digital Device Use | |||||||||
| less than 6 hours | 22 (78.57) | 6 (21.43) | |||||||
| greater than 6 hours | 10 (33.33) | 20 (66.67) | <0.001 | 7.33 (2.25-23.85) | 0.06 | 3.16 (0.95-10.53) | |||
| OSDI | |||||||||
| OSDI Score (mean ± SD) | 4 ± 2 | 20 ± 7 | |||||||
Univariate analysis was performed to investigate the correlation between risk factors and DED. The results showed that digital device use exceeding six hours had a statistically significant correlation (p-value <) with an odds ratio (OR) of 7.33 (95% CI 2.25-23.85), which did not include a value of one in the confidence interval. All other factors (contact lens wear, sleep deprivation, allergies, and stress) were found to be statistically insignificant with p-values greater than 0.05 and odds ratios falling within confidence intervals that included the value one, indicating no significant correlation between the risk factors and DED59. All the risk factors were further analyzed using a multivariable binary logistic regression model, which considered all the variables simultaneously. After adjusting for contact lens wear, stress, sleep, digital screen use, and allergies, only digital device use of greater than 6 hours per day was found to have a considerable effect (adjusted OR=3.2, 95% CI 0.95-10.53, p=0.06). All the other variables were found to have adjusted odds ratios falling within confidence intervals that included the value one.
Since there are no standard ways to measure DED symptoms among adolescents, a sensitivity analysis using the OSDI cut-off of >9 and >15 was performed. With the standard adult cut-off of >12, DED prevalence among adolescents was found to be 39.7% (95% CI 28.1-52.5%). With the new cut-off of >15 DED prevalence was found to be 27.6 (95% CI 17.8-40.2%). There were no OSDI scores between 10 and 12 in our dataset, which left the prevalence numbers unchanged (39.7%, 95% CI 28.1-52.5%) compared to the original threshold.
5. Discussion
The objective of this study was to determine the prevalence of DED among high school students in Illinois and to identify and analyze the associated risk factors. The results of this study indicate a statistically significant positive correlation between digital device use and DED symptoms among high school students in Illinois, in line with the initial hypothesis. The results also indicate a positive correlation between contact lens wear and DED symptoms, although it is not statistically significant, thereby partially refuting the initial hypothesis.
The prevalence rate of DED symptoms among children (ages 6-18) found from the meta-analysis of existing studies was 32% (95% CI, 21%–46%). In comparison, the prevalence rate among high school students in Illinois (ages 14-18) found using the survey was 39.7% (95% CI 28.1-52.5%). Both these findings are higher than the 5-30% prevalence among adults reported by Stapleton et al2. It is also higher than the 5.5%-26.6% rate reported among the pediatric population (ages 6-18) by Stapleton et al2. However, one study from Mexico by Garza-Leon et al60 reported a high rate of symptoms (65.4%) among high schoolers. The discrepancies in DED prevalence rates between existing studies and this study could be due to the limited amount of pediatric DED data available from the United States6. According to Tonkerdmongkol et al61, the higher prevalence of DED among adolescents could be due to the use of online learning tools during the COVID-19 pandemic and its continued use since then. Similarly, Zou et al18 also suggest that the prevalence of DED has been increasing among schoolchildren over the past twenty years, likely due to the widespread use of digital devices by the younger population.
The high heterogeneity (i2=99.9%) observed among the 28 studies included in the meta-analysis is likely because of differences in timeframe, geography, healthcare systems, and cultural practices. For example, studies such as Uchino et al were conducted before the widespread adoption of cellphones13, whereas more recent studies such as Tonkerdmongkol et al were conducted post-COVID when higher screen exposure due to online learning was prevalent5 Geographical variations were significant with studies conducted in desert climates (Saudi Arabia), humid subtropical climates (China and South Korea), and temperate climates (United States). Although temperature and humidity can have an effect on tear evaporation rates, the included studies showed no consistent relationship between climate and DED prevalence. Further research using standardized climate models is needed to clarify this association18 Healthcare systems differ between countries, which could also be a factor in the variations in DED prevalence reported. Some countries like, South Korea and Japan, have comprehensive vision screening programs in place, while countries like India only test for visual acuity, which could lead to underdiagnoses. Cultural practices such as the high use of cosmetic contact lens wear in countries such as South Korea, Japan, and China could also be contributing to the variability in DED prevalence reported62 These factors, along with variations in diagnostic methods, could explain the heterogeneity in the prevalence observed across the studies included.
The studies used in our meta-analysis used different diagnostic methods for detecting DED symptoms. Some used self-reported questionnaires such as OSDI, and some used measurements based on clinical signs. The current study did not analyze these groups separately because several of the included studies used mixed methods in identifying DED, which likely was a contributor to the high heterogeneity observed (i2=99.9%). Unlike our current study, Zou et al. used a rigorous systematic analysis under stricter diagnostic criteria to identify pediatric DED prevalence, distinguishing between clinical signs and self-reported symptoms. When clinical signs such as tear break down times were used for diagnosis, their study reported a lower prevalence of 16.6% whereas when symptoms are self-reported using a questionnaire, a prevalence of 35% was reported, comparable to the rate found in this study. While our current study did not analyze pre- and post-COVID prevalence of DED, Zou et al reported a significant increase from 18.7% pre-COVID to 44% post-COVID. Although studies like Zou et al’s systematic review use a far rigorous method to measure pediatric DED prevalence, both their study and our current study found high heterogeneity in existing literature, and digital device use remained a common correlation18
Previous studies have also reported age and sex based differences in DED prevalence. Among the pediatric population, girls are reported to have a higher prevalence of DED than boys, potentially due to hormonal changes that affect tear film stability63 In our survey, females were found to have a higher prevalence of DED (45%, OR 1.40, 95% CI 0.47-4.21, p=0.55) when compared to males (35%), but this difference was not statistically significant, likely due to the small sample size. Our survey also focused on the adolescent age group of 14-18. This subgroup has not been studied exclusively in previous studies, but Stapleton et al report that DED prevalence increases with age in the pediatric population likely due to increased academic pressures and higher digital screen exposure2
The survey used in this study only collected demographic information such as age and sex, and did not include factors such as ethnicity or socioeconomic status (SES). Publicly available records indicate that the high school attended by respondents is approximately 47% White, 32% Asian, 12% Hispanic or Latino, and 5% African American, with 20-25% students qualifying for free or reduced-price lunch. Previous studies have shown that lower SES is associated with higher DED symptoms, due to reduced access to health care and a greater likelihood of comorbidities that can exacerbate DED symptoms64 Additionally, Wang et al report that there is a greater prevalence of DED in the Asian population compared to the Caucasian population, likely linked to their anatomical predisposition to incomplete blinking and eyelid tension65 Given that the school where this study’s survey was conducted has a moderately diverse student population, the adolescent DED prevalence this study reports is likely to be broadly applicable to similar US adolescent populations. However, the findings may not fully generalize to schools that have highly different socioeconomic and demographic profiles.
The high heterogeneity (i2=99.9%) observed among the 28 studies included in the meta-analysis is likely because of differences in timeframe, geography, healthcare systems, and cultural practices. For example, studies such as Uchino et al were conducted before the widespread adoption of cellphones13, whereas more recent studies such as Tonkerdmongkol et al were conducted post-COVID when higher screen exposure due to online learning was prevalent5 Geographical variations were significant with studies conducted in desert climates (Saudi Arabia), humid subtropical climates (China, South Korea), and temperate climates (United States). Although temperature and humidity can have an effect on tear evaporation rates, the included studies showed no consistent relationship between climate and DED prevalence18 Further research using standardized climate models is needed to clarify this association. Healthcare systems differ between countries, which could also be a factor in the variations in DED prevalence reported. Some countries like South Korea and Japan have comprehensive vision screening programs in place, while countries like India only test for visual acuity which could lead to underdiagnoses. Cultural practices such as the high use of cosmetic contact lens wear in countries such as South Korea, Japan, and China could also be contributing to the variability in DED prevalence reported62 These factors along with variations in diagnostic methods could explain the heterogeneity in the prevalence observed across the studies included.
The studies used in our meta-analysis used different diagnostic methods for detecting DED symptoms. Some used self-reported questionnaires such as OSDI and some used measurements based on clinical signs. The current study did not analyze these groups separately because several of the included studies used mixed methods in identifying DED, which likely was contributor to the high heterogeneity observed (i2=99.9%). Unlike our current study, Zou at al used a rigorous systematic analysis under stricter diagnostic criteria to identify pediatric DED prevalence, distinguishing between clinical signs and self-reported symptoms18 When clinical signs such as tear break down times were used for diagnosis, their study reported a lower prevalence of 16.6% whereas when symptoms are self-reported using a questionnaire, prevalence of 35% was reported, comparable to the rate found in this study. While our current study did not analyze pre- and post- COVID prevalence of DED, Zou et al reported a significant increase from 18.7% pre- COVID to 44% post- COVID. Although studies like Zou et al’s systematic review use a far rigorous method to measure pediatric DED prevalence, both their study and our current study found high heterogeneity in existing literature and digital device use remained a common correlation18
Previous studies have also reported age and sex based differences in DED prevalence. Among the pediatric population, girls are reported to have a higher prevalence of DED than boys, potentially due to hormonal changes that affect tear film stability63 In our survey, females were found to have a higher prevalence of DED (45%, OR 1.40 95% CI 0.47-4.21 p=0.55) when compared to males (35%), but this difference was not statistically significant, likely due to the small sample size. Our survey also focused on the adolescent age group of 14-18. This subgroup has not been studying exclusively in previous studies, but Stapleton et al report that DED prevalence increases with age in the pediatric population likely due to increased academic pressures and higher digital screen exposure2
The survey used in this study only collected demographics information such as age and sex, and did not include factors such as ethnicity or socioeconomic status (SES). Publicly available records indicate that the high school attended by respondents is approximately 47% White, 32% Asian, 12% Hispanic or Latino, and 5% African American, with 20-25% students qualifying for free or reduced-price lunch. Previous studies have shown that lower SES is associated with higher DED symptoms, due to reduced access to health care and a greater likelihood of comorbidities that can exacerbate DED symptoms64 Additionally, Wang et al report that there is a greater prevalence of DED in the Asian population compared to the Caucasian population, likely linked to their anatomical predisposition to incomplete blinking and eyelid tension65 Given that the school where this study’s survey was conducted has a moderately diverse student population, the adolescent DED prevalence this study reports is likely to be broadly applicable to similar US adolescent populations. However, the findings may not fully generalize to schools that have highly different socioeconomic and demographic profiles.
The meta-analysis of existing studies suggested that digital device use of more than six hours a day, 63% (95% CI 43%-80%, p < 0.001), has a strong correlation with DED symptoms. This finding aligns closely with the data obtained from a local survey of high school students in Illinois, where a univariate analysis found that 66.67% (OR 7.33, 95% CI 2.25-23.85, p<0.05) of participants with DED symptoms used digital devices for more than six hours a day. Digital device usage emerged as the only statistically significant risk factor in the univariate analysis. Additionally, in the adjusted multivariable model, that included sex, contact lens wear, allergies, sleep, stress and digital exposure, only digital exposure of greater than 6 hours retained a substantial association with DED symptoms (adjusted OR=3.16, 95% CI 0.95-10.53, p=0.06). This estimate suggests that adolescents who use digital devices for more than 6 hours a day have roughly triple the odds of DED symptoms even after other risk factors are controlled. This correlates with the results from Alnahdi et al29, that also showed that increased screen time is associated with DED symptoms among children in Saudi Arabia. Al-Mohtaseb et al14 reported that prolonged screen use induces more DES symptoms due to a reduced blink rate and increased evaporation from the ocular surface. In contrast, by using sensors in iPads to measure blink rates during digital device use, Muntz et al66 report that higher blink rates are associated with higher DED symptoms. These inconsistencies highlight the need for further research to clarify the pathophysiology of DED symptoms.
Although our survey revealed no statistically significant correlation between contact lens wear and DED symptoms, numerous past studies have reported an increase in DED symptoms among contact lens wearers. Among adult contact lens wearers, Caffery et al67 reported a DED prevalence of 50.1%, when compared to 21.7% among non-contact lens wearers68. Zhang et al18 reported a 32.8% prevalence of dry eye symptoms among high school students in China, compared to 8.4% among non-contact lens wearers. However, Young et al69 reported that no clinical signs of dryness were observed among 23% of contact lens wearers in their study. Gomes et al70 suggest that these conflicting interpretations may be due to two definitions of contact lens (CL)- related dryness that have not been explored sufficiently: CL-induced (CLIDE) and CL-associated (CLADE) dry eyes. CLIDE happens when DED symptoms did not exist prior to contact lens wear, and CLADE happens due to a pre-existing dry eye condition. Little research has been done on CLIDE, with one example coming from Alzahrani et al71, reporting that 42% developed CLIDE after the use of contact lenses. Pult et al.72 assessed DED symptoms among contact lens wearers to assess CLADE and found a positive correlation. Further research is needed to fully understand the impact of contact lenses on dry eye symptoms73.
While the meta-analysis found weak correlations between allergies, stress, and DED among children, the local survey found no statistical significance in the relationships between these factors. This could be because survey respondents might experience allergy symptoms only during the peak seasonal allergy period, which in Illinois is between May and June, while the survey was conducted in February, which could have played a role in the self-assessment of allergies and the potential weak association with DED74. Similarly, stress is conditional on specific periods, such as exam weeks, when emphasis on academic performance weighs heavily on high school students17. The relatively small sample size, the limited number of studies available, and the small number of survey respondents may have also reduced the statistical significance of the results. Future research with a larger sample size and clinical measurements of allergy and stress can offer better insights into their influence on DED symptoms.
Other environmental factors that could have influenced DED among adolescents, such as low humidity and academic demands, were not captured in this study. Berg et al, report that patients residing in higher humidity areas are less likely to experience dry eye symptoms. Lower humidity was reported to increase tear evaporation rates and ocular surface dryness in arid climates75 Indoor humidity control systems (HVAC) in the respondents’ school and home environments, which could reduce indoor humidity, particularly when heating is used in Illinois, could have contributed to the DED symptoms reported. Qaddumi et al, also report that in a university population aged between 17-24 years, DED severity was positively associated with academic demands. When academic demands increase, changes in blink rates and reduced tear secretion could lead to higher DED symptoms76 Future research should consider these factors when interpreting DED prevalence and designing preventive strategies for adolescents.
As discussed earlier, this study defined symptomatic DED as having an OSDI score of >12, similar to the thresholds used among adults. Under this definition, DED prevalence was found to be 39.7% (95% CI 28.1-52.5%). Upon conducting a sensitivity analysis with a stricter OSDI cut-off of >15, DED prevalence reduced to 27.6 (95% CI 17.8-40.2%) because the borderline cases were reclassified as non-symptomatic. This prevalence rate is closer to the prevalence (32%) calculated from the meta-analysis of existing studies on children of all ages. The OSDI cut-off of >9 did not change the prevalence numbers because there were no values that fell under the 10-12 category. The stricter OSDI cut-off of >15 did not change the direction of association between digital device use and DED symptoms. Digital device use of >6 hours was still a dominant factor with an odds ratio of 4.77 (95% CI 1.18-19.21). Tonkerdmongkol et al found a similar result when stricter cut-off scores were applied to responses from children, confirming that digital device use is a risk factor even under a conservative symptom definition, thereby supporting robustness5
5.1 Implications
This new understanding of the prevalence of DED among high school students (39%) in the United States, along with their associated risk factors, is essential because there is a dearth of relevant data on dry eye disease among the adolescent population77. DED is often neglected, not fully understood, and is considered rare among the pediatric population because of the lack of epidemiological data and difficulties in symptom quantification6. Studies have also reported digital screen usage rates of 92.7% in the pediatric population14. As confirmed by this study, there is a strong positive correlation between the use of digital screens and DED in adolescents. With the understanding provided by this study, schools can implement interventions by educating students about eye health, and pediatricians can screen for DED among adolescents with high device use, with the goal of diagnosing DED early. Modifications in behavior, such as blinking exercises and intermittent eye rests, have been proposed as methods to prevent and mitigate dry eyes during the high school years. This study also highlights the need for diagnostic tests that accurately assess the signs of DED and establish thresholds that can safely and effectively guide treatment6. But these strategies present challenges because they depend on consistent adherence to behavior changes by teens as well as constraints due to school logistics. Given these challenges, a school based intervention study that tests the outcomes of timed eye rests and blink training over a period of time can help gauge effectiveness of such interventions before a policy change in implemented. Donthineni et al48 also suggest an integrative approach to manage and prevent DED by intercepting of risk factors, preventing of the onset of DED, enabling early diagnosis and treatment, and limiting of complications.
5.2 Limitations
This study has its limitations, as it has not examined how a combination of risk factors (e.g., stress and contact lens wear) contributes to the prevalence of DED among high school students. It has also not investigated how an increase in digital device use may exacerbate the severity of DED symptoms. Furthermore, this study has relied solely on high school students doing a self-assessment of their dry eye symptoms. Although the OSDI questionnaire is a validated method to assess symptoms in adults, its robustness has not yet been established among children and adolescents78. Studies have shown that when DED symptoms are measured using clinical tests such as Schirmer test (measures tear production), flourescein staining (detects corneal defects), and tear break-up time test (measures stability of the tear film), prevalence estimates of DED among children can differ significantly16. The outcomes identified in the current study are only through self-reported symptoms and the absence of these objective tests limits external validity. Future research should incorporate clinical tests along with symptom questionnaires to validate the prevalence estimate observed in this study. Additionally, since contact lens wear, sleep deprivation, stress, and allergies did not show a significant relationship with DED, it may be due to the small sample size of the surveyed group. Further research should therefore be conducted on a larger population to estimate the associated risk factors among high school students.
6. Conclusion
This study has revealed that the prevalence of DED symptoms in the high school population in Illinois is 39%, which is higher than reported by most studies on adults and children. The most significant risk factor associated with DED symptoms among this cohort was found to be the use of digital devices for longer than six hours. This finding is significant because it informs policymakers, educators, and parents on how to implement preventive measures and guidelines for digital learning, such as taking breaks from screens and encouraging more physical activity.
References
- A. S. Bhavsar, S. G. Bhavsar, S. M. Jain. A review on recent advances in dry eye: Pathogenesis and management. Oman journal of ophthalmology. 4(2), 50–56 (2011). [↩]
- F. Stapleton, F. G. Velez, F. G., Lau, C., & Wolffsohn, J. S. Dry eye disease in the young: A narrative review. The ocular surface. 31, 11–20 (2024). [↩] [↩] [↩] [↩] [↩] [↩] [↩] [↩] [↩] [↩] [↩]
- F. Stapleton, F. G. Velez, F. G., Lau, C., & Wolffsohn, J. S. Dry eye disease in the young: A narrative review. The ocular surface. 31, 11–20 (2024). [↩]
- F. Stapleton, F. G. Velez, F. G., Lau, C., & Wolffsohn, J. S. Dry eye disease in the young: A narrative review. The ocular surface, 31, 11–20 (2024). [↩]
- D. Tonkerdmongkol, T. Poyomtip, C. Poolsanam, A. Watcharapalakorn, P. Tawonkasiwattanakun. Prevalence and associated factors for self-reported symptoms of dry eye among Thai school children during the COVID-19 outbreak. PLoS One. 18(4), e0284928 (2023). [↩] [↩] [↩] [↩]
- E. Villani, P. Nucci, P. Pediatric dry eye. American Academy of Ophthalmology (2020). [↩] [↩] [↩] [↩]
- L. Chen, L. Pi, J. Fang, X. Chen, N. Ke, Q. Liu. High incidence of dry eye in young children with allergic conjunctivitis in Southwest China. Acta Ophthalmo. 94(8), e727-e730 (2016). [↩]
- M. M. Hom, A. L. Nguyen, L. Bielory, Allergic conjunctivitis and dry eye syndrome. Annals of Allergy, Asthma; Immunology. 108(3), 163–166 (2012). [↩]
- M. Ponti, Promoting healthy screen use in school-aged children and adolescents. Canadian Paediatric Society. (2024). [↩]
- J. P. Craig, K. K. Nichols, E. K. Akpek, B. Caffery, H. S. Dua, C. K. Joo, Z. Liu, J. D. Nelson, J. J. Nichols, K. Tsubota, F. Stapleton, TFOS DEWS II definition and classification report. The Ocular Surface. 15(3), 276–283 (2017). [↩]
- C. Baudouin, P. Aragona, E. M. Messmer, A. Tomlinson, M. Calonge, K. G. Boboridis, Y. A. Akova, G. Geerling, M. Labetoulle, M. Rolando, M. Role of hyperosmolarity in the pathogenesis and management of Dry Eye Disease: Proceedings of the Ocean Group Meeting. The Ocular Surface. 11(4), 246–258 (2013). [↩]
- M. Guzmán, M. Miglio, I. Keitelman, C. M. Shiromizu, F. Sabbione, F. Fuentes, A. S. Trevani, M. N. Giordano, J. G. Galletti, Transient tear hyperosmolarity disrupts the neuroimmune homeostasis of the ocular surface and facilitates dry eye onset. Immunology. 161(2), 148–161 (2020). [↩]
- M. Uchino, M. Dogru, Y. Uchino, K. Fukagawa, S. Shimmura, T. Takebayashi, D. A. Schaumberg, K. Tsubota. Japan Ministry of Health study on prevalence of dry eye disease among Japanese high school students. Am J Ophthalmol. 146(6), 925-929.e922 (2008). [↩] [↩] [↩]
- Z. Al-Mohtaseb, S. Schachter., B. Shen Lee, J. Garlich, W. Trattler, W. The relationship between dry eye disease and digital screen use. Clinical Ophthalmology. 15, 3811–3820 (2021). [↩] [↩] [↩]
- S. Koh, Contact lens wear and Dry Eye: Beyond the known. Asia-Pacific Journal of Ophthalmology. 9(6), 498–504 (2020). [↩]
- A. Li, X. Zhang, Y. Guo, J. Wang, Y. Hao, Y. Gu, Y. Jie, The association between Dry Eye and sleep disorders: The evidence and possible mechanisms. Nature and Science of Sleep. 14, 2203–2212 (2022). [↩]
- J. Y. Hyon, H. K. Yang, S. B. Han, Association between dry eye disease and psychological stress among paramedical workers in Korea. Scientific Reports. 9(1), 320-322, (2019). [↩] [↩] [↩]
- Y. Zou, D. Li, V. Gianni, N. Congdon, P. Piyasena, S. G. Prakalapakorn, R. Zhang, Z. Zhao, V. F. Chan, M. Yu. Prevalence of dry eye disease among children: A systematic review and meta-analysis. BMJ Open Ophthalmology. 10(1), 321 (2025). [↩] [↩] [↩] [↩] [↩] [↩] [↩]
- K. L. Greiner, J. J. Walline. Dry eye in pediatric contact lens wearers. Eye Contact Lens. 36(6), 352-355 (2010). [↩]
- Y. Zhang, H. Chen, X. Wu, X. Prevalence and risk factors associated with dry eye syndrome among senior high school students in a County of Shandong Province, China. Ophthalmic Epidemiology. 19(4), 226–230 (2012). [↩]
- A. Basu. How to conduct meta-analysis: a basic tutorial. (2017). [↩] [↩] [↩]
- Y. Cai, J. Wei, J. Zhou, W. Zou. Prevalence and Incidence of Dry Eye Disease in Asia: A Systematic Review and Meta-Analysis. Ophthalmic research. 65(6), 647–658 (2022). [↩]
- M. J. Page, J. E. McKenzie, P. M. Bossuyt, I. Boutron, T. C. Hoffmann, C. Mulrow, L. Shamseer, J. M. Tetzlaff, E. A. Akl, S. E. Brennan, R. Chou, J. Glanville, J. M. Grimshaw, A. Hróbjartsson, M. M. Lalu, T. Li, E. W. Loder, E. Mayo-Wilson, S. McDonald, D. Moher, The Prisma 2020 statement: An updated guideline for reporting systematic reviews. BMJ. (2021). [↩]
- M. Blettner, W. Sauerbrei, B. Schlehofer, T. Scheuchenpflug, C. Friedenreich, Traditional reviews, meta-analyses and pooled analyses in epidemiology. International Journal of Epidemiology. 28(1), 1–9 (1999). [↩]
- J. R. Dettori, D. C. Norvell, J. R. Chapman. Fixed-Effect vs Random-Effects Models for Meta-Analysis: 3 Points to Consider. Global spine journal. 12(7), 1624–1626 (2022). [↩]
- W. Alnahdi, M. Hadrawi, E. Danish, A. Alghamdi, N. Taher, A. T. Alfaraidi, N. Alageel, Relationship Between Screen Time and Dry Eye Symptoms During the COVID-19 Pandemic in the Pediatric Population of the Western Region of Saudi Arabia. Cureus. 14(11), e31015 (2022). [↩] [↩] [↩]
- R. M. Schiffman, M. D. Christianson, G. Jacobsen, J. D. Hirsch, B. L. Reis, Reliability and validity of the Ocular Surface Disease Index. Archives of ophthalmology. 118(5), 615–621 (2000). [↩]
- R. M. Schiffman, M. D. Christianson, G. Jacobsen, J. D. Hirsch, B. L. Reis, Reliability and validity of the Ocular Surface Disease Index. Archives of ophthalmology. 118(5), 615–621 (2000). [↩]
- W. Alnahdi, M. Hadrawi, E. Danish, A. Alghamdi, N. Taher, A. T. Alfaraidi, N. Alageel, Relationship Between Screen Time and Dry Eye Symptoms During the COVID-19 Pandemic in the Pediatric Population of the Western Region of Saudi Arabia. Cureus. 14(11), e31015 (2022). [↩] [↩]
- K. Abbott, K. S. Hanson, J. Lally, Prevalence of dry eye disease in the low vision population at the University of Colorado. J Optom. 17(2), 100501 (2024). [↩]
- Ossenkoppele, R. et al. The impact of demographic, clinical, genetic, and imaging variables on tau PET status. Eur J Nucl Med Mol Imaging 48, https://doi.org/10.1007/s00259-020-05099-w (2021). [↩]
- Bateman, R. J. et al. Clinical and Biomarker Changes in Dominantly Inherited Alzheimer’s Disease. New England Journal of Medicine 367, https://doi.org/10.1056/NEJMoa1202753 (2012). [↩]
- Hofmann, A. , H. L. M. , L. M. et al. Comparative neurofilament light chain trajectories in CSF and plasma in autosomal dominant Alzheimer’s disease. Nat Commun https://doi.org/10.1038/s41467-024-52937-8 (2024). [↩]
- Wybitul M, B. A. L. N. H. C. T. V. G. A. Trajectories of amyloid beta accumulation – Unveiling the relationship with APOE genotype and cognitive decline. Neurobiol Aging 44–53 https://doi.org/10.1016/j.neurobiolaging.2024.03.007 (2024). [↩]
- Rother, C. et al. Experimental evidence for temporal uncoupling of brain Aβ deposition and neurodegenerative sequelae. Nat Commun 13, https://doi.org/10.1038/s41467-022-34538-5 (2022). [↩]
- Frontzkowski, L. et al. Earlier Alzheimer’s disease onset is associated with tau pathology in brain hub regions and facilitated tau spreading. Nat Commun 13, https://doi.org/10.1038/s41467-022-32592-7 (2022). [↩]
- Balázs, N., Bereczki, D. & Kovács, T. CHOLINESTERASE INHIBITORS and MEMANTINE for the TREATMENT of ALZHEIMER and NON-ALZHEIMER DEMENTIAS. Ideggyogy Sz 74, https://doi.org/10.18071/isz.74.0379 (2021). [↩]
- Goel, P. et al. Neuronal cell death mechanisms in Alzheimer’s disease: An insight. Frontiers in Molecular Neuroscience vol. 15 Preprint at https://doi.org/10.3389/fnmol.2022.937133 (2022). [↩]
- Xia, P., Chen, H. S. V., Zhang, D. & Lipton, S. A. Memantine preferentially blocks extrasynaptic over synaptic NMDA receptor currents in hippocampal autapses. Journal of Neuroscience 30, https://doi.org/10.1523/JNEUROSCI.2488-10.2010 (2010). [↩]
- Effect of Memantine on Functional Communication in Patients With Alzheimer’s Disease. NCT00469456 (2009). [↩]
- Colovic, M. B., Krstic, D. Z., Lazarevic-Pasti, T. D., Bondzic, A. M. & Vasic, V. M. Acetylcholinesterase Inhibitors: Pharmacology and Toxicology. Curr Neuropharmacol 11, https://doi.org/10.2174/1570159X11311030006 (2013). [↩]
- Cholinesterase Inhibitor Discontinuation (CID). NCT02248636 (2020). [↩]
- Hardy, J. & Allsop, D. Amyloid deposition as the central event in the aetiology of Alzheimer’s disease. Trends in Pharmacological Sciences vol. 12 Preprint at https://doi.org/10.1016/0165-6147(91)90609-V (1991). [↩]
- Arbus, C. et al. Antidepressant use in Alzheimer’s disease patients: Results of the REAL.FR cohort. Int Psychogeriatr 22, https://doi.org/10.1017/S1041610209990780 (2010). [↩]
- Mo, M. , A. T. , H. M. T. et al. Antidepressant use and cognitive decline in patients with dementia: a national cohort study. BMC Med https://doi.org/10.1186/s12916-025-03851-3 (2025). [↩]
- Cardenas, V., Rahman, A., Zhu, Y. & Enguidanos, S. Reluctance to Accept Palliative Care and Recommendations for Improvement: Findings From Semi-Structured Interviews With Patients and Caregivers. American Journal of Hospice and Palliative Medicine 39, https://doi.org/10.1177/10499091211012605 (2022). [↩]
- Fernández, M., Gobartt, A. L. & Balañá, M. Behavioural symptoms in patients with Alzheimer’s disease and their association with cognitive impairment. BMC Neurol 10, https://doi.org/10.1186/1471-2377-10-87 (2010). [↩]
- Wang, C. et al. The effects of microglia-associated neuroinflammation on Alzheimer’s disease. Frontiers in Immunology vol. 14 Preprint at https://doi.org/10.3389/fimmu.2023.1117172 (2023). [↩]
- Metaxas, A. & Kempf, S. J. Neurofibrillary tangles in Alzheimer’s disease: Elucidation of the molecular mechanism by immunohistochemistry and tau protein phospho-proteomics. Neural Regen Res 11, https://doi.org/0.4103/1673-5374.193234 (2016). [↩]
- Rafii, M. & A. P. Amyloid-lowering immunotherapies for Alzheimer disease: current status and future directions. https://doi.org/10.1038/s41582-025-01123-5 (2025). [↩]
- van Dyck, C. H. et al. Lecanemab in Early Alzheimer’s Disease. Supplementary data. N Engl J Med https://doi.org/10.1056/NEJMoa2212948 (2022). [↩]
- Cummings, J. et al. Lecanemab: Appropriate Use Recommendations. Journal of Prevention of Alzheimer’s Disease vol. 10 Preprint at https://doi.org/10.14283/jpad.2023.30 (2023). [↩]
- Antolini, L. et al. Spontaneous ARIA-like Events in Cerebral Amyloid Angiopathy–Related Inflammation. Neurology 97, https://doi.org/10.1212/WNL.0000000000012778 (2021). [↩]
- Andrews D, D. S. C. H. S. M. C. D. The higher benefit of lecanemab in males compared to females in CLARITY AD is probably due to a real sex effect. Alzheimer’s Association https://doi.org/10.1002/alz.14467 (2025). [↩]
- Sims, J. R. et al. Donanemab in Early Symptomatic Alzheimer Disease: The TRAILBLAZER-ALZ 2 Randomized Clinical Trial. JAMA 330, https://doi.org/10.1001/jama.2023.13239 (2023). [↩]
- Krishnadas, N., Villemagne, V. L., Doré, V. & Rowe, C. C. Advances in Brain Amyloid Imaging. Seminars in Nuclear Medicine vol. 51 Preprint at https://doi.org/10.1053/j.semnuclmed.2020.12.005 (2021). [↩]
- Pereira da Silva AM, F. L. V. F. et al. Efficacy and APOE ε4-stratified risk of donanemab in Alzheimer’s disease: A systematic review and meta-analysis of randomized clinical trials. Journal of Alzheimer’s Disease https://doi.org/10.1177/13872877251361044 (2025). [↩]
- Zhao, L. et al. Macrophage-mediated degradation of β-amyloid via an apolipoprotein e isoform-dependent mechanism. Journal of Neuroscience 29, https://doi.org/10.1523/JNEUROSCI.5302-08.2009 (2009). [↩]
- . C. Norton, B. E. Dowd, M. L. Maciejewski, Odds ratios—current best practice and use. JAMA. 320(1), 84 (2018). [↩]
- M. Garza-León, E. López-Chavez, P. De La Parra-Colín, Prevalence of Ocular Surface Disease Symptoms in High School Students in Monterrey, Mexico. J Pediatr Ophthalmol Strabismus. 58(5), 287-291 (2021). [↩]
- D. Tonkerdmongkol, T. Poyomtip, C. Poolsanam, A. Watcharapalakorn, P. Tawonkasiwattanakun. Prevalence and associated factors for self-reported symptoms of dry eye among Thai school children during the COVID-19 outbreak. PLoS One. 18(4), e0284928 (2023). [↩]
- A.H. Chen, N.F. Abu Bakar, & P. Arthur, Comparison of the Pediatric Vision Screening Program in 18 countries across five continents, Journal of Current Ophthalmology, 31(4), 357–365 (2019). [↩] [↩]
- M. Ayaki, M. Kawashima, M. Uchino, K. Tsubota, K. Negishi, K, Gender differences in adolescent dry eye disease: a health problem in girls. Int J Ophthalmol. 11(2), 301-307 (2018). [↩] [↩]
- L. Tong, The association of dry eye symptoms with socioeconomic factors and quality of life, Journal of Clinical Research and Ophthalmology, 1(1), 006–013, (2014). [↩] [↩]
- M.T.M. Wang & J.P. Craig. Natural history of dry eye disease: Perspectives from inter-ethnic comparison studies. The Ocular Surface, 17(3), 424–433 (2019). [↩] [↩]
- A. Muntz, P. R. Turnbull, A. D. Kim, A. Gokul, D. Wong, T. S. Tsay, K. Zhao, S. Zhang, A. Kingsnorth, J. S. Wolffsohn, J. P. Craig, Extended screen time and dry eye in youth. Cont Lens Anterior Eye. 45(5), 101541 (2022). [↩]
- B. E. Caffery, D. Richter, T. Simpson, D. Fonn, M. Doughty, K. Gordon, K. The Canadian Dry Eye Epidemiology Study. Advances in experimental medicine and biology. 438, 805–806 (1998). [↩]
- M. J. Doughty, D. Fonn, D. Richter, T. Simpson, B. Caffery, K. Gordon, A patient questionnaire approach to estimating the prevalence of dry eye symptoms in patients presenting to optometric practices across Canada. Optometry and Vision Science. 74(8), 624–631 (1997). [↩]
- G. Young, R. Chalmers, L. Napier, J. Kern, C. Hunt, K. Dumbleton, Soft contact lens-related dryness with and without clinical signs. Optom Vis Sci. 89(8), 1125-32 (2012). [↩]
- J. A. Gomes, D. T. Azar, C. Baudouin, N. Efron, M. Hirayama, J. Horwath-Winter, T. Kim, J. S. Mehta, E. M. Messmer, J. S. Pepose, V. S. Sangwan, A. L. Weiner, S. E. Wilson, J. S.Wolffsohn, TFOS DEWS II iatrogenic report. The Ocular Surface. 15(3), 511–538 (2017). [↩]
- Y. Alzahrani, L. Colorado, N. Pritchard, N. Efron, Inflammatory Cell Upregulation of the Lid Wiper in Contact Lens Dry Eye. Optom Vis Sci. 93(8), 917-24 (2016). [↩]
- H. Pult, B. H. Riede-Pult, J. J. Nichols, Relation between upper and lower lids’ meibomian gland morphology, tear film, and dry eye. Optom Vis Sci. 89(3), E310-5 (2012). [↩]
- J. A. Gomes, D. T. Azar, C. Baudouin, N. Efron, M. Hirayama, J. Horwath-Winter, T. Kim, J. S. Mehta, E. M. Messmer, J. S. Pepose, V. S. Sangwan, A. L. Weiner, S. E. Wilson, J. S.Wolffsohn, TFOS DEWS II iatrogenic report. The Ocular Surface. 15(3), 511–538 (2017). [↩]
- Family Allergy & Asthma. A regional guide to seasonal allergies in the United States. (2024). [↩]
- E.J. Berg, G. Ying, M.G. Maguire, P.E. Sheffield, L.B. Szczotka-Flynn, P.A. Asbell, & J. F. Shen, Climatic and environmental correlates of dry eye disease severity: A report from the Dry Eye Assessment and Management (DREAM) study, Translational Vision Science, Technology, 9(5), 25 (2020). [↩]
- J.A.S. Qaddumi, A.F. Qaddumi, S.I. Abusalha, H.H. Qutieneh, A.M. Nimer, M.A.F. Assi, E. I. Nassar, N. Alhroub, B. Albashtawy, A. Alkhawaldeh, O. Al Omari, M. Albashtawy, S.B. M.Hani, S. Albashtawy, A. Abdalrahim, & Z. Albashtawy, Academic Demands and Eye Health: Prevalence and Quality of Life Effects of Dry Eye Disease among University Students, Jordan Journal of Nursing Research, 4(1), 4-11 (2025). [↩]
- N. Deo, P. Nagrale, Dry eye disease: An overview of its risk factors, diagnosis, and prevalence by age, sex, and Race. Cureus. 16(2), e54028 (2024). [↩]
- N. C. Chidi‐Egboka, B. Golebiowski, S. Lee, M. Vi, I. Jalbert. Dry Eye symptoms in children: Can we reliably measure them? Ophthalmic and Physiological Optics. 41(1), 105–115 (2020). [↩]


