
Abstract
The human gut microbiome shapes metabolism, immunity and long-term health, with early-life factors such as delivery mode exerting lasting influence on its composition. Despite well-established differences between vaginal and cesarean deliveries, there is a scarcity of intra-maternal studies that investigate microbiome variation in children delivered by both modes, particularly regarding whether these patterns persist into adolescence. Here we profile the fecal microbiota of a single household (n=5): a vaginally delivered firstborn, monozygotic twins delivered by cesarean section, and both parents, all cohabiting with similar diets for over 16 years. Microbiome from each samples were analyzed in phylum, family, and species levels. In this family, the gut microbiome was largely composed of Bacteroidota and Firmicutes in phylum level, although their proportions were differed among individuals. The Firmicutes-to-Bacteroidota ratio was greatest in the father and lowest in the mother, while the twins exhibited higher ratios than the firstborn. The Bray–Curtis dissimilarities revealed closest distance observed between the monozygotic twins FS-2 and FS-3 (0.18), indicating the highest similarity. FM (mother) represented moderate similarity with FS-1 (0.28) while large dissimilarities with FS-2 (0.60) and FS-3 (0.58). These findings may suggest that delivery mode possibly affected long-term retardation of microbiome similarity in a family. Further family-based studies including dietary habits and behaviors were remained to be investigated.
Introduction
The human gut microbiome is a dense, metabolically active microbial community that shapes host digestion, immune development, and metabolic homeostasis across the life course1. Although interpersonal variability is high, microbial communities are influenced by early-life exposures (eg, delivery mode2, feeding), shared environment3 and cohabitation, diet, age, and host genetics1,4. A frequently discussed community-level marker is the Firmicutes/Bacteroidetes (F/B) ratio5, historically linked to energy harvest and adiposity; early animal and human reports associated higher F/B with obesity and lower F/B with leanness, though subsequent studies and meta-analyses have produced mixed or null associations, underscoring context dependence and the need for individual-level resolution4,6,7,8.
Birth mode is a major determinant of initial microbial seeding: vaginal delivery exposes newborns to maternal vaginal and fecal microbes, whereas cesarean section (CS) bypasses this exposure and is associated with altered early microbial succession and immune imprinting9,10,11. Several longitudinal cohorts demonstrate that delivery-mode differences persist at least through the first year of life, with functional as well as taxonomic distinctions, although convergence can occur over time10,11,12. However, most work concentrates on infancy and early childhood; whether delivery-mode–related signatures or maternal resemblance persist into adolescence remains less clear. Emerging literature indicates that adolescence is a distinct developmental window for the gut microbiome with compositional features differing from both early childhood and adulthood, and modulated by both early-life and concurrent exposures13,14. Outside the gut, recent mother–daughter studies suggest that vertically transmitted vaginal microbial strains can persist into adolescence, raising the broader question of long-term maternal–offspring microbial similarity15.
Beyond birth mode, household sharing and diet are strong correlates of adult and pediatric microbiome similarity. Cohabiting family members (including spouses and siblings) harbor more similar communities than unrelated individuals, and close social relationships are associated with higher diversity and more shared taxa4,16. Twin studies add nuance: monozygotic (MZ) twins often display greater similarity than unrelated pairs, yet shared environment and aging can erode concordance, indicating substantial environmental shaping beyond genetics17,18,19. In children, quantitative dietary intake relates to microbial features, and family members who eat together may still diverge when specific food preferences differ (eg, fruit/vegetable emphasis), implying that within-household dietary micro-choices can create measurable microbial differences20. In parallel, the debated F/B–BMI link persists in pediatrics: some reports associate higher F/B with obesity, whereas larger or more recent syntheses report inconsistent effects, recommending cautious interpretation and stratified analyses6,7,21,22.
Motivated by these gaps, we investigated a single household in which offspring include both a vaginally delivered firstborn and cesarean-delivered MZ twins, all now in mid-to-late adolescence (>16 years). We quantified phylum-level composition, computed the F/B ratio in relation to individual BMI, profiled family-level taxa (eg, Ruminococcaceae, Veillonellaceae, Acidaminococcaceae), and assessed inter-individual similarity using analysis of Bray-Curtis distances. This design enables a focused examination of (i) whether maternal resemblance persists into adolescence, and (ii) whether MZ twins retain high similarity or diverge with growth. Our Results show household-wide dominance of Bacteroidota and Firmicutes with inter-individual differences, a nonuniform alignment between F/B and BMI across siblings, family-level taxa that segregate by individual, and the highest similarity within the MZ twin pair, framing a platform for mechanistic discussion in the context of prior evidence.
Materials & Methods
Sample collection
Fresh fecal samples were obtained from five members of the same family by the standard method provided from analysis company (Sanigen Co., South Korea): the father (FF), mother (FM), eldest son (FS-1, 18 years old), and twin sons (FS-2 and FS-3, 16 years old). Each participant collected approximately 2 g of fresh stool using sterile stool collection kits on 15th July, 2024. Samples were immediately sealed, stored at -20°C within 16hr, then transported to the sequencing facility in an hour (emergency delivery with ice bag). They were stored at −20 °C and processed within 2 days for DNA extraction (Sanigen Co., Seoul, Korea). In addition, anthropometric and birth-related metadata were summarized (Table 1) to evaluate host-associated factors. Body mass index (BMI) was measured at the time of sampling, and delivery mode (vaginal or cesarean section) was documented for offspring participants.
| Sample ID | Survived Reads | BMI (kg/m²) | Delivery Mode | QC Status |
| FF | 203,228 | 27.18 | N/A | PASS |
| FM | 174,555 | 20.32 | N/A | PASS |
| FS-1 | 193,731 | 26.12 | Vaginal | PASS |
| FS-2 | 206,029 | 19.95 | Cesarean | PASS |
| FS-3 | 224,453 | 19.6 | Cesarean | PASS |
DNA extraction, sequencing, and bioinformatic analysis
DNA extraction was performed by using standard kit (KAPA HiFi HotStart ReadyMix, Roche Co.), then the V3–V4 region of the bacterial 16S rRNA gene was amplified using standard primers and sequenced on the Illumina NextSeq platform with 2 × 300 bp paired-end reads. PCR was performed with an initial denaturation at 95 °C for 3 min, followed by 25 cycles of denaturation at 95 °C for 30 s, annealing at 55 °C for 30 s, and extension at 72 °C for 30 s, with a final extension at 72 °C for 5 min. Sequence data were processed in QIIME2 (version 2023.2) using the DADA2 pipeline for denoising and chimera removal. Reads were trimmed at 50 bp (forward primer) and 55 bp (reverse primer) and truncated to 275 bp and 227 bp, respectively, with a minimum overlap of 12 bp. A rarefaction depth of 9,000 reads per sample was used for alpha diversity analysis. Taxonomic classification was performed using a naïve Bayes classifier trained on the SILVA 138 reference database (99% OTUs, V3–V4 region) with a confidence cutoff of 0.7. Negative controls were not included in sequencing; however, the microbiome standard (Zymo Research Co.) was processed in parallel to validate results if irregularities were observed.
Ethics Statement
This study was conducted as an educational research project by a high school student and involved only immediate family members. All participants provided informed consent prior to sample collection. Anthropometric information (BMI) and delivery mode (vaginal or cesarean) were included as host-related variables, but all data were anonymized and reported only with coded sample IDs (FF, FM, FS-1, FS-2, FS-3). No personal identifying information was recorded, and the study was fully anonymized before analysis. Because the research was performed in a non-clinical, educational setting and involved only voluntary participation by family members, it did not require review by an Institutional Review Board (IRB). The study was carried out in accordance with the ethical principles outlined in the Declaration of Helsinki.
Results
Alpha diversity analysis
The Shannon diversity index was employed to evaluate how the diversity of the gut microbiota was differed from across family members (Figure 1-A). FF (father) exhibited the highest index level (5.3), indicating the greatest richness and evenness in microbial taxa. FS-1, FS-2, and FS-3 (offspring) represented slightly lower level (4.7~4.9) but remained relatively similar to each other. In contrast, the level of FM (mother) was observed at a markedly reduced level (2.1), representing a community dominated by a few taxa and reduced overall diversity. The rarefaction curves plateaued for all samples since sufficient sequencing depth for diversity was estimated
Beta diversity analysis
Principal Coordinates Analysis (PCoA) based on UniFrac distance was conducted to assess between-sample differences in microbial community composition by measuring presence or absence of species (Figure 1-B). FF clustered with FS-2 and FS-3, suggesting substantial overlap in the presence/absence of phylogenetically related taxa. FS-1 represented partial similarity with both red cluster (left section of PC1) and FM (upper section of PC2). FS-2 and FS-3 showed closest correlation in their microbiome composition. FM was observed clearly distinct from red cluster, indicating a substantially different microbiota composition.

Phylum-level composition
Taxonomic profiling at the phylum level revealed marked differences in gut microbiota composition among family members (Figure 2). Across all samples, Bacteroidota and Firmicutes were the two dominant phyla, collectively accounting for the majority of the relative abundance. In the father (FF), the microbiota comprised 47% Bacteroidota and 41% Firmicutes, with Proteobacteria at 9%. In the mother (FM), Bacteroidota represented 65% and Firmicutes 23%, with Proteobacteria at 11%. Among the sons, Bacteroidota remained the most abundant phylum, representing 58% in FS-1, 58% in FS-2, and 44% in FS-3, followed by Firmicutes at 32%, 36%, and 31%, respectively. Proteobacteria was consistently detected at low relative abundance in all offspring (10% in FS-1, 5% in FS-2, and 7% in FS-3). Notably, Verrucomicrobiota was exclusively observed in FS-3 (16%), whereas other minor phyla, including Fusobacteriota, Desulfobacteriota, Actinobacteriota, and Campilobacteriota, were present at trace levels (<2%) across all samples.

Firmicutes/Bacteroidota ratio and BMI
The Firmicutes/Bacteroidota (F/B) ratio is often considered a microbial biomarker linked to host metabolic status and energy harvest efficiency. Higher F/B ratios have been associated with increased energy extraction from the diet and higher body mass index (BMI), whereas lower ratios are generally linked to leanness8. Based on phylum level analysis, the F/B ratio could be analyzed and the ratio was varied substantially in family members, ranging from 0.35 to 0.87 (Figure 3). The highest ratio was observed in FF (0.87), while FM exhibited the lowest (0.35). Among the offspring, FS-1 showed a ratio of 0.55, whereas the monozygotic twins FS-2 and FS-3 displayed elevated ratios of 0.63 and 0.70, respectively. When compared with BMI values, FF’s high F/B ratio (0.87) corresponded with a higher BMI (27.18), whereas FS-2 (F/B ratio 0.63 / BMI 19.95) and FS-3 (F/B ratio 0.70 / BMI 19.6) had higher F/B ratios than FS-1 (FB ratio 0.55 / BMI 26.12) despite lower BMI values.

Family-level taxonomic composition
Analysis at the family level revealed distinct differences in microbiota composition among family members (Figure 4). Ruminococcaceae was abundant in FF (15.6%), FS-2 (8.1%), and FS-3 (9.2%), but was nearly absent in FM and FS-1 (<0.1%). FM and FS-1 showed a similar family level profile from Lachnospiraceae up to Veillonellaceae, with Bacteroidaceae dominating at 64.9% and 37.0%, respectively. Interestingly, Tannerellaceae was observed all family members (FF 5.9%, FS-1 21.0%, FS-2 8.1%, FS-3 7.5%) but not in the mother’s sample (FM). Acidaminococcaceae was represented above 2% in FF (8.5%), FS-1 (2.8%), and FS-2 (3.6%), but was absent in FM and FS-3. Additional differences were observed that Enterobacteriaceae was notable in FM (10.6%), and Akkermansiaceae was abundant in FS-3 (16.4%).

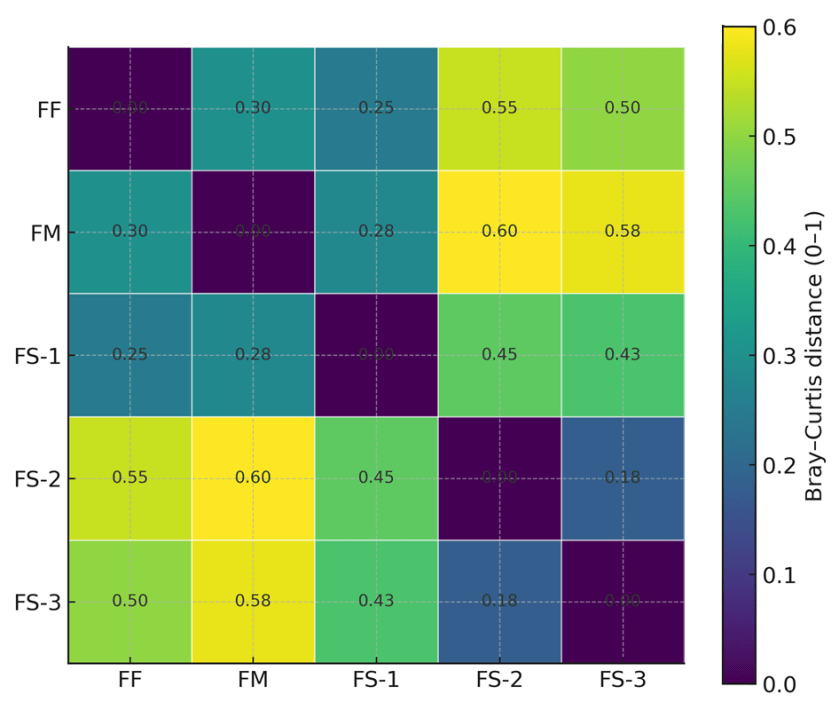
Inter-individual microbiome similarity based on Bray–Curtis distance
The heatmap depicts pairwise Bray–Curtis dissimilarities among the five family members, with color intensity and numeric annotations representing the magnitude of compositional differences (Figure 5). The distance was expressed by color of dark blue (closed each other) to yellow (far distance). All the samples were shown with dark blue from the analysis with oneself. The smallest distance was observed between the monozygotic twins FS-2 and FS-3 (blue, 0.18), indicating the highest similarity. FS-1 showed relatively close to FF (0.25) and FM (0.28). In contrast, FM showed the highest dissimilarity to FS-2 (0.60) and FS-3 (0.58).
Discussion and Conclusion
Alpha diversity describes the overall variety and balance of microorganisms contained within a single biological sample. Within our cohort, the mother showed the lowest Shannon index among family members (Figure 1A). She had experienced with an extended course of antibiotic therapy between March 2023 and May 2024. The stool specimen analyzed in this study was obtained in 15th July, at which time three consecutive follow-up cultures had already returned negative. In work by Palleja and colleagues (2018), short-term intravenous exposure to a mixture of broad-spectrum antibiotics—meropenem, gentamicin, and vancomycin—caused profound reductions in gut microbial populations in 12 healthy men, with partial restoration occurring in most cases within approximately six weeks after treatment ended23. Based on these findings, the mother’s washout period after discontinuation of antibiotics should have been adequate to allow recovery toward baseline. Nevertheless, her microbial richness and evenness remained diminished compared with the rest of the family. This persistent reduction may correspond with her clinical complaints of inefficient digestion and recurrent dyspeptic symptoms. In contrast, the father presented with the highest alpha diversity values and reported stable gastrointestinal function, consistent with a more diverse microbial ecosystem.
Beta diversity characterizes the degree of overlap or divergence in microbial communities between individuals. In the principal coordinates analysis (PCoA) plot (Figure 1B), the maternal sample separated clearly from the other family members along the first axis. Interestingly, the father together with FS-2 and FS-3 grouped tightly, whereas the mother and FS-1 both exhibited positive loadings on PC2, implying a greater similarity in microbial composition between those two. This distribution possibly reflects the influence of delivery mode: FS-1 was delivered vaginally, while FS-2 and FS-3 were born by cesarean section. Prior work by Reyman et al. demonstrated that, vaginally delivered infants (≤1 year) presented gut microbiome similar to their mothers while cesarean-born children lacked of similarity of mother’s microbiota24. In another study, adolescents represented similar findings that beta diversity between mother and offspring remains significantly higher after vaginal delivery than after cesarean birth25. However, only with the result from beta-diversity was not sufficient to determine similarity between mother and FS-1 in this study.
At the phylum level (Figure 2), Bacteroidota, Firmicutes, and Proteobacteria were found in all family members. In the father’s microbiota, Firmicutes (41%) and Bacteroidota (47%) were present in almost equal amounts, but in the other family members, Bacteroidota was at least 10% higher than Firmicutes. Firmicutes are associated with greater efficiency in extracting energy from food and with the accumulation of fat, showing a positive relationship with obesity and body fat levels26. Consistently, the father showed the greatest BMI (27.18, classified as class I obesity) along with the highest F/B ratio in fecal samples (0.87). FS-1, despite a similar BMI (26.12), had a much lower F/B ratio (0.55), closer to the mother’s (0.35). Interestingly, FS-2 and FS-3, whose BMIs were in the normal range (19.95 and 19.6), showed F/B ratios (0.60 and 0.70) similar to their father’s. Nevertheless, recent investigations have questioned the reliability of the F/B ratio as a biomarker for obesity, as multiple large-scale populations have demonstrated an absence of significant associations between this index and overweight or obese phenotypes27,28. For instance, an analysis of 151 Croatian adults revealed no meaningful relationship between F/B ratio and BMI stratification29. Consistent with these findings, our results showed inconsistency between BMI and F/B ratio within the family, suggesting limited predictive value of this index. A further notable finding was the markedly elevated abundance of Verrucomicrobiota in FS-3 (16%), largely accounted for by the genus Akkermansia. Among these, Akkermansia muciniphila has become a central subject of interest in microbiome-targeted therapeutics, due to its capacity to strengthen the gut mucosal barrier, mediate anti-inflammatory effects, and confer metabolic advantages in conditions such as obesity, diabetes, and nonalcoholic fatty liver disease. Recent investigations highlight its possible involvement in safeguarding neural function and influencing mood-related conditions via the gut–brain connection30. The distinctive enrichment observed in FS-3 remained to be investigated more with nutrition factors and other individual habits. It could be speculated with his food preference for fruits and vegetables since polyphenol-rich diets are known to enhance the growth and abundance of Akkermansia.31
At the family level (Figure 4), Ruminococcaceae abundance diverged markedly across individuals. While nearly absent in the mother and FS-1, it comprised over 8% of the father, FS-2, and FS-3. This part of composition suggests a similarity among father, FS-2, and FS-3 individuals, but, when considering the composition of other taxa, this similarity may not necessarily significance. Conversely, Enterobacteriaceae (FM 10.6%, FS-1 7.5%) and Veillonellaceae (FM 12.9%, FS-1 6.3%) were notably elevated in the mother and FS-1.
Bray-Curtis distance calculations indicated that FS-2 and FS-3 exhibited the greatest microbial similarity (distance 0.18), in accordance with their status as monozygotic twins. The mother and FS-1 also demonstrated moderate similarity (distance 0.28), whereas greater distances were observed between the mother and FS-2 (0.60) or FS-3 (0.58). This further highlights the persistent mother–child microbial resemblance in the vaginally delivered FS-1, even during adolescence, compared with the cesarean-born twins32. Interestingly, despite similarities with the father in beta-diversity, FS-2 and FS-3 showed closer resemblance to each other rather than to him. Beta diversity analysis (UniFrac), which incorporates phylogenetic relatedness, tends to cluster samples more closely if they share evolutionarily related taxa (presence/absence based), even when their species composition differs within that lineage. In contrast, the Bray–Curtis method provides a more direct, abundance-based assessment of community dissimilarity. Consequently, substantial differences in relative abundances across taxa result in larger calculated distances33. In this study, the observed separation between the father and the monozygotic twins is therefore likely attributable to differences in microbial abundance profiles, rather than phylogenetic divergence.
Overall, this family-based case study (n=5) offers possible insights into how delivery mode may affect sustainable gut microbiome composition over the long term, based on the analysis of gut microbiomes with the alpha-/beta- diversity, phylum/family level compositions and distance comparisons with species abundance. Despite more than 16 years since birth, the vaginally delivered FS-1 maintained the moderate similarity to the mother’s gut microbiome, while cesarean-born monozygotic twins (FS-2, FS-3) showed markedly lower maternal resemblance but stronger intra-pair similarity. These results may suggest that delivery mode plays a pivotal role in determining microbiome architecture alongside environmental determinants such as diet (remained to be investigated). Further longitudinal studies involving larger populations are required to confirm these findings and to reveal the long-term dynamics of mother–child microbiome interactions.
Acknowledgement
I would like to sincerely thank Dr. Jae-Won Kim, a head of Research Institute of GC Wellbeing Pharmaceutical Company in Korea, for his great support and guidance in establishment of experimental design, process, and analysis of the results.
References
- T. E. Sweeney, J. M. Morton. The Human Gut Microbiome: A Review of the Effect of Obesity and Surgically induced Weight Loss. JAMA Sergery 148(6), 563–569 (2013). [↩] [↩]
- M. G. Dominguez-Bello, E. K. Costellob, M. Contreras, M. Magris, G. Hidalgo, N. Fierere, and R. Knight. Delivery mode shapes the acquisition and structure of the initial microbiota across multiple body habitats in newborns. PNAS 10.1073 (2010). [↩]
- D. Rothschild, O. Weissbrod, E. Barkan, A. Kurilshikov, T. Korem, D. Zeevi, P. Costea, A Godneva, I. N. Kalka, N. Bar, S. Shilo, D. Lador, A. V. Vila, N. Zmora, M. P. Fischer, D. Israeli, N. Kosower, G. Malka, B. C. Wolf, T. Avnit-Sagi, M. Lotan-Pompan, A. Weinberger, Z. Halpern, S. Carmi, J. Fu, C. Wijmenga, A. Zhernakova, E. Elinav, E. Segal. Environment dominates over host genetics in shaping human gut microbiota. Nature 555(7695), 210-221 (2018). [↩]
- S. J. Song, C. Lauber, E. K. Costello, C. A. Lozupone, G. Humphrey, D. Berg-Lyons, J. G. Caporaso, D. Knights, J. C. Clemente , S. Nakielny, J. I. Gordon, N. Fierer, R. Knight. Cohabiting family members share microbiota with one another and with their dogs. Microbiology and Infectious Disease 21, 00458 (2013). [↩] [↩] [↩]
- M. A. Sze and P. D. Schloss. Looking for a Signal in the Noise: Revisiting Obesity and the Microbiome. mBio 10.1128 (2016). [↩]
- F. Magne, M Gotteland, L. Gauthier, A. Zazueta, S. Pesoa, P. Navarrete and R. Balamurugan. The Firmicutes/Bacteroidetes Ratio: A Relevant Marker of Gut Dysbiosis in Obese Patients. Nutrients 12, 1474 (2020). [↩] [↩]
- T. A. Houtman, H. A. Eckermann, H. Smidt and C. D. Weerth. Gut microbiota and BMI throughout childhood: the role of firmicutes, bacteroidetes, and short-chain fatty acid producers. Scientific Reports 12, 3140 (2022). [↩] [↩]
- A. Karačić, I. Renko , Ž. Krznari´c, S. Klobuˇcar and A. L. Pršo . The Association between the Firmicutes/Bacteroidetes Ratio and Body Mass among European Population with the Highest Proportion of Adults with Obesity: An Observational Follow-Up Study from Croatia. Biomedicines 12, 2263 (2024). [↩]
- C. Zhang, L. Li, B. Jin, X. Xu, X. Zuo, Y. Li1 and Z. Li1. The Effects of Delivery Mode on the Gut Microbiota and Health: State of Art Frontiers in Microbiology 12, 724449 (2021). [↩]
- S. B. Busi, L. D. Nies, J. Habier, L. Wampach, J. V. Fritz, A. Heintz-Buschart, P. May, R. Halder, C. D. Beaufort and P. Wilmes. Persistence of birth mode-dependent effects on gut microbiome composition, immune system stimulation and antimicrobial resistance during the first year of life. International Society for Microbial Ecology 1:8 (2021). [↩] [↩]
- B. C. Wilson, E. M. Butler, C. P. Grigg, J. G. B. Derraik, V. Chiavaroli, N. Walker, S. Thampi, C. Creagh, A. J. Reynolds, T. Vatanen, J. M. O’Sullivan and W. S. Cutfield. Oral administration of maternal vaginal microbes at birth to restore gut microbiome development in infants born by caesarean section: A pilot randomised placebo-controlled trial. EBioMedicine 69, 103443 (2021). [↩] [↩]
- K. Korpela. Impact of delivery mode on infant gut microbiota. Annals of Nutrition and Metabolism 77: 11-19 (2021). [↩]
- E. B. Hollister, K. Riehle, R. A. Luna, E. M. Weidler, M. Rubio-Gonzales, T. Mistretta, S. Raza, H. V. Doddapaneni, G. A. Metcalf, D. M. Muzny, R. A. Gibbs, J. F. Petrosino, R. J. Shulman and J. Versalovic. Structure and function of the healthy pre-adolescent pediatric gut microbiome. Microbiome 3:36 (2015). [↩]
- H. E. Laue, A. D. Willis, F. Wang, M. C. MacDougall, Y. Xu, M. R. Karagas, J. C. Madan, A. F. Fleisch, B. P. Lanphear, K. M. Cecil, K. Yolton, A. Chen, J. P. Buckley and J. M. Braun. Early-life and concurrent predictors of the healthy adolescent microbiome in a cohort study. Genome Medicine 17:50 (2025). [↩]
- C. M. Bassis, K. A. Bullock, D. E. Sack, K. Saund, A. Pirani, E. S. Snikin, V. I. Alaniz, E. H. Quint, J. D. Bell and V. B. Young. Vaginal microbiota of adolescents and their mothers: A preliminary study of vertical transmission and persistence. Frontiers in Microbiomes 10, 3389 (2023). [↩]
- K. A. Dill-McFarland, Z. Tang, J. H. Kemis, R. L. Kerby, G. C. A. Palloni, T. Sorenson, F. E. Rey and P. Herd. Close social relationships correlate with human gut microbiota composition. Scientific Report 9: 703 (2019). [↩]
- J. K. Goodrich, J. L. Waters, A. C. Poole, J. L. Sutter, O. Korean, R. Blekhmand, M. Beaumont, M.V. Treuren, R. Knight, J.T. Bell, T.D. Spector, A.G. Clark and R.E. Ley. Human genetics shape the gut microbiome. Cell 159(4): 789–799 (2014). [↩]
- H. Xie, R. Guo, H. Zhong, J. Li, T. D. Spector and H. Jia. Shotgun metagenomics of 250 adult twins reveals Genetic and Environmentla Impacts on the Gut Microbiome. Cell 3, 572-584 (2016). [↩]
- R.Vilchez-Vargas, J. Skieceviciene, K. Lehr, G. Varkalaite, C. Thon, M. Urba, E. Morkunas, L. Kucinskas, K. Bauraite, D. Schanze, D. Schanze, M. Zenker, P. Malfertheiner, J. Kupcinskas and A. Link. Gut microbial similarity in twins is driven by shared environment and aging. EBioMedicine 79:104011 (2022). [↩]
- D. R. Herman, N. Rhoades, J. Mercado, P. Argueta, U. Lopez and G. E. Flores. Dietary habits of 2- to 9- year-old American children are associated with Gut microbiome Composition. Journal of the Academy of Nutrition and Dietetics 120, 4 (2020). [↩]
- A. Karačić, I. Renko , Ž. Krznari´c, S. Klobuˇcar and A.L. Pršo . The Association between the Firmicutes/Bacteroidetes Ratio and Body Mass among European Population with the Highest Proportion of Adults with Obesity: An Observational Follow-Up Study from Croatia. Biomedicines 12, 2263 (2024). [↩]
- C. M. D. S. P. Indiani, K. F. Rizzardi, P. M. Castelo, L. F. C. Ferraz, M. Darrieux and T. M. Parisotto. Childhood obesity and Firmicutes/Bacteroidetes Ration in the Gut Microbita A Systematic Review. Childhood Obesity 14(8):501-509 (2018). [↩]
- A. Palleja, K. H. Mikkelsen, S. K. Forslund, A. Kashani, K. H. Allin, T. Nielsen, T. H. Hansen, S. Liang, Q. Feng, C. Zhang, P. T. Pyl, L. P. Coelho, H. Yang, J. Wang, A. Typas, M. F. Nielsen, H. B. Nielsen, P. Bork, J. Wang, T. Vilsboll, T. Hansen, F. K. Knop, M. Arumugam and O. Pedersen. Recovery of gut microbiota of healthy adults following antibiotic exposure. Nature Microbiology 3, 1255–1265 (2018). [↩]
- M. Reyman, M. A. V. Houten, D. V. Baarle, A. A. T. M. Bosch, W. H. Man, M. L. J. N. Chu, K. Arp, R. L. Watson, E. A. M. Sanders, S. Fuentes and D. Bogaert. Impact of delivery mode-associated gut microbiota dynamics on health in the first year of life. Nature Communications 10: 4997 (2019). [↩]
- C. M. Bassis, K. A. Bullock, D. E. Sack, K. Saund, A. Pirani, E. S. Snitkin, V. I. Alaniz, E. H. Quint, J. D. Bell and V. B. Young. Vaginal microbiota of adolescents and their mothers: A preliminary study of vertical transmission and persistence. Frontiers in Microbiomes. 2: 1-10 (2023). [↩]
- V. Palmas, S. Pisanu, V. Madau, E. Casula, A. Deledda, R. Cusano, P. Uva, S. Vascellari, A. Loviselli, A. Manzin and F. Velluzzi. Gut microbiota markers associated with obesity and overweight in Italian adults. Scientific Reports 11: 5532 (2021). [↩]
- T. A. Houtman, H. A. Eckermann, H. Smidt and C. D. Weerth. Gut microbiota and BMI throughout childhood: the role of firmicutes, bacteroidetes, and short-chain fatty acid producers. Scientific Reports 12, 3140 (2022). [↩]
- P. J. Turnbaugh, M. Hamady, T. Yatsunenko, B. L. Cantarel, A. Duncan, R. E. Ley, M. L. Sogin, W. J. Jones, B. A. Roe, J. P. Affourtit, M. Egholm, B. Henrissat, A. C. Heath, R. Knight, J. I.Gordon. A core gut microbiome in obese and lean twins. Nature. 22; 457(7228):480 (2009). [↩]
- P. J. Turnbaugh, M. Hamady, T. Yatsunenko, B. L. Cantarel, A. Duncan, R. E. Ley, M. L. Sogin, W. J. Jones, B. A. Roe, J. P. Affourtit, M. Egholm, B. Henrissat, A. C. Heath, R. Knight, J. I.Gordon. A core gut microbiome in obese and lean twins. Nature. 22; 457(7228):480 (2009). [↩]
- F. Gao, C. Cheng, R. Li, Z. Chen, K. Tang and G. Du. The role of Akkermansia muciniphila in maintaining health: a bibliometric study. Frontiers in Medicine. 3. (2025). [↩]
- F. F. Anhe, G. Pion, D. Roy, Y. Desjardins, E. Levy and A. Marette. Triggering Akkermansia with dietary polyphenols: A new weapon to combat the metabolic syndrome? GUT MICROBES 7(2): 146–153 (2016). [↩]
- J. Yang, S. Yao, K. Cheng, L. Xu, L. Hou, Y. Wei, H. Feng, Z. Yu, Z. Zhang, Z. Tong, Z. Li and y. Zhao. Comparison of Meconium Microbiome in Dizygotic and Monozygotic Twins Born by Caesarean Section (CS). Frontiers in microbiology. 11:1139. (2020). [↩]
- R. G. Won, J. R. Wu, G. B. Gloor. Expanding the UniFrac Toolbox. Plos one. 11(9): e0161196 (2016). [↩]


