

Abstract
Even though cryptocurrency has demonstrated itself as one of the most groundbreaking technologies of 21st-century, worldwide adoption of it remains uneven across populations. Factors of it in each area differ, and Kazakhstan presents a unique case: it represents a post-Soviet economy, but in August of 2021 it accounted for 18% of global Bitcoin hash rate. It is notable that the country has also experienced tenge devaluation. Most research on generational crypto trust comes from North America, Europe, and other parts of Asia, neglecting Central Asia, which creates a gap in literature. This study examines generational cryptocurrency trust in Kazakhstan by using a cross-sectional online survey with a total of 109 respondents across three generations (Gen Z, Millennials, Gen X). Particular attention to macroeconomic factors was taken into account by utilizing Spearman correlation, t-test, ANOVA, multiple regression analysis. Key findings suggest that tenge hedge belief is the most dominant predictor of crypto trust, while generational differences are observed at bivariate levels, they lose significance once knowledge and tenge hedge belief are accounted for. Cryptocurrency is not perceived as a substitute to traditional banking by the participants. Results are consistent with the hypothesis that macroeconomic factors contribute to crypto trust, and indicate that hedge utility is more strongly associated with cryptocurrency trust than generational identity is. However, since exposure to past devaluations was not measured, this data cannot establish that Kazakhstan’s economic history produced these attitudes.
Keywords: cryptocurrency, trust, generational differences, Kazakhstan, tenge devaluation, behavioral finance, technology acceptance, generational theory
Introduction
Cryptocurrency has emerged as one of the most innovative technologies of 21st-century. It has grabbed colossal attention of financial world for its potential to transform monetary systems. Digital currencies such as Bitcoin and Ethereum have completely reshaped the way of storing finances, as it promotes more prospective growth in value than traditional banking. However, adoption remains uneven across countries because of the factors like age, digital fluency, trust, financial literacy and macroeconomic context. A study by Shahzad et al.1 reveals higher awareness is associated with adoption, and trust strengthens that connection.
Kazakhstan presents itself as a uniquely compelling case for studying cryptocurrency trust across different ages. The country holds a post-Soviet economy that has experienced repeated financial instability. The government’s decision to allow the currency to float freely in August 2015 led to tenge losing 36.9% of its value against the US dollar within one month, rising to 78.5% depreciation over six months2. Whether such experience is associated with greater interest in alternative financial instruments remains a question. Moreover, in August of 2021 Kazakhstan accounted for 18% of global Bitcoin hash rate3. Thus, cryptocurrency has become an economically significant phenomenon in the country, yet it has not been researched how attitudes, opinions, or perceptions about it work.
Academic research confirms that younger generations are more inclined to invest in cryptocurrency than older cohorts4. However, these findings cannot be directly applied to post-Soviet Central Asian societies, where deep institutional skepticism is itself partly a legacy of Soviet-era governance5 and repeated currency crises intersect in distinctive ways. Furthermore, while the Technology Acceptance Model (TAM) and other related frameworks were applied broadly to cryptocurrency adoption1,6, macroeconomic variables such as tenge volatility have received little attention. Therefore, a significant gap exists in literature regarding how generational identity and Kazakhstan-specific financial experience relate to cryptocurrency trust. The present study does not utilize TAM, but it is contextualized by TAM, generational theory and macroeconomic risk.
The present study addresses this gap by investigating a following question:
What factors are associated with cryptocurrency trust across generations in Kazakhstan, and how do generational identity and Kazakhstan-specific financial beliefs compare as predictors?
Hypotheses are developed in the following section, each derived from the relevant theoretical literature.
Literature Review
Trust and Cryptocurrency
Trust in financial system has been divided into two: institutional (trust in government, regulators) and technological (blockchain, decentralization)1. Cryptocurrency, as a decentralized financial instrument, has an undefined position: it is a transparent technology, but lacks institutional guarantee. Research using TAM to cryptocurrency indicates that trust is an essential variable that connects awareness and adoption1,6. This matters because trust in financial institutions predicts participation in markets more generally: people with lower trust participate less7. Whether cryptocurrency is used as a way of avoiding conventional institutions is contested. One study suggests that retail cryptocurrency investors do not distrust fiat money or banks, and instead add digital assets for bigger diversification and return8. A second one indicates the opposite at the country level, showing that Bitcoin infrastructure diffuses faster in regions where distrust of banks is high and where inflation crises have happened9. A third position differs from both. Using survey data from three Nordic countries, Baeckström et al.10 find that individuals with greater trust in other people regarding financial matters are more likely to hold cryptocurrency, both currently and in their future plans. The first study finds that distrust does not drive participation; this research finds that trust is associated with greater participation in crypto, suggesting that cryptocurrency participation complements rather than substitutes for trust. Additionally, research on re-intermediation of crypto assets finds that public distrust of the crypto coexists with comparatively high trust in banks11. In cases where institutional trust is historically low, such as post-Soviet economies, this distinction between institutional and technological trust takes on particular relevance, as citizens may distrust both systems simultaneously rather than using one as a refuge from another.
H3: Trust in Kazakhstan’s Traditional Banking System Is Negatively Associated With Cryptocurrency Trust
Generational Differences in Cryptocurrency Adoption
H1: Generation Z Reports Higher Trust in Cryptocurrency Than Millennials and Generation X.
TAM in Cryptocurrency Research
Technology Acceptance Model (TAM) was introduced by Davis in 198914. It suggests that adoption is driven by following key factors: perceived ease of use, perceived usefulness and external factors such as trust, social influence. More extended version, Unified Theory of Acceptance and Use of Technology (UTAUT)15 and TAM were used to determine the cryptocurrency adoption in diverse cultural regions: Spain16, Saudi Arabia17, the United Arab Emirates18, Thailand6, China19, Hungary20, and India21. The findings were consistent and concluded that perceived risk reduces adoption, while perceived usefulness and peer experience positively correlate with it. Notably, there has been little to no research applying TAM in post-Soviet countries, which allows a significant gap in literature to exist. These literatures inform the study without being tested in it. The survey instrument was not designed to utilize TAM. TAM is therefore perceived as contextualizing theory, offering why trust and perceived risk shape adoption, rather than a model that is used in the study.
Post-Soviet Institutional Mistrust
Stalin’s rule of the USSR has been associated with elevated institutional mistrust in post-Soviet countries. Research conducted by Nikolova et al.5 indicates that Stalinist-era repression created intergenerational mistrust. Notably, many of the participants of Alash Orda, a party that tried to gain Kazakhstan’s independence, were repressed22, which may amplify the mistrust. However, previous devaluation of national currency may be associated with seeking an alternative to traditional banking. It creates a critical question for understanding crypto adoption in Kazakhstan: does post-Soviet institutional mistrust suppress trust in cryptocurrency, or does the experience of tenge devaluation cancel this skepticism by motivating the search for alternatives? The present study cannot answer this question since testing it would require direct measurement of generalized institutional trust and of exposure to historical repression. The post-Soviet literature is therefore implemented here as contextual framing rather than as a tested mechanism. Claims in this article about the post-Soviet setting describe the context in which the data were collected.
Currency Instability and Cryptocurrency as a Hedge
A separate literature examines whether cryptocurrency is used as protection against currency depreciation and inflation. Empirical findings are mixed and depend on context. Evidence has questioned a consistent inflation relationship23, while vector autoregression estimates indicate that Bitcoin returns rise significantly following positive inflation shocks24. Choi and Shin25 distinguish inflation-hedging and safe-haven properties directly, finding that Bitcoin acts as an inflation hedge but not as a safe haven during market stress. However, cryptocurrency use appears to rise during periods of geopolitical and macroeconomic tension26, and stable coin trading concentrates heavily in high-inflation economies like Turkey and Argentina27. Yet the most directly comparable evidence is cautionary. Researching Turkish lira-denominated trading volume, the closest available analogue to Kazakhstan, Oefele et al.28 find no systematic link between crypto utilization and significant lira depreciations and inflation shocks. Whether cryptocurrency is used as a currency depreciation hedge remains a question.
H2: Perceived Utility of Cryptocurrency as a Hedge Against Tenge Devaluation Is Positively Associated with Cryptocurrency Trust
Financial literacy and Cryptocurrency knowledge
Financial literacy is a strong predictor of investment behavior generally29, and a growing literature examines its role in cryptocurrency adoption specifically. Findings are not uniform. Research in Japan indicates that crypto adopters differ systematically from non-adopters in financial literacy12, while US data show that those holding cryptocurrency for investment score higher on financial literacy than non-owners, but those using it for transactions score lower30. Other work suggests that investment experience may be more influential than literacy itself31, and that self-assessed and objectively measured knowledge differ significantly32.
In summary, this study tests three hypotheses: that Generation Z reports higher cryptocurrency trust than older cohorts (H1); that perceived hedging utility against tenge devaluation is positively associated with trust (H2); and that trust in the traditional banking system is negatively associated with cryptocurrency trust (H3).
Methodology
Research Design
This study uses a quantitative cross-sectional design to examine the generational differences regarding cryptocurrency trust in Kazakhstan. A structured online survey was conducted as a primary data collection instrument. It was chosen because it allows the most convenient and rapid method for participants. Additionally, it enables comparison across groups, statistical analysis and most importantly anonymity, which is vital in post-Soviet contexts for financial data.
Survey Instruments and Data Collection
The survey was developed in Russian as it is the most accessible language for all participants. It was distributed via Google Forms between April 3 and April 5 of 2026 getting 109 responses. The instrument was pretested by the counselor of the school. She checked it for ethical concerns and whether the questions were suitable for the research. Nothing was changed after the review. The English item wordings reported in this article were translated by the author after data collection, and they were reviewed by the counselor and the English teacher, both of whom are Russian speakers. It consisted of 10 structured questions divided into 4 areas: demographics, knowledge/experience, trust and investment intentions. These questions were selected to ensure 3 core variables of the study — generational difference, cryptocurrency trust and Kazakhstan-specific case — were analyzed. Trust in cryptocurrency and in banking were evaluated using five-point Likert scale, allowing direct cross-system analysis. Remaining questions were in the MCQ (multiple-choice questions) and categorical formats.
The full instrument, including exact wording in Russian and translation in English, is in the appendix.
Cryptocurrency trust was taken as a respondent’s general confidence in cryptocurrency as a financial instrument, measured with a single five-point item. This method does not distinguish among trust in the underlying blockchain technology, in exchanges or custodians, in price stability, in fraud resistance, or in store-of-value function; it is therefore an indicator rather than a measure of any specific trust measure. Banking trust was operationalized in parallel as general confidence in Kazakhstan’s traditional banking system, measured with a single five-point item, and carries the same limitation. Perceived hedging utility was operationalized as belief that cryptocurrency provides protection against tenge devaluation, measured on a five-point ordinal scale. Cryptocurrency knowledge was operationalized as self-assessed familiarity on a four-point ordinal scale; no objective knowledge test was done.
Sampling
| Generation | Birth Years | n | % of Sample |
| Generation Z | 1997–2012 | 38 | 34.9% |
| Millennials | 1981–1996 | 53 | 48.6% |
| Generation X | 1965–1980 | 18 | 16.5% |
| Total | 109 | 100% |
Ethical Considerations
Prior to data collection, the study was approved by three IRB members: Bakhadir Rismetov (PhD), Aigerim Sarzhanova (PhD candidate) and Alua Zhumabekova (M.A.) of the Shoqan Walikhanov Private School on the 16th, 3rd, and 10th of March 2026 respectively. No reference number was issued. The survey was directly sent to the adult acquaintances known personally by the author. No public link was posted and text was not asked to be forwarded. Participation was voluntary and anonymous. The survey description informed respondents that their answers would be used for research, and no names, email addresses, or other identifying information were collected. Submission of the form was treated as consent to participate.
Analysis of Statistics
Descriptive statistics were applied to determine findings. Spearman correlation was used to examine bivariate relationships between variables that were measured on a Likert scale. T-test was conducted to compare mean cryptocurrency trust scores between Generation Z and Millennials, and a one-way ANOVA was used to test for significant differences across all three generations. Multiple linear regression was then employed to identify the predictors of cryptocurrency trust.
The interaction was tested by adding generation × tenge-hedge product terms to the main-effects model and comparing fits via nested F-test, with cohort-stratified models fitted as a robustness check. Generation was entered as indicator variables with Millennials as the reference category, because cohort is an unordered categorical variable and preliminary means indicated a non-linear pattern across cohorts; the generation block was evaluated with a joint Wald test.
The survey was one-time and trust was measured with a single item; therefore reliability cannot be measured. However, validity can be measured with single items (see Table 2). Convergent validity: a trust measure should correlate with the behaviors trust relates to. Trust correlates with ownership status (ρ = .467) and investment willingness (ρ = .535), supporting convergent validity. At ρ = .467 and ρ = .535, trust shares only about 22% and 29% of its variation with ownership status and investment willingness respectively. This means that discriminant validity is supported as well: trust is related to these behaviors but is distinct from them. Known-groups validity tests whether respondents whose answers to other items indicate trust score higher on the trust item. Respondents who named crypto as the most reliable savings method scored higher, M = 4.00 vs M = 2.64 for all other respondents; participants who chose “nothing — I trust cryptocurrency” scored higher as well, M = 4.20 vs M = 2.68 for all other respondents. Both Mann-Whitney tests were significant. Known-groups validity is supported, although both groups were small (n = 9 and n = 5). The validity evidence supports reading the item as trust in cryptocurrency, but it does not prove it.
| Check | Result |
| Trust × ownership status | ρ = .467, p < .001 |
| Trust × investment willingness | ρ = .535, p < .001 |
| Named crypto as most reliable savings method | M = 4.00 (n = 9) vs M = 2.64 (n = 100); Mann–Whitney U = 748.5, p < .001 |
| Chose “nothing — I trust cryptocurrency” on item 6 | M = 4.20 (n = 5) vs M = 2.68 (n = 104); Mann–Whitney U = 421.0, p = .013 |
Limitations
All variables were measured at a single point of time, so mediation analysis cannot establish the causal ordering. Respondents who already trust crypto may have come to believe it protects against devaluation, meaning that belief could follow trust instead of producing it. Additionally, owning crypto may have shaped the trust participants reported, rather than trust leading to ownership, since purchase had happened before the survey.
Since the survey was conducted digitally, the participants are likely to be more technologically proficient, and their responses could have been biased. Some may have answered not as truthfully as possible due to social desirability or lack of genuine engagement with the questions. Birth year ranges instead of exact birth dates were used, preventing more precise analysis regarding the age. Sociodemographics were not collected as well.
Exposure to the 2015 devaluation, realized financial losses, and current depreciation expectations were not measured, so the mechanism proposed in the literature review could not be tested. The predictor is a belief about cryptocurrency, not an experience of currency loss.
Trust was measured with a single global item rather than multi-item scales. Consequently, internal consistency reliability could not be estimated, and the measure cannot separate trust in the underlying technology from trust in exchanges, custody arrangements, price stability, fraud resistance, or store-of-value function. Findings should be regarded as something related to aggregate confidence in crypto, rather than any specific facet. Additionally, the survey was pretested only by one person, so comprehension across all participants cannot be verified. The survey was not back-translated.
Generalized institutional trust, exposure to Soviet-era repression, and family history of political repression were not measured. The post-Soviet context therefore functions as a setting description rather than as a tested explanatory mechanism.
The sample provided insufficient power to test moderation: with n = 109, only interaction effects of f² ≥ 0.095 were detectable at 80% power, so the non-significant generation × tenge-hedge interaction should be regarded as not conclusive.
Results
Knowledge and Ownership
Figure 1 shows that the majority of respondents (61.5%) have heard about cryptocurrency but know little, while 4.6% of participants have reported no possessed knowledge of the crypto. 31.2% claim to know basics. Only 2.8% put their knowledge level at expert, showing that nearly two-thirds of the survey engage with the questions from the position of limited understanding.
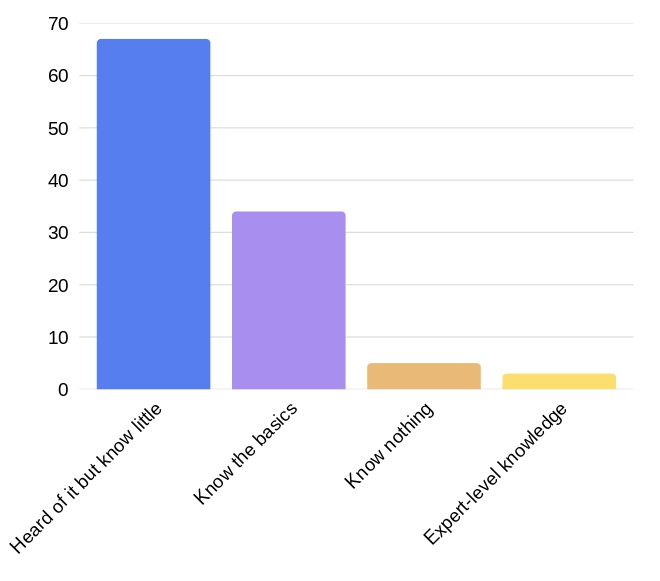
Table 3 shows the ownership of crypto among participants. Despite a generally low level of knowledge, ownership of cryptocurrency is higher than expected. 41.3% of respondents never owned crypto, and 19.3% both have not owned nor are planning to, making 39.4% of participants current or prospective participants.
| Response | n | % |
| No | 45 | 41.3% |
| No, but planning to | 25 | 22.9% |
| No, and not planning to | 21 | 19.3% |
| Yes | 18 | 16.5% |
| Total | 109 | 100% |
Generational Differences in Cryptocurrency Trust (H1):
Table 4 shows generational comparison. A one-way ANOVA showed that cryptocurrency trust differed significantly across the three generations (F(2, 106) = 3.29, p = .041). An independent-samples t-test between Gen Z and Millennials was also significant (t(89) = 2.51, p = .014), supporting H1 at the bivariate level. Gen Z recorded the highest mean trust score (M = 3.11), compared to Millennials (M = 2.57) and Gen X (M = 2.56).
| Generation | n | Score 1 | Score 2 | Score 3 | Score 4 | Score 5 | Mean |
| Gen Z (1997–2012) | 38 | 3 | 2 | 23 | 8 | 2 | 3.11 |
| Millennials (1981–1996) | 53 | 12 | 9 | 24 | 6 | 2 | 2.57 |
| Gen X (1965–1980) | 18 | 4 | 5 | 6 | 1 | 2 | 2.56 |
| Total | 109 | 19 | 16 | 53 | 15 | 6 | 2.75 |
Tenge Devaluation Belief and Cryptocurrency Trust (H2):
Table 5 reveals whether belief that using cryptocurrency as a tool against tenge devaluation is a stronger predictor of crypto trust than generational identity. Spearman correlation between tenge hedge belief and crypto trust was r = 0.548 (p < .001). Generation, entered as an unordered cohort variable, differed significantly across groups (F(2, 106) = 3.29, p = .041) but accounted for substantially less variation. The 2.69-point gap in mean crypto trust between those who strongly believe in crypto as a hedge (M = 4.29) and those who reject this view (M = 1.60) exceeds the 0.54-point gap between Gen Z and Millennials. H2 is supported.
| Tenge Hedge Belief | Score 1 | Score 2 | Score 3 | Score 4 | Score 5 | n | Mean |
| Yes — reliable hedge | 0 | 0 | 2 | 1 | 4 | 7 | 4.29 |
| Rather yes | 2 | 1 | 9 | 10 | 2 | 24 | 3.38 |
| Uncertain | 5 | 5 | 25 | 2 | 0 | 37 | 2.65 |
| Rather no | 6 | 8 | 15 | 2 | 0 | 31 | 2.42 |
| No — not a reliable hedge | 6 | 2 | 2 | 0 | 0 | 10 | 1.60 |
| Total | 19 | 16 | 53 | 15 | 6 | 109 | 2.75 |
Banking Trust and Cryptocurrency trust (H3):
Table 6 examines whether distrust in traditional banking is associated with an increased trust in cryptocurrency. No statistically significant relationship was observed. Therefore, H3 is not supported.
| Bank trust score | n | Mean crypto trust |
| 1 — Completely distrust banks | 4 | 2.75 |
| 2 | 27 | 3.04 |
| 3 — Neutral | 45 | 2.51 |
| 4 | 23 | 2.91 |
| 5 — Completely trust banks | 10 | 2.70 |
| Overall | 109 | 2.75 |
Note. Spearman r = −0.052, p = .594 (not significant). Scale: 1 = completely distrust, 5 = completely trust.
Multivariate Predictors of Cryptocurrency Trust
A multiple regression analysis was done to identify independent predictors of cryptocurrency trust, controlling for generation, tenge hedge belief, banking trust, and knowledge level simultaneously (see Table 7). The model was significant overall, F(5, 103) = 12.08, p < .001, explaining 37.0% of variance in cryptocurrency trust (R² = .370, adjusted R² = .339). Tenge hedge belief was the strongest predictor (b = 0.538, 95% CI [0.374, 0.702], p < .001), and then knowledge (b = 0.331, 95% CI [0.055, 0.607], p = .019). The generation block was not significant in multivariate analysis, F(2, 103) = 1.29, p = .280. Gen X did not differ meaningfully from Millennials (b = −0.099, p = .681).
To find the source of this weakening, the generation coefficient was traced across models. Entering knowledge did not weaken the Gen Z coefficient (b = 0.575, p = .010); it reduced by more than half only when hedge belief was added (b = 0.249, 95% CI [−0.131, 0.629], p = .196; model without bank trust; cf. b = 0.257 in the full model reported in Table 7). Consistent with this, cohorts differed significantly in hedge belief (F(2, 106) = 3.68, p = .028; Gen Z M = 3.24 vs Millennials M = 2.64, t(89) = 2.80, p = .006) but not in self-assessed knowledge (F(2, 106) = 0.27, p = .761). A bootstrapped test of the generation → hedge belief → trust pathway showed a significant indirect effect for Generation Z relative to Millennials (ab = 0.327, 95% CI [0.086, 0.613], 5,000 resamples), with a non-significant direct effect (b = 0.249, p = .196), controlling for knowledge.
An exploratory generation × tenge-hedge interaction model was fitted as a robustness check. The interaction block was not significant, F(2, 101) = 1.31, p = .274, ΔR² = .016, and the positive association between tenge-hedge belief and cryptocurrency trust held within all three cohorts (Gen Z b = 0.35, 95% CI [0.05, 0.66]; Millennials b = 0.58, 95% CI [0.33, 0.83]; Gen X b = 0.70, 95% CI [0.29, 1.11]). A sensitivity analysis indicated that the design had 80% power to detect only interactions of f² ≥ 0.095; the observed effect (f² = 0.026) would require approximately 381 respondents. This null result is therefore inconclusive.
| Predictor | b | SE | 95% CI | t | p |
| Intercept | 0.423 | 0.478 | [−0.525, 1.371] | 0.885 | .378 |
| Gen Z (vs Millennials) | 0.257 | 0.196 | [−0.131, 0.646] | 1.314 | .192 |
| Gen X (vs Millennials) | −0.099 | 0.240 | [−0.576, 0.378] | −0.412 | .681 |
| Tenge hedge belief | 0.538 | 0.083 | [0.374, 0.702] | 6.499 | < .001 |
| Knowledge | 0.331 | 0.139 | [0.055, 0.607] | 2.377 | .019 |
| Bank trust | −0.020 | 0.087 | [−0.193, 0.153] | −0.227 | .821 |
F(5, 103) = 12.08, p < .001. R² = .370, adjusted R² = .339. Millennials are the reference category. Joint Wald test of the generation block: F(2, 103) = 1.29, p = .280.
Table 8 shows predicted cryptocurrency trust by tenge-hedge belief and cohort. For all cohorts, the higher they rated their tenge-hedge belief, the higher their predicted cryptocurrency trust was. However, in the first three rows Gen Z have higher predicted trust than other cohorts; in the fourth, they are essentially tied. In the “Yes” row, the pattern is opposite: Gen X have the highest predicted trust, while Gen Z have the lowest. The pattern should not be read as moderation, because the interaction test was non-significant and underpowered, and because Gen X’s interval is the widest in the table as there are only 18 Gen X participants.
| Tenge-hedge belief | Gen Z | Millennials | Gen X |
| 1 — No | 2.37 [1.64, 3.11] | 1.58 [1.13, 2.03] | 1.31 [0.54, 2.08] |
| 2 — Rather no | 2.71 [2.24, 3.18] | 2.17 [1.89, 2.45] | 1.99 [1.48, 2.49] |
| 3 — Uncertain | 3.05 [2.76, 3.34] | 2.76 [2.51, 3.02] | 2.67 [2.26, 3.08] |
| 4 — Rather yes | 3.39 [3.02, 3.75] | 3.36 [2.96, 3.75] | 3.35 [2.76, 3.93] |
| 5 — Yes | 3.72 [3.12, 4.32] | 3.95 [3.35, 4.55] | 4.02 [3.15, 4.90] |
Note. Predicted means with 95% confidence intervals from the generation × tenge-hedge interaction model, with bank trust and knowledge held at their sample means (3.07 and 2.32). Trust scale 1–5.
Regression diagnostics are reported in Table 9. Variance inflation factors were all 1.25 or lower and the condition number was 29.4, indicating no collinearity concerns. The Breusch–Pagan and RESET tests were non-significant, supporting homoskedasticity and the adequacy of the linear specification. Residuals departed from normality (W = 0.968, p = .010), as expected for a bounded ordinal outcome. Two sensitivity checks indicated that the findings are not specification-dependent: HC3 heteroskedasticity-robust standard errors left all conclusions unchanged, and an ordered logistic model reproduced the same pattern of significance (tenge hedge OR = 3.87, 95% CI [2.47, 6.08], p < .001; knowledge OR = 2.67, 95% CI [1.41, 5.08], p = .003; generation block LR χ²(2) = 2.74, p = .255).
| Diagnostic | Statistic | Interpretation |
| VIF — tenge hedge belief | 1.09 | No collinearity |
| VIF — knowledge | 1.01 | No collinearity |
| VIF — bank trust | 1.05 | No collinearity |
| VIF — Gen Z | 1.25 | No collinearity |
| VIF — Gen X | 1.14 | No collinearity |
| Condition number | 29.4 | Below conventional threshold of 30 |
| Breusch–Pagan | LM = 2.06, p = .841 | Homoskedastic |
| RESET (functional form) | F = 0.11, p = .744 | Linear specification adequate |
| Durbin–Watson | 2.27 | No autocorrelation |
| Shapiro–Wilk (residuals) | W = 0.968, p = .010 | Non-normal; addressed by sensitivity checks |
Note. Diagnostics computed on the OLS model reported in Table 7 (n = 109). VIF = variance inflation factor.
Trust is conceptually distinct from behavioral intention and realized adoption; therefore the relationship between them was tested directly: trust was measured by item 4, behavioral intention by item 9, and adoption by item 3.
The three measures were related but not interchangeable. Even though part of the respondents scored low on trust (1–2, n = 35), 37.1% of them reported willingness to invest, though only 8.6% had actually owned cryptocurrency. Among high-trust respondents (4–5, n = 21), all of them reported willingness and 38.1% had owned.
Table 10 shows that trust predicted behavioral intention (b = 0.448, 95% CI [0.309, 0.588], p < .001, R² = .276). Behavioral intention predicted adoption (OR = 3.39, 95% CI [1.72, 6.70], p < .001). The total effect of trust on adoption was significant (OR = 2.29, 95% CI [1.30, 4.04], p = .004), but the direct effect was not significant once intention was included (OR = 1.60, 95% CI [0.84, 3.03], p = .152), a 43.5% attenuation. A bootstrapped indirect effect (5,000 resamples) excluded zero, ab = 0.489, 95% CI [0.185, 0.909].
These results are consistent with a trust → behavioral intention → adoption sequence in which trust relates to adoption indirectly, through intention.
| Path | Estimate | 95% CI | p |
| Trust → intention (OLS b) | 0.448 | [0.309, 0.588] | < .001 |
| Intention → adoption (OR) | 3.39 | [1.72, 6.70] | < .001 |
| Trust → adoption, total (OR) | 2.29 | [1.30, 4.04] | .004 |
| Trust → adoption, direct (OR) | 1.60 | [0.84, 3.03] | .152 |
| Indirect effect (ab) | 0.489 | [0.185, 0.909] | — |
Note. Adoption dichotomized as current or prior ownership versus all other responses. Indirect effect from 5,000 bootstrap resamples.
Generational Differences in Barriers
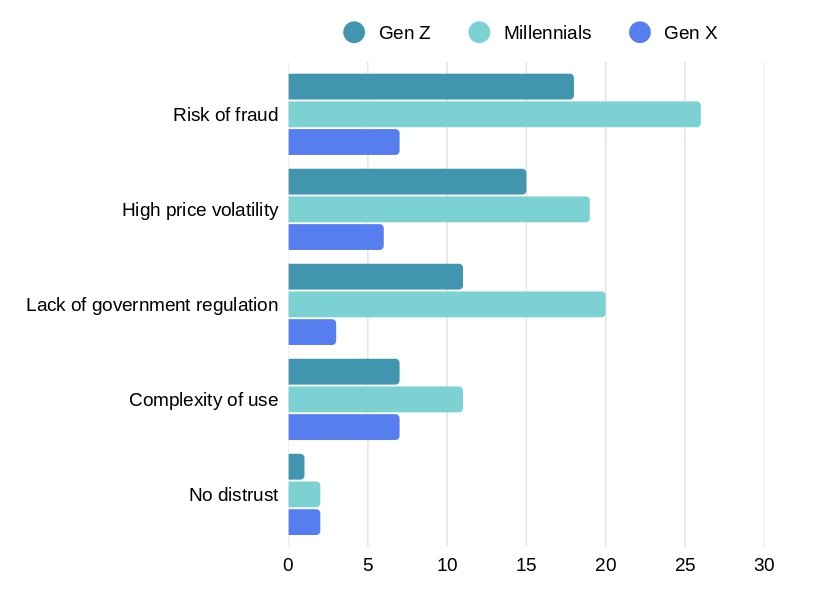
Figure 2 distinguishes distrust factors by generations. Fraud risk is dominant across all generations (39-49%). Millennials are also concerned about government regulation the most among other generations. Gen X, however, are distinctively concerned about complexity of use (38.9%), which suggests that barriers differ by generation. Gen Z, on the other hand, does not have a single dominant concern.
Trust-Building Mechanisms
Figure 3 shows that even though mean trust was moderate, 67% of the participants are willing to invest at least some part of their finances into cryptocurrency, suggesting that trust score and behavioral intention are not equal. The generational difference is notable: 76.3% of Gen Z participants are willing to invest, whilst only 58.5% of Millennials are inclined to do the same. Notably, as percentage of savings willing to be invested increases, number of Millennials decreases, whilst Gen Z increases up to 5–15%.
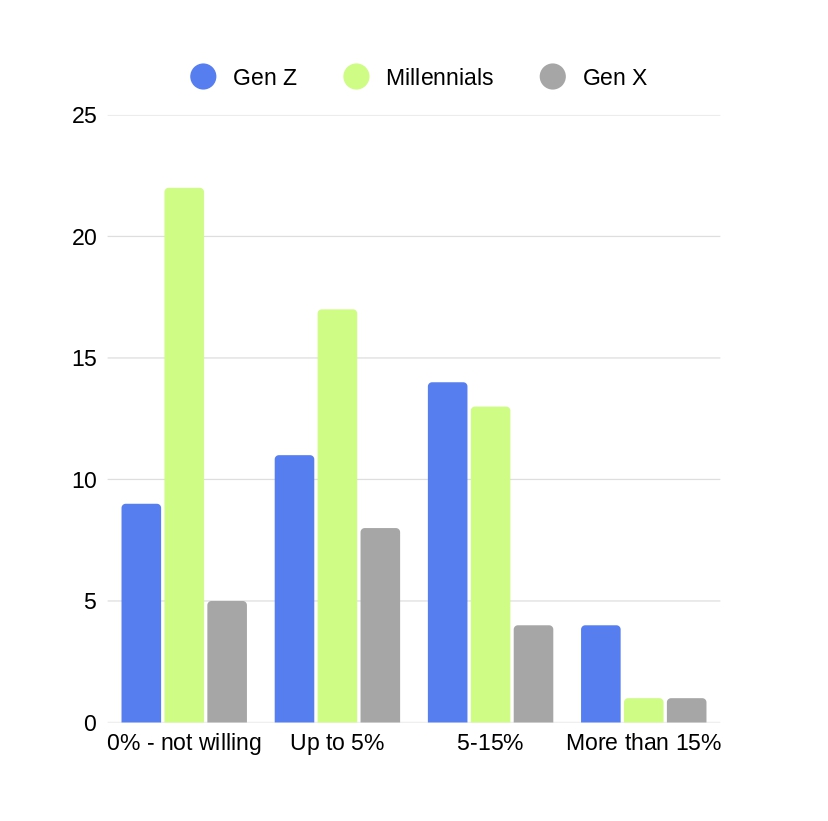
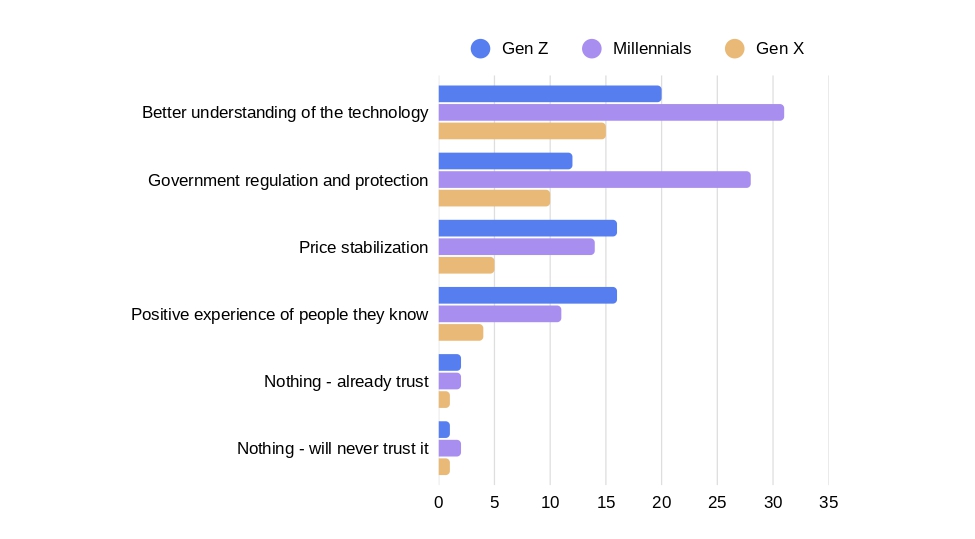
Figure 4 reveals that main ways of building trust are different for each generation. Even though for all cohorts better understanding of technology is the key factor, the second most important cause differs. Millennials and Gen X selected that they need more government regulation and protection, while Gen Z respondents are more concerned about price stabilization and peer experience (both 42.1%). Notably, only 3.7% of all participants would never trust crypto.
Conclusion
This study asked what is associated with cryptocurrency trust in Kazakhstan and how generational identity compares with Kazakhstan-specific beliefs. The answer is that perceived hedge utility against tenge devaluation is the strongest predictor, with self-assessed knowledge being the second. However, generation does not predict trust independently once hedge belief and knowledge are controlled.
Generational differences are observed at the bivariate level, but do not remain significant after accounting for knowledge and perceived hedge utility. Gen Z respondents were significantly more likely to view crypto as a tool against tenge depreciation, and the generation coefficient lost about half its magnitude and all of its significance once hedge belief entered the model, and a bootstrapped indirect effect through hedge belief was significant. Trust in traditional banking systems showed no statistically significant relationship with crypto trust, suggesting that respondents do not view crypto as a substitution of traditional banking. These results are also consistent with a trust → behavioral intention → adoption sequence, in which trust relates to adoption through intention rather than directly. Because all measures were collected at one point in time, the ordering in both indirect effects remains untested.
Theoretical Contributions
This study contributes to the behavioral finance literature on crypto in four ways. First, it suggests that differing beliefs about macroeconomic functions are a more important predictor of generational difference than self-assessed knowledge. Second, it does not support the hypothesis that cryptocurrency serves as a substitute for traditional banking systems. Third, it suggests generation-specific trust barriers, and possible ways to resolve them. Fourth, it distinguishes trust from behavioral intention and adoption, which cryptocurrency research has often treated as proxies for one another, and suggests that trust relates to adoption indirectly through intention rather than directly.
Practical Implications
If these stated preferences correspond to actual factors of trust, the following could be implemented: first, to increase cryptocurrency trust among Gen X and Millennials government regulations and protection could be improved, and primarily focused on the two groups. Fintech companies could target Gen Z by demonstrating market stability and advertising by using successful peer experiences. All cohorts selected better understanding of technology as a trust-builder.
Future Research
Future studies should include random sampling, exact birth years and validated psychometric scales for institutional trust and risk tolerance to get more precise results. Additionally, variables like devaluation exposure, realized losses, depreciation expectations, temporal ordering should be added. Comparative studies across Central Asian post-Soviet countries could help determine which of the present findings are specific to Kazakhstan, and which reflect broader regional patterns.
Separate multi-item scales like trust in the blockchain, an exchange, custody, price stability, fraud resistance, or the asset as a store of value would allow an estimation of internal consistency. That way, trust structure would be explored better as well.
A direct testing of TAM in this context would require perceived usefulness and perceived ease-of-use scales, allowing usage of the full acceptance model.
Testing whether post-Soviet institutional mistrust shapes cryptocurrency trust would require measurements of exposure to Soviet-era repression, and family history of political repression.
Additionally, this study only covered whether people believed that crypto protects against devaluation, rather than whether it actually did. Answering the latter would require market data: KZT-denominated cryptocurrency returns compared with benchmarks such as US dollar, gold, bank deposits.
Appendix
The instrument was fielded and written in Russian and was pretested by the counselor of the school. The English item wordings reported in this article were translated by the author after data collection, and they were reviewed by the counselor and the English teacher. No back-translation was performed.
Recruitment text:
Можете пожалуйста пройти опросник для статьи. Буду благодарен если пройдете!
«Доверие к криптовалюте среди разных поколений в Казахстане»
«Опрос займёт не более 3 минут. Все ответы анонимны. Ваши ответы будут
использоваться в качестве данных для создания статьи.»
Translation:
Please could you take the survey for an article. If you do, I will be grateful!
“Trust in cryptocurrency among different generations in Kazakhstan”
“The survey will not take more than 3 minutes. All answers are anonymous. Your answers will be used as data for writing an article.”
Questions with English Translation
| # | Original questions | English translation | Format |
|---|---|---|---|
| 1 | Когда вы родились? | When were you born? | Single-select: 1965–1980 / 1981–1996 / 1997–2012 |
| 2 | Как вы оцениваете свои знания в области криптовалюты? | How do you assess your knowledge of cryptocurrency? | Single-select: ничего не знаю(know nothing) / слышал(а) но мало знаю(have heard about it but know little) / знаю основы(know basic principles) / отлично разбираюсь(expert knowledge) |
| 3 | Владеете ли вы криптовалютой сейчас или владели раньше? | Do you currently own or have you previously owned cryptocurrency? | Single-select: да(yes) / нет(no) / нет, но планирую(no, but plan to) / нет и не планирую(no and do not plan to) |
| 4 | Насколько вы доверяете криптовалюте как финансовому инструменту? | How much do you trust cryptocurrency as a financial instrument? | 5-point scale, 1–5(1-do not trust, 5-completely trust) |
| 5 | Считаете ли вы криптовалюту надёжной защитой от девальвации тенге? | Do you consider cryptocurrency a reliable protection against tenge devaluation? | Single-select: нет(no) / скорее нет(probably not) / затрудняюсь ответить(do not know) / скорее да(probably yes) / да(yes) |
| 6 | Что вызывает у вас наибольшее недоверие к криптовалюте? | What causes you the greatest distrust of cryptocurrency? | Multi-select: высокая волатильность курса / отсутствие государственного регулирования / риск мошенничества / сложность использования / ничего — я доверяю криптовалюте |
| 7 | Насколько вы доверяете традиционной банковской системе Казахстана? | How much do you trust Kazakhstan’s traditional banking system? | 5-point scale, 1–5. 1 = do not trust; 5 = completely trust. |
| 8 | Какой способ хранения сбережений вы считаете наиболее надёжным? | Which method of storing savings do you consider most reliable? | Multi-select: банковский вклад в тенге / банковский вклад в иностранной валюте (USD, EUR) / наличные дома / криптовалюта / золото / недвижимость / акции и ценные бумаги |
| 9 | Какую долю сбережений вы готовы вложить в криптовалюту? | What share of your savings are you willing to invest in cryptocurrency? | Single-select: 0% / |
| 10 | Что могло бы повысить ваше доверие к криптовалюте? | What could increase your trust in cryptocurrency? | Multi-select: государственное регулирование и защита / стабилизация курса / лучшее понимание технологии / положительный опыт знакомых / ничего — я уже доверяю / ничего — я никогда не буду доверять |
Translations of 6, 8 and 10 Response Options Respectively:
6: Multi-select: high price volatility / absence of government regulation / risk of fraud / complexity of use / nothing — I trust crypto
8: Multi-select: bank deposit in tenge / bank deposit in foreign currency(USD,EUR) / cash at home / crypto / gold / real estate / stocks and securities
10: Multi-select: government regulation and protection / price stabilization / better understanding of technology / positive peer experiences / nothing — I already trust / nothing — I will never trust.
Coding Rules
Items 4 and 7 were analyzed as recorded on their original 1–5 scales. Item 2 was coded 1–4 (ничего не знаю(know nothing) = 1; слышал(а) но мало знаю (have heard about it but know little) = 2; знаю основы (know basic principles) = 3; отлично разбираюсь (expert knowledge) = 4). Item 3 was coded 1–4 (нет и не планирую(no and do not plan to) = 1; нет (no) = 2; нет, но планирую (no, but plan to) = 3; да (yes) = 4). Item 5 was coded 1–5 (нет (no) = 1; скорее нет (probably not) = 2; затрудняюсь ответить (do not know) = 3; скорее да (probably yes) = 4; да (yes) = 5). Item 9 was coded 1–4 (0% = 1; = 4). Birth-year ranges were implemented into cohorts: 1997–2012 = Generation Z; 1981–1996 = Millennials; 1965–1980 = Generation X. Multi select items (6, 8, 10) were analyzed as binary indicators for each option. Two response labels contain internal commas — “нет, но планирую” (“No, but plan to”) and “банковский вклад в иностранной валюте (USD, EUR)”(bank deposit in foreign currency (USD,EUR)”)— which required explicit handling when parsing comma-separated multi-select responses.
References
- M. F. Shahzad, S. Xu, W. M. Lim, M. F. Hasnain, S. Nusrat. Cryptocurrency awareness, acceptance, and adoption: the role of trust as a cornerstone. Humanities and Social Sciences Communications. Vol. 11, 2024, https://doi.org/10.1057/s41599-023-02528-7. [↩] [↩] [↩] [↩]
- A. Colicev, J. Hoste, J. Konings. The impact of a large depreciation on the cost of living of rich and poor consumers. International Economic Review. Vol. 65, pg. 1625–1656, 2024, https://doi.org/10.1111/iere.12720. [↩]
- A. de Vries, U. Gallersdörfer, L. Klaaßen, C. Stoll. Revisiting Bitcoin’s carbon footprint. Joule. Vol. 6, pg. 498–502, 2022, https://doi.org/10.1016/j.joule.2022.02.005. [↩]
- S. E. Honold, N. Oh. The influence of personality traits and demographic factors on cryptocurrency investment decisions. Personality and Individual Differences. Vol. 241, pg. 113189, 2025, https://doi.org/10.1016/j.paid.2025.113189. [↩] [↩]
- M. Nikolova, O. Popova, V. Otrachshenko. Stalin and the origins of mistrust. Journal of Public Economics. Vol. 208, pg. 104629, 2022, https://doi.org/10.1016/j.jpubeco.2022.104629. [↩] [↩]
- K. S. Namahoot, V. Rattanawiboonsom. Integration of TAM model of consumers’ intention to adopt cryptocurrency platform in Thailand. Human Behavior and Emerging Technologies. Vol. 2022, 2022, https://doi.org/10.1155/2022/9642998. [↩] [↩] [↩]
- L. Guiso, P. Sapienza, L. Zingales. Trusting the stock market. Journal of Finance. Vol. 63, pg. 2557–2600, 2008, https://doi.org/10.1111/j.1540-6261.2008.01408.x. [↩]
- R. Auer, D. Tercero-Lucas. Distrust or speculation? The socioeconomic drivers of U.S. cryptocurrency investments. Journal of Financial Stability. Vol. 62, pg. 101066, 2022, https://doi.org/10.1016/j.jfs.2022.101066. [↩]
- E. Saiedi, A. Broström, F. Ruiz. Global drivers of cryptocurrency infrastructure adoption. Small Business Economics. Vol. 57, pg. 353–406, 2021, https://doi.org/10.1007/s11187-019-00309-8. [↩]
- Y. Baeckström, A. Jalan, R. Matkovskyy. Individual investor trust and cryptocurrency participation: evidence from three Nordic countries. The Journal of Technology Transfer. Vol. 51, pg. 2569–2618, 2026, https://doi.org/10.1007/s10961-025-10276-w. [↩]
- C. Zeiß, M. Schaschek, L. Straub, C. Tomitza, A. Winkelmann. Re-intermediation of the crypto asset ecosystem by banks: an empirical study on acceptance drivers among the populace. Electronic Markets. Vol. 34, pg. 37, 2024, https://doi.org/10.1007/s12525-024-00720-4. [↩]
- H. Fujiki. Who adopts crypto assets in Japan? Evidence from the 2019 Financial Literacy Survey. Journal of the Japanese and International Economies. Vol. 58, pg. 101107, 2020, https://doi.org/10.1016/j.jjie.2020.101107. [↩] [↩]
- D. Balutel, W. Engert, C. S. Henry, K. P. Huynh, M. Voia. Explaining bitcoin ownership in Canada: trends from 2016 to 2021. Canadian Journal of Economics. Vol. 57, pg. 777–798, 2024, https://doi.org/10.1111/caje.12724. [↩]
- F. D. Davis. Perceived usefulness, perceived ease of use, and user acceptance of information technology. MIS Quarterly. Vol. 13, pg. 319–340, 1989, https://doi.org/10.2307/249008. [↩]
- V. Venkatesh, M. G. Morris, G. B. Davis, F. D. Davis. User acceptance of information technology: toward a unified view. MIS Quarterly. Vol. 27, pg. 425–478, 2003, https://doi.org/10.2307/30036540. [↩]
- M. Arias-Oliva, J. Pelegrín-Borondo, G. Matías-Clavero. Variables influencing cryptocurrency use: a technology acceptance model in Spain. Frontiers in Psychology. Vol. 10, pg. 475, 2019, https://doi.org/10.3389/fpsyg.2019.00475. [↩]
- A. S. A. Alomari, N. L. Abdullah. Factors influencing the behavioral intention to use cryptocurrency among Saudi Arabian public university students: moderating role of financial literacy. Cogent Business & Management. Vol. 10, 2023, https://doi.org/10.1080/23311975.2023.2178092. [↩]
- N. A. S. Almuraqab. Predicting determinants of the intention to use digital currency in the UAE: an empirical study. Electronic Journal of Information Systems in Developing Countries. Vol. 86, 2019, https://doi.org/10.1002/isd2.12125. [↩]
- M. A. Nadeem, Z. Liu, A. H. Pitafi, A. Younis, Y. Xu. Investigating the adoption factors of cryptocurrencies: a case of Bitcoin. SAGE Open. Vol. 11, 2021, https://doi.org/10.1177/2158244021998704. [↩]
- M. Recskó, M. Aranyossy. User acceptance of social network-backed cryptocurrency: a UTAUT-based analysis. Financial Innovation. Vol. 10, pg. 57, 2024, https://doi.org/10.1186/s40854-023-00511-4. [↩]
- V. Kumari, P. K. Bala, S. Chakraborty. An empirical study of user adoption of cryptocurrency using blockchain technology: analysing role of success factors like technology awareness and financial literacy. Journal of Theoretical and Applied Electronic Commerce Research. Vol. 18, pg. 1580–1600, 2023, https://doi.org/10.3390/jtaer18030080. [↩]
- E. Saktaganova, N. Çetin, K. Oshangaliyev, D. Aitmagambetov, Y. Sailaubai. Political and social transformation of Kazakhstan during the years of revolutions. Nationalities Papers. Vol. 54, pg. 961–980, 2026, https://doi.org/10.1017/nps.2025.10103. [↩]
- B. M. Blau, T. G. Griffith, R. J. Whitby. Inflation and Bitcoin: a descriptive time-series analysis. Economics Letters. Vol. 203, pg. 109848, 2021, https://doi.org/10.1016/j.econlet.2021.109848. [↩]
- H. Rodriguez, J. Colombo. Is bitcoin an inflation hedge? Journal of Economics and Business. Vol. 133, pg. 106218, 2025, https://doi.org/10.1016/j.jeconbus.2024.106218. [↩]
- S. Choi, J. Shin. Bitcoin: an inflation hedge but not a safe haven. Finance Research Letters. Vol. 46, pg. 102379, 2022, https://doi.org/10.1016/j.frl.2021.102379. [↩]
- C. Alexakis, G. Anselmi, G. Petrella. Flight to cryptos: evidence on the use of cryptocurrencies in times of geopolitical tensions. International Review of Economics & Finance. Vol. 89, pg. 498–523, 2024, https://doi.org/10.1016/j.iref.2023.07.054. [↩]
- D. Murakami, G. Viswanath-Natraj. Cryptocurrencies in emerging markets: a stablecoin solution? Journal of International Money and Finance. Vol. 156, pg. 103344, 2025, https://doi.org/10.1016/j.jimonfin.2025.103344. [↩]
- N. Oefele, D. G. Baur, L. A. Smales. The effect of currency risk on crypto asset utilization in Türkiye. Emerging Markets Review. Vol. 65, pg. 101264, 2025, https://doi.org/10.1016/j.ememar.2025.101264. [↩]
- A. Lusardi, O. S. Mitchell. The economic importance of financial literacy: theory and evidence. Journal of Economic Literature. Vol. 52, pg. 5–44, 2014, https://doi.org/10.1257/jel.52.1.5. [↩]
- F. Hayashi, A. Routh. Financial literacy, risk tolerance, and cryptocurrency ownership in the United States. Journal of Behavioral and Experimental Finance. Vol. 46, pg. 101060, 2025, https://doi.org/10.1016/j.jbef.2025.101060. [↩]
- H. Zhao, L. Zhang. Financial literacy or investment experience: which is more influential in cryptocurrency investment? International Journal of Bank Marketing. Vol. 39, pg. 1208–1226, 2021, https://doi.org/10.1108/IJBM-11-2020-0552. [↩]
- S. Carbó-Valverde, P. J. Cuadros-Solas, F. Rodríguez-Fernández. Cryptocurrency ownership and cognitive biases in perceived financial literacy. Journal of Behavioral and Experimental Finance. Vol. 45, pg. 101019, 2025, https://doi.org/10.1016/j.jbef.2024.101019. [↩]