

Abstract
In the United States, drug abuse continues to be a crucial public health challenge, especially in major cities like New York City. The impact of drug activity isn’t simply confined to its clinical effects, and public drug use visibility undermines community safety and well-being. While supervised consumption sites (SCS) have been reported to reduce overdose deaths and infectious disease transmission, far less is known about their influence on public drug use visibility in surrounding neighborhoods. To address this gap, this study analyzes the spatial relationships between the two SCS in New York City and two measures chosen to serve as proxies for public drug use: EMS drug-related calls and 311 syringe disposal complaints. EMS calls showed modest but significant clustering before and after SCS intervention (pre: I = 0.363, p=.003; post: I = 0.301, p<.001). 311 syringe complaints also demonstrated slight but significant clustering in both time periods (pre: I = 0.146, p=.047; post: I = 0.260, p=.006 ). Difference-in-differences estimates from a balanced ZIP code-month panel indicated a 2.5% reduction in EMS calls (95% CI: [-27.0, 30.2]) and a 34.9% reduction in syringe complaints (95% CI: [-67.0, 28.7]) in areas near SCS. However, neither of these estimates was significant. Event-study estimates showed that only the four months preceding the establishment of SCS passed the parallel trends assumption and thus these estimates should be taken as associations rather than causal effects. Lastly, four socioeconomic factors including non-white percentage, private insurance percentage, poverty rate, and median age were tested for associations with proximity to SCS. Higher non-white percentage (p-adjusted = .018) and poverty rate (p-adjusted = .007) were significant after Bonferroni correction, as well as lower private insurance percentage (p-adjusted = .005). Coupled with Local Moran’s I analysis that highlighted ZIP codes in Midtown Manhattan as hotspots of EMS calls and 311 syringe complaints, these results raise questions about what aspects should be considered when deciding present and future site locations.
Keywords: Spatial analysis, public health, drug use, biostatistics, harm reduction, difference-in-difference analysis, public drug visibility, opioid overdose prevention
Introduction
Drug use continues to be a serious public health issue in the United States. Despite recent decreases in annual overdose deaths, tens of thousands of Americans still die due to drug overdoses year after year1. Within the United States, efforts have been focused on combating the mortality rate and analyzing law enforcement’s approaches to curb sale of drugs and drug use. However, less is known about the impact that visibility of drug use in public spaces has on the communities hardest hit by the drug epidemic and its role in the drug epidemic as a whole2. Discarded syringes, public drug consumption, and overdose events increase the risk of physical ailments like bloodborne infections as well as elevating fear, stress, and the promotion of unsafe behaviors among the youth population3. As these factors erode public trust and safety4, drug use must be reexamined as a socio-environmental issue in addition to a biomedical issue.
To address these concerns, OnPoint NYC opened the first publicly recognized supervised consumption sites (SCS) in the United States in two sites in New York City (NYC). Funded by the NYC council, the OnPoint SCS are a part of a harm reduction strategy to address the clinical and social consequences of unsupervised public drug use5. These clinical consequences include overdose, infectious disease, injection-related injuries6, and acute medical complications such as seizures7. By providing a space where people can consume drugs safely under medical supervision, the SCS can reduce overdose deaths and the transmission of infectious diseases8. SCS staff are trained to intervene during an overdose, typically by administering naloxone, and to provide sterile injection equipment5 which also reduces the risk of bloodborne infections such as hepatitis C8. Previous studies from the United States and other countries have shown that SCS are effective in these clinical settings9,10. In just the first two months of operation, the two OnPoint sites have recorded thousands of visits and over a hundred occurrences where the staff successfully intervened in overdose events11. SCS have also been noted to reduce improperly discarded syringes and public drug use12. Additionally, the sites connect visitors to detoxification and housing services, healthcare, and social support systems, allowing SCS to impact both clinical outcomes and how drug use proliferates throughout public spaces5,13.
However, as stated before, most existing research on the impacts of SCS has been focused primarily on individual health outcomes, leaving broader community effects largely unexamined13. Even among studies that do evaluate the neighborhood-level impacts of SCS, few account for the socioeconomic context in which the neighborhoods exist even though neighborhoods in NYC vary widely in resources, infrastructure, and baseline exposure to drug-related harms14. Without accounting for these socioeconomic differences, it remains unclear whether SCS meaningfully reduce visible drug activity in surrounding neighborhoods or simply displace it spatially15. As a result, our understanding of how SCS shape everyday experiences of New Yorkers remains limited.
To address this gap, our study conducts a geospatial analysis of SCS using publicly available data that act as a proxy indicator of public drug visibility. 311 syringe disposal complaints and emergency medical services (EMS) drug-related calls data are accessed through NYC Open Data. By examining how patterns of public drug use change with distance from the sites and factoring in underlying neighborhood socioeconomic characteristics, this research investigates how SCS proximity is associated with visible drug-related activity.
Methods
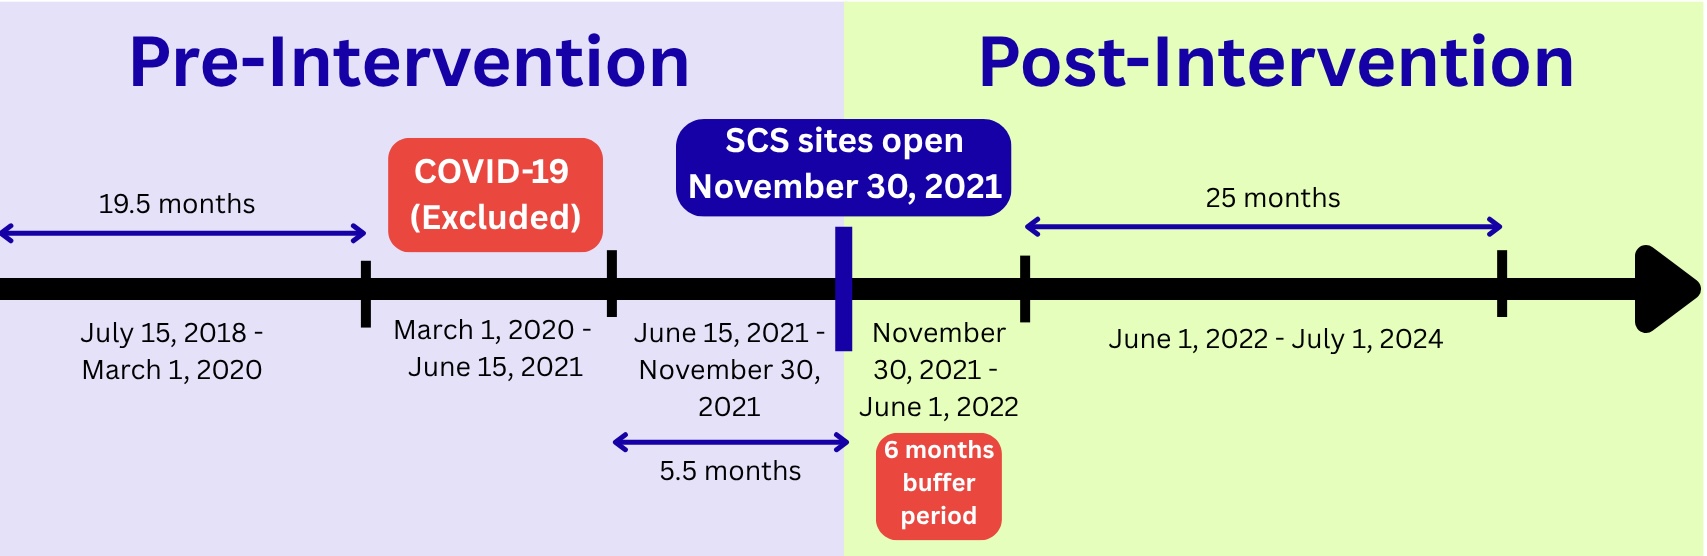
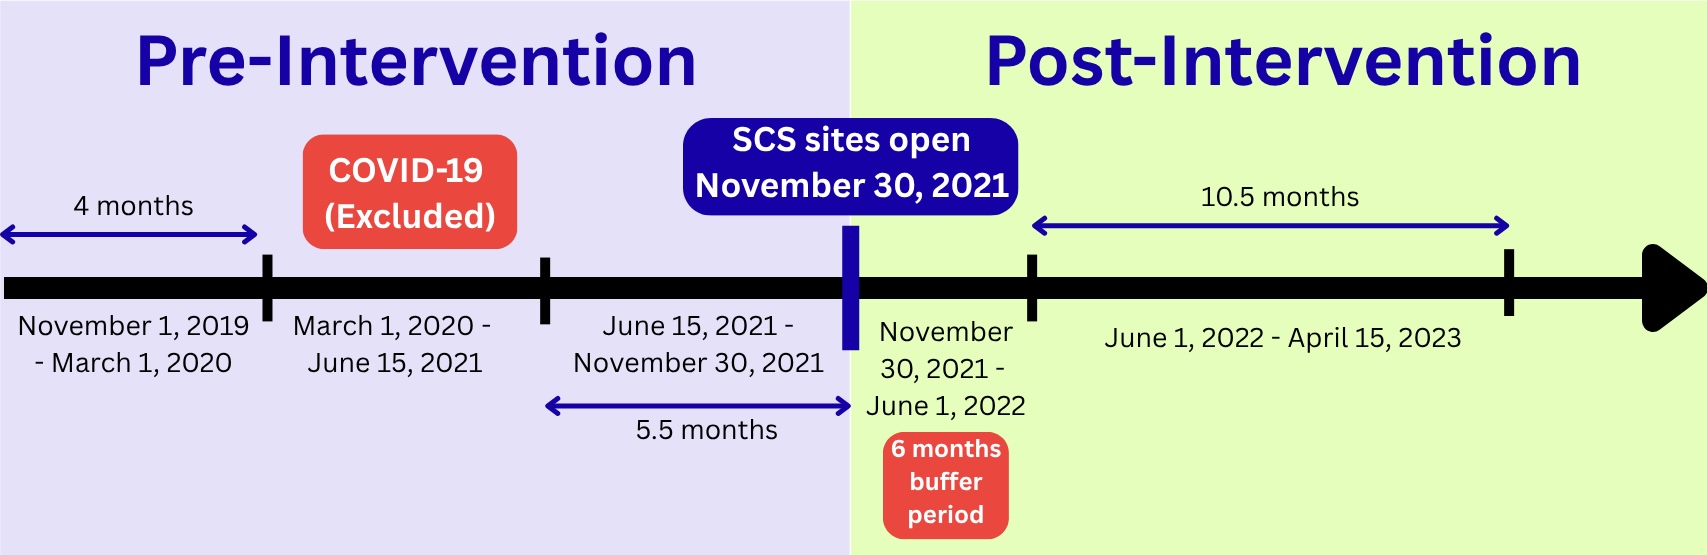
To evaluate if SCS influence public drug visibility, this study used a pre-intervention/post-intervention design where the intervention is the opening of the SCS. There was a six-month buffer period after the first date of the OnPoint SCS operation on November 30, 2021. This buffer period was created to address how changes observed immediately after the opening date cannot be attributed to the intervention alone since the sites require time to be established within the community16,17. Therefore, the post-intervention period effectively started on June 1, 2022. The buffer period was not cut out of the data analysis and was instead an estimated term in the models to test if there was any change during the buffer period.
The EMS calls data spanned from July 2018 to July 2024 while the 311 syringe complaints spanned from November 2019 to July 2024. The 311 syringe data had a shorter time window because the data prior to November 2019 was not available for collection. The two time windows both ended on July 2024 for comparability.
The COVID-19 pandemic posed an issue in how it might affect the underlying proxies during the pre-intervention period. Due to the disruptive nature of the pandemic18, we decided to exclude data from March 2020 (first confirmed COVID case in NYC) to June 2021 (New York State fully reopens).
Both the EMS calls data (dataset ID: 76xm-jjuj) and the 311 syringes data (dataset IDs: erm2-nwe9 and 76ig-c548) originated from NYC Open Data. The EMS calls data contained a wide variety of incident types that the New York City Fire Department responded to and only the incidents that pertained to overdose reports and drug-related emergencies were filtered for the study. For the 311 syringes data, the original dataset included all 311 service requests, so a filter for syringe-related requests was implemented. All data was further filtered to only include events that occurred in Manhattan specifically. The 311 syringes data was point-based, with a latitude and longitude coordinate for each complaint, while the EMS calls data was pre-aggregated at the ZIP code level. Thus, to maintain the same level of granularity across the two datasets, the 311 syringe points were also aggregated at the ZIP code level. Ultimately, both datasets were converted to ZIP code-month units for analysis. ZIP code shapefiles from the U.S. Census Bureau were used to define the boundaries of each ZIP code for spatial joining and plotting.
The locations of the two SCS were collected by converting the official addresses of the two sites given by OnPoint NYC into latitude and longitude. ZIP codes were then either classified as “near” or “far” using a contiguity-based approach where any ZIP code that contained an SCS or shared a boundary with a ZIP code containing an SCS was classified as “near”. All remaining ZIP codes were classified as “far”.
Poverty rate, percentage of privately insured individuals, percentage of non-white individuals, and median age were the four socioeconomic factors selected based on established social determinants of health19. The socioeconomic data was obtained from the U.S. Census Bureau and was pre-aggregated at the ZIP code level. Poverty rate and private insurance coverage rate measure economic stability and access to healthcare as most private insurance is directly tied to full-time employment20. The percentage of non-white individuals captures disparities in healthcare access. In addition, it reflects how drug enforcement has historically focused disproportionately on marginalized communities21. Median age was included since mortality rates22 and public drug use rates vary across age groups.
For analyzing the spatial clustering of both outcomes (EMS calls and 311 syringe complaints), we used Global Moran’s I to measure global spatial autocorrelation. Moran’s I can show if nearby areas resemble each other more than expected by random chance and has been applied in previous drug-related spatial epidemiology studies23. Values for I range from -1 (perfect dispersion) to +1 (perfect clustering), with -1/(n-1) indicating a random spatial distribution. In our analysis, this expected value for spatial randomness was -0.022.
In preparation for the Moran’s I analysis, we constructed spatial weights via row-standardized queen contiguity. The spatial matrix encoded which ZIP codes are neighbors by sharing a boundary with one another. Then, Moran’s I values and their respective significance were calculated for the pre-intervention and post-intervention periods with 999 permutation-based Monte Carlo simulations. Since Global Moran’s I cannot specify where the clustering exists, we also computed Local Moran’s I and statistical significance for both time periods. The Local Moran’s I analysis allowed us to investigate if the significantly clustered neighborhoods coincide with the ZIP codes containing the SCS. This analysis relied upon the same definition of neighbors and the same number of Monte Carlo simulations for statistical significance. The p-values were adjusted with the Benjamini-Hochberg correction to account for multiple testing. Both the global and local statistics were computed on event rates per resident rather than on raw counts because counts rise with population, so clustering measured on counts partly reflected where people live rather than where drug-related activity is concentrated.
To investigate the association between the establishment of SCS and the two proxies of public drug use (EMS calls and 311 syringe complaints), we employed a difference-in-differences (DiD) analysis that could compare the changes in the rates of these outcomes across different time periods and proximities. Each proxy’s dataset was converted into a ZIP code–month panel where each month for each ZIP code has its own row with a count. If a certain ZIP code-month did not have an event for a particular month, that row was kept, but ZIP codes that did not have any events across all months were excluded. In total, the EMS panel had 2,622 rows (46 ZIP codes over 57 months) while the 311 syringe complaints panel had 1,886 rows (46 ZIP codes over 41 months). The panels also included if a ZIP code is near an SCS or not and which time period (pre vs. post-intervention) the row belonged to.
We modeled the EMS call and 311 syringe complaint counts using a Poisson regression with ZIP code and month fixed effects. The panels also included population counts, allowing us to offset population estimates as rates instead of the raw counts. To check for the Poisson modeling assumptions, dispersion statistics were also computed. Since there are only two SCS, we supplemented conventional inference with randomization inference where treatment was reassigned at random to 1,000 placebo pairs of ZIP codes more than 2 miles away from a SCS and the placebo results were compared to the actual estimates. The standard errors were clustered by ZIP code to account for error correlation within neighborhoods.
An event-study model was used to evaluate the parallel trends assumption with separate estimates for each month before and after the intervention relative to the month before SCS opening. Pre-intervention coefficients were tested jointly for the entire pre-intervention period (including the pandemic) and then also separately for pre-pandemic months, pandemic months, and four months right before the sites opened. Given the small number of treated areas, these tests were repeated using a small-sample correction (CR2 and Hotelling’s distribution). Sensitivity analyses using the Rambachan and Roth24 method assess the robustness of the results by investigating how large a difference from parallel trends would be needed to overturn the finding.
Additionally, supplementary analyses performed robustness checks and tested for confounding factors. We estimated four placebo models that each used a fake opening date during the pre-intervention time period. Next, we estimated the effects separately for the East Harlem SCS site and the Washington Heights site to check if combining the sites hide certain patterns and signals. Then, we repeated the analysis with four different definitions of the comparison group: all other ZIP codes, ZIP codes > 2 miles from a site, 20 ZIP codes matched based on pre-intervention rates and trends, and 1,000 meter radius buffers around each site rather than relying upon ZIP code boundaries and contiguity. Also, we analyzed potential spillover effects by estimating associations across various distance bands of ≤ 0.5 miles, 0.5 – 1 mile, 1 – 2 miles, and 2 – 3 miles from a site, relative to ZIP codes > 3 miles away. Lastly, to account for other syringe service programs (9 operating in Manhattan), we identified ZIP codes within 1,000 meters of each program site and re-estimated models while adjusting for their presence and excluding these ZIP codes from the comparison group.
For assessing the associations between socioeconomic factors and proximity to a SCS, we utilized a logistic regression model where the covariates are non-white percentage, private insurance percentage, poverty rate, and median age. The outcome variable was whether a ZIP code is near a SCS by the same contiguity definition used in prior analyses. Non-white percentage, private insurance percentage, and poverty rate were scaled per 10 percentage point increase. We analyzed multicollinearity using variance inflation factors and strength of model fit using McFadden’s pseudo-R-squared and the Hosmer-Lemeshow test. Given the limited sample size of 46 ZIP codes where only 10 are considered near a SCS, we also estimated univariate models and applied Bonferroni correction to the p-values.
Results
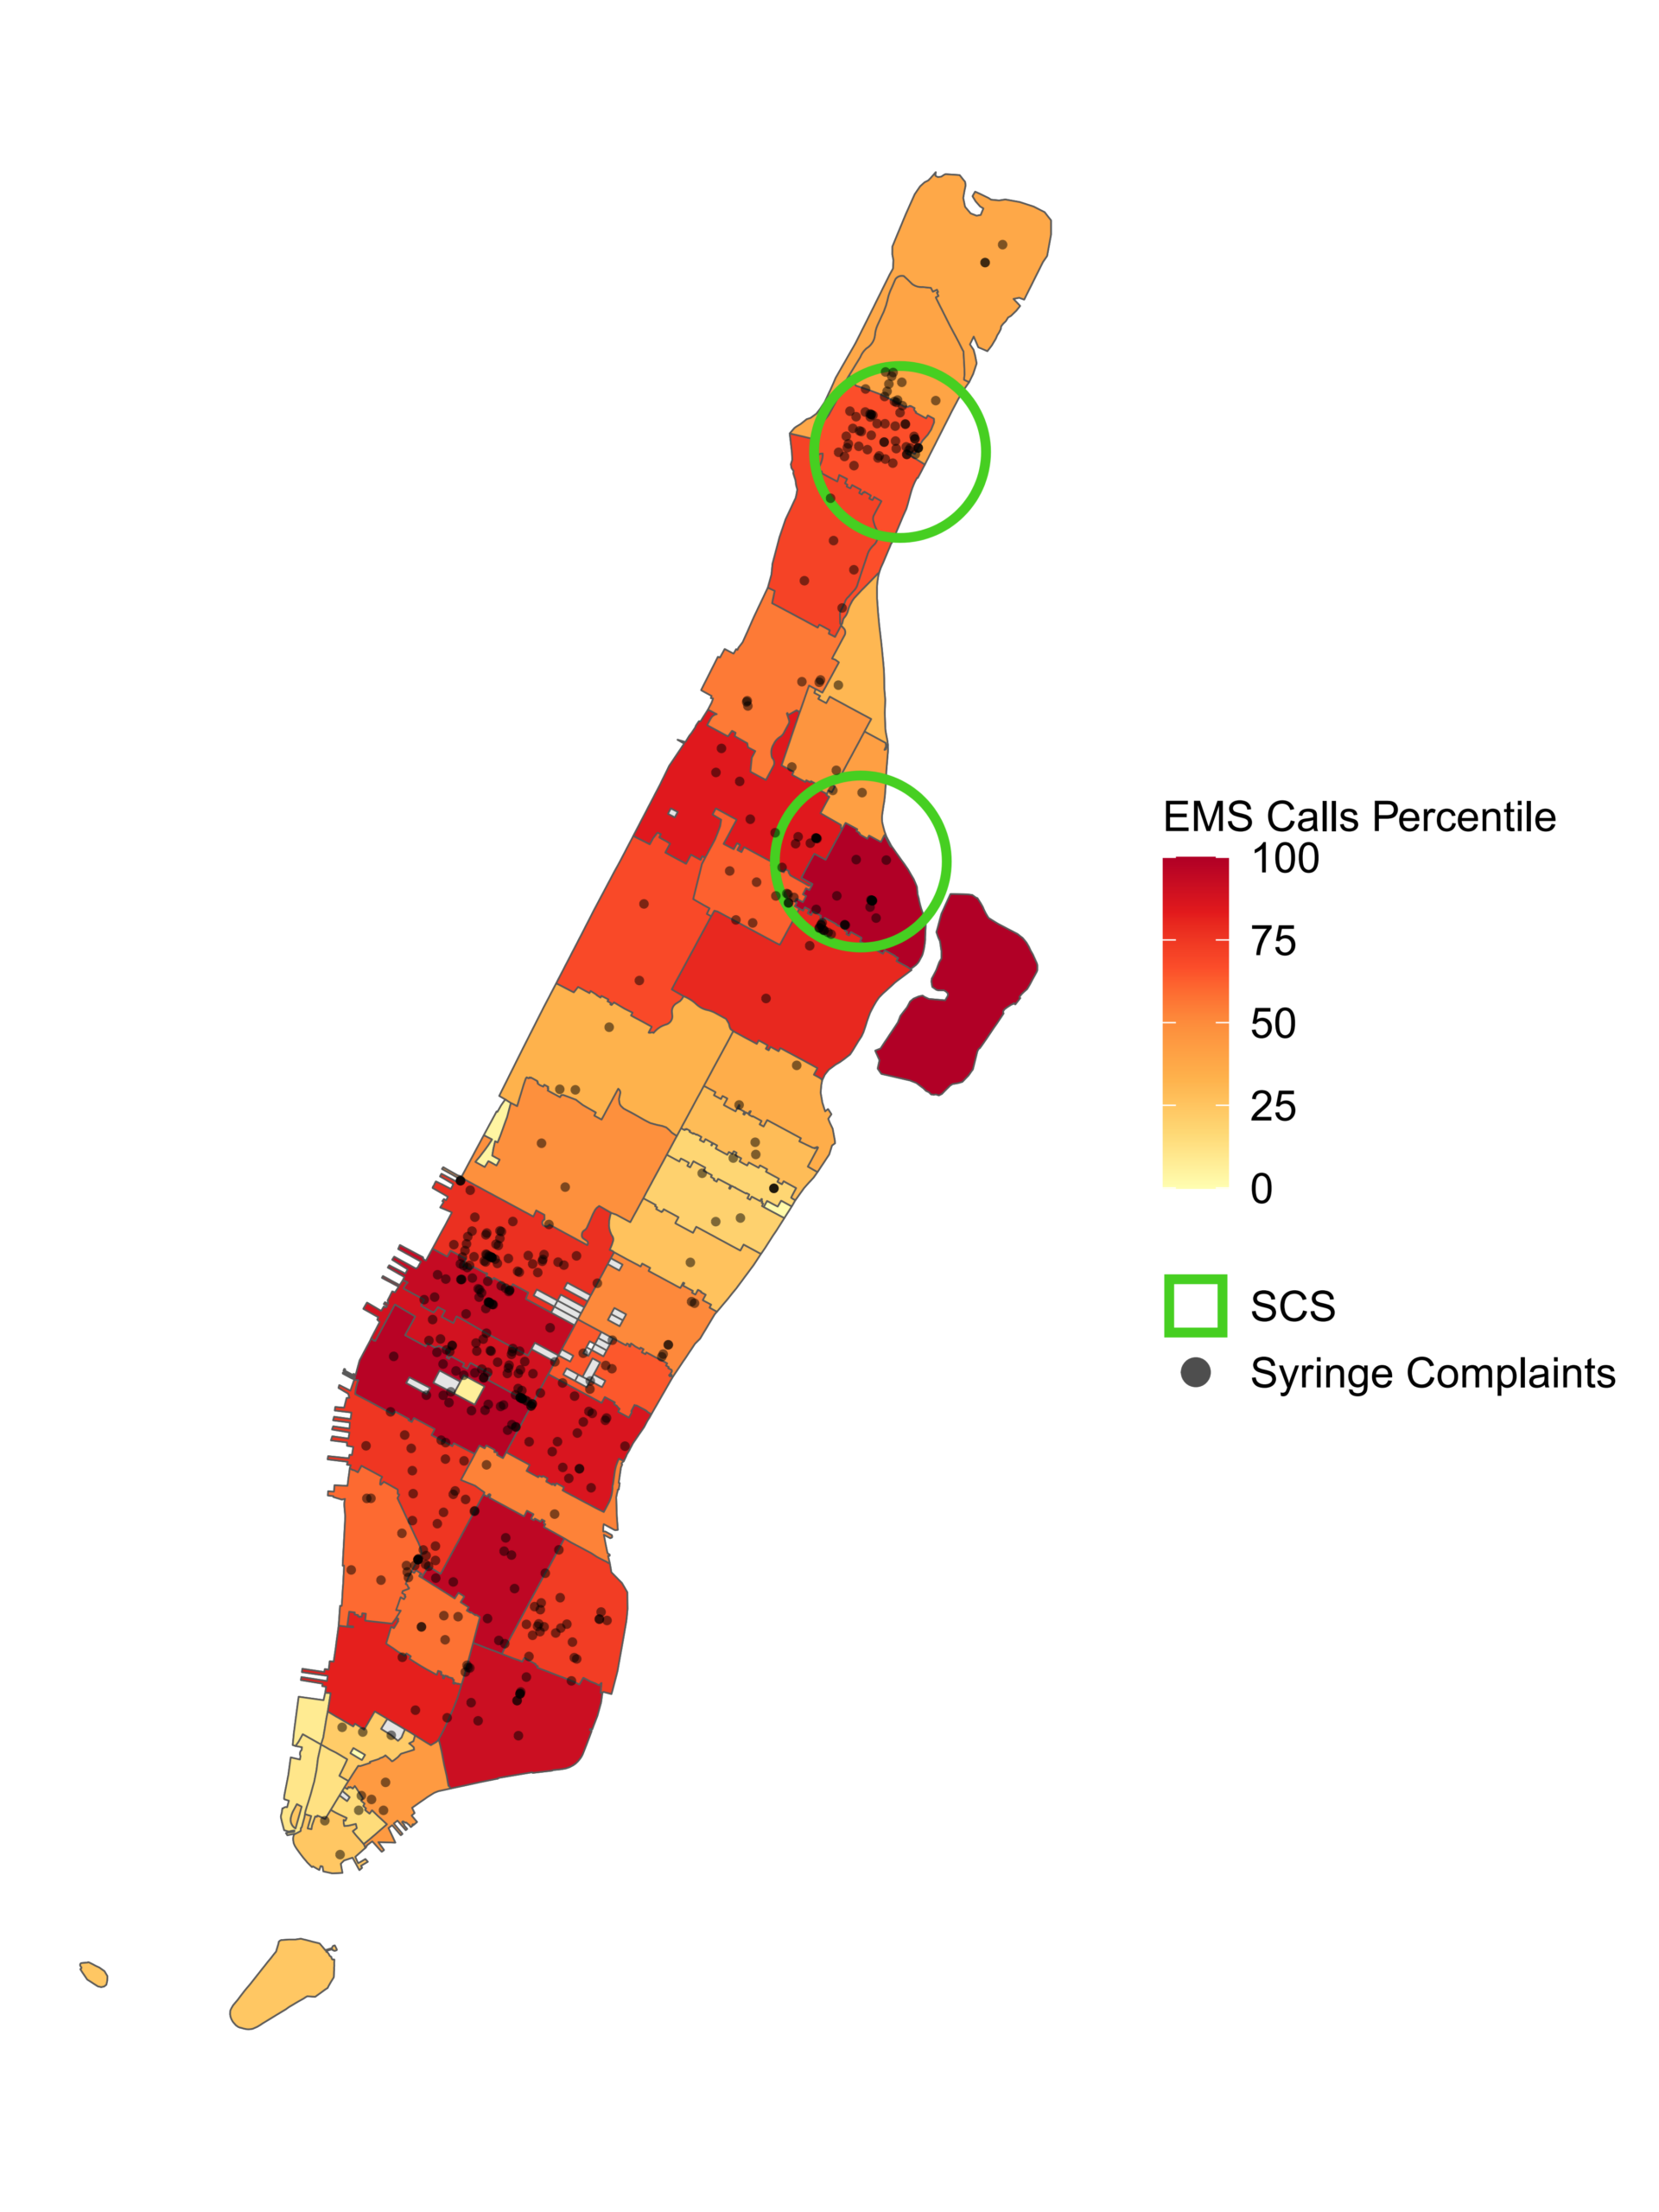
We first tested whether drug-related events were geographically clustered rather than spread evenly across Manhattan, using Moran’s I separately for the periods before and after the sites opened. For EMS calls, Moran’s I was 0.363 before the intervention (p = .003) and 0.301 after (p < .001). Both values are positive and statistically significant, meaning EMS calls were concentrated in particular areas rather than scattered randomly, and that concentration did not change after the sites opened. Syringe complaints showed a similar pattern. Before the intervention, Moran’s I was 0.146 (p = .047), consistent with a slightly clustered distribution. Afterward, it rose to 0.260 (p = .006). Both proxies showed significant clustering in all periods and no meaningful change between them.
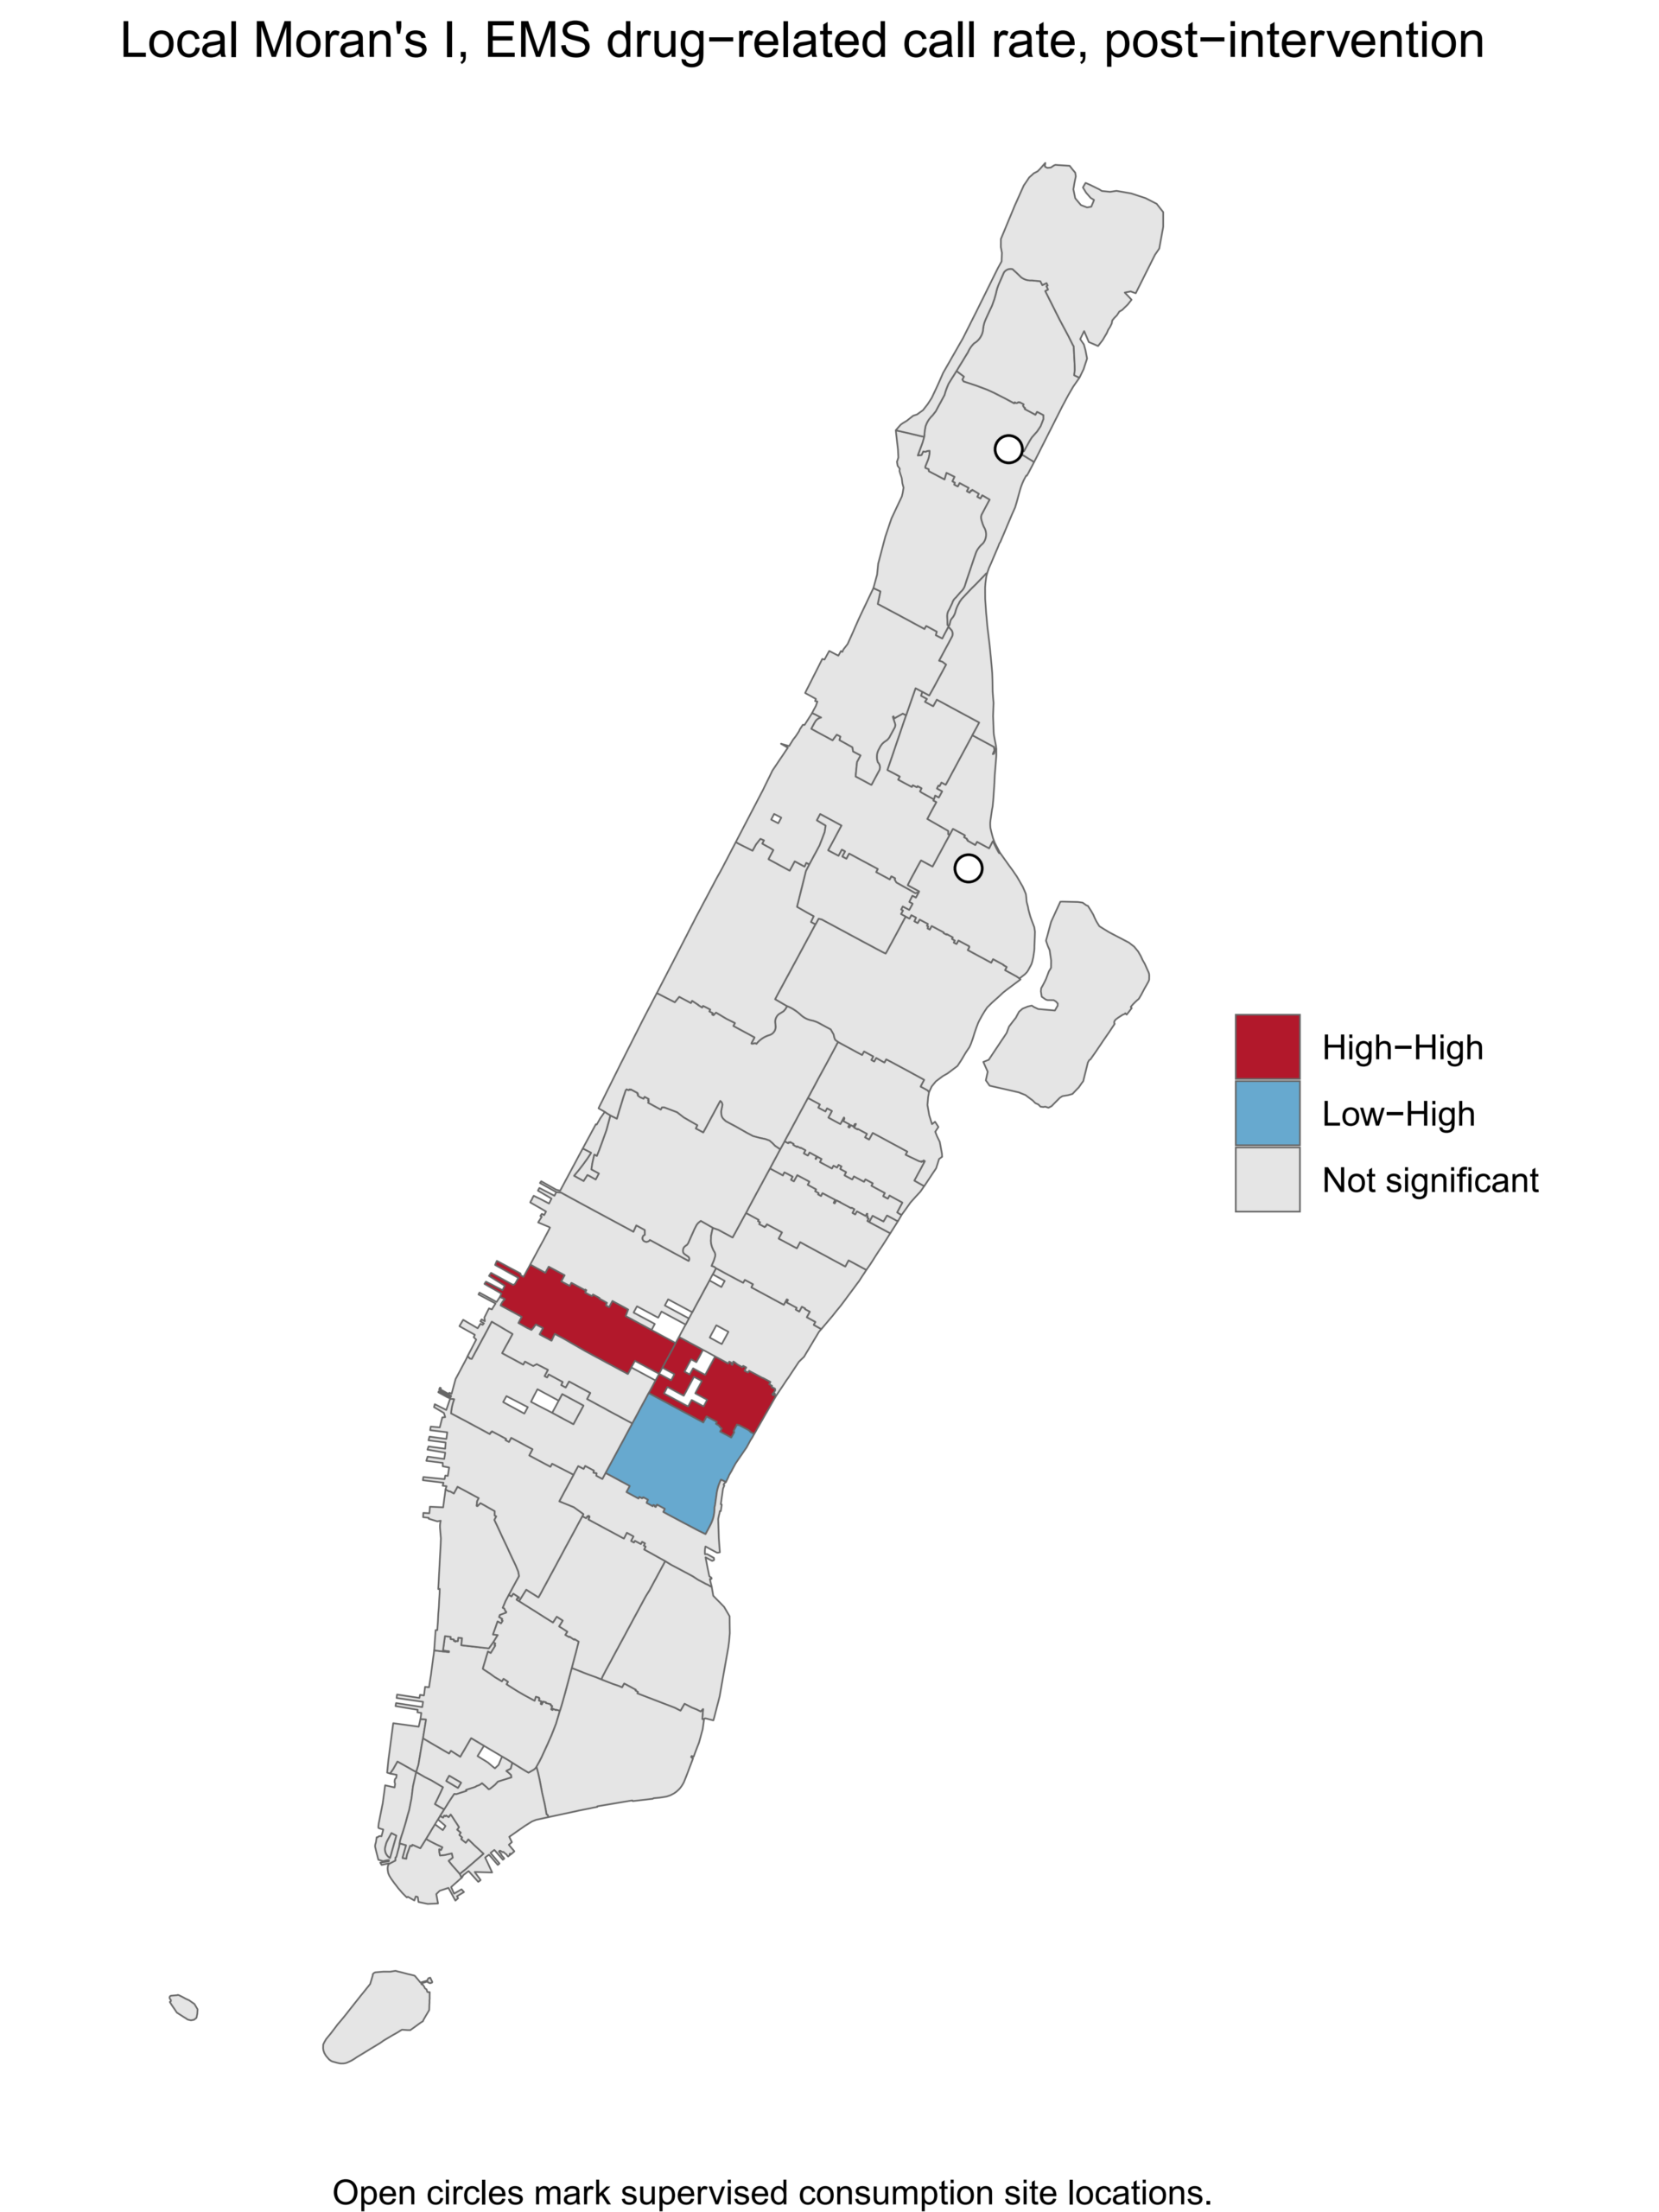
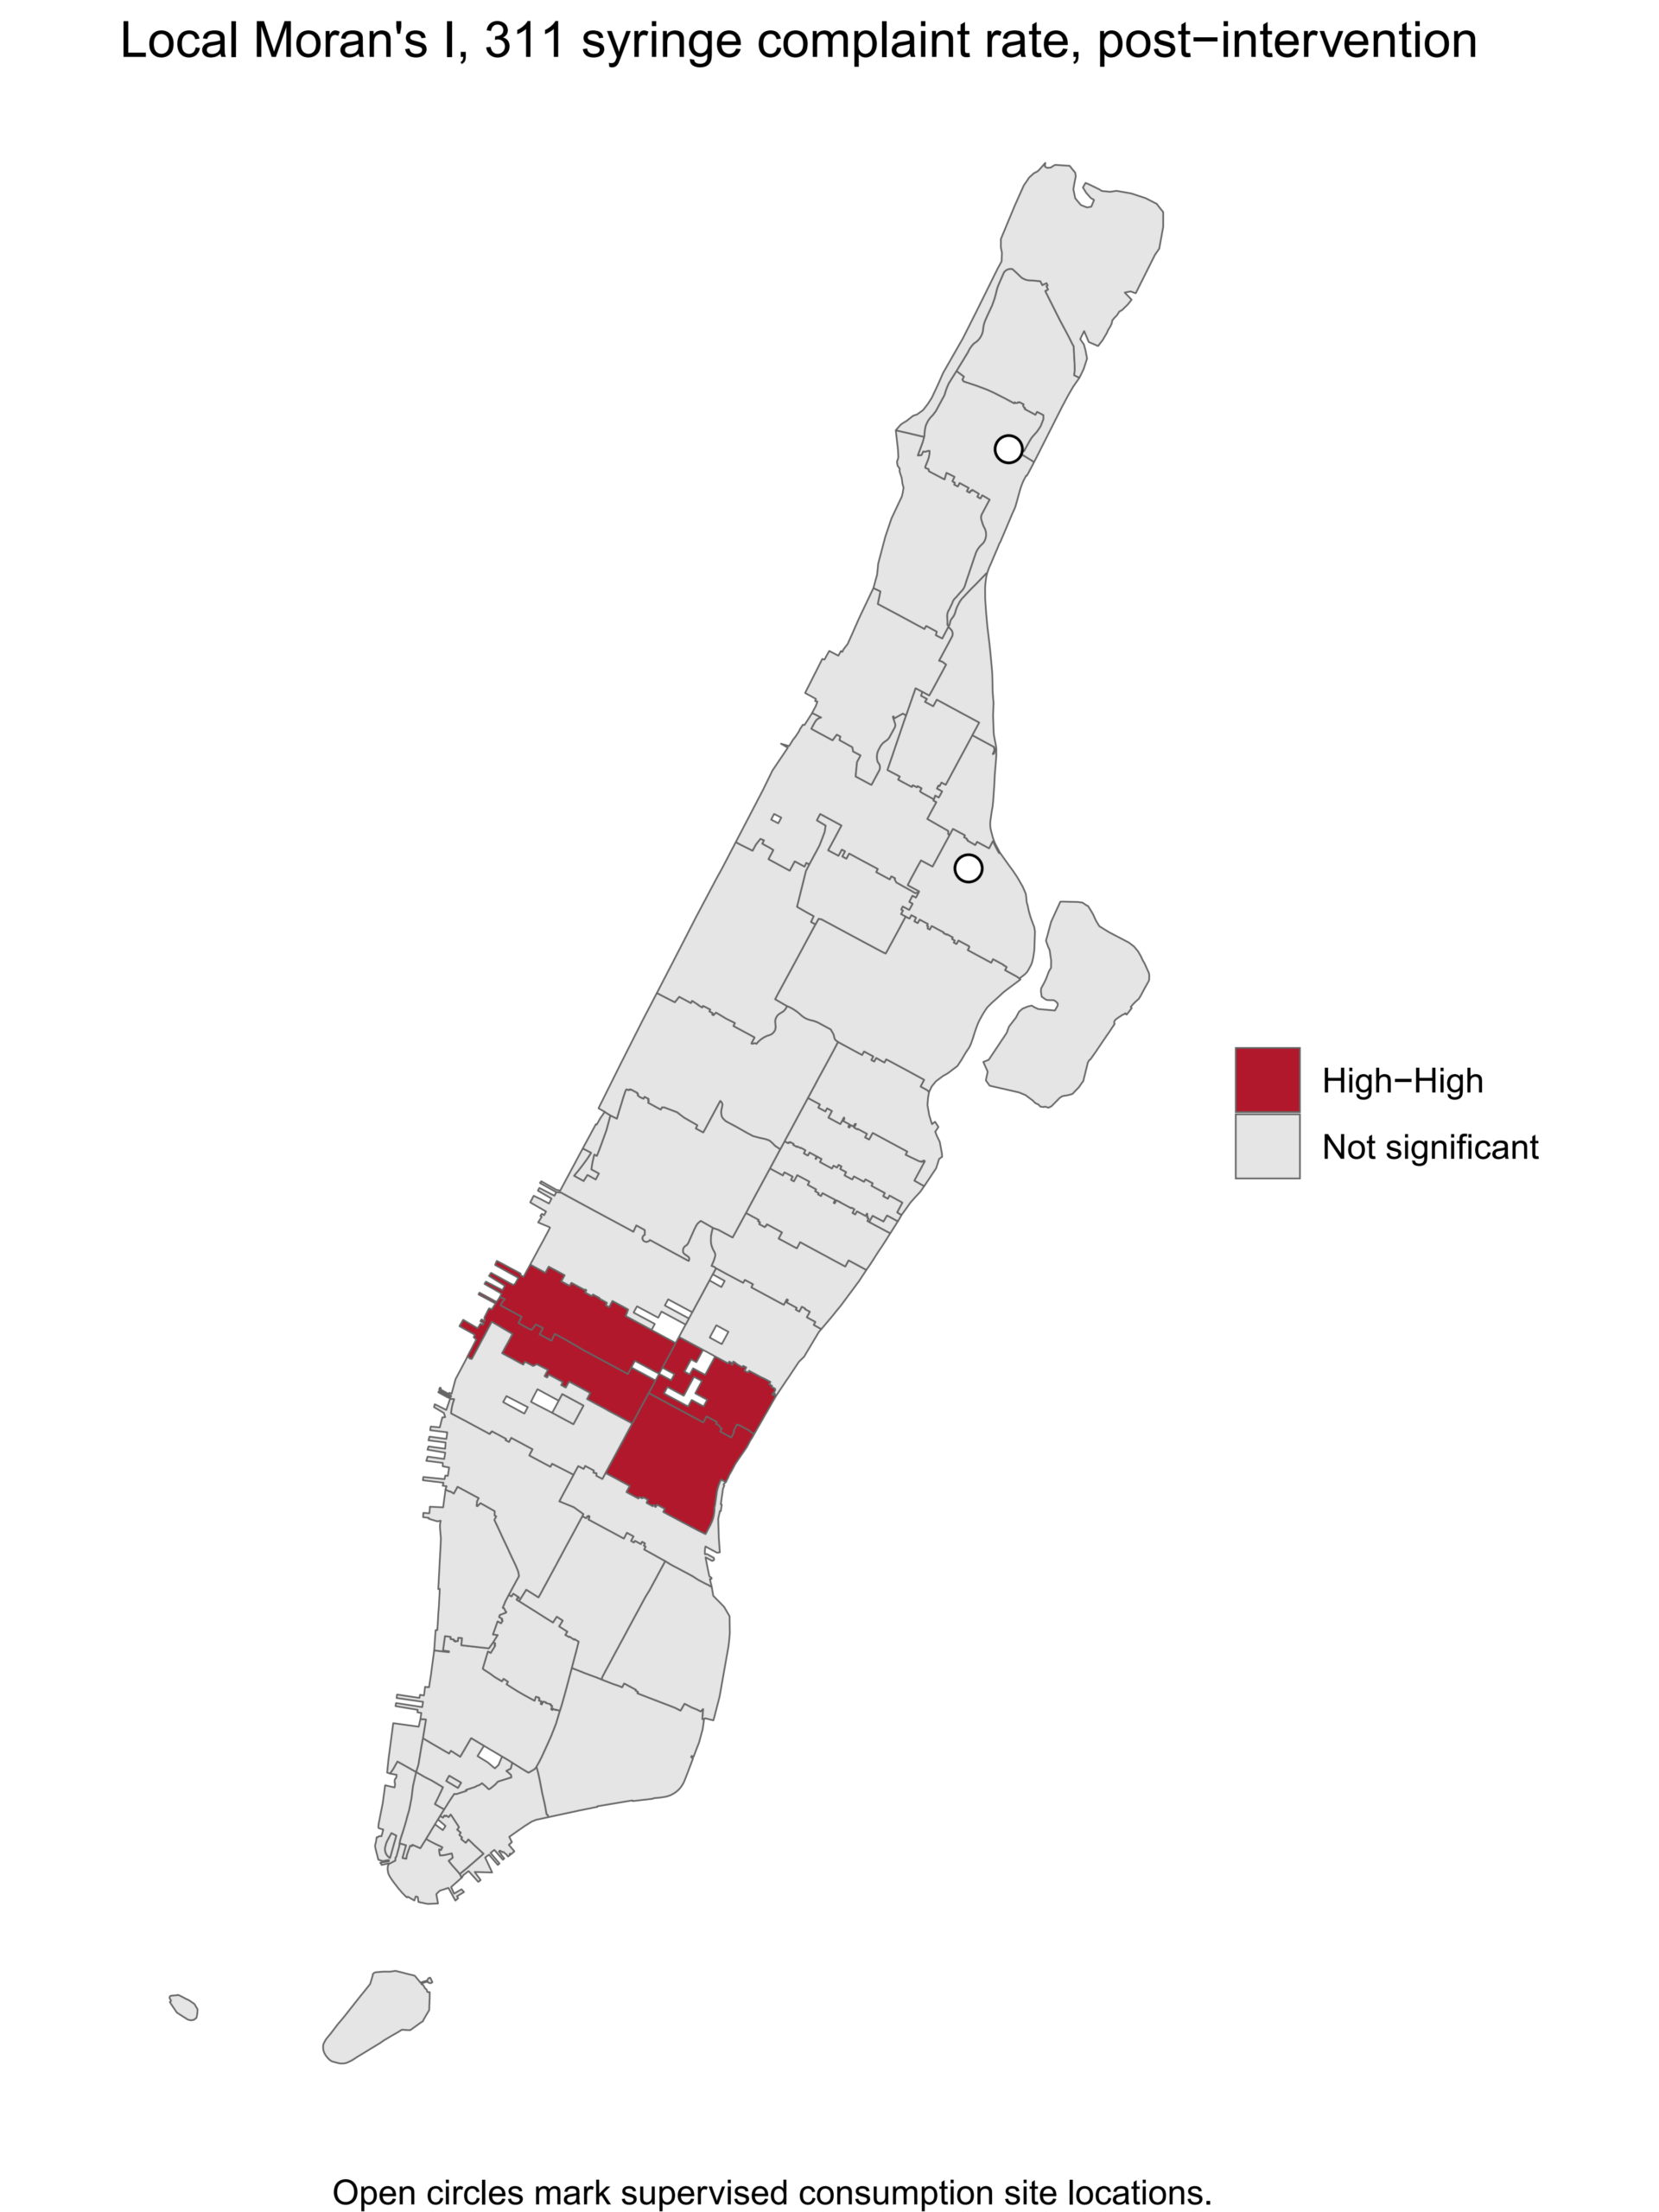
The local statistics showed where the clustering sits. For EMS calls, three of the 46 ZIP codes showed significant local clustering after the intervention. Two formed a cluster of high-rate areas in Midtown Manhattan (10017 and 10036) and one was a low-rate area below a high-rate area (10016). Neither ZIP code hosting a site showed significant clustering: East Harlem returned a local Moran’s I of -0.132 (p = .868) and Washington Heights 0.084 (p = .370). The concentration of drug-related emergency calls detected by the global statistic is therefore in Midtown, not in the neighborhoods where the facilities are located.
Similarly, the Local Moran’s I results for the 311 syringe complaints showed four non-site ZIP codes as significant post-intervention. The significant ZIP codes are located in Midtown Manhattan (10016, 10017, 10018, and 10036) and are high-rate areas. Again, neither East Harlem, with a local Moran’s I of -0.013 (p = .813), nor Washington Heights, with a local Moran’s I of -0.503 (p = .469), showed significant clustering.
The difference-in-differences analysis compared how EMS calls and syringe complaints changed near the sites against how they changed elsewhere. For EMS calls, the estimate was -0.0253 (SE = 0.1475, p = .864), a 2.5% reduction in near areas relative to comparison areas, with a 95% confidence interval running from a 27.0% reduction to a 30.2% increase. For syringe complaints, the estimate was -0.4286 (SE = 0.3475, p = .217), a 34.9% reduction, with a confidence interval from a 67.0% reduction to a 28.7% increase. Neither result can be distinguished from no change at all. The terms for the six-month establishment buffer were close to zero for both outcomes (EMS: 0.0005, SE = 0.1570; syringe: 0.0562, SE = 0.2291), showing no differential change before the sites were fully running.
| Moran’s I [Estimate (p)] | DiD [Estimate (p)] | ||||
| Pre-intervention | Post-intervention | Pre-intervention | SCS Proximity | Interaction Term | |
| EMS Calls (2,622 ZIP code–months) | 0.363 (p=.003) | 0.301 (p<.001) | — | — | −0.025 (p = .864) |
| 311 Syringes (1,886 ZIP code–months) | 0.146 (p=.047) | 0.260 (p=.006) | — | — | −0.429 (p = .217) |
Note. Difference-in-differences estimates are from Poisson models fitted to the ZIP code–month panel with ZIP code and calendar-month fixed effects and a log-population offset. The pre-intervention and SCS proximity terms are absorbed by the fixed effects and are therefore not estimated separately. Coefficients are on the log scale; exponentiating gives rate ratios of 0.975 for EMS calls and 0.651 for syringe complaints, corresponding to the percentage changes reported in the text. Standard errors are clustered at the ZIP code level, and randomization-inference p-values are reported in the text.
Dispersion statistics were 2.53 for EMS calls and 1.51 for syringe complaints. Values above 1 mean the data vary more than a Poisson model assumes, which was most pronounced for EMS calls, so we refitted both models using a negative binomial specification that allows for this extra variation. Under that specification the EMS estimate was 0.0407 (SE = 0.0969, p = .674), a 4.2% increase with a confidence interval from a 13.9% reduction to a 25.9% increase, and the syringe estimate was -0.3789 (SE = 0.3349, p = .258), a 31.5% reduction with a confidence interval from a 64.5% reduction to a 32.0% increase.
The EMS estimate changes direction between the two models, from a 2.5% reduction to a 4.2% increase, while remaining indistinguishable from zero in both. The syringe estimate holds steady in both direction and size across specifications. Because the syringe models exclude seven ZIP codes with no complaints in any month, they are fitted to 1,599 rather than 1,886 ZIP code-months.
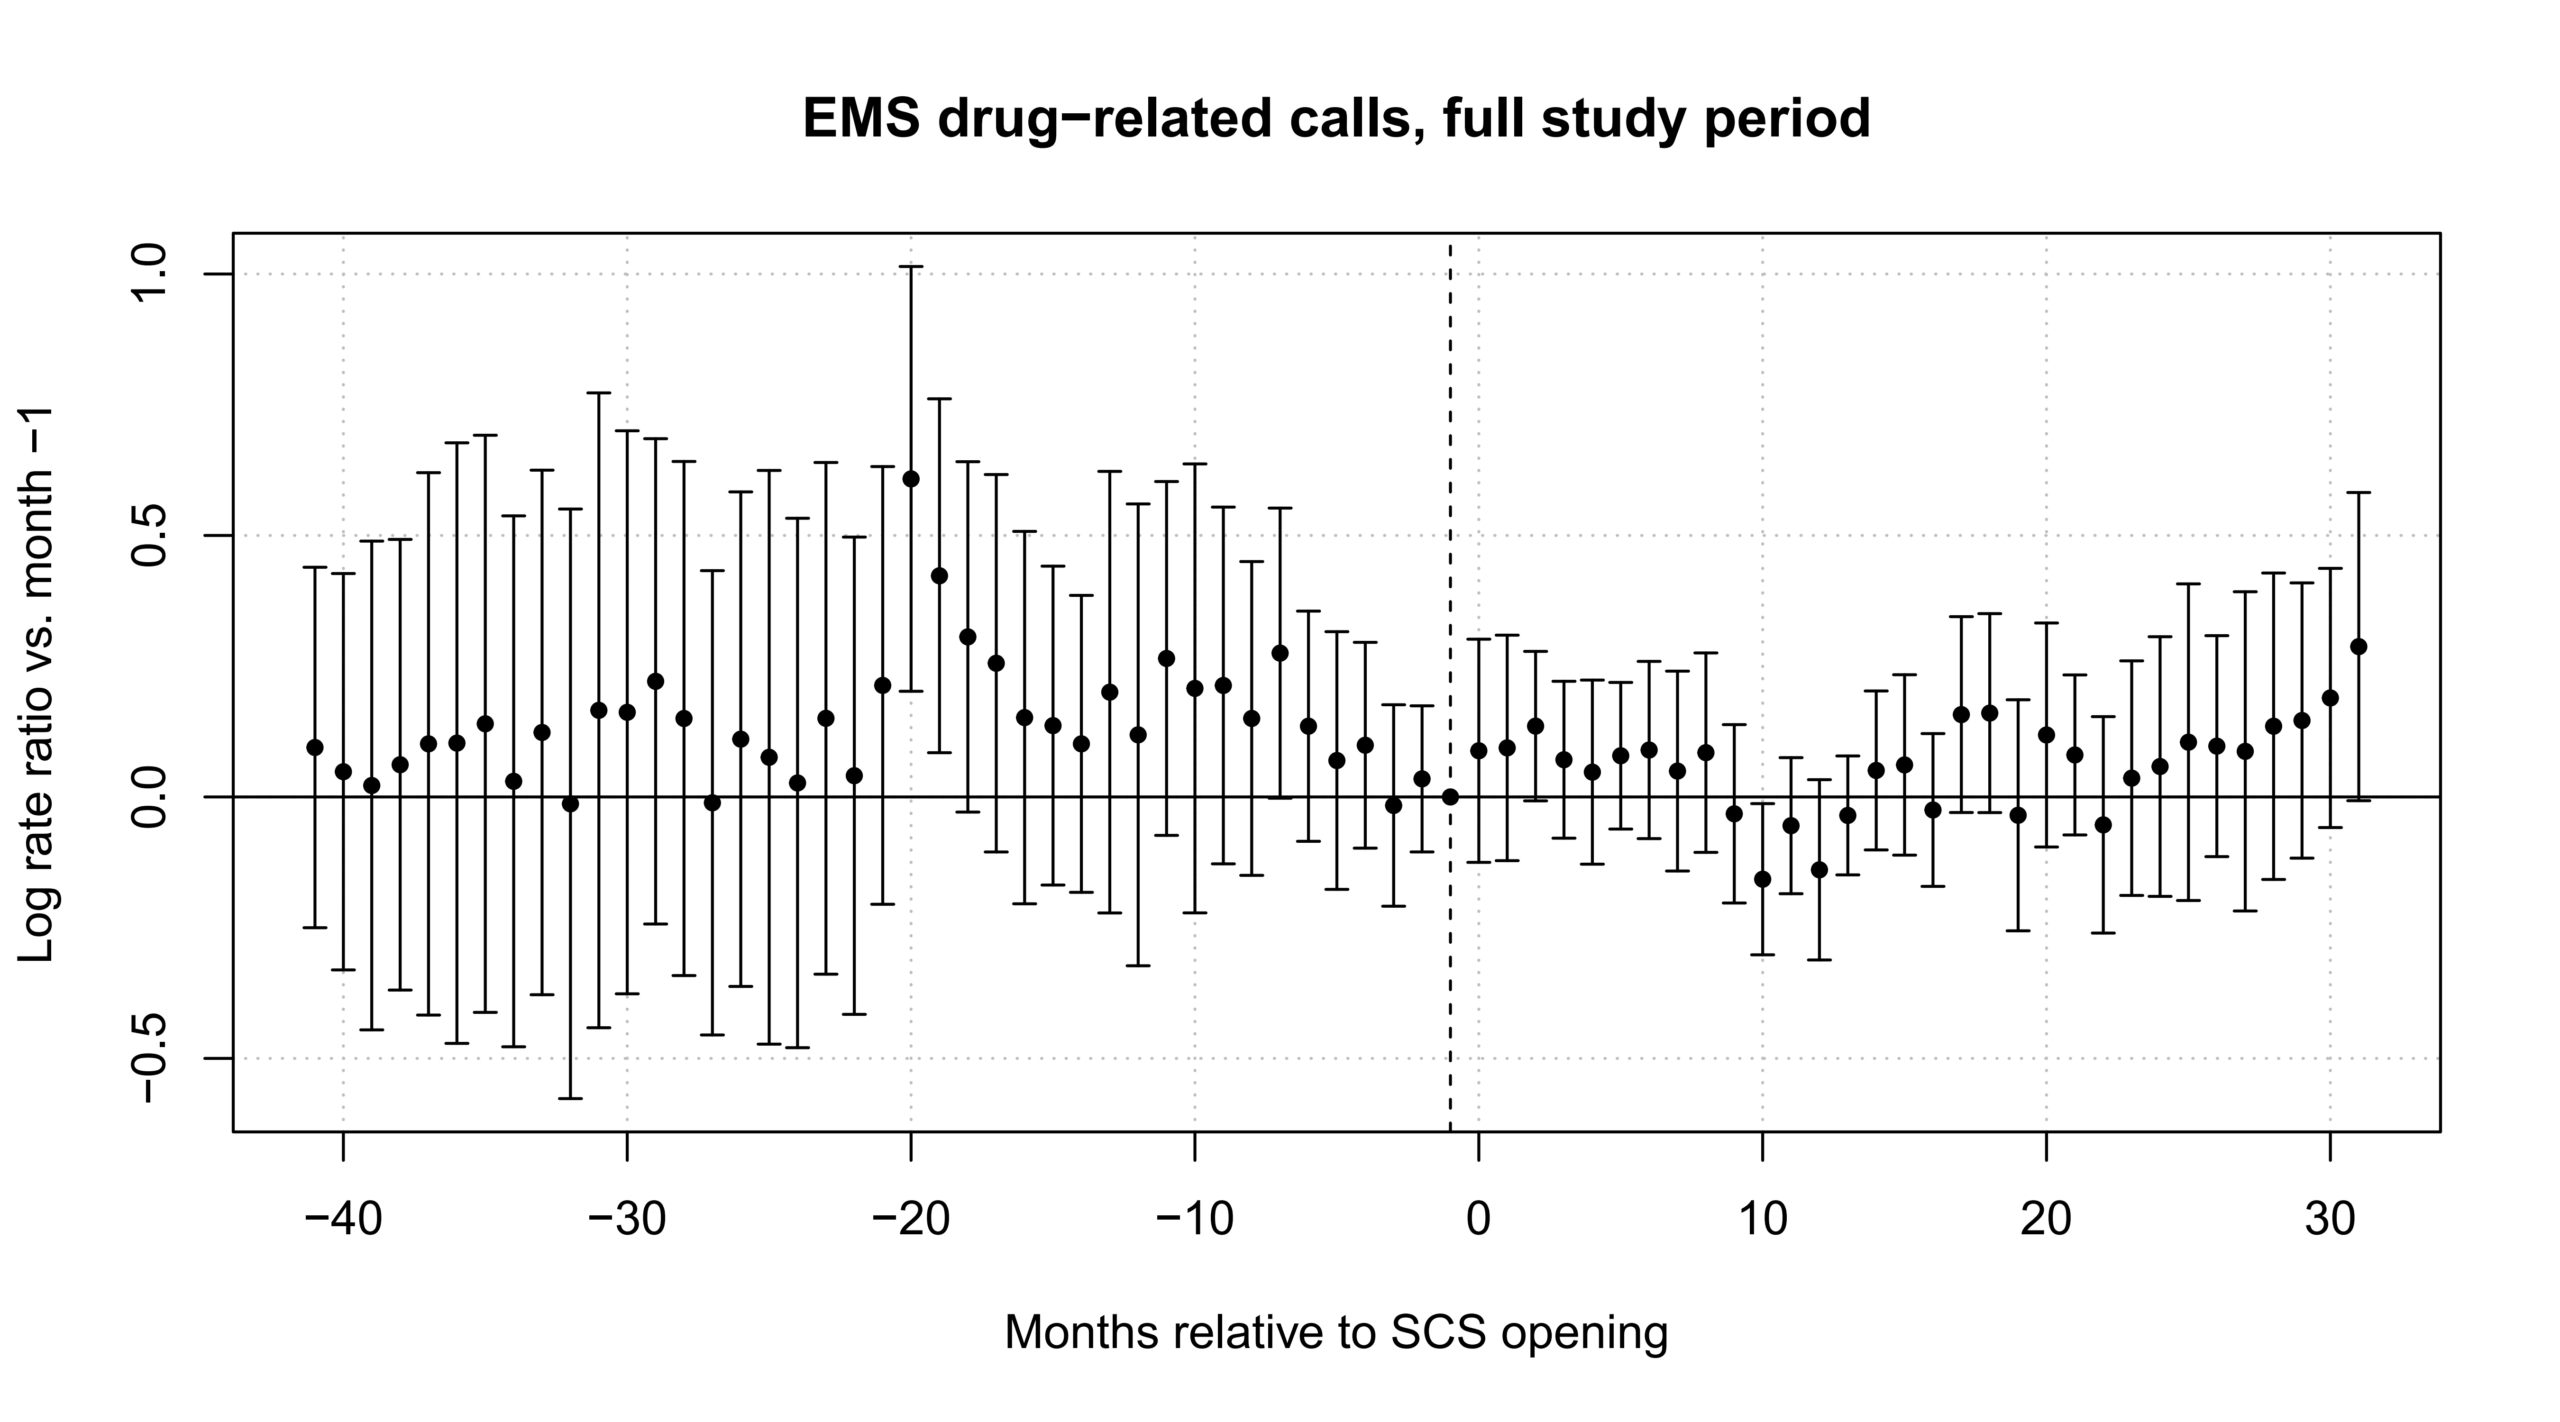
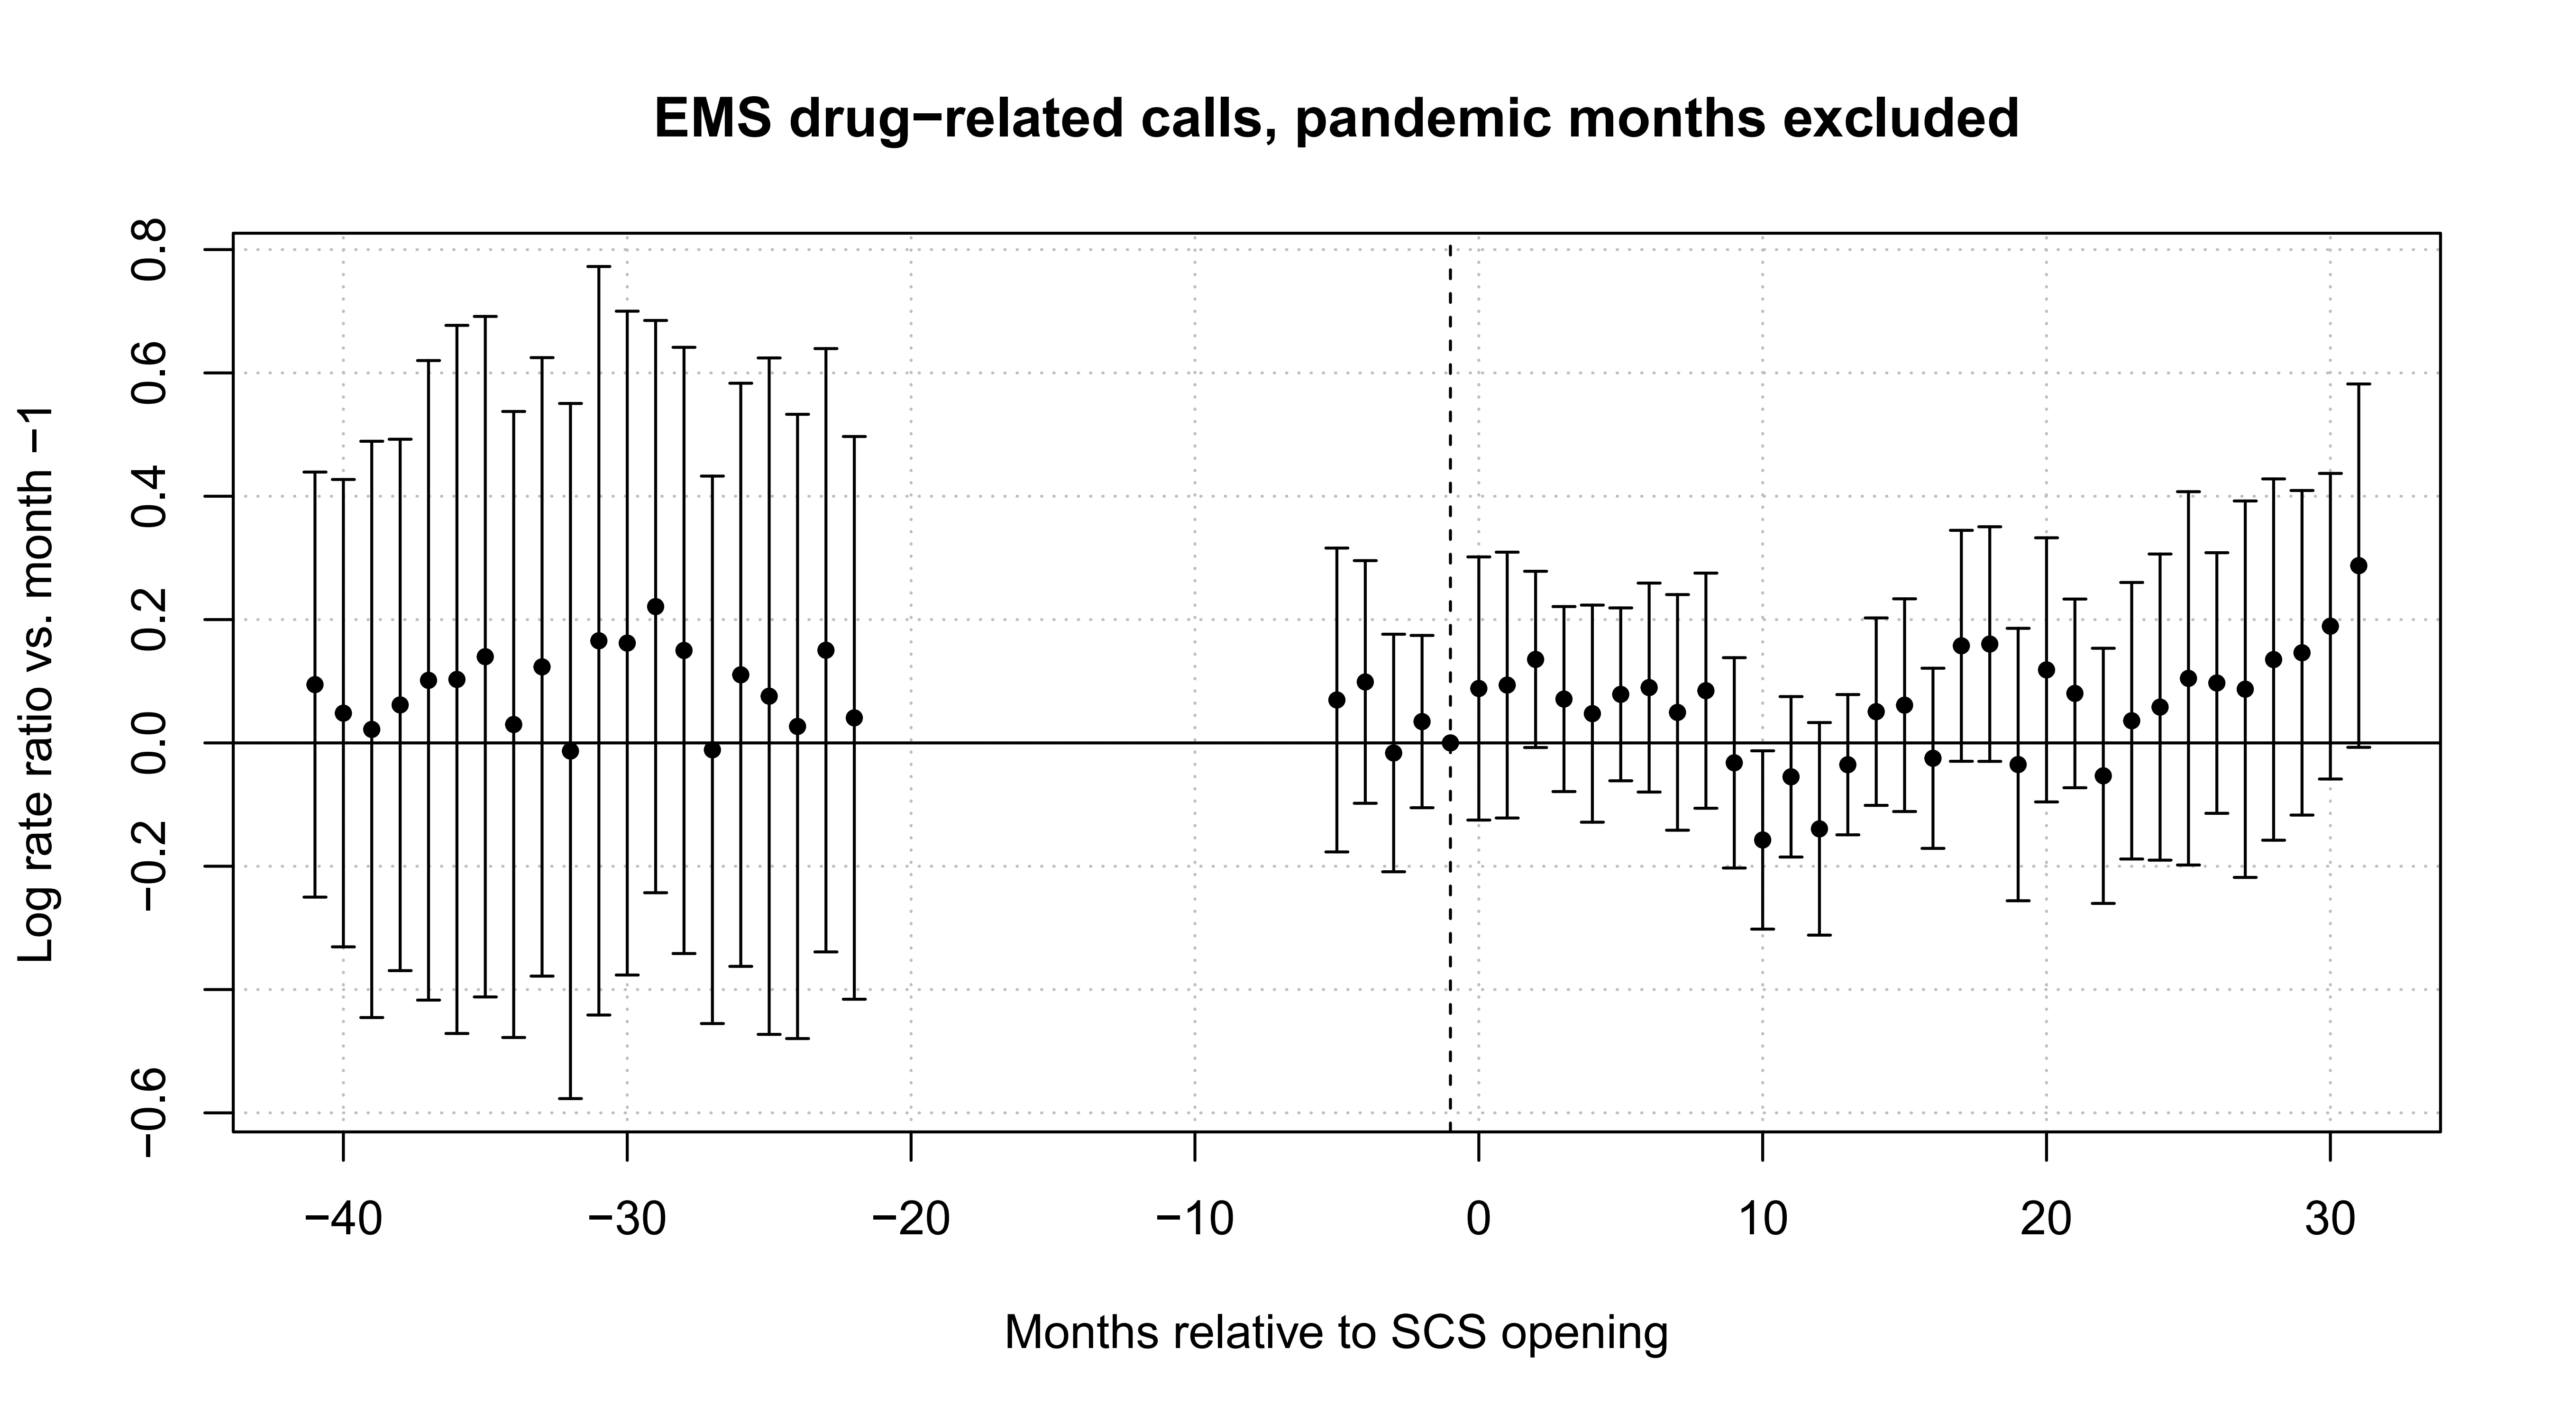
The event-study estimates test whether near and far areas were following similar paths before the sites opened. For EMS calls, a joint test of all the pre-intervention terms rejected that assumption (F = 3.32, p < .001). Breaking the pre-intervention period into windows showed the problem was not limited to the pandemic. The months before March 2020 rejected the assumption (F = 3.17, p < .001), as did the pandemic months themselves (F = 5.86, p < .001), but the four months immediately before the opening did not (F = 0.87, p = .490). Applying the small-sample correction, those four months remained consistent with parallel trends (F = 1.25, p = .446). The longer windows could not be corrected this way, because the correction requires the number of terms being tested to be smaller than the number of treated areas, which in our case is 10. For syringe complaints, the overall pre-intervention period test rejected the assumption (F = 3.06, p = .009), as did the November 2019 to February 2020 window (F = 4.21, p = .006). The four months immediately before opening rejected it under the standard test (F = 3.35, p = .019) but not under the small-sample correction (F = 0.71, p = .636). Parallel trends therefore holds only in the months immediately before implementation, and the estimates are reported as associations rather than as causal effects.
| Pre-intervention window | Outcome | Cluster-robust F (p) | CR2-corrected F (p) |
| Full pre-period | EMS calls | 3.32 (< .001) | Not computable |
| Before March 2020 | EMS calls | 3.17 (< .001) | Not computable |
| Pandemic window | EMS calls | 5.86 (< .001) | Not computable |
| Four months pre-opening | EMS calls | 0.87 (.490) | 1.25 (.446) |
| Full pre-period | 311 syringes | 3.06 (.009) | Not computable |
| Nov 2019–Feb 2020 | 311 syringes | 4.21 (.006) | Not computable |
| Four months pre-opening | 311 syringes | 3.35 (.019) | 0.71 (.636) |
Note. Tests are joint Wald tests of the null that all pre-intervention interaction terms equal zero. CR2-corrected tests use the Hotelling T-squared approximation and cannot be computed when the number of coefficients tested exceeds the number of treated units.
The sensitivity analysis asked how large a post-intervention violation of parallel trends would be needed to overturn the results. The confidence set included zero at every violation size tested, starting at one quarter of the largest violation already visible before the intervention. No breakdown value could be identified, which reflects the fact that the estimates already include zero rather than that they are robust.
Four checks tested whether the results depend on particular parameter choices. Fake opening dates placed at four points before the real opening date produced estimates between -0.0347 and 0.0147, none close to significance (p = .642, .931, .873, and .688), so no apparent effect shows up in periods when nothing had happened. Estimated separately, the East Harlem site was associated with an 8.4% reduction in EMS calls (p = .580) and a 46.0% reduction in syringe complaints (p = .250), while the Washington Heights site was associated with an 11.6% increase in EMS calls (p = .143) and a 26.1% reduction in syringe complaints (p = .107). The combined EMS estimate therefore conceals opposite patterns at the two sites. Across the four definitions of the comparison group, the EMS estimate ranged from a 1.8% to a 6.4% reduction (p = .582 to .886) and the syringe estimate from a 36.5% to a 37.7% reduction (p = .111 to .132). The syringe estimate was notably stable across all four definitions, including the one based on a 1,000 meter radius rather than ZIP code boundaries.
| Distance band | EMS calls, % change [95% CI] | 311 syringes, % change [95% CI] |
| 0–0.5 miles | 19.6 [9.1, 31.0] | −37.8 [−46.9, −27.1] |
| 0.5–1 mile | −7.2 [−30.4, 23.5] | −45.5 [−80.1, 49.3] |
| 1–2 miles | 10.0 [−1.5, 22.9] | −16.9 [−48.4, 33.8] |
| 2–3 miles | −2.4 [−17.3, 15.3] | −20.7 [−50.5, 27.1] |
Note. Estimates are relative to ZIP codes more than three miles from a site, from Poisson models with ZIP code and calendar-month fixed effects and a log-population offset. Standard errors are clustered at the ZIP code level.
The distance-banded models produced the largest coefficients in the analysis, though not ones that hold up under testing suited to this design. Compared with ZIP codes more than three miles from a site, EMS calls in the closest band rose by 19.6% under the Poisson model and 18.1% under the negative binomial, while syringe complaints in that same band fell by 37.8% and 46.4%. Using clustered standard errors, both contrasts are significant at p < .001.
Two features of the design weaken these results considerably. The closest band contains only one ZIP code, 10033, which hosts the Washington Heights facility. The East Harlem ZIP code falls into a more distant band because its center is more than half a mile from the site. The comparison is therefore between a single ZIP code and the rest of Manhattan, not between the two host neighborhoods and their surroundings. Consistent with that, when we reassigned the closest band at random to 1,000 placebo pairs of ZIP codes more than two miles from a real site, the observed EMS coefficient fell at p = .217 and the syringe coefficient at p = .230. Neither is distinguishable from what appears when an arbitrary ZIP code is treated as the closest one, and the standard significance levels substantially overstate the evidence. These results are therefore reported as descriptive contrasts, not as evidence of a local effect.
Applying the same randomization approach to the main estimates, the observed EMS result fell well inside the placebo distribution (p = .840). The syringe result fell near its edge (p = .052). For syringe complaints the spread of the placebo estimates (0.166) was smaller than the clustered standard error (0.347), meaning the standard error is too cautious for this outcome. The syringe association is the one result in the analysis that comes close to conventional significance under testing suited to the design.
Eighteen of the 46 ZIP codes lie within 1,000 meters of a syringe service program, thirteen of them in the comparison group. When a term for the presence of such a program was added, that term was itself associated with a 17.2% reduction in EMS calls (95% CI: -27.0 to -6.2, p = .003) and a non-significant 15.7% reduction in syringe complaints (p = .457). The SCS proximity estimate for EMS calls shrank to -1.0% (p = .925), while the syringe estimate strengthened slightly to -39.0% (p = .135).
Removing every ZIP code containing a syringe service program from the comparison group moved both estimates further from zero. EMS calls became a 12.9% reduction (95% CI: -32.2 to 11.9, p = .280) and syringe complaints a 40.2% reduction (95% CI: -67.1 to 8.5, p = .091), against 2.5% and 34.9% in the main analysis. This is what we would expect if the comparison areas were partly treated themselves. Other harm-reduction services operate in many of them, and the EMS result shows those areas saw declines of their own, so the main estimates understate the gap between SCS neighborhoods and areas with no harm-reduction services at all. This version also removes thirteen of the 36 comparison ZIP codes, so the estimates are less precise and are best read as showing the direction of the bias rather than as a preferred result.
We then examined whether neighborhood characteristics predict which ZIP codes are near a site. In the model including all four variables at once, none reached significance: median age (b = -0.364, p = .313), non-white percentage (b = 20.571, p = .102), poverty rate (b = -35.176, p = .056), and privately insured percentage (b = -21.283, p = .111). These coefficients are on the logit scale and expressed per unit change in the underlying proportion, so a coefficient of 20.571 describes the difference between a population that is entirely white and one that is entirely non-white. Converted to a ten-percentage-point increase, the odds ratios are 7.82 for non-white percentage, 0.12 for privately insured percentage, and 0.03 for poverty rate, and 0.70 per additional year of median age.
The imprecision here is not caused by overlap between the variables. Variance inflation factors were 2.76 for non-white percentage, 3.46 for privately insured percentage, 3.72 for poverty rate, and 1.69 for median age, all comfortably below the usual thresholds. Yet the model fits the data well. The McFadden pseudo-R-squared is 0.755, residual deviance is 11.70 on 40 degrees of freedom against a null deviance of 47.67, and the test of the model as a whole is highly significant (p < .001) even though no single variable is significant. The Hosmer-Lemeshow test shows no lack of fit (χ² = 3.99, p = .678). This pattern indicates near complete separation, meaning the four variables together distinguish near ZIP codes from far ZIP codes almost perfectly, which makes the individual estimates unstable.
Each ten-percentage-point increase in non-white population was associated with higher odds of being near a site (OR = 4.90, 95% CI: 1.64 to 14.66, Bonferroni-adjusted p = .018), as was each ten-percentage-point increase in poverty rate (OR = 5.78, 95% CI: 1.93 to 17.35, Bonferroni-adjusted p = .007), while each ten-percentage-point increase in private insurance coverage was associated with lower odds (OR = 0.16, 95% CI: 0.05 to 0.49, Bonferroni-adjusted p = .005). Median age was unrelated to proximity (OR = 0.98, Bonferroni-adjusted p = 1.00).
| OR [95% CI] | Bonferroni-adjusted p | |
| Non-white Percentage | 4.90 [1.64, 14.66] | .018 |
| Privately Insured | 0.16 [0.05, 0.49] | .005 |
| Poverty Rate | 5.78 [1,93, 17.35] | .007 |
| Median Age | 0.98 [0.83, 1.16] | 1.00 |
Note. OR = odds ratio from a logistic regression. Odds ratios for non-white percentage, poverty rate, and private insurance coverage are per ten-percentage-point increase; the odds ratio for median age is per additional year.
Discussion
In the Global Moran’s I results, both EMS calls and 311 syringe complaints showed significant clustering in pre and post-intervention periods. Therefore, while the spatial distribution of these proxies seemed to be significantly concentrated, they did not appear to have shifted in any meaningful way before and after the implementation of SCS. With the Local Moran’s I analysis, both proxies were clustered most strongly in Midtown Manhattan.
Given the results of the socioeconomic factors analysis, the facilities appeared to have been built in neighborhoods bearing a disproportionate share of the conditions associated with problematic substance use25 and have thus been placed there by need. As stated previously, three of the socioeconomic factors were closely related with healthcare disparities. Coupled with the results from the Moran’s I analysis, there were other factors that should be in consideration when deciding the next possible locations for additional sites. The acute drug-related proxy events were concentrated in Midtown where transit and commercial activities are common, but residences are not. Since the proxies were used in the Moran’s I analysis as a per resident rate basis, the number of residents in a particular ZIP code could have a large impact in the resulting proxy incidence rates.
Three out of the four ZIP codes recognized by the analysis as high rate (10017, 10018, and 10036) have lower populations than East Harlem and Washington Heights. Therefore, the high rates of EMS calls and 311 syringe complaints in these Midtown areas may be susceptible to claims that the rates are artificially inflated due to their lower populations in comparison to the SCS ZIP codes. However, after scaling the rates to match East Harlem’s population (the less populated of the two site locations), 10016 (Murray Hill), 10018 (Garment District), and 10036 (Times Square) still stood out as areas with high rates of EMS calls and 311 syringe complaints. For EMS calls, the rates after scaling to East Harlem’s population were all above two times the median Manhattan EMS calls rate at 2.1 times the median for Murray Hill, 2.6 times the median for Garment District, and 2.9 times the median for Times Square. For 311 syringe complaints, the rates were all above four times the median Manhattan rate at 4.8 times the median for Murray Hill, 5.2 times the median for Garment District, and 5.8 times the median for Times Square. 10017 was close to the median after rescaling for both proxies at 1.1 times the median for EMS calls and 1.6 times the median for 311 syringe complaints. Thus, even though these three ZIP codes are not residential like East Harlem and Washington Heights and are more commercial, it does seem worthwhile for OnPoint to consider placing a future SCS in one of these neighborhoods.
In the decomposition of the pooled estimate performed after the null DiD analysis, separating the sites resulted in opposite patterns for EMS calls. Due to the null result, the pooled estimate could not distinguish between no difference at all or if the two sites were offsetting each other. Since East Harlem contained 3.2 times the Manhattan median for EMS calls compared to Washington Heights’ 1.1 times, this divergence between the two sites may point towards a fundamental gap between them and their baseline characteristics, leaving room for us to believe that they have more heterogeneous burden profiles.
The decomposition also aligned well with the outcomes of the distance band analysis. The closest distance band only contained Washington Heights and not any of its neighboring ZIP codes. Thus, the difference between the estimates for the site-specific decomposition and the closest distance band could be interpreted as the effects on the surrounding neighborhoods to Washington Heights. When comparing the two results, both EMS calls (19.6% to 11.6%) and syringe complaints (-37.8% to -26.1%) drew closer to zero once surrounding areas were added. This argues against the idea that the sites act as a spatial sink that draws proxy rates from their neighbors since the EMS calls increased while the syringe complaints decreased closer to the sites. One possible explanation might be that the SCS concentrate overdose events around its immediate vicinity while removing injection equipment from its surroundings. The increase in overdose events at the site may be due to these overdose events being witnessed and reported by staff and other visitors in greater numbers instead of being unobserved.
When changing the underlying assumptions of the DiD analysis, the 311 syringe complaints panel showed consistent estimates across changing the model family from Poisson to negative binomial (-34.9% to -31.5%), four different comparison group definitions (-36.5% to -37.7%), separate site estimations (-46.0%/-26.1%), controlling for syringe service programs (-39.0%), and removing the ZIP codes with syringe service programs (-40.2%). While the EMS calls results did change signs in changing the model family (-2.5% to +4.2%) and separate site estimations (-8.4%/+11.6%), the difference in signs points to no underlying signals within the data. The syringe results on the other hand were consistent with a real effect and needs additional study with greater statistical power to confirm whether the effects truly exist. The difference in EMS and syringe randomization inference metrics supports this idea, as the syringe complaint result (p = .052) was much closer to significance compared to EMS calls (p = .840).
While adding the presence of syringe service programs did not produce a significant result for 311 syringe complaints, for EMS calls, it produced a coefficient of -17.2% (95% CI: -27.0, -6.2, p = .003). The disagreement between the proxies is confusing, but one possible explanation could be that since these programs distribute and collect injection equipment26, the net effect on street littering may be ambiguous, but naloxone and overdose education may reduce EMS calls in the area.
The main limitation of this study stems from the fact that our proxy data only relies upon two facilities that opened on the same date. The current design and data cannot produce useful estimates of neighborhood effects (regardless of how many events are observed in these datasets) because precision depends on the number of treated places rather than the number of events. Not only that, the failed parallel trends outside of the four-month window immediately before the intervention indicates that the analysis cannot provide precise causal estimates of SCS effects, and the findings should be interpreted as associations instead. Future research will require a combination of more sites, staggered implementation dates, or synthetic controls that do not rely on parallel pre-intervention trends.
Additionally, EMS calls and 311 syringe complaints should be interpreted as complementary rather than interchangeable indicators of public drug use. In the DiD analysis, the EMS estimates were inconsistent across different parameter specifications and indistinguishable from the null. The syringe complaint estimates were consistently negative across various sensitivity analyses but still remained statistically inconclusive under randomization inference. Studies relying on only one of these outcomes may reach different conclusions depending on the type of event selected by the researchers.
Despite the data’s limitations, the spatial and socioeconomic analyses nevertheless identify important considerations for SCS siting. The existing facilities are located in ZIP codes with higher poverty, larger non-white populations, and lower private insurance coverage compared to other study-area ZIP codes. These factors were used to characterize socioeconomically disadvantaged neighborhoods but do not directly measure the need for drug intervention. The Local Moran’s I analysis highlighted ZIP codes in Midtown as having high per-resident rates of EMS calls and syringe complaints. However, these rates should not be interpreted as evidence that underlying drug use is more prevalent there because commercial areas have large daytime populations that are not a part of the residential population. Together, these findings raise a broader question about how present and future siting decisions should weigh certain socioeconomic factors against the concentration of drug-related events.
Acknowledgments
The authors thank Hyunsoo (Brian) Song, Johns Hopkins University, for his mentorship on the statistical analysis.
References
- J. R. Friedman, J. J. Palamar, D. Ciccarone, T. L. Gaines, A. Borquez, C. L. Shover, S. A. Strathdee. Charting the decline of the fourth wave: US overdose deaths by race, ethnicity and substance involvement. Addiction. Vol. 121, pg. 2552–2558 (2026). [↩]
- L. Saxe, C. Kadushin, A. Beveridge, D. Livert, E. Tighe, D. Rindskopf, J. Ford, A. Brodsky. The visibility of illicit drugs: Implications for community-based drug control strategies. American Journal of Public Health. Vol. 91, pg. 1987–1994 (2001). [↩]
- M. Sigal, B. J. Ross, A. O. Behnke, S. W. Plunkett. Neighborhood, peer, and parental influences on minor and major substance use of Latino and Black adolescents. Children. Vol. 8, pg. 267 (2021). [↩]
- A. Sondhi, A. Leidi, E. Gilbert. A small area estimation method for investigating the relationship between public perception of drug problems with neighborhood prognostics: Trends in London between 2012 and 2019. International Journal of Environmental Research and Public Health. Vol. 18, pg. 9016 (2021). [↩]
- R. E. Giglio, S. Mantha, A. Harocopos, N. Saha, J. Reilly, C. Cipriano, M. Kennelly, L. Landau, M. McRae, D. A. Chokshi. The nation’s first publicly recognized overdose prevention centers: Lessons learned in New York City. Journal of Urban Health. Vol. 100, pg. 245–254 (2023). [↩] [↩] [↩]
- B. Pieper, T. N. Templin, R. S. Kirsner, T. J. Birk. Injection-related venous disease and walking mobility. Journal of Addictive Diseases. Vol. 29, pg. 481–492 (2010). [↩]
- C. E. Wolfe, D. M. Wood, A. Dines, B. P. Whatley, C. Yates, F. Heyerdahl, K. E. Hovda, I. Giraudon, P. I. Dargan, Euro-DEN Research Group. Seizures as a complication of recreational drug use: Analysis of the Euro-DEN Plus data-set. Neurotoxicology. Vol. 73, pg. 183–187 (2019). [↩]
- T. W. Levengood, G. H. Yoon, M. J. Davoust, S. N. Ogden, B. D. L. Marshall, S. R. Cahill, A. R. Bazzi. Supervised injection facilities as harm reduction: A systematic review. American Journal of Preventive Medicine. Vol. 61, pg. 738–749 (2021). [↩] [↩]
- B. D. Marshall, M. J. Milloy, E. Wood, J. S. Montaner, T. Kerr. Reduction in overdose mortality after the opening of North America’s first medically supervised safer injecting facility: A retrospective population-based study. The Lancet. Vol. 377, pg. 1429–1437 (2011). [↩]
- D. T. Zhu, S. S. Bajaj, T. Kerr. Supervised safe consumption sites — lessons and opportunities for North America. Lancet Regional Health – Americas. Vol. 39, pg. 100889 (2024). [↩]
- A. Harocopos, B. E. Gibson, N. Saha, M. T. McRae, K. See, S. Rivera, D. A. Chokshi. First 2 months of operation at first publicly recognized overdose prevention centers in US. JAMA Network Open. Vol. 5, pg. e2222149 (2022). [↩]
- C. Potier, V. Laprévote, F. Dubois-Arber, O. Cottencin, B. Rolland. Supervised injection services: What has been demonstrated? A systematic literature review. Drug and Alcohol Dependence. Vol. 145, pg. 48–68 (2014). [↩]
- S. J. Dow-Fleisner, A. Lomness, L. Woolgar. Impact of safe consumption facilities on individual and community outcomes: A scoping review of the past decade of research. Emerging Trends in Drugs, Addictions, and Health. Vol. 2, pg. 100046 (2022). [↩] [↩]
- J. P. Caulkins, B. Pardo, B. Kilmer. Supervised consumption sites: A nuanced assessment of the causal evidence. Addiction. Vol. 114, pg. 2109–2115 (2019). [↩]
- D. Weisburd, L. A. Wyckoff, J. Ready, J. E. Eck, J. C. Hinkle, F. Gajewski. Does crime just move around the corner? A controlled study of spatial displacement and diffusion of crime control benefits. Criminology. Vol. 44, pg. 549–592 (2006). [↩]
- M. MacDonald, B. Pauly, G. Wong, K. Schick-Makaroff, T. van Roode, H. W. Strosher, A. Kothari, R. Valaitis, H. Manson, W. O’Briain, S. Carroll, V. Lee, S. Tong, K. D. Smith, M. Ward. Supporting successful implementation of public health interventions: Protocol for a realist synthesis. Systematic Reviews. Vol. 5, pg. 54 (2016). [↩]
- T. R. Frieden. Six components necessary for effective public health program implementation. American Journal of Public Health. Vol. 104, pg. 17–22 (2014). [↩]
- S. Slavova, P. Rock, H. M. Bush, D. Quesinberry, S. L. Walsh. Signal of increased opioid overdose during COVID-19 from emergency medical services data. Drug Alcohol Dependence. Vol 214, pg. 108176 (2020). [↩]
- P. Braveman, L. Gottlieb. The social determinants of health: It’s time to consider the causes of the causes. Public Health Reports. Vol. 129, pg. 19–31 (2014). [↩]
- M. Kariisa, N. L. Davis, S. Kumar, P. Seth, C. L. Mattson, F. Chowdhury, C. M. Jones. Vital signs: Drug overdose deaths, by selected sociodemographic and social determinants of health characteristics — 25 states and the District of Columbia, 2019–2020. MMWR. Morbidity and Mortality Weekly Report. Vol. 71, pg. 940–947 (2022). [↩]
- J. R. Friedman, M. J. N. Tiako, H. Hansen. Understanding and addressing widening racial inequalities in drug overdose. The American Journal of Psychiatry. Vol. 181, pg. 381–390 (2024). [↩]
- A. H. Hébert, A. L. Hill. Impact of opioid overdoses on US life expectancy and years of life lost, by demographic group and stimulant co-involvement: A mortality data analysis from 2019 to 2022. Lancet Regional Health – Americas. Vol. 36, pg. 100813 (2024). [↩]
- G. E. Wilt, B. E. Lewis, E. E. Adams. A spatial exploration of changes in drug overdose mortality in the United States, 2000–2016. Preventing Chronic Disease. Vol. 16, pg. E33 (2019). [↩]
- A. Rambachan, J. Roth. A more credible approach to parallel trends. The Review of Economic Studies. Vol. 90, pg. 2555–2591 (2023). [↩]
- K. J. Karriker-Jaffe. Neighborhood socioeconomic status and substance use by U.S. adults. Drug and Alcohol Dependence. Vol. 133, pg. 212–221 (2013). [↩]
- K. M. Mackey, E. H. Beech, B. E. Williams, J. K. Anderson, S. Young, N. J. Parr. Effectiveness of syringe services programs: A systematic review. Department of Veterans Affairs Evidence Synthesis Program, VA ESP Project #09-199 (2023). [↩]