
Abstract
Large language models (LLMs) are increasingly used for automated essay scoring (AES), but it is not clear whether embedding rubric criteria directly into the prompt improves the alignment between the LLM grading and the human grading, especially when it comes to systematic bias and feedback quality. This study investigates whether rubric-guided prompting improves alignment, how it changes model error behaviour, and whether calibration constraints can further improve alignment. We tested three prompt variants (baseline, rubric-guided, and calibrated) on 5,099 discourse segments from the PERSUADE 2.0 corpus using two LLMs: DeepSeek-R1 and Qwen2.5-7B, and because about 79% of segments are labelled Adequate we report balanced accuracy and macro-F1 alongside accuracy. A separate GPT-4o-mini judge evaluated feedback quality across four dimensions. Contrary to the initial hypothesis, rubric-guided prompting did not show consistent improvement in accuracy: it reduced DeepSeek-R1’s accuracy from 37.6% to 29.8%, while introducing inflation bias. Adding calibration raised accuracy for both models, though both stayed below the 79% majority-class baseline on accuracy while beating it on balanced accuracy and macro-F1. Under calibration, the smaller Qwen2.5-7B reached higher accuracy than the larger DeepSeek-R1 and a near-neutral scoring bias (+0.050 vs DeepSeek’s -0.292). Judge-evaluated feedback preferences were driven mostly by label accuracy and feedback length. Rubric criteria alone are not sufficient for accurate LLM-based essay scoring; the model also requires explicit calibration towards the expected label distribution. Within the models tested, alignment between a model’s scoring tendencies and the task’s label distribution mattered more than size.
Keywords: Automated Essay Scoring, LLM Evaluation, Rubric-guided Prompting, Prompt Calibration, PERSUADE 2.0, Feedback Quality
Introduction
Context and Motivation
In complex, open-ended tasks like writing essays, teachers usually use a rubric criteria: a list outlining specific elements that define what makes an essay strong or weak at different levels. This helps ensure consistency and fairness in human grading across different pieces of writing1.
With the increasing capabilities of LLMs, researchers and educators have started wondering whether LLMs can be used to automatically yet accurately score and generate feedback on student written essays. Accurate LLM grading would increase teacher efficiency, providing valuable feedback to students in a shorter time-span, and in turn giving them more time to reflect on and improve their work based on the feedback received.
Recent research by Abujadallah et al2. compared five open-source LLMs with different prompting strategies on an essay scoring task and found that rubric-aligned prompting consistently outperformed simpler strategies in agreement with human scores. However, most existing research focuses on overall agreement metrics and does not analyse how rubric prompting affects different discourse types: if it introduces systematic scoring bias (such as score inflation or deflation), or whether better scoring alignment actually translates into higher-quality feedback, judged independently of the score.
Recent studies such as the one conducted by Meyer et al3. illustrates the importance of automated essay scoring. The study showed that LLM-generated feedback improved secondary students’ revision quality and motivation in a controlled experiment with 459 students.
Our study investigates whether rubric-guided prompting improves the alignment between the LLM and the human score, how it changes model error behaviour, and whether the quality of the written feedback generated by the LLM improves as evaluated by another independent LLM judge. We frame LLM essay scoring as a distribution alignment problem under class imbalance, rather than purely a reasoning problem.
Background: Automated Essay Scoring
Automated essay scoring (AES) has evolved drastically over the past few decades. Early systems like e-rater4 used handcrafted linguistic features and statistical models to predict essay scores. Then came neural networks, which showed that models could learn scoring patterns automatically from data without manual engineering5; reviews of the field trace this shift from hand-built features to learned models 6. More recently, large language models have been applied directly to scoring: Mizumoto and Eguchi7 used a GPT model to score thousands of second-language essays and found ratings that broadly followed human benchmark levels, and fine-tuning a model on graded examples can raise agreement further 8. These gains are not limited to English; similar results have been reported for essays written in other languages 9. Unlike earlier systems, LLMs can also write feedback alongside a score, not just assign a label.
Prompt design choices like how to best prompt these models, what information to include in the prompts, and how to structure a prompt can have a large impact on the LLM output quality, and the best method can differ across different models and tasks. Tang et al10. found that criteria-referenced prompting more than doubled GPT-4’s scoring accuracy compared to basic prompting, and that lower temperatures produced scores more consistent with human evaluations.
Background: Prompt Design and Calibration
The way in which a prompt is designed and structured largely influences the quality of the LLM output. In the context of essay grading, rubric-guided prompting refers to the process of embedding the rubric criteria into the prompt, so that the model can refer to these set criteria while grading the essays. This is different from a simple prompt that just asks the model to classify effectiveness based on the name of the levels without explaining the individual expectations of the levels. Our prompts also required the models to generate written feedback explaining the reason behind their rating. This process is similar to that of chain-of-thought prompting: an idea that suggests asking a model to show its reasoning can improve the output quality11. Prompt choices specific to scoring have a measurable effect. Kim12 compared minimal versus detailed rubrics and whether to ask the model for a rationale when scoring essays, and found these choices changed how closely the model agreed with human raters; that study also concluded such a system is best used to support a human grader rather than replace one. Stahl et al13. looked at scoring and feedback together and found that prompt design shapes both the score and the written feedback.
One issue is of calibration. Even though the model understands what each rubric level means, it may not apply labels at an accurate frequency. For example, a model may overuse the “Effective” label even when the rubric defines what “Effective” means. Research conducted on neutral networks showcases that even well-trained models can be poorly calibrated, as their outputs do not reflect the true distribution of labels in the data14. The same idea appears in the prompting literature: Zhao et al15. showed that language models carry built-in label biases and that a calibration step correcting these biases sharply improves accuracy. We extended this idea to prompt design, evaluating whether explicitly telling the model about the expected label distribution would improve scoring accuracy. We use “calibration” to mean this kind of prompt-based distribution prior, telling the model how often each label tends to occur, not the separate idea of adjusting a model’s predicted probabilities to match its accuracy 14,16, since our models return a label, not a probability.
Background: Using LLMs to Judge Feedback Quality
Recently, researchers have started using a method called “LLM-as-Judge”17, where one large language model evaluates the output generated by another model. Employing this technique allowed us to conduct evaluation of feedback quality on different dimensions such as rubric alignment, specificity, constructiveness, and relevance. We used this to assess whether increased score alignment between the model and the human translates to a higher quality of written feedback generated by the model. This idea has been used to grade open-ended writing: a model can rate generated text and agree reasonably well with human raters18. But model judges have known biases. They can be swayed by the order in which two answers appear19, they tend to prefer longer answers even when the extra length adds little 20, and they can favor text that resembles their own writing 21. Because of these biases, we check our judge directly for order and length effects rather than assuming it is neutral.
However, one concern with this approach is that the judge-LLM may reward feedback that matches the correct label instead of feedback that is well-written or academically useful. This would make it hard to separate genuinely good feedback quality from label accuracy, a question we investigate directly.
The PERSUADE 2.0 Corpus
For our study, we used the PERSUADE 2.0 Corpus22 which was built directly upon the PERSUADE 1.0 Corpus23. The corpus contains over 25,000 argumentative essays written by 6th-12th grade students in the United States. The essays included responses to 15 different prompts. The original corpus introduced the discourse element annotations and was featured in two Kaggle Feedback Prize competitions24,25. The corpus includes two different types of writing tasks: Independent and Text-Dependent. In independent tasks, students respond to a prompt without any source-text, using their own ideas and knowledge. In text-dependent tasks, students must base their writing and arguments on one or more source-text(s) provided to them and must use evidence from these texts to support their writing.
Each essay is segmented into discourse elements, the building blocks of an argument, classified into one of seven types: Lead (the opening that grabs attention and points toward the writer’s position), Position (the writer’s main stance), Claim (a specific point supporting the position), Counterclaim (an opposing viewpoint), Rebuttal (a response that refutes the counterclaim), Evidence (facts, examples, or reasoning backing up a claim), and Conclusion Statement (a summary that restates the claims). Each element is also rated on three levels using a standardised rubric (see the Supplementary Material and the public repository for full definitions): an Effective rating means the element successfully fulfils its rhetorical function, Adequate means it sufficiently fulfils its function but may have weaknesses, and Ineffective means it does not fulfil its function. In the corpus, approximately 4% of elements are rated Ineffective, 79% Adequate, and 17% Effective.
The rigorous annotation process used in creating the PERSUADE 2.0 dataset makes the human labels a strong reference for our study, though, as the agreement numbers below show, not a perfect gold standard. An external consulting firm hired and trained all evaluators on the standardised rubric. Two evaluators independently scored each element using a double-blind process, and in the case of any disagreements, a third evaluator determined the final decision. Crossley et al22. report exact inter-rater agreement of 71.8% overall (ranging from 67.6% for Rebuttal to 80.7% for Position) and weighted Cohen’s Kappa of 0.316. While the Kappa values are modest, partly because the heavily skewed label distribution limits Kappa’s range, the 100% adjudication process means that every element in the final corpus has been reviewed by at least two trained raters and resolved by a third when needed. Because two trained raters agree only about 72% of the time, agreement with the human labels has a natural ceiling well below 100%: a model can match one rater and still disagree with the resolved label. So part of the gap between a model and the human label reflects genuine disagreement on a subjective task, not only model error, and we read the model-human accuracy numbers against this ceiling rather than against a perfect 100%.
Since most elements are rated as “Adequate” in the dataset, scoring the essays is a challenging task. A model that blindly rates all elements as “Adequate” would achieve roughly 79% accuracy. Hence, meaningful evaluation requires special metrics that go beyond simple accuracy (a glossary of all metrics used is in the Supplementary Material and the public repository).
Research Questions
This study investigates five research questions. RQ1 asks whether rubric-guided prompting improves alignment between LLM predictions and human-assigned effectiveness labels. RQ2 asks how rubric prompting changes systematic error patterns such as inflation, deflation, and extreme misclassification. RQ3 asks whether adding distributional calibration constraints to rubric prompts further improves alignment and reduces bias; we added this question only after observing that rubric-only prompting introduced new biases rather than reducing them, so we treat it as exploratory rather than a pre-planned test. RQ4 asks which discourse types benefit most from rubric and calibration guidance. RQ5 asks whether improved scoring alignment translates to higher-quality written feedback, as evaluated by an LLM judge.
Contributions
This study makes five contributions. We first compared baseline and rubric-guided prompting, the comparison we planned; after seeing that rubric prompting added new bias rather than reducing it, we added a third, exploratory condition (calibrated) and treat its results as a finding to be confirmed, not a pre-planned test. We go beyond aggregate agreement metrics to analyse structured error patterns: prediction bias, inflation and deflation rates, and extreme misclassification. We show that rubric information alone can worsen performance, and that calibration constraints are the critical addition. We separate size from architecture by comparing two sizes of one model family, and find that more parameters did not improve aligned scoring. And we show that an automated feedback judge’s preferences are mostly explained by label accuracy and feedback length, so we do not treat the judge as a measure of genuine feedback quality.
Methods
Dataset and Sampling
We used a stratified sample of 5099 discourse elements from 500 essays drawn from the original PERSUADE 2.0 Corpus. The sample included 250 essays of each text type: Dependent and Independent. The rating labels (Effective, Adequate or Ineffective) were preserved within each task type to match the original distribution of the labels. We ensured that the sample data matched the original data with differences in distribution being less than 1% for both the labels and the task proportions. The sample covered all 7 discourse elements (Lead, Position, Claim, Counterclaim, Rebuttal, Evidence, and Concluding Statement) and all 3 Effectiveness labels (Ineffective at ~4%, Adequate at ~79%, and Effective at ~17%).
Prompting Conditions
Originally, this study was planned to include only two prompt conditions: Baseline and Rubric-guided. After analysing the results, we designed a third condition (Calibrated) to address the biases we observed.
Baseline: The model receives minimal instructions. It is asked to assign a label to the discourse segment without the rubric criteria provided.
Rubric-guided: The full rubric-criteria is provided to the model, detailing the definitions and expectations for Effective, Adequate, and Ineffective. These are embedded directly in the prompt, organised by discourse type. The model can refer to these definitions while providing a label score and written feedback.
Calibrated: This condition was added after we observed that rubric-only prompting introduces new biases instead of reducing them. It includes the same rubric definitions as the rubric-guided prompt. In addition, it includes an explicit calibration guidance: the model is told that “most elements are rated Adequate,” that is should “prefer Adequate when in doubt,” and that “Effective” and “Ineffective” should be reserved for clearly strong or clearly weak cases. We also added specific guidance for Evidence, Rebuttal, and Counterclaim, since those were the types where both models made the most mistakes. The full prompt text of all three conditions is in the Supplementary Material and the public repository.
Models
For this study, we use two models. DeepSeek-R1-0528 (hereafter DeepSeek-R1) is a large reasoning model trained with reinforcement learning to work through a problem in steps before it returns its final answer 26; it has about 685 billion parameters. Qwen2.5-7B is a smaller instruction-tuned model with about 7 billion parameters from the Qwen2.5 family 27 that follows directions in a typical chat-style setup and is optimised for fast inference; the size comparison later uses Qwen2.5-72B from the same family. Both models were run with structured (JSON) output and at temperature 0. We chose temperature 0 on purpose: grading should be stable and repeatable rather than creative, so a deterministic setting is the right choice for scoring, and it also makes the results easier to reproduce; decoding settings strongly affect a model’s output 28. The exact checkpoints were DeepSeek-R1-0528, Qwen2.5-7B-Instruct, Qwen2.5-72B-Instruct (used for the size comparison), and, for the judge, GPT-4o-mini-2024-07-18. Both models generate two outputs for each discourse segment: a label (Ineffective, Adequate, or Effective) and written qualitative feedback explaining the rating.
Judge LLM for Feedback Evaluation
We used GPT-4o-mini as our judge model to evaluate feedback quality generated by the other two models. The judge model rated each piece of feedback on a 1-5 scale across four dimensions: rubric alignment, specificity, constructiveness and relevance. From these, we computed a composite “actionability” score averaging constructiveness and specificity, to isolate feedback usefulness from label accuracy (see the Evaluation Metrics section).
We ran two comparison scenarios. In the first scenario, we compared baseline vs. calibrated feedback generated by DeepSeek-R1 to see whether calibrated produced better feedback quality than the baseline prompt. In the second scenario, we compared the calibrated feedback produced by DeepSeek-R1 vs. Qwen2.5-7B to see whether one model generated better feedback than the other one. In both cases, the judge LLM evaluated the feedback responses side by side without knowing which prompt or model generated each one.
For each segment the judge saw the full essay, the discourse type and text, the human effectiveness score, and two (score, feedback) pairs labelled only “Reference” and “Evaluated,” with the model identity hidden. It rated each piece of feedback on the four dimensions from 1 to 5 and then chose which was better (reference, evaluated, or tie). To check that this preference was not driven by surface features, we re-ran the cross-model comparison under four controls: with the predicted scores and the human label removed so only the feedback text was visible; with the A and B order swapped; on a subset where the two pieces of feedback were matched for length; and repeated three times at temperature 0 to measure consistency. The full judge prompt is in the Supplementary Material and the public repository, and the results of these controls appear in Table 10.
Evaluation Metrics
Our metrics are organized into three groups.
Because the labels are imbalanced (about 79% are Adequate), we treat macro-F1 as our primary alignment metric, since it weights the three classes equally and is not dominated by the majority class. We use balanced accuracy and the per-class scores to compare the models against the trivial “always Adequate” baseline, reading balanced accuracy against its chance level of 0.333 for three classes. We still report accuracy, read against the roughly 79% that the trivial baseline scores, and we report QWK and Cohen’s kappa as standard agreement measures. The bias measures (mean bias, inflation, deflation, and extreme error) describe the direction and size of the model’s mistakes.
Alignment metrics measure how well the model matches human labels: Accuracy (percentage of exact matches), balanced accuracy (the average of per-class recall, which the trivial “always Adequate” classifier scores 0.333 on), Quadratic Weighted Kappa or QWK (which measures agreement while penalizing larger disagreements more heavily), Cohen’s Kappa (which measures agreement beyond what you would expect by chance), and Macro F1-score (which computes the F1-score for each of the three labels separately, then averages them, giving equal weight to minority classes like Ineffective regardless of their small share of the data; see the Supplementary Material).
Bias and error metrics measure what kinds of mistakes the model makes. We encode the labels as Ineffective = 0, Adequate = 1, and Effective = 2, then compute: Mean prediction bias (average of Predicted minus Human), inflation rate (how often the model scores higher than the human), deflation rate (how often it scores lower), and extreme error rate (how often it is off by 2 levels, such as predicting “Effective” when the human said “Ineffective”).
Dimension-level analysis computes all metrics above separately for each discourse type and each task type.
Judge evaluation metrics include mean scores on all four judge dimensions and preference ratios. The actionability composite (average of constructiveness and specificity) measures how useful the generated feedback is for a student, checking if it points out the specific mistakes in the essay and addresses how to improve them using suggestions. We excluded relevance and rubric alignment because they tend to track label accuracy directly, and we wanted to separate feedback quality from label correctness. Comparisons are grouped by whether the two prompts agreed on the label, reinforcing this separation.
Because discourse segments from the same essay are not independent, we treat the essay as the unit of analysis. We report 95% confidence intervals from an essay-level bootstrap (resampling whole essays) for accuracy, balanced accuracy, macro-F1, QWK, and the bias measures; we compare prompt conditions with the paired McNemar test; and we test the judge preference tables with chi-square. Where a discourse type has few segments (for example Rebuttal), we flag it as small-sample.
Technical Infrastructure
We built the scoring pipeline in Python and processed the three prompt conditions for each segment in parallel, with a local cache so repeated runs reuse stored model outputs. To support reproducibility we fixed the sampling and data-split seeds (seed 42), ran every model at temperature 0, and recorded the exact checkpoints above. Temperature 0 does not remove all run-to-run variation, so we bound the residual with the essay-level confidence intervals and a judge-consistency check (repeated runs agree on 88% of cases). Because the model responses are stored, the reported numbers reproduce exactly from those responses, without re-running the models. The prompts are in the Supplementary Material, and the sampled data, the model responses, and the analysis scripts needed to reproduce the numbers are available in a public repository (https://github.com/yvsanghi/llm-essay-scoring-prompt-design).
Data and Ethics
The PERSUADE 2.0 corpus is released by its creators as open source under the Creative Commons BY-NC-SA 4.0 license, which permits non-commercial use with attribution; our work is non-commercial research and attributes the creators. The corpus is de-identified and contains no personally identifying information. Because we analyse an existing, anonymized, openly licensed dataset with no new human participants, no ethics-board approval was required.
Results
Overall Alignment: Baseline vs. Rubric vs. Calibrated
Tables 1 and 2 show global metrics for DeepSeek-R1 and Qwen2.5-7B across all three prompting conditions.
| Metric | Baseline | Rubric | Calibrated |
| Accuracy | 0.376 | 0.298 | 0.576 |
| QWK | 0.165 | 0.154 | 0.182 |
| Cohen’s Kappa | 0.039 | 0.036 | 0.060 |
| Macro F1 | 0.302 | 0.270 | 0.367 |
| Mean Bias | -0.499 | -0.410 | -0.292 |
| Inflation Rate | 8.5% | 17.1% | 7.6% |
| Deflation Rate | 53.8% | 53.1% | 34.9% |
| Extreme Error | 4.6% | 5.2% | 1.9% |
| Metric | Baseline | Rubric | Calibrated |
| Accuracy | 0.435 | 0.522 | 0.682 |
| QWK | 0.151 | 0.178 | 0.170 |
| Cohen’s Kappa | 0.084 | 0.091 | 0.101 |
| Macro F1 | 0.340 | 0.379 | 0.413 |
| Mean Bias | +0.362 | +0.191 | +0.050 |
| Inflation Rate | 46.1% | 33.5% | 18.4% |
| Deflation Rate | 10.3% | 14.3% | 13.4% |
| Extreme Error | 1.6% | 1.0% | 0.2% |
Tables 1 and 2 report point estimates; their essay-clustered 95% confidence intervals are given in Table 3.
| Metric | DS baseline | DS rubric | DS calibrated | Qwen baseline | Qwen rubric | Qwen calibrated |
| Accuracy | 0.376 [.357, .396] | 0.298 [.282, .314] | 0.576 [.556, .596] | 0.435 [.418, .452] | 0.522 [.506, .537] | 0.682 [.664, .700] |
| Balanced accuracy | 0.500 [.477, .522] | 0.497 [.471, .520] | 0.498 [.469, .525] | 0.447 [.423, .471] | 0.450 [.424, .478] | 0.409 [.390, .430] |
| Macro-F1 | 0.302 [.282, .321] | 0.270 [.252, .287] | 0.367 [.346, .386] | 0.340 [.319, .360] | 0.379 [.360, .399] | 0.413 [.392, .436] |
| QWK | 0.165 [.136, .194] | 0.154 [.125, .185] | 0.182 [.150, .214] | 0.150 [.123, .177] | 0.178 [.148, .207] | 0.170 [.137, .203] |
| Mean bias | -0.499 [-.535, -.465] | -0.410 [-.449, -.371] | -0.292 [-.321, -.264] | +0.362 [.333, .392] | +0.191 [.162, .221] | +0.050 [.023, .076] |
| Inflation rate | 0.085 [.075, .096] | 0.171 [.157, .187] | 0.076 [.067, .084] | 0.461 [.442, .482] | 0.335 [.317, .353] | 0.184 [.171, .197] |
| Deflation rate | 0.538 [.515, .562] | 0.531 [.509, .552] | 0.349 [.327, .370] | 0.103 [.092, .115] | 0.143 [.128, .158] | 0.134 [.117, .152] |
Brackets are essay-level 95% bootstrap confidence intervals (whole essays resampled).
For DeepSeek-R1, rubric-guided prompting actually decreased accuracy from 37.6% accuracy in baseline to 29.8% accuracy in the rubric-guided label allocation. The calibrated prompt increased accuracy to 57.6%, a gain of about 20 percentage points over baseline, though still below the 79% majority-class baseline.
For Qwen2.5-7B, the pattern was different. As the prompts progressed, the accuracy for the model never decreased. It went from 43.5% in baseline to 52.2% in the rubric-guided prompt, and this rose to 68.2% under calibration, about 24 percentage points over baseline, and again short of the 79% majority baseline.
Overall accuracy is misleading here. A trivial classifier that always predicts “Adequate” scores about 79%, and neither model reaches that even under calibration (DeepSeek 57.6%, Qwen 68.2%). But that 79% is built entirely on the majority class: the trivial rule scores 0 on precision and recall for both Ineffective and Effective, a macro-F1 of about 0.29, balanced accuracy of 0.333 (chance for three classes), and produces no feedback. We therefore judge the models on balanced accuracy, macro-F1, and per-class scores, shown in Table 4. On these measures both calibrated models beat the trivial rule (balanced accuracy 0.41 to 0.50 vs 0.333; macro-F1 0.37 to 0.41 vs 0.29) and, unlike it, actually detect the minority classes. These gaps are statistically reliable: for both models the essay-clustered 95% confidence intervals for balanced accuracy and macro-F1 sit entirely above the trivial rule’s values (Table 3). The balanced-accuracy numbers are honest about how hard this is: they are only a little above chance, and should be read against the roughly 72% human agreement ceiling, not 100%. We use these metrics, not raw accuracy, throughout. For a formative-feedback tool, finding the weak and strong segments and writing a comment matters more than matching the majority label, so a system that scores below 79% on accuracy can still be useful for that purpose. We do not present these models as ready to deploy: a system that trails the majority baseline on overall accuracy is not suitable for stand-alone, high-stakes grading, so we treat this as a research finding about prompt design and formative feedback, not a deployment recommendation. At most, such a system might aid a human grader who keeps the final judgment rather than replace one, and because it catches the minority classes only partially we present that as a direction for future work, not a validated use.
| Metric | Always-“Adequate” | DeepSeek-R1 cal. | Qwen2.5-7B cal. |
| Accuracy | 0.790 | 0.576 [.556, .596] | 0.682 [.664, .700] |
| Balanced accuracy | 0.333 | 0.498 [.469, .525] | 0.409 [.390, .430] |
| Macro-F1 | 0.294 | 0.367 [.346, .386] | 0.413 [.392, .436] |
| Ineffective P / R / F1 | 0 / 0 / 0 | 0.11 / 0.69 / 0.19 | 0.21 / 0.12 / 0.15 |
| Adequate P / R / F1 | 0.79 / 1.00 / 0.88 | 0.79 / 0.66 / 0.72 | 0.81 / 0.79 / 0.80 |
| Effective P / R / F1 | 0 / 0 / 0 | 0.28 / 0.14 / 0.19 | 0.26 / 0.31 / 0.29 |
Brackets are essay-level 95% bootstrap confidence intervals.
These results helped answer research question 1. Contrary to the expectations, rubric-guided prompting does not consistently improve alignment between LLM predictions and human-assigned effectiveness labels. Only when the rubric criteria is combined with the calibration constraints, large improvements in alignment are seen. The results also answered research question 3: calibration is the decisive factor, improving accuracy by about 20 to 25 percentage points over baseline for both models, though neither reaches the majority-class baseline. Calibration raises accuracy and macro-F1 and reduces scoring bias for both models.
Bias and Error Analysis
The bias and error metrics for both models are given in Tables 1 and 2 (the mean bias, inflation, deflation, and extreme error rows).
The two models have contrasting scoring biases. At baseline, DeepSeek tends to score too low, as its mean bias is -0.499 and Qwen tends to score too high, as its mean bias is +0.362. This observation is vital as it showcases that two prompts can have very different results based on the model selected. Figure 1 illustrates this visually: DeepSeek’s confusion matrices show errors concentrated below the diagonal (under-scoring), while Qwen’s show errors above it (over-scoring).
Rubric-guided prompting affected each model differently. For DeepSeek, it reduced deflation slightly from 53.8% to 53.1%, but increased inflation drastically from 8.5% to 17.1%. On the other hand, for Qwen, it significantly reduced inflation from 46.1% to 33.5%, but slightly increase deflation from 10.3% to 14.3%. Calibration helped both the models: DeepSeek’s bias improved to -0.292 and Qwen achieved near-neutral bias at +0.050.
One interesting trade-off appeared for Qwen under calibration. While its mean bias became nearly neutral, its deflation rate actually increased slightly (from 10.3% to 13.4%) as calibration corrected the model’s inflation tendency. Reducing one type of error can slightly increase another.
Calibration also improved extreme misclassification rates. Extreme misclassification is when the model predicts “Effective”, but the human rating is “Ineffective” or vice-versa. For DeepSeek, the rate dropped from 4.6% to 1.9%, and for Qwen, it fell from 1.6% to 0.2%. The progression from Baseline to Calibrated in Figure 1 shows the diagonal strengthening as off-diagonal errors shrink for both models.
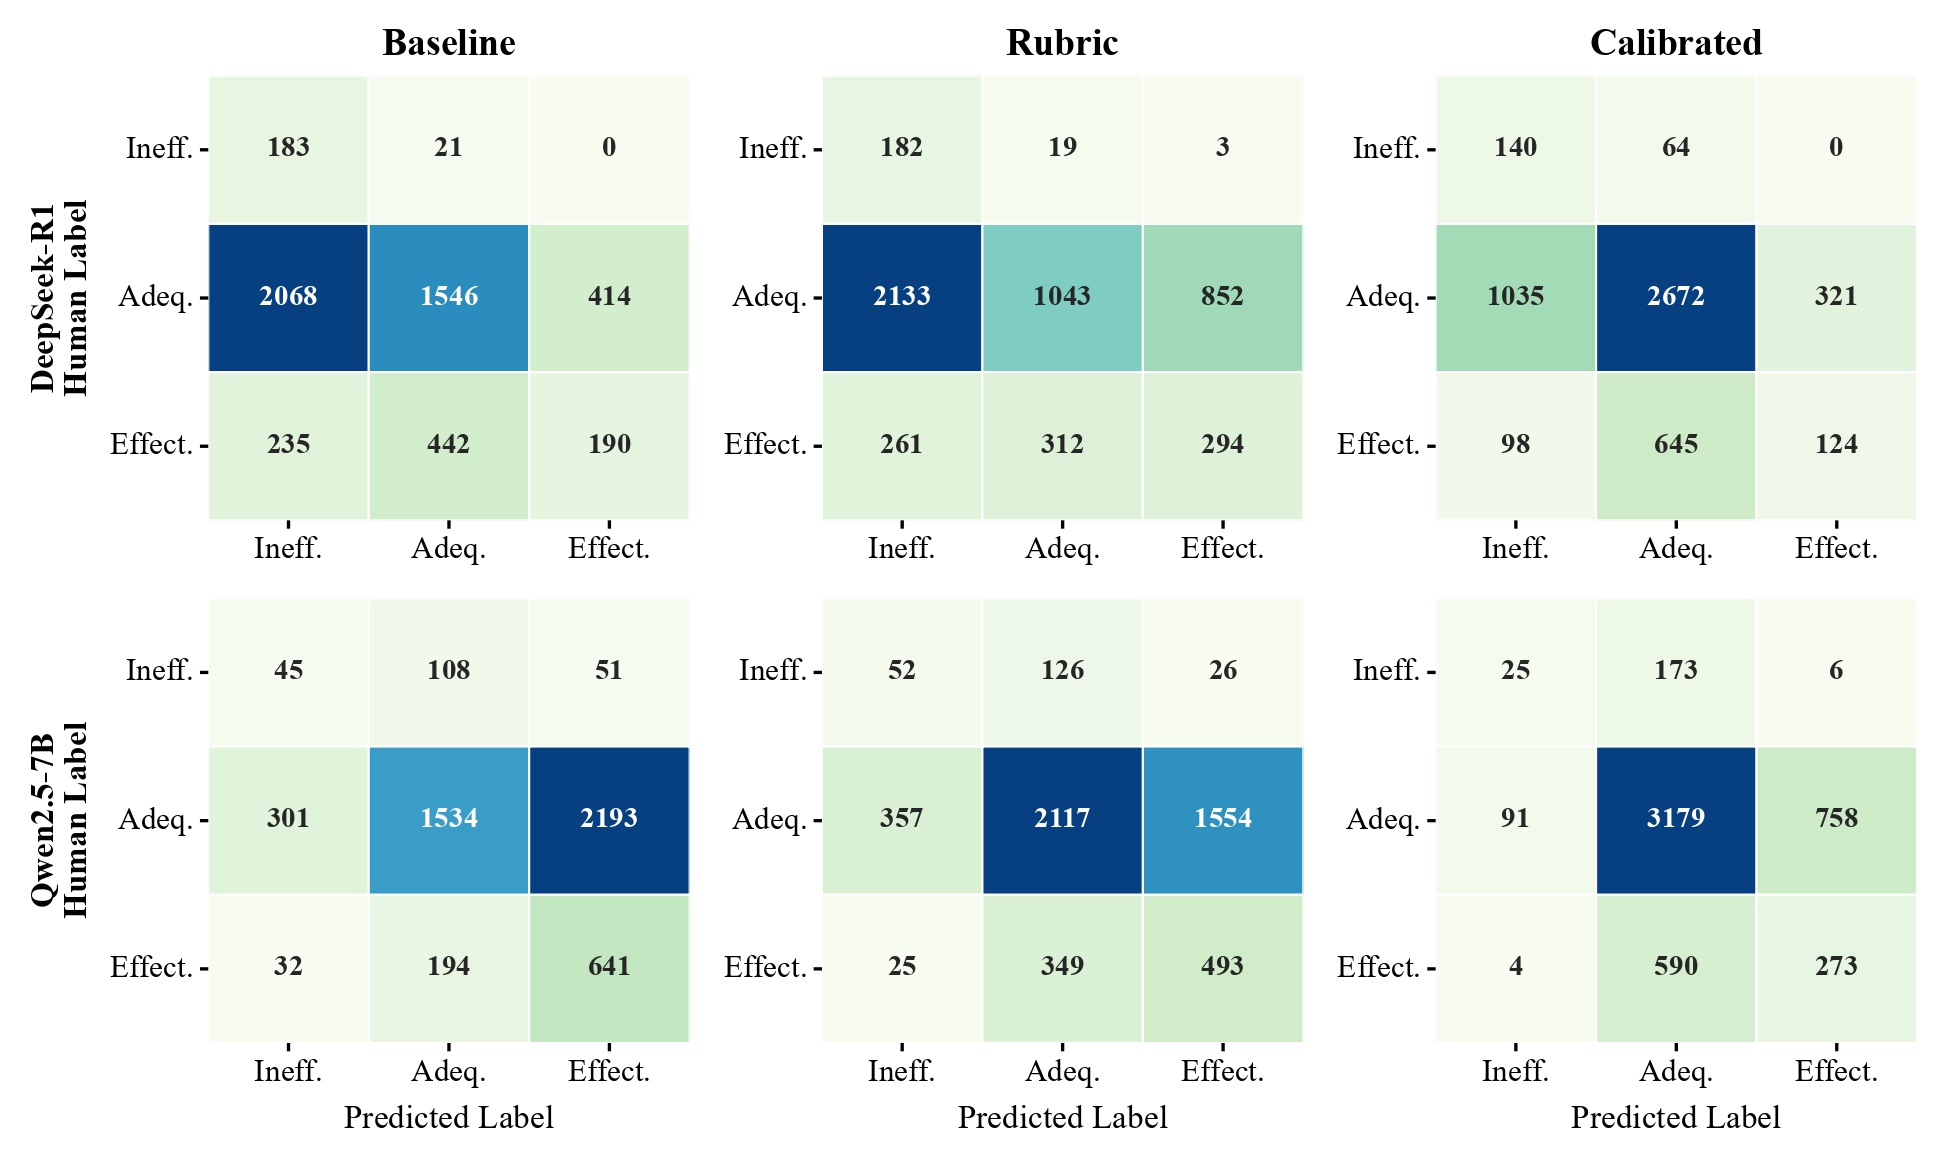
These results helped answer research question 2. Rubric prompting changes error patterns in model-specific ways. The models that already score too low gain inflation from rubric prompting, while the models that score too high see partial correction. Calibration reduces both types of bias.
Comparing the Two Models Under Calibration
Table 5 compares the two models head-to-head under the calibrated condition.
| Metric | DeepSeek-R1 | Qwen2.5-7B | Difference |
| Accuracy | 0.576 | 0.682 | +0.106 |
| QWK | 0.182 | 0.170 | -0.012 |
| Cohen’s Kappa | 0.060 | 0.101 | +0.041 |
| Macro F1 | 0.367 | 0.413 | +0.046 |
| Mean Bias | -0.292 | +0.050 | +0.342 |
| Inflation Rate | 7.6% | 18.4% | +10.8% |
| Deflation Rate | 34.9% | 13.4% | -21.5% |
| Extreme Error | 1.9% | 0.2% | -1.7% |
Qwen outperforms DeepSeek on most metrics, including accuracy, Macro F1, and extreme error rate. DeepSeek wins on QWK and lower inflation (7.6% vs. 18.4%).
The results raise an important question: Why does the smaller model score better? The answer lies in the models’ natural scoring tendencies. Qwen’s mean bias under calibration (+0.050) is close to neutral: it already tends to predict labels at roughly the right frequency. DeepSeek still scores too low even after calibration (mean bias −0.292). The calibration prompt helps both models, but Qwen benefits more because it was already closer to the target distribution.
What Inside the Calibrated Prompt Actually Helps
The calibrated prompt added two things to the rubric at once: a label-distribution prior (“most segments are Adequate; prefer Adequate when unsure”) and a few discourse-specific rules for Evidence, Rebuttal, and Counterclaim. To see which part matters, we built four prompts on one standard template that differ only in these parts (rubric only, rubric + prior, rubric + rules, and rubric + both), and scored them on a held-out split of essays (we split essays 60/40 and report the held-out 40%). The prior is the part that does the work. On Qwen2.5-7B, accuracy rises from about 0.50 (rubric only) to about 0.69 once the prior is added, while the discourse rules on their own add far less and add nothing we can measure once the prior is present: on the held-out test, rubric + both versus rubric + prior differs by under half a point (0.689 vs 0.693; 95% CI -0.8 to +1.5, which includes zero; McNemar p = 0.61), and it is also not significant on the full sample (McNemar p = 0.055). We therefore treat the discourse rules as a small effect we cannot tell apart from zero, while the distribution prior drives the gain. We ran this on Qwen2.5-7B, which gains most from calibration and so is the clearest case for separating the parts of the prompt, and limit this conclusion to that model.
| Condition | Accuracy | Change vs rubric only |
| Rubric only | 0.499 | (baseline) |
| Rubric + distribution prior | 0.689 | +19.0 |
| Rubric + discourse rules | 0.580 | +8.1 |
| Rubric + both | 0.693 | +19.4 |
Does a Bigger Model Help?
Our two main models differ in size but also in architecture and training, so they cannot tell us whether size by itself matters. To isolate size, we compared two sizes of the same family, Qwen2.5-7B and Qwen2.5-72B, under the calibrated prompt. The larger model did not score better on the metrics we rely on: balanced accuracy was flat (0.41 at 7B vs 0.39 at 72B) and macro-F1 was lower (0.41 vs 0.37). Its higher raw accuracy (0.68 vs 0.76) came from predicting “Adequate” more often: it used the “Effective” label for only 88 segments, against about 1,000 for the smaller model, so its recall on the Effective class fell from 0.31 to 0.03. So within this family more parameters did not improve aligned scoring; they mainly pushed the model further onto the majority class. This is a two-point comparison, not a full size sweep, so we read it narrowly: it shows that more parameters did not help here, not that size never matters.
| Metric | Qwen2.5-7B | Qwen2.5-72B |
| Accuracy | 0.682 | 0.755 |
| Balanced accuracy | 0.409 | 0.394 |
| Macro-F1 | 0.413 | 0.370 |
| Effective recall | 0.31 | 0.03 |
Discourse-Type-Level Analysis
Table 8 breaks down accuracy by discourse type for both models under calibration.
| Discourse Type | n | DS Indep | Qwen Indep | DS Text-dep | Qwen Text-dep |
| Claim | 1,825 | 68.5% | 72.8% | 62.0% | 70.7% |
| Evidence | 1,601 | 46.8% | 73.4% | 55.8% | 72.2% |
| Position | 500 | 46.6% | 36.7% | 56.6% | 48.2% |
| Conc. Statement | 455 | 69.4% | 71.1% | 69.1% | 70.9% |
| Lead | 303 | 60.7% | 44.6% | 60.0% | 60.0% |
| Counterclaim | 239 | 47.4% | 75.6% | 57.7% | 78.8% |
| Rebuttal | 176 | 25.7% | 72.3% | 18.7% | 68.0% |
Note: DS = DeepSeek-R1, Qwen = Qwen2.5-7B, Indep = Independent Task, Text-dep = Text-dependent task.
The cells of Table 8 are raw accuracy percentages. In the discussion below, pp (percentage points) refers to the difference between two such percentages.
The discourse types where Qwen has the largest advantages are the more abstract argumentative components: Rebuttal (+47 to +49 pp across task types, n = 176), Counterclaim (+21 to +28 pp, n = 239), and Evidence (+16 to +27 pp, n = 1,601). These gaps are consistent across Independent and Text-dependent tasks, suggesting a robust pattern rather than something that only appears for one task type. Rebuttal and Counterclaim have smaller sample sizes and hence the large gap for these two should be taken with caution. DeepSeek performs better on Position (+8 to +10 pp, n = 500) across both tasks, and on Lead for the Independent task (+16 pp). Lead accuracy is tied for the Text-dependent task (both 60.0%, n = 135). These are discourse types where DeepSeek’s more conservative predictions happen to fit the data better.
These results helped answer research question 4. Abstract argumentative components such as Rebuttal, Counterclaim, and Evidence benefit most from calibrated guidance and show the largest differences between models. Structured components such as Position and Lead show more moderate effects.
Feedback Quality: Judge Evaluation
When we compared baseline and calibrated feedback from DeepSeek, the judge preferred the calibrated feedback about twice as often as the baseline (35.9% vs 17.7%, with 46.4% ties; chi-square goodness-of-fit against an even split, ignoring ties: χ²(1) = 315.0, p < 0.001), and calibrated feedback scored higher on all four dimensions. But grouping by whether the two prompts agreed and matched the human label shows this is mostly about the label: when both prompts gave the same correct label the baseline was actually preferred slightly more often, while the calibrated prompt’s large advantage came almost entirely from the cases where the two prompts disagreed and calibration had the correct label more often (chi-square test of independence across strata: χ²(4) = 2891.3, p < 0.001). So for this within-model comparison the judge’s preference tracks label accuracy more than feedback quality. The full preference tables for this comparison (Supplementary Tables S2 and S3) and the accompanying figure are in the Supplementary Material.
Cross-Model Feedback: Table 9 shows the judge’s preferences when comparing calibrated feedback across two models.
| Preference | Fraction |
| DeepSeek preferred | 43.4% |
| Qwen preferred | 32.0% |
| Tie | 24.7% |
| Preference | Fraction |
| DeepSeek preferred | 65.2% |
| Qwen preferred | 1.8% |
| Tie | 32.9% |
| Dimension | Delta (Qwen – DS) |
| Rubric alignment | -0.179 |
| Specificity | -0.246 |
| Constructiveness | -0.385 |
| Relevance | -0.312 |
Overall, the judge preferred DeepSeek over Qwen (43.4% vs. 32.0%). This is notable because Qwen has higher scoring accuracy, yet the judge prefers DeepSeek’s feedback.
When both models assign the correct label (n = 2,279, Table 9, Panel B), the judge prefers DeepSeek’s feedback 65.2% of the time versus 1.8% for Qwen. DeepSeek is preferred over Qwen more often than chance both overall (χ²(1) = 87.9, p < 0.001) and in this both-correct subgroup (χ²(1) = 1365.6, p < 0.001). We ran four checks to understand why. First, when we hide the predicted scores and the human label so the judge sees only the feedback text, the preference for DeepSeek rises rather than falls (65% to 89%), so it is driven by the text, not the label. Second, length: longer feedback tends to score higher and DeepSeek writes more, so we compared only pairs whose feedback was within five words of equal length. There the preference for DeepSeek drops from 65% to 41% and most pairs become ties (33% to 56%). The small gap that remains shows up on two of the judge’s four ratings, with DeepSeek about 0.28 higher on constructiveness and 0.18 higher on relevance (each rated 1 to 5); specificity and rubric alignment are about equal, so the gap is not explained by the use of rubric terms. Third, swapping the A/B order changes the preference by less than a point (64.0% vs 63.6%), so order does not drive it. Fourth, repeating the judging three times at temperature 0 gives the same preference 88% of the time. Taken together, the judge reacts to the feedback text rather than the label, but most of what it reacts to is length.
These results help answer research question 5 across models. We cannot show from an automated judge alone that one model writes pedagogically better feedback; most of the cross-model preference is explained by length, with a small real difference left over, and we treat that as an open question for a human study.
| Check | Result | n |
| Labels and scores hidden (text only) | DeepSeek preferred 89% (vs 65% with labels shown) | 2279 |
| Equal-length pairs only (±5 words) | DeepSeek 41%, Qwen 3%, ties 56% | 388 |
| A/B order swapped | 64.0% vs 63.6% (no order effect) | 500 |
| Three repeats at temperature 0 | same preference 88% of the time | 150 |
Discussion
Rubric-guided Prompting Was Not Enough
The original hypothesis that adding the rubric criteria to the prompt would improve alignment between the LLM-predicted score and the human score, was not supported for DeepSeek-R1. In fact, adding the rubric made the accuracy fall from 37.6% to 29.8%.
One explanation for this could be that providing the model with a detailed description of the labels could have encouraged it to use extreme labels such as “Effective” and “Ineffective” more freely. This amplified its existing biases. For DeepSeek, it tended to score low, and the rubric may have provided additional vocabulary for the “Ineffective” category, worsening deflation.
This adds onto the results found by Abujadallah et al2. They suggested that adding rubric to the prompt improved model performance. Our results suggest that it varies from model-to-model, based on their existing scoring tendencies. While rubric-guided prompting helped Qwen, it worsened accuracy for DeepSeek. These results suggested that simply adding rubric criteria to the prompt is not sufficient in improving scoring accuracy for all the models.
Why Calibration Worked
The reason the calibration prompt worked is because it tells the model about the expected label distribution in the dataset. By telling the model that most labels are classified as “Adequate”, and to preserve extreme labels like “Effective” and “Ineffective” only for extreme cases, the model is provided with a rough expectation about the frequency of each label. The model can then adjust this expectation based on the actual text that it reads.
The calibrated prompt added two things to the rubric: a label-distribution prior and a few discourse-specific rules. Our ablation (see the ablation results above) shows the prior does almost all the work: adding the discourse rules on top of the prior changes accuracy by an amount we cannot tell apart from zero. So the distribution guidance, not the extra rules, is what makes calibration work.
One may argue that telling the model the label distribution is just giving it the answer. However, this is similar to telling a human grader that the majority of a set of essays fall in the “middle-range”, before the teacher starts grading the essays. This is a common and legitimate calibration practice. This is different from the strategy of “always predict Adequate” as the models still distinguish among the three labels based on the actual text, depicted by the per-class accuracy and confusion matrices. The distributional guidance helps the model set a reasonable baseline, which it then adjusts for each segment.
A second concern is more difficult to ignore. The human labels in PERSUADE 2.0 may contain bias. Graders might judge certain writing styles or types of arguments more harshly than others. If this is true, then calibrating a model to these labels means the model will learn those same biases. In other words, the model gets better at copying human grading. However, human grading is not perfect. If the labels are truly biased, the model will be biased as well. We also do not have a clear way to check if the PERSUADE 2.0 labels are unbiased, and hence we cannot rule out the possibility of bias in the data. Future work can explore this further. One way is to test whether calibrated models repeat known human biases. Another is to compare results using labels from different, independent annotation sources.
This calibration idea could work for other scoring tasks where the label distribution is known, like standardized test scoring or peer review.
Why the Smaller Model Scored Better
Qwen2.5-7B’s better scoring accuracy does not necessarily mean that it is a better model. DeepSeek-R1 outperformed Qwen on QWK (which measures the ordering of predictions), and the judge preferred DeepSeek’s feedback, though our checks show that preference is mostly explained by feedback length rather than a difference in quality we can establish (see the judge results above).
One factor explaining this could be the fit between the model’s existing scoring tendencies and the dataset’s label distribution. Under calibration, Qwen’s mean bias (+0.050) is close to neutral, while DeepSeek still deflates (−0.292), suggesting that either Qwen responds better to the calibration instructions or that Qwen’s scoring tendency is already aligned with the large “Adequate” score distribution. However, the gap cannot be explained by a single factor as these two models differ in several ways beyond size, including architecture, training data, instruction tuning approach.
Comparing two sizes of the same family (see the size results above), the much larger model did not score better on balanced accuracy or macro-F1, so within this family size was not the lever. This is a two-point comparison, so we do not claim a trend across sizes. Our two main models differ in architecture and training as well as size, so we do not attribute the gap between them to any single factor; the difference we can actually observe is in their scoring tendencies, where Qwen’s near-neutral bias fits this task’s label distribution better than DeepSeek’s. Testing a few models on a small labelled sample before relying on one is a sensible step.
What the Judge Was Really Measuring
The judge evaluation revealed unexpected findings. The judge’s preferences were mostly driven by whether the LLM got the label right, and not by the actual quality of the feedback itself. When both prompts predicted the correct label, baseline was preferred more often (23.2% vs. 13.7%), and the difference in feedback quality was negligible. This suggests a possibility that prompting the model to prefer “Adequate” in the calibration prompt may constrain the richness of the feedback text even when the label is correct.
When we compared the two models with labels controlled, the judge preferred DeepSeek’s feedback, but our checks show most of that preference is explained by length, with only a small difference left at equal length, and we could not validate it with human raters. So we do not claim that a larger model writes better feedback; we report a judge preference that is mostly about length and leave the quality question to future human evaluation.
For classroom use, the safe reading is to calibrate a model for accurate labels and to check feedback quality separately, since we could not establish that any particular model writes better feedback.
Implications for Educational Technology
Since LLM capabilities are evolving rapidly, we suggest some practical guidelines, drawn from one dataset and two models, that practitioners could consider when setting up LLM-based essay scoring, with our result for each step. First, start with a small labelled sample and test multiple models, since different models have different scoring tendencies and the best-performing model may not be the biggest or costliest one; in our case the smaller Qwen2.5-7B outperformed the larger DeepSeek-R1 on accuracy, though within one family a larger model did not score better, so we read this as a model-fit effect, not a size effect. Second, add calibration guidance alongside the rubric criteria, since rubric definitions alone may not be enough; including the label distribution (when it is known or can be estimated from a labelled sample) improved accuracy by about 20 to 25 percentage points over baseline for both models in our case, though still below the majority-class baseline, while rubric-only prompting was inconsistent. Third, check for discourse-type-specific biases, since overall accuracy can hide gaps on harder elements; in our case Rebuttal and Counterclaim remained the hardest to grade even after calibration. Fourth, evaluate feedback quality separately from scoring accuracy, since a model that scores well may not write the best feedback; in our case the judge’s feedback preferences were mostly explained by length, so we treat feedback quality as a separate, open question. These steps reflect our findings from the two models tested on the PERSUADE 2.0 dataset. The exact results would differ for different models, prompts, tasks, and rubrics, but these steps for testing, calibrating, and evaluating would remain useful as models continue to evolve.
Limitations
This study has several limitations. The results of our study come from a singular corpus, the PERSUADE 2.0 dataset, which has a specific set of rubrics and label distribution. Hence, we cannot be sure if the results would hold true for other datasets or rubrics. The calibrated prompt was tuned to match the label distribution in the PERSUADE 2.0 dataset, and might need adjustments for different datasets or scoring contexts. We tested only two main models, which significantly limits the extent to which we can generalise model size versus scoring tendencies. To probe size directly we compared two sizes of one family (7B and 72B); the larger one did not score better on balanced metrics, but this is a two-point comparison within a single family and not a full size study. In each model, other factors such as architecture, training data, and instruction tuning also differ. Since we tested only two models, any patterns we observed about model size, scoring tendencies, or feedback quality could be specific to these particular models rather than general trends.
We ran a four-condition ablation to separate the two parts of the calibrated prompt and found the distribution prior drives the gain; we ran this on one model (Qwen2.5-7B), so that specific result is limited to that model. A credible human evaluation of the feedback would need several trained, independent raters working blind, which was beyond the resources here; an informal or single-rater study would add its own bias rather than settle the question, so we leave a proper human study to future work and keep our feedback claims limited to what the automated judge can show. The observation that calibration may constrain feedback richness is based on a small preference difference and needs further investigation. Few-shot prompting was not tried in the study, which could potentially improve results further. We report essay-level bootstrap confidence intervals and paired McNemar tests for the comparisons we rely on, treating the essay as the unit of analysis.
Furthermore, calibration towards the human labels assumes that the human labels are correct. If the PERSUADE 2.0 dataset contains systematic biases like consistently rating certain elements/writing styles too harshly or too leniently, then calibrating the models would reproduce and amplify these biases. Since we have no independent way to assume that the labels are bias-free, we assume so to carry out the study. Lastly, since LLM capabilities change drastically, our results may not hold true for future versions of the two models or for entirely different models. The practical guidelines we suggest in the Implications for Educational Technology section are likely to stay useful and relevant even as models progress.
Conclusion
We introduce a three-stage, iteratively refined prompting setup and pair it with analyses of structured scoring errors, going beyond headline agreement. Our findings show that rubric-guided prompting alone is insufficient for aligning LLM scores with human judgments and can even degrade performance. Instead, calibration-style constraints, informing the model about the expected score distribution, emerge as the key design choice, improving accuracy by 20 to 25 percentage points over baseline, though both models still score below the 79% majority-class baseline. Comparing two sizes of one model family, more parameters did not improve aligned scoring, so the differences between our two main models are better explained by model-task fit than by size. The feedback judge’s preferences mostly tracked which model got the label right and how long the feedback was; we could not show that any model writes pedagogically better feedback.
For real-world use in education, rubric criteria should be combined with calibration guidance. It is also worth testing a model’s scoring tendencies on a small labelled sample before relying on it, since the best model for scoring may not be the best for feedback.
Acknowledgments
The author would like to thank his mentor Dr. Chenliang Zhou for his guidance in the development of this paper and Ms. Miranda Hendry for her helpful feedback.
Supplementary Material
References
- A. Jonsson, G. Svingby. The use of scoring rubrics: Reliability, validity and educational consequences. Educational Research Review. Vol. 2, pg. 130–144, 2007, https://doi.org/10.1016/j.edurev.2007.05.002 [↩]
- M. Abujadallah, M. Saad, S. Abudalfa. Evaluating open-source LLMs for automated essay scoring: The critical role of prompt design. Preprints.org. 2025, https://doi.org/10.20944/preprints202511.1429.v1 [↩] [↩]
- J. Meyer, T. Jansen, R. Schiller, L. Liebers, M. Hauenschild, E. Borber, P. Holtz. Using LLMs to bring evidence-based feedback into the classroom. Computers and Education: Artificial Intelligence. Vol. 6, Article 100199, 2024, https://doi.org/10.1016/j.caeai.2023.100199 [↩]
- Y. Attali, J. Burstein. Automated essay scoring with e-rater V.2. The Journal of Technology, Learning and Assessment. Vol. 4, pg. 3–29, 2006, https://ejournals.bc.edu/index.php/jtla/article/view/1650 [↩]
- K. Taghipour, H. T. Ng. A neural approach to automated essay scoring. Proceedings of the 2016 Conference on Empirical Methods in Natural Language Processing. pg. 1882–1891, 2016, https://doi.org/10.18653/v1/D16-1193 [↩]
- D. Ramesh, S. K. Sanampudi. An automated essay scoring systems: a systematic literature review. Artificial Intelligence Review. Vol. 55, pg. 2495–2527, 2022, https://doi.org/10.1007/s10462-021-10068-2 [↩]
- A. Mizumoto, M. Eguchi. Exploring the potential of using an AI language model for automated essay scoring. Research Methods in Applied Linguistics. Vol. 2, Article 100050, 2023, https://doi.org/10.1016/j.rmal.2023.100050 [↩]
- E. Latif, X. Zhai. Fine-tuning ChatGPT for automatic scoring. Computers and Education: Artificial Intelligence. Vol. 6, Article 100210, 2024, https://doi.org/10.1016/j.caeai.2024.100210 [↩]
- W. Li, H. Liu. Applying large language models for automated essay scoring for non-native Japanese. Humanities and Social Sciences Communications. Vol. 11, 2024, https://doi.org/10.1057/s41599-024-03209-9 [↩]
- X. Tang, H. Chen, D. Lin, K. Li. Harnessing LLMs for multi-dimensional writing assessment: Reliability and alignment with human judgments. Heliyon. Vol. 10, Article e34262, 2024, https://doi.org/10.1016/j.heliyon.2024.e34262 [↩]
- J. Wei, X. Wang, D. Schuurmans, M. Bosma, B. Ichter, F. Xia, E. Chi, Q. Le, D. Zhou. Chain-of-thought prompting elicits reasoning in large language models. Advances in Neural Information Processing Systems. Vol. 35, 2022, https://arxiv.org/abs/2201.11903 [↩]
- Y. Kim. Automated essay scoring with GPT-4 for a local placement test: investigating prompting strategies, intra-rater reliability, and alignment with human scores. TESOL Quarterly. 2025, https://doi.org/10.1002/tesq.3405 [↩]
- M. Stahl, L. Biermann, A. Nehring, H. Wachsmuth. Exploring LLM prompting strategies for joint essay scoring and feedback generation. Proceedings of the 19th Workshop on Innovative Use of NLP for Building Educational Applications (BEA). 2024, https://aclanthology.org/2024.bea-1.23 [↩]
- C. Guo, G. Pleiss, Y. Sun, K. Q. Weinberger. On calibration of modern neural networks. Proceedings of the 34th International Conference on Machine Learning. Vol. 70, pg. 1321–1330, 2017, https://proceedings.mlr.press/v70/guo17a.html [↩] [↩]
- Z. Zhao, E. Wallace, S. Feng, D. Klein, S. Singh. Calibrate before use: improving few-shot performance of language models. Proceedings of the 38th International Conference on Machine Learning (ICML). Vol. 139, pg. 12697–12706, 2021, https://proceedings.mlr.press/v139/zhao21c.html [↩]
- K. Tian, E. Mitchell, A. Zhou, A. Sharma, R. Rafailov, H. Yao, C. Finn, C. D. Manning. Just ask for calibration: strategies for eliciting calibrated confidence scores from language models fine-tuned with human feedback. Proceedings of the 2023 Conference on Empirical Methods in Natural Language Processing (EMNLP). pg. 5433–5442, 2023, https://aclanthology.org/2023.emnlp-main.330 [↩]
- L. Zheng, W.-L. Chiang, Y. Sheng, S. Zhuang, Z. Wu, Y. Zhuang, Z. Lin, Z. Li, D. Li, E. P. Xing, H. Zhang, J. E. Gonzalez, I. Stoica. Judging LLM-as-a-judge with MT-Bench and Chatbot Arena. Advances in Neural Information Processing Systems. Vol. 36, 2023, https://arxiv.org/abs/2306.05685 [↩]
- Y. Liu, D. Iter, Y. Xu, S. Wang, R. Xu, C. Zhu. G-Eval: NLG evaluation using GPT-4 with better human alignment. Proceedings of the 2023 Conference on Empirical Methods in Natural Language Processing (EMNLP). pg. 2511–2522, 2023, https://aclanthology.org/2023.emnlp-main.153 [↩]
- P. Wang, L. Li, L. Chen, Z. Cai, D. Zhu, B. Lin, Y. Cao, Q. Liu, T. Liu, Z. Sui. Large language models are not fair evaluators. Proceedings of the 62nd Annual Meeting of the Association for Computational Linguistics (ACL). 2024, https://aclanthology.org/2024.acl-long.511 [↩]
- K. Saito, A. Wachi, K. Wataoka, Y. Akimoto. Verbosity bias in preference labeling by large language models. arXiv preprint arXiv:2310.10076. 2023, https://arxiv.org/abs/2310.10076 [↩]
- A. Panickssery, S. R. Bowman, S. Feng. LLM evaluators recognize and favor their own generations. Advances in Neural Information Processing Systems. Vol. 37, 2024, https://arxiv.org/abs/2404.13076 [↩]
- M. S. Crossley, Y. Tian, P. Baffour, A. Franklin, M. Benner, U. Boser. A large-scale corpus for assessing written argumentation: PERSUADE 2.0. Assessing Writing. Vol. 61, Article 100865, 2024, https://doi.org/10.1016/j.asw.2024.100865 [↩] [↩]
- S. A. Crossley, P. Baffour, Y. Tian, A. Picou, M. Benner, U. Boser. The persuasive essays for rating, selecting, and understanding argumentative and discourse elements (PERSUADE) corpus 1.0. Assessing Writing. Vol. 54, Article 100667, 2022, https://doi.org/10.1016/j.asw.2022.100667 [↩]
- Vanderbilt University, The Learning Agency Lab. Feedback Prize – Predicting Effective Arguments. Kaggle. 2022, https://www.kaggle.com/competitions/feedback-prize-effectiveness [↩]
- The Learning Agency Lab. Learning Agency Lab – Automated Essay Scoring 2.0. Kaggle. 2024, https://www.kaggle.com/competitions/learning-agency-lab-automated-essay-scoring-2 [↩]
- DeepSeek-AI. DeepSeek-R1: incentivizing reasoning in LLMs through reinforcement learning. Nature. Vol. 645, pg. 633–638, 2025, https://doi.org/10.1038/s41586-025-09422-z [↩]
- Qwen Team. Qwen2.5 technical report. arXiv preprint arXiv:2412.15115. 2024, https://arxiv.org/abs/2412.15115 [↩]
- A. Holtzman, J. Buys, L. Du, M. Forbes, Y. Choi. The curious case of neural text degeneration. International Conference on Learning Representations (ICLR). 2020, https://arxiv.org/abs/1904.09751 [↩]