
Abstract
Background. Most consumers say they value the environment, yet far fewer buy sustainable products — the value–action gap. Most Indian studies measure intention rather than behaviour, which is precisely what that gap tells us not to trust. This study asks what distinguishes people who actually buy sustainable products from those who do not.
Methods. A total of 133 economically active adults completed a 24-item questionnaire. Respondents were grouped by reported purchase frequency over the previous six months into infrequent (n = 23), occasional (n = 72), and frequent buyers (n = 37), then compared on eleven constructs. Scale reliability was assessed with Cronbach’s alpha. Normality and variance homogeneity were tested first; ANOVA with Tukey HSD was used where assumptions held and Kruskal–Wallis with Dunn’s test where they did not. Environmental awareness was the pre-designated primary outcome; the remaining ten were corrected with the Benjamini–Hochberg false discovery rate.
Results. Frequent buyers scored significantly higher on environmental awareness (F(2, 129) = 11.71, p < .001, η² = .154), green trust, quality perception, social norms, willingness to pay, and marketing exposure. Moral responsibility was high and flat across all groups (M ≈ 4.0), as was the perceived price barrier.
Conclusions. In this sample the gap is not one of moral conviction, which is already near-universal, but of knowledge, trust, and willingness to pay a premium. Findings describe one urban convenience sample and are not national estimates.
Keywords: sustainable consumption; value–action gap; green trust; environmental awareness; willingness to pay; Kruskal–Wallis
Introduction
Background and Context
The global economy is undergoing a structural transformation, moving away from the traditional take, make, and waste model toward circular and sustainable frameworks. Consumers derive utility from the objective characteristics of a product, price, quality, and durability, according to Lancaster1. In the mid-2020s, a fourth dimension of utility has emerged: environmental integrity. By 2026, the international market for sustainable goods has moved well beyond niche status. Global markets for green products and clean technology are projected to surpass USD 600 billion by 2027, a shift driven by the visible consequences of climate change and the commitments embedded in the Paris Agreement (2015).
Consumer attitudes toward sustainable products have shifted from passive awareness to active advocacy, yet a persistent tension remains. The green premium , the additional cost consumers pay in exchange for a reduced environmental footprint , continues to act as a structural barrier. Even where sustainable alternatives are readily available, demand side behaviour remains constrained by the value action gap: the well documented phenomenon in which positive environmental attitudes fail to translate consistently into purchasing decisions.
Problem Statement and Rationale
India presents a particularly instructive case. As the world’s most populous country, India’s consumption patterns carry significant global environmental consequences. The country’s sustainable transition is being driven by a combination of policy incentives, such as the FAME-II scheme for electric vehicles, and increasing resource scarcity. In 2025, India attracted a record USD 18 billion in renewable energy investment. Unlike European consumers, who tend to prioritise carbon neutrality, Indian consumers are primarily motivated by resource efficiency and long-term cost savings. A 2025 study by the Indian Council for Research on International Economic Relations found that Indian households were 30% more likely to adopt sustainable products when these promised long-term cost reductions, compared with American households, who placed more weight on corporate social responsibility.
Significance and Purpose
Two features of the market help explain why conventional products still dominate. The first is network externalities: a product becomes more useful as more people use it, because the supporting infrastructure grows with it. Petrol stations are everywhere; electric-vehicle chargers are not. The second is bounded rationality — people do not weigh every option carefully, because they have limited time, information, and attention, and so fall back on habit. Both work against products that are newer, costlier, and harder to find.
This study makes three contributions. It anchors the comparison in reported behaviour rather than stated preference. It chooses each statistical test on the basis of tested assumptions rather than convention. And it reports what did not differ as carefully as what did.
Objectives
The study compares three purchase-frequency groups across eleven constructs. Rather than a single general hypothesis, we state eleven directional hypotheses, one per construct. H1 is designated the primary hypothesis in advance of analysis; the remaining ten are exploratory and corrected for multiplicity. Lancaster’s characteristics approach1 suggests that consumers derive utility from product attributes like price, quality and environmental performance, which implies that buyers who repeatedly choose sustainable products should perceive greater product quality, value and affordability. This has been the base of hypotheses H3-H6. The outcomes for the hypotheses are derived in results.
H1: Frequent buyers report higher environmental awareness than infrequent buyers. (PRIMARY)
H2: Frequent buyers report higher green trust.
H3: Frequent buyers rate sustainable product quality more highly.
H4: Frequent buyers perceive sustainable products as more affordable
H5: Frequent buyers perceive sustainable products as more accessible.
H6: Infrequent buyers report price as a stronger barrier.
H7: Frequent buyers report stronger social norms.
H8: Frequent buyers report stronger moral norms.
H9: Frequent buyers report higher willingness to pay a premium.
H10: Frequent buyers report greater exposure to sustainability marketing
H11: Frequent buyers report a stronger stated preference for sustainable products
Theoretical Framework
This study works within the Theory of Planned Behaviour2, extended with trust and knowledge constructs, and read against Lancaster’s characteristics approach to consumer theory3, which treats a product as a bundle of attributes from which utility is derived. On that view an environmental attribute competes with price, quality, and durability for the consumer’s attention.
The value–action gap has a long evidentiary base. Ethical shoppers often fail to translate self-description into purchases4, and the same pattern recurs in the German green-apparel market5. Recent syntheses classify the gap’s causes into psychological, demographic, social, and marketing-mix families6, and call for more work comparing developed and developing markets7
Knowledge is the most frequently proposed driver, and one of the least consistent. A meta-analysis found knowledge has a real but modest effect largely mediated by attitude and moral norm8, and environmental knowledge matters for sustainable purchase only in combination with other factors9. Indian evidence is mixed in the same way: environmental knowledge and past behaviour predicted sustainable-apparel intention in one large survey10, and knowledge and media exposure predicted intention to buy green durables in another11.
Trust has emerged as the mechanism that converts knowledge into action. Greenwashing damages green trust through consumer confusion and perceived risk12, and eco-label knowledge drives purchase only when it produces trust13; greenwashing concerns help explain why attitudes fail to become behaviour14. If trust is the converting mechanism, it should separate buyers from non-buyers even where knowledge alone does not.
The green premium is the most obvious barrier, and the evidence on it is nuanced. Willingness to pay a premium depends on the reference group a consumer compares against15, and price and availability rank among the most consistently cited barriers16. An important distinction runs through this work: feeling that a product is expensive is not the same as being unwilling to pay for it. Two kinds of norm also appear. Social norms are what a person believes others expect; moral or personal norms are what they believe they owe themselves17. Personal norms significantly influence green attitudes18, and extended-TPB models have been applied to young Indian consumers19. Whether moral norms separate buyers from non-buyers in a population where almost everyone endorses them is a separate, testable question.
Methods
Research design
This is a cross-sectional, questionnaire-based comparison of three naturally occurring groups. Respondents are grouped by reported behaviour, and eleven attitudinal and behavioural constructs are compared across those groups. No manipulation was involved. As the study is based on self-reported data, the repossess may be influenced by social desirability bias, with participants tending to provide socially acceptable answers. The limitation was considered during the design and administration of the questionnaire.
Participants and Sample
Responses were collected from 133 economically active adults through an online questionnaire distributed via email and messaging platforms. One respondent did not answer the purchase-frequency item and could not be assigned to a group, leaving N = 132 for group comparisons. Sampling was by convenience. This is a real constraint, and the sample is not presented as representative of India: respondents are overwhelmingly urban (95.5%) and internet-using, and just over half report household income above ₹15 lakh per year. Every claim is therefore scoped to this sample. Table 2 gives the profile.
| Characteristic | Category | n | % |
| Gender | Male | 79 | 59.8% |
| Female | 51 | 38.6% | |
| Prefer not to say / missing | 2 | 1.5% | |
| Age group | 40–65 years | 54 | 40.9% |
| 25–40 years | 53 | 40.2% | |
| Under 25 years | 25 | 18.9% | |
| Annual income | Above ₹15 lakh | 69 | 52.3% |
| ₹10–15 lakh | 18 | 13.6% | |
| ₹5–10 lakh | 17 | 12.9% | |
| ₹1–5 lakh | 15 | 11.4% | |
| Not disclosed | 13 | 9.8% | |
| Occupation | Employed | 94 | 71.2% |
| Self-employed / Other | 21 | 15.9% | |
| Student | 16 | 12.1% | |
| Location | Urban | 126 | 95.5% |
| Rural | 5 | 3.8% |
Note. Percentages are of the analysed sample. Income was not disclosed by 13 respondents. The rural subsample (n = 5) is too small to support any rural–urban comparison, and none is attempted.
Data collection and instrument
The questionnaire contained 24 substantive items plus demographics. During re-coding of the raw export, the instrument was found not to use a uniform scale: 17 items use a five-point scale and 7 use a seven-point scale. To allow items of different lengths to be combined, every item was linearly rescaled onto a common 1–5 metric using x′ = 1 + (x − 1) × 4 / (k − 1), where k is the number of scale points. All means below are on that 1–5 metric, and the price-barrier item was reverse-scored where combined with affordability.
Variables and measurements
Several constructs were rebuilt from multiple items rather than measured with one question. This section defines each construct as operationalised here, states its items, and gives the direction in which higher scores run.
Multi-item composites
Environmental Awareness (α = .771). Self-assessed knowledge of environmental issues, averaging four items on awareness of climate-change impacts on local weather, familiarity with global resource depletion, awareness of greenwashing, and understanding of products’ lifecycle impact. Higher = broader knowledge. This is the primary outcome.
Product Quality Perception (α = .777). How favourably sustainable products are judged on quality relative to conventional ones, averaging four items on reliability, value for money, perceived quality, and durability.
Social Norms (α = .665). The degree to which environmental behaviour is shaped by the social environment, averaging four items on appearing eco-conscious to peers, family support, peer influence, and social desirability in one’s community. Higher = stronger perceived pressure and support.
Marketing Exposure (α = .488 — low). Influence of media and advertising on environmental knowledge and buying, averaging two items on social-media posts and sustainability advertisements. Reliability is below threshold, so results are flagged and treated as exploratory.
Perceived Accessibility (α = .407 — low). How easy sustainable products are to obtain, averaging two items on accessibility relative to conventional products and on variety and choice. Reliability is low, so results are flagged.
Single-item measures (exploratory)
The instrument contains one question for each construct below. They cannot be given a reliability coefficient and are reported as exploratory throughout.
Sustainable Purchase Frequency (grouping variable). How often the respondent reports having actually bought sustainable products in the previous six months, from “never” to “always”. This behavioural measure forms the three comparison groups. It is a report of past behaviour, not an attitude or intention.
Green Trust (single item). How much the respondent trusts eco-labels and environmental certifications. Higher = greater confidence that environmental claims are truthful.
Moral Norms (single item). Personal moral responsibility for environmental protection, measured by agreement that one feels personally responsible. A personal norm, distinct from the social-norms composite, which concerns external pressure.
Willingness to Pay (single item). The price premium the respondent says they would accept for a sustainable product, from “nothing extra” to “50% more”. A stated financial intention, conceptually separate from the price-barrier item.
Price Barrier (single item). The extent to which price is perceived as an obstacle to buying sustainable products. Higher = price felt as a stronger barrier. Measures how expensive the product feels, not whether the premium would be paid.
Perceived Affordability (single item). How affordable sustainable products are felt to be in absolute terms. Intended to combine with the price-barrier item, but the two-item composite failed its reliability test (α = .262), confirming that felt affordability and felt price-barrier are distinct.
Stated Preference (single item). Which product type the respondent says they prefer between sustainable and conventional, from “strongly prefer conventional” to “strongly prefer sustainable”. Treated as an outcome here, not as the grouping variable, so preference and behaviour can be compared.
Scale reliability
Multi-item composites were built wherever the instrument allowed and tested with Cronbach’s alpha against conventional thresholds (≥ .70 good, ≥ .60 acceptable)20. Table 3 reports the result, including composites that failed.
| Construct | Items | Cronbach α | n | Verdict | Treatment in analysis |
| Environmental Awareness | 4 | .771 | 129 | Good | Retained as composite |
| Product Quality Perception | 4 | .777 | 130 | Good | Retained as composite |
| Social Norms | 4 | .665 | 130 | Acceptable | Retained as composite |
| Marketing Exposure | 2 | .488 | 132 | Low | Retained; results flagged |
| Perceived Accessibility | 2 | .407 | 132 | Low | Retained; results flagged |
| Affordability (2-item) | 2 | .262 | 131 | Failed | Split into single items |
| Green Trust | 1 | — | 132 | Single item | Exploratory only |
| Perceived Affordability | 1 | — | 131 | Single item | Exploratory only |
| Price Barrier | 1 | — | 131 | Single item | Exploratory only |
| Moral Norms | 1 | — | 130 | Single item | Exploratory only |
| Willingness to Pay | 1 | — | 132 | Single item | Exploratory only |
| Stated Preference | 1 | — | 130 | Single item | Exploratory only |
Note. The two-item affordability composite failed because its components measure different things — how expensive the product is, and how much of a barrier that price is. These were separated. Constructs with α < .60 and all single-item measures are reported as exploratory and flagged throughout.
Procedure: grouping and the circularity problem
An earlier version of this study grouped respondents by a single stated-preference item and then tested whether groups differed on adoption intention, green trust, and quality perception — several of which are near-neighbours of the grouping item, making the test close to tautological. This was fixed by changing the grouping variable to reported purchase frequency, a behavioural measure:
– Infrequent buyers (n = 23): answered “never” or “rarely”.
– Occasional buyers (n = 72): answered “sometimes”.
– Frequent buyers (n = 37): answered “often” or “always”.
Stated preference is now an outcome, not the grouping variable, which turns the circularity problem into the research question: if preference and behaviour were identical, there would be no value–action gap to study.
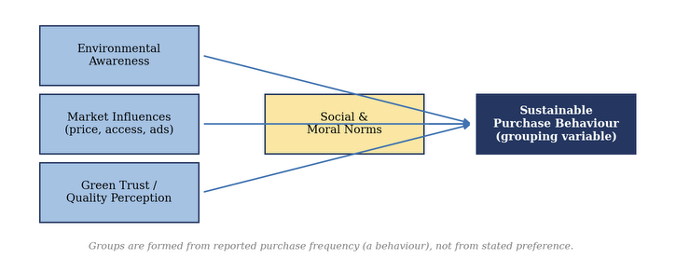
To show the grouping variable is not a proxy for the outcomes, Table 4 reports the Spearman correlation between purchase frequency and every construct, alongside the correlation with the old grouping variable.
| Construct | ρ with purchase frequency(grouping variable) | ρ with stated preference(old grouping variable) | Redundant? (ρ > .70) |
| Stated Preference | .371 | . | Distinct — 13.8% shared variance |
| Willingness to Pay | .353 | .341 | Distinct |
| Environmental Awareness | .330 | .335 | Distinct |
| Marketing Exposure | .303 | .300 | Distinct |
| Green Trust | .296 | .301 | Distinct |
| Product Quality Perception | .282 | .478 | Distinct |
| Perceived Accessibility | .252 | .132 | Distinct |
| Social Norms | .236 | .403 | Distinct |
| Perceived Affordability | .189 | .215 | Distinct |
| Moral Norms | .067 | .202 | Distinct |
| Price Barrier | .012 | −.077 | Distinct |
Note. Spearman’s ρ. A correlation above about .70 would suggest two measures capture the same construct; none come close. Purchase frequency and stated preference correlate at ρ = .371, sharing 13.8% of variance — the value–action gap in miniature.
Data Analysis
The test for each construct was chosen from tested assumptions rather than convention. Normality was assessed with the Shapiro–Wilk test in all three groups21 and homogeneity of variance with Levene’s median-centred test22 The routing rule was fixed before any outcome was inspected:
– Normality and equal variances both satisfied → one-way ANOVA with Tukey HSD post hoc.
– Normality satisfied but variances unequal → Welch’s ANOVA with Games–Howell post hoc.
– Normality violated in any group → Kruskal–Wallis23 with Dunn’s post hoc, Holm-adjusted24
Levene’s test passed for all eleven constructs, so the Welch branch was never triggered. Tukey’s HSD25 provided ANOVA post hoc tests. For multiplicity, environmental awareness was designated the primary outcome in advance and tested at α = .05 without correction; the remaining ten omnibus tests form an exploratory family whose p-values are corrected with the Benjamini–Hochberg false discovery rate26. Effect sizes are η² for ANOVA and ε² for Kruskal–Wallis, with Cohen’s d and rank-biserial r for pairwise contrasts, interpreted against conventional benchmarks27.
With N = 132 across three groups, the study has 80% power to detect Cohen’s f = 0.273 (η² ≈ .070) — a medium-to-large effect. Achieved power is 72% for a medium effect but only 16% for a small one27. A non-significant result therefore means a difference was not detected, not that none exists.
Ethical considerations
Participation was voluntary and anonymous. Respondents were told how their answers would be used. No item was compulsory, which is why constructs have slightly different sample sizes. No responses were altered or excluded to change a result.
Results
Research Hypothesis
Table 4 lists the hypotheses with outcomes for the reader’s convenience
| Hypothesis | Outcome | |
| H1 | Frequent buyers report higher environmental awareness than infrequent buyers. (PRIMARY) | Supported |
| H2 | Frequent buyers report higher green trust. | Supported |
| H3 | Frequent buyers rate sustainable product quality more highly. | Supported |
| H4 | Frequent buyers perceive sustainable products as more affordable. | Not supported |
| H5 | Frequent buyers perceive sustainable products as more accessible. | Not supported |
| H6 | Infrequent buyers report price as a stronger barrier. | Not supported |
| H7 | Frequent buyers report stronger social norms. | Supported |
| H8 | Frequent buyers report stronger moral norms. | Not supported |
| H9 | Frequent buyers report higher willingness to pay a premium. | Supported |
| H10 | Frequent buyers report greater exposure to sustainability marketing. | Supported |
| H11 | Frequent buyers report a stronger stated preference for sustainable products. | Supported |
Note. H1 is primary and tested at α = .05 without correction. H2–H11 are exploratory and corrected using the Benjamini–Hochberg false discovery rate. H1 is designated primary because awareness is named first in the research question, the value–action gap concerns whether knowing becomes doing, and awareness is the construct most conceptually distant from purchase frequency.
Assumption Testing
Table 5 reports the Shapiro–Wilk and Levene results that determined which test each construct received. Only three constructs satisfied normality in all three groups; eight did not. Had ANOVA been run across the board, eight of eleven tests would have rested on an assumption the data reject.
| Dependent Variable | Shapiro–Wilk p, by group | Levene’s test | Route selected | |||
| Infreq. | Occas. | Freq. | F | p | ||
| Environmental Awareness | .055 | .075 | .307 | 2.688 | .072 | ANOVA + Tukey |
| Product Quality Perception | .579 | .561 | .419 | 1.165 | .315 | ANOVA + Tukey |
| Social Norms | .983 | .479 | .184 | 0.994 | .373 | ANOVA + Tukey |
| Green Trust | .004 | .000 | .000 | 0.862 | .425 | Kruskal–Wallis + Dunn |
| Perceived Affordability | .030 | .000 | .074 | 2.069 | .131 | Kruskal–Wallis + Dunn |
| Price Barrier | .035 | .000 | .006 | 1.057 | .351 | Kruskal–Wallis + Dunn |
| Perceived Accessibility | .062 | .002 | .033 | 0.695 | .501 | Kruskal–Wallis + Dunn |
| Marketing Exposure | .178 | .014 | .008 | 0.265 | .768 | Kruskal–Wallis + Dunn |
| Moral Norms | .001 | .000 | .000 | 0.684 | .507 | Kruskal–Wallis + Dunn |
| Willingness to Pay | .000 | .000 | .008 | 2.157 | .120 | Kruskal–Wallis + Dunn |
| Stated Preference | .007 | .000 | .001 | 0.176 | .839 | Kruskal–Wallis + Dunn |
Note. Shapiro–Wilk p-values per group; values below .05 (red) indicate a normality violation. Levene’s test uses the median-centred (Brown–Forsythe) form and was satisfied for every construct, so the Welch branch was never used. Three constructs qualified for ANOVA; eight required Kruskal–Wallis.
Primary outcome: environmental awareness
Environmental awareness met both assumptions and was analysed by one-way ANOVA. The three groups differed significantly, F(2, 129) = 11.71, p < .001, η² = .154 — a large effect. In plain terms, knowing only which purchase-frequency group a respondent belonged to accounts for about a seventh of the spread in their awareness scores, a substantial share for a single grouping variable. The group means climb steadily: infrequent 2.66, occasional 3.28, frequent 3.60.
Tukey’s post hoc test located the difference. Frequent buyers scored well above infrequent buyers (d = 1.10, p < .001), and occasional buyers also scored above infrequent buyers (d = 0.88, p = .002) — both large gaps. But occasional and frequent buyers did not differ (p = .084). The awareness jump happens between not buying and buying at all, not between buying sometimes and buying often. H1 is supported.
Exploratory outcomes
Table 6 reports group means, the assumption-matched omnibus test, the FDR-corrected p-value, and the effect size for all eleven constructs. Six of the ten exploratory constructs survived correction; four did not.
| Construct | InfrequentM (SD)n = 23 | OccasionalM (SD)n = 72 | FrequentM(SD)n = 37 | Test | Stat. | p (FDR) | Effect |
| Environmental Awareness | 2.66 (0.93) | 3.28 (0.61) | 3.60 (0.79) | ANOVA | 11.71 | < .001 | .154 |
| Product Quality Perception | 2.96 (0.72) | 3.16 (0.54) | 3.45 (0.50) | ANOVA | 6.08 | .005 | .086 |
| Social Norms | 2.54 (0.76) | 3.03 (0.65) | 3.19 (0.73) | ANOVA | 6.60 | .004 | .093 |
| Green Trust | 2.27 (0.94) | 2.81 (0.68) | 3.05 (0.78) | K–W | 12.95 | .004 | .086 |
| Marketing Exposureᵇ | 2.46 (0.69) | 3.04 (0.74) | 3.27 (0.67) | K–W | 15.40 | .002 | .104 |
| Willingness to Pay | 2.00 (0.74) | 2.47 (0.79) | 3.03 (1.04) | K–W | 17.56 | .001 | .121 |
| Stated Preference | 3.00 (0.85) | 3.45 (0.80) | 3.97 (0.79) | K–W | 18.29 | .001 | .128 |
| Perceived Accessibilityᵇ | 2.50 (0.93) | 2.67 (0.70) | 2.92 (0.64) | K–W | 6.36 | .059 | .034 |
| Perceived Affordability | 2.21 (0.89) | 2.59 (0.65) | 2.75 (0.89) | K–W | 4.96 | .105 | .023 |
| Moral Norms | 4.05 (0.74) | 3.74 (1.01) | 4.05 (1.05) | K–W | 3.80 | .166 | .014 |
| Price Barrier | 2.68 (1.21) | 2.86 (1.01) | 2.78 (1.00) | K–W | 0.45 | .799 | .000 |
Note. Scores rescaled to a common 1–5 metric. Effect size is η² for ANOVA and ε² for Kruskal–Wallis, interpreted on the same scale (.01 small, .06 medium, .14 large). The ten exploratory p-values are Benjamini–Hochberg corrected; the primary outcome (shaded) is uncorrected. ᵇ Composite reliability below .60.
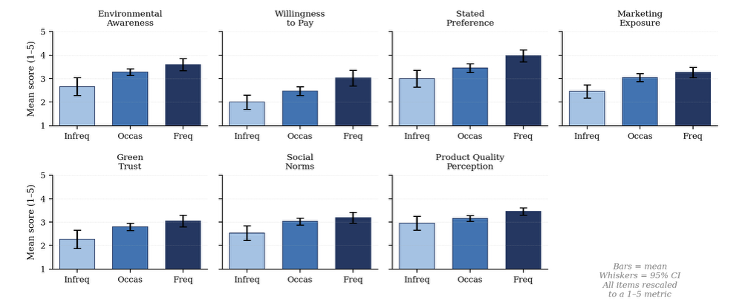
The six constructs that differed
Willingness to pay produced the clearest gradient in the study (H = 17.56, p = .001, ε² = .121), rising in even steps (2.00, 2.47, 3.03) with every pairwise comparison significant, including occasional versus frequent (p = .019). It is the one construct that keeps discriminating all the way up the frequency ladder: where awareness plateaus after a person starts buying, readiness to pay a premium keeps rising.
Stated preference behaved almost identically (H = 18.29, p = .001, ε² = .128), separating all three groups — people who buy more also say they prefer more. The point of interest is how modest the preference–behaviour correlation actually is (ρ = .371), which is the value–action gap restated.
Marketing exposure was significant (H = 15.40, p = .002, ε² = .104), with frequent buyers reporting far more influence from posts and ads than infrequent buyers (r = 0.59). Because the two-item marketing scale was unreliable (α = .488), this is the significant finding we would least stake a claim on without replication.
Green trust (H = 12.95, p = .004, ε² = .086) showed a familiar shape: infrequent buyers trusted eco-labels much less than occasional (r = 0.37) or frequent buyers (r = 0.48), while the latter two did not differ. This fits the proposed mechanism — if consumers do not believe environmental claims, no amount of knowledge converts into purchase.
Product quality perception (F = 6.08, p = .005, η² = .086) and social norms (F = 6.60, p = .004, η² = .093) both reached ANOVA significance and both followed the threshold pattern, the largest gap sitting between infrequent buyers and the rest. Frequent buyers rated sustainable products meaningfully better made (d = 0.84 versus infrequent) and reported stronger social encouragement (d = 0.88)
The four constructs that did not differ
Moral norms did not differ (H = 3.80, p = .166), and the reason is the ceiling, not low power alone: every group scored close to 4.0 out of 5. People who rarely buy feel just as personally responsible as those who buy often. There is no gap in conviction to detect.
The price barrier also did not differ (H = 0.45, p = .799), with a near-zero effect. Everyone finds sustainable products expensive to roughly the same degree. The contrast with willingness to pay is the point: felt price is flat, but readiness to pay it is not.
Perceived accessibility was significant before correction (p = .042) but not after FDR adjustment (p = .059) — exactly the borderline case multiplicity correction exists to catch — and its low reliability (α = .407) gives further reason for caution. Perceived affordability was not significant under the correct test (p = .105), though it would have been under a naive ANOVA; the next section treats this case in detail.
Post hoc comparisons
| Construct | Comparison | p (adj.) | Effect size | Magnitude |
| Environmental Awareness | Infrequent vs Frequent | < .001 | d = 1.10 | Large |
| Infrequent vs Occasional | .002 | d = 0.88 | Large | |
| Occasional vs Frequent | .084 | d = 0.47 | n.s. | |
| Product Quality Perception | Infrequent vs Frequent | .003 | d = 0.84 | Large |
| Occasional vs Frequent | .028 | d = 0.56 | Medium | |
| Infrequent vs Occasional | .299 | d = 0.34 | n.s. | |
| Social Norms | Infrequent vs Frequent | .002 | d = 0.88 | Large |
| Infrequent vs Occasional | .010 | d = 0.72 | Medium | |
| Occasional vs Frequent | .475 | d = 0.24 | n.s. | |
| Green Trust | Infrequent vs Frequent | .001 | r = 0.48 | Medium |
| Infrequent vs Occasional | .014 | r = 0.37 | Medium | |
| Occasional vs Frequent | .128 | r = 0.17 | n.s. | |
| Marketing Exposure | Infrequent vs Frequent | < .001 | r = 0.59 | Large |
| Infrequent vs Occasional | .003 | r = 0.42 | Medium | |
| Occasional vs Frequent | .178 | r = 0.15 | n.s. | |
| Willingness to Pay | Infrequent vs Frequent | < .001 | r = 0.56 | Large |
| Occasional vs Frequent | .019 | r = 0.30 | Medium | |
| Infrequent vs Occasional | .019 | r = 0.34 | Medium | |
| Stated Preference | Infrequent vs Frequent | < .001 | r = 0.59 | Large |
| Occasional vs Frequent | .005 | r = 0.36 | Medium | |
| Infrequent vs Occasional | .045 | r = 0.29 | Small |
Note. Tukey HSD for ANOVA routes (effect size Cohen’s d); Dunn’s test with Holm adjustment for Kruskal–Wallis routes (effect size rank-biserial r). Magnitude bands follow Cohen (1988). Comparisons are ordered within each construct by significance.
A pattern repeats across almost every construct: the large, reliable gap is between infrequent buyers and everyone else, while occasional and frequent buyers rarely differ. Willingness to pay is the exception, separating all three groups and rising steadily from 2.00 to 2.47 to 3.03. Money is the thing that keeps discriminating even among people who already buy.
Sensitivity analysis
Table 8 retains the naive ANOVA as a sensitivity check, comparing what a blanket ANOVA would have concluded against the assumption-matched route.
| Construct | ANOVA F | ANOVA p | Primary routep(FDR) | Conclusion |
| Environmental Awareness | 11.71 | < .001 | < .001 | Agrees |
| Product Quality Perception | 6.08 | .003 | .005 | Agrees |
| Social Norms | 6.60 | .002 | .004 | Agrees |
| Green Trust | 7.38 | .001 | .004 | Agrees |
| Marketing Exposure | 9.38 | < .001 | .002 | Agrees |
| Willingness to Pay | 10.74 | < .001 | .001 | Agrees |
| Stated Preference | 10.62 | < .001 | .001 | Agrees |
| Perceived Accessibility | 2.57 | .080 | .059 | Agrees |
| Moral Norms | 1.65 | .195 | .166 | Agrees |
| Price Barrier | 0.26 | .769 | .799 | Agrees |
| Perceived Affordability | 3.39 | .037 | .105 | Naive ANOVA gives a false positive |
Note. The two approaches agree on ten of eleven constructs and disagree on perceived affordability, where a blanket ANOVA returns p = .037 and would have been reported as significant, while the assumption-matched test plus FDR correction returns p = .105.
This is the concrete cost of the earlier method. Perceived affordability is not a real finding; it looked like one because the wrong test was applied to non-normal data and no correction was made across eleven tests. Testing assumptions before choosing a test is not a formality.
Demographic comparisons
Chi-square tests of independence were run between each demographic variable and purchase-frequency group (Table 9). None was significantly associated with purchase frequency; all effect sizes fell below .13. The three groups are demographically comparable, which means the attitudinal differences above are unlikely to be demographic artefacts in disguise. This should not be over-read as evidence that demographics do not matter for green consumption generally — the sample is too homogeneous to test that.
| Demographic | χ² | df | p | Cramér’s V | Assumption check |
| Gender (M / F) | 1.01 | 2 | .605 | .088 | Assumptions met |
| Age group | 1.28 | 4 | .864 | .070 | Assumptions met |
| Income (≤₹10 / >₹10 lakh) | 0.08 | 2 | .960 | .026 | Assumptions met |
| Occupation | 3.84 | 4 | .428 | .121 | 3/9 expected cells < 5 |
| Location (Urban / Rural) | 1.61 | 2 | .447 | .111 | 3/6 expected cells < 5 |
Note. Categories were collapsed where necessary to satisfy the expected-frequency assumption (no more than 20% of expected cells below 5). Occupation and location still violate it and are indicative only. Cramér’s V bands: .10 small, .30 medium, .50 large.
Discussion
Restatement of key findings
Among 132 urban Indian consumers, what separated frequent buyers of sustainable products from infrequent ones was not moral conviction. The most informative result is a null one: moral norms did not differ across groups (p = .166), and every group scored around 4.0 out of 5. The people who almost never buy sustainable products feel exactly as personally responsible for the environment as those who buy often. This is the value–action gap stated as a number. The gap is not a motivational deficit — nobody in this sample needs persuading that environmental protection is their responsibility. Campaigns built on moral appeal are therefore aimed at a problem that, in this group, does not exist.
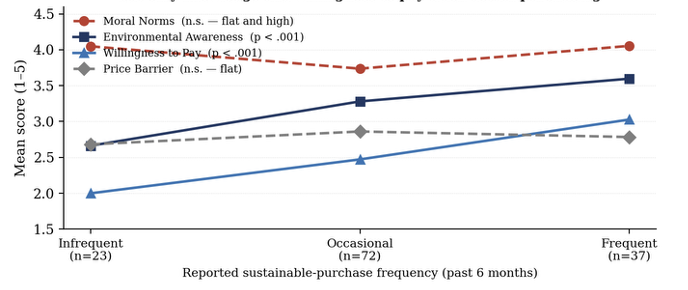
What does separate the groups is knowledge, trust, and willingness to pay. Awareness produced the largest effect, green trust followed, and willingness to pay discriminated all three groups on its own. This is consistent with the finding that eco-label knowledge converts into behaviour only when it produces trust13, and with the account of how greenwashing corrodes that trust12
Implications: price is felt, but it is not what divides people
The price results deserve care, because two similar-sounding constructs behaved completely differently. The perceived price barrier did not differ across groups (p = .799): everyone finds sustainable products expensive to roughly the same degree. Willingness to pay a premium, by contrast, was one of the strongest discriminators. These are not the same thing, and the failure of the two-item affordability composite (α = .262) is itself evidence of that. Recognising that a product costs more is a perception; deciding to pay it anyway is a choice. The gap between buyers and non-buyers lies in the second. Lowering prices might help, but so might giving people a reason to think the premium is worth paying.
Across nearly every construct the significant contrasts involved the infrequent group, while occasional and frequent buyers rarely differed. This suggests a threshold: once a consumer starts buying at all, further increases in frequency are not matched by proportionate increases in awareness or trust. The psychological distance between never and sometimes is larger than the distance between sometimes and often. Willingness to pay is the one construct that keeps separating groups all the way up — so the intervention that moves people from zero to some (informational) differs from the one that moves them from some to many (financial).
Connection to objectives and the Indian context
The objectives were met for the primary hypothesis and for six of 10 exploratory ones. Two features of the Indian market bear on the results. Cost orientation: Indian consumers respond to sustainability framed as long-run saving more than as carbon virtue, and price sensitivity moderates green purchase relationships in Indian samples11, consistent with our willingness-to-pay finding. Collectivism: our social-norms composite differed significantly across groups, fitting the collectivist orientation documented in Indian consumers28. But the deep rooted frugality and the north–south divide described in the introduction sit beyond what our instrument can see. Traditional reuse and repair may produce environmentally beneficial behaviour for reasons of thrift rather than conviction, and status-driven northern purchasing responds to different appeals than conformity-driven southern purchasing. We measured neither region nor cultural orientation, so we flag these as the clearest gaps for a broader study.
Recommendations
Future work should follow the same consumers over time, recruit across rural and low-income groups, stratify by region to test the north–south axis, use validated multi-item scales, and where possible verify purchases against records rather than recall. The practical reading, scoped strictly to this sample, is that appeals to environmental duty are unlikely to shift behaviour, because the duty is already felt; interventions that build specific knowledge, make environmental claims credible, and change willingness to pay have more room to work. The methodological reading is narrower but perhaps more useful: when assumption-matched tests were compared against a blanket ANOVA, one finding evaporated. In a field that often reports single-item measures and untested ANOVAs, that one disappearing result is the strongest argument the study can make for doing the arithmetic carefully.
Limitations
Several limitations apply. The study consists of self-reported behaviour. The grouping variable is what respondents say they bought, not what they bought, and environmentally desirable behaviour is over-reported. Purchase records would be far stronger evidence. The sample was selected through convenience sampling. Recruitment was through email and messaging; the sample is urban, educated, and online, and cannot be treated as representative of Indian consumers. It has a cross-sectional design. All measures were taken at one moment, so no causal claim is possible — awareness may produce purchasing, or purchasing may produce awareness. There are single-item measures in the study. Six of eleven constructs rest on one question each; their results are exploratory and should be replicated with validated multi-item scales. There are two composites with weak reliability. Marketing exposure (α = .488) and perceived accessibility (α = .407) fall below threshold; the significant marketing-exposure result in particular needs replication. There are unequal group sizes. The infrequent group (n = 23) is much smaller than the occasional group (n = 72); non-parametric tests handle this better than ANOVA, but precision is still reduced. At N = 132 the study has only 16% power to detect a small effect, so the nulls for moral norms and the price barrier mean “no detectable difference”, not “no difference”.This highlights the power of small effects. The study does not tap into cultural or regional variables. Caste, religion, language, and region were not collected, so the north–south axis central to Indian consumption could not be tested, and the single urban milieu could not support such a comparison even if it had been.
Closing Thought
The real gap between conventional and sustainable consumers is not that one group cares more about the environment or feels more social pressure to act green. It is that they see the product differently. Closing this perceptual gap, by making sustainable product quality visible, verifiable, and credible , may matter far more for the long-term growth of green consumer markets than any single price or messaging intervention alone.
Acknowledgement
The author thanks all survey respondents for their time and participation.
References
- K. J. Lancaster. A new approach to consumer theory. Journal of Political Economy. Vol. 74, pg. 132–157, 1966. [↩] [↩]
- I. Ajzen. The theory of planned behavior. Organizational Behavior and Human Decision Processes. Vol. 50, pg. 179-211, 1991, https://doi.org/10.1016/0749-5978(91)90020- . [↩]
- K. J. Lancaster. A new approach to consumer theory. Journal of Political Economy. Vol. 74, pg. 132-157, 1966, https://doi.org/10.1086/259131. [↩]
- M. J. Carrington, B. A. Neville, G. J. Whitwell. Why ethical consumers don’t walk their talk: towards a framework for understanding the gap between the ethical purchase intentions and actual buying behaviour of ethically minded consumers. Journal of Business Ethics. Vol. 97, pg. 139-158, 2010, https://doi.org/10.1007/s10551-010-0501-6. [↩]
- M. Wiederhold, L. F. Martinez. Ethical consumer behaviour in Germany: the attitude-behaviour gap in the green apparel industry. International Journal of Consumer Studies. Vol. 42, pg. 419-429, 2018, https://doi.org/10.1111/ijcs.12435. [↩]
- Management Review Quarterly editorial collective. Not all who proclaim to be green are really green: analysis of intention-behaviour gap through a systematic review of literature. Management Review Quarterly. Vol. 75, pg. 1-34, 2024, https://doi.org/10.1007/s11301-024-00415-2. [↩]
- O. N. Patiño-Toro, A. Valencia-Arias, L. Palacios-Moya, H. Uribe-Bedoya, J. Valencia, W. Londoño, A. Gallegos. Green purchase intention factors: a systematic review and research agenda. Sustainable Environment.Vol. 10, pg. 2356392, 2024, https://doi.org/10.1080/27658511.2024.2356392 . [↩]
- S. Bamberg, G. Möser. Twenty years after Hines, Hungerford, and Tomera: a new meta-analysis of psycho-social determinants of pro-environmental behaviour. Journal of Environmental Psychology. Vol. 27, pg. 14-25, 2007, https://doi.org/10.1016/j.jenvp.2006.12.002 . [↩]
- B. Kumar, A. K. Manrai, L. A. Manrai. Purchasing behaviour for environmentally sustainable products: a conceptual framework and empirical study. Journal of Retailing and Consumer Services. Vol. 34, pg. 1-9, 2017, https://doi.org/10.1016/j.jretconser.2016.09.004 . [↩]
- V. Pardeshi, H. Pardeshi, V. T. Khanna. Impact of environmental knowledge, past sustainable behavior and social influence on sustainable apparel purchase intention with price consciousness as moderating variable. Vision: The Journal of Business Perspective. pg. 1-14, 2024, https://doi.org/10.1177/09711023241292475. [↩]
- M. Riyaz, A. Jan, D. Khan, A. Zahoor. Determinants of purchase intention for green consumer durables: investigating the moderating role of price sensitivity. Vikalpa: The Journal for Decision Makers. pg. 1-16, 2025, https://doi.org/10.1177/22786821241264593. [↩] [↩]
- Y.-S. Chen, C.-H. Chang. Greenwash and green trust: the mediation effects of green consumer confusion and green perceived risk. Journal of Business Ethics. Vol. 114, pg. 489-500, 2013, https://doi.org/10.1007/s10551-012-1360-0. [↩] [↩]
- T. Mai. The pathways from eco-label to green purchase behavior: the roles of eco-label credibility, knowledge, attitude, and trust. Business Strategy & Development. Vol. 9, pg. e70274, 2026, https://doi.org/10.1002/bsd2.70274. [↩] [↩]
- K. Margariti, L. Hatzithomas, C. Boutsouki. Elucidating the gap between green attitudes, intentions, and behavior through the prism of greenwashing concerns. Sustainability. Vol. 16, pg. 5108, 2024, https://doi.org/10.3390/su16125108. [↩]
- J. Shi, Z. Jiang. Willingness to pay a premium price for green products: does a reference group matter? Environment, Development and Sustainability. Vol. 25, pg. 8699-8727, 2023, https://doi.org/10.1007/s10668-022-02419-y. [↩]
- Y. Joshi, Z. Rahman. Factors affecting green purchase behaviour and future research directions. International Strategic Management Review. Vol. 3, pg. 128-143, 2015, https://doi.org/10.1016/j.ism.2015.04.001. [↩]
- S. H. Schwartz. Normative influences on altruism. Advances in Experimental Social Psychology. Vol. 10, pg. 221-279, 1977, https://doi.org/10.1016/S0065-2601(08)60358-5. [↩]
- O. Fatoki. Determinants of green purchase behaviour of university students in South Africa. Economics and Environment. Vol. 86, pg. 556-582, 2023, https://doi.org/10.34659/eis.2023.86.3.652. [↩]
- R. Yadav, G. S. Pathak. Young consumers’ intention towards buying green products in a developing nation: extending the theory of planned behavior. Journal of Cleaner Production. Vol. 135, pg. 732-739, 2016, https://doi.org/10.1016/j.jclepro.2016.06.120. [↩]
- J. C. Nunnally, I. H. Bernstein. Psychometric theory. 3rd ed. McGraw-Hill, 1994. [↩]
- S. S. Shapiro, M. B. Wilk. An analysis of variance test for normality (complete samples). Biometrika. Vol. 52, pg. 591-611, 1965, https://doi.org/10.1093/biomet/52.3-4.591. [↩]
- H. Levene. Robust tests for equality of variances. In I. Olkin (Ed.), Contributions to Probability and Statistics. pg. 278-292, Stanford University Press, 1960. [↩]
- W. H. Kruskal, W. A. Wallis. Use of ranks in one-criterion variance analysis. Journal of the American Statistical Association. Vol. 47, pg. 583-621, 1952, https://doi.org/10.1080/01621459.1952.10483441. [↩]
- O. J. Dunn. Multiple comparisons using rank sums. Technometrics. Vol. 6, pg. 241-252, 1964, https://doi.org/10.1080/00401706.1964.10490181. [↩]
- J. W. Tukey. Comparing individual means in the analysis of variance. Biometrics. Vol. 5, pg. 99-114, 1949, https://doi.org/10.2307/3001913. [↩]
- Y. Benjamini, Y. Hochberg. Controlling the false discovery rate: a practical and powerful approach to multiple testing. Journal of the Royal Statistical Society: Series B. Vol. 57, pg. 289-300, 1995, https://doi.org/10.1111/j.2517-6161.1995.tb02031. [↩]
- J. Cohen. Statistical power analysis for the behavioral sciences. 2nd ed. Lawrence Erlbaum Associates, 1988. [↩] [↩]
- N. Kumar, D. Mohan. Sustainable apparel purchase intention: collectivist cultural orientation and price sensitivity in extended TPB model. Journal of Revenue and Pricing Management. Vol. 20, pg. 149-161, 2021, https://doi.org/10.1057/s41272-021-00297-z. [↩]