Abstract
Eutrophication is one of the most problematic processes that happen as a result of human activity. By searching and analyzing scientific literature, this paper summarizes the effect of eutrophication on marine ecosystems, with a particular focus on coastal regions. Although eutrophication has been thoroughly reviewed, the specific impacts of wastewater have not been. This review addresses that gap by focusing on wastewater-driven eutrophication in coastal marine systems. The paper covers the causes and effects of eutrophication through wastewater composition and its effects on coastal marine ecosystems. It identifies wastewater discharge as a major contributor to nutrient loading, highlighting nitrogen as the primary pollutant driving eutrophic conditions. Over the past century, eutrophication has intensified globally due to increasing anthropogenic waste. The paper explores the key mechanisms behind eutrophication, such as explaining how these processes lead to the formation of a hypoxic “dead zone”. It also explores things such as water stratification, a process that can intensify the effects of eutrophication on marine life. These zones have far-reaching ecological consequences, disrupting food webs and affecting a wide range of organisms, including jellyfish, crabs, and fish. These effects of eutrophication spread with the trophic cascade, harming land animals as well. In order to prevent eutrophic effects, a wide range of mitigation methods can be implemented. Such methods include management of septic systems and making sure wastewater is treated. Eutrophication, caused by wastewater, can have drastic effects on any ecosystem. Future research can help reduce eutrophication around the planet, creating a healthier world.
Keywords: Coastal Marine Ecosystems, Eutrophication, Dead Zones, Wastewater, Algal Blooms
Introduction
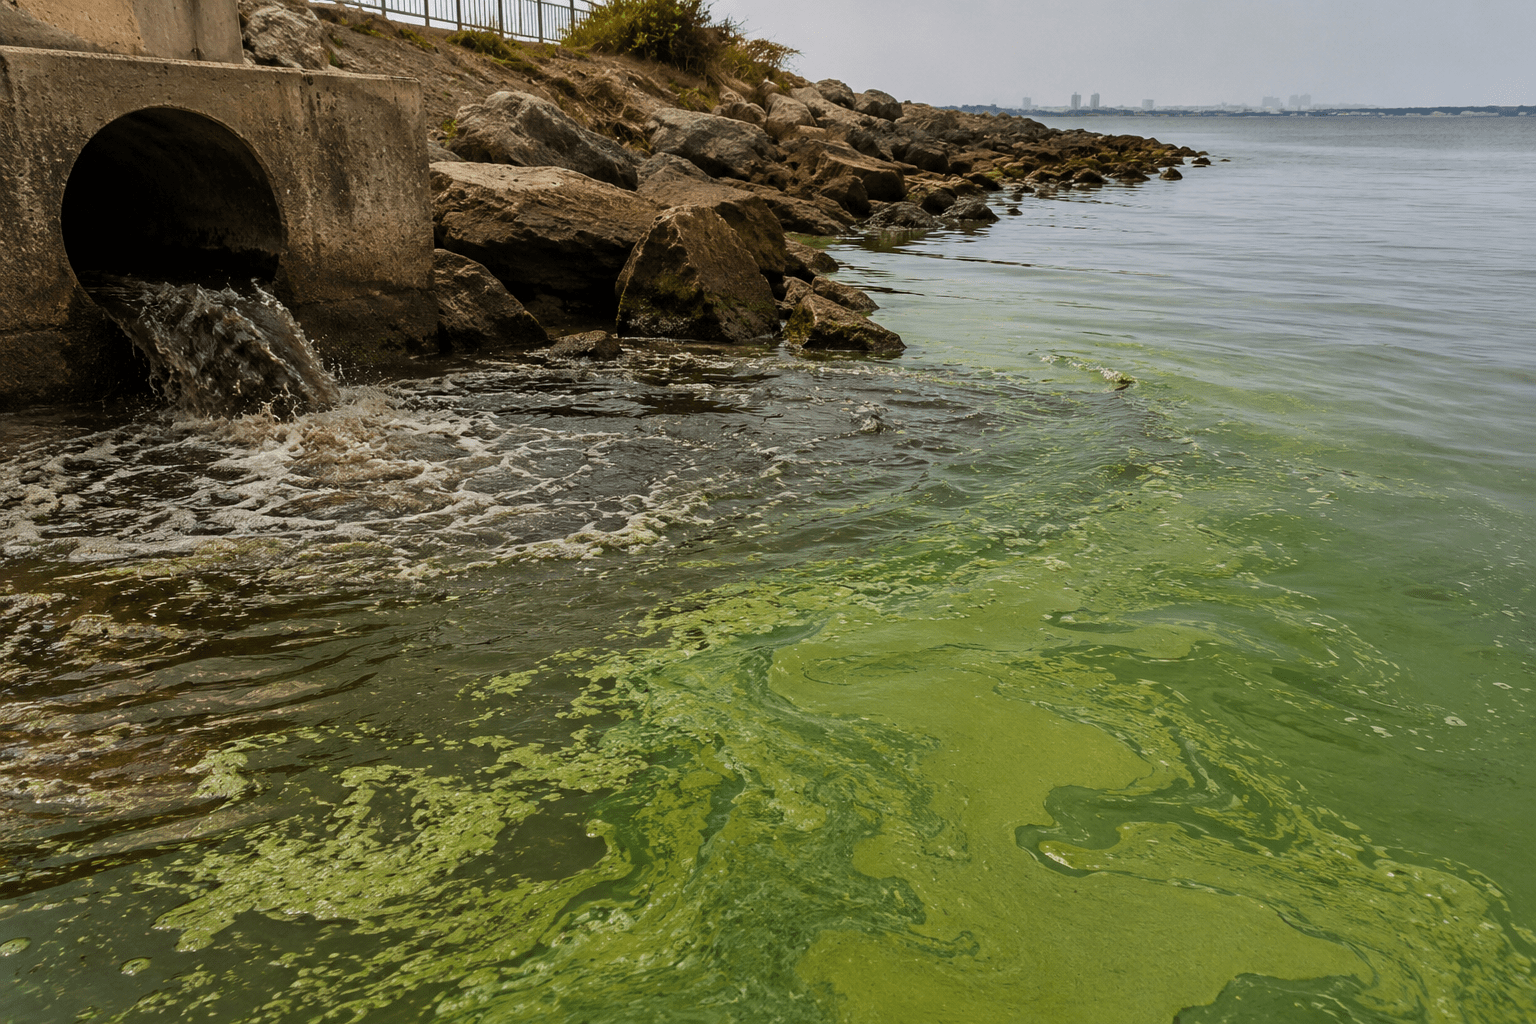
Industrial development has significantly increased the volume of wastewater runoff into marine ecosystems. In 2022, an estimated 113 billion cubic meters of untreated wastewater were discharged into the environment1. Nitrogen, the primary pollutant that drives eutrophication, is highly concentrated in this wastewater. As a result, this influx of wastewater contributes to anthropogenic eutrophication, a process in which excess nutrients accumulate in a body of water2 and promote excessive growth of plant life, particularly algae. While nutrient cycling is essential to the health and functioning of marine ecosystems, elevated nutrient levels can disrupt this balance and trigger eutrophication. The resulting overgrowth of plant life depletes oxygen in the water, leading to the formation of hypoxic “dead zones”. A body of water is considered hypoxic when dissolved oxygen levels fall below 2 -3 mg/L3.
Dead zones in marine ecosystems can lead to the widespread death of aquatic organisms, particularly benthic species such as crabs that inhabit the seabed. While dead zones can occur in various marine ecosystems, they are most commonly found in coastal ecosystems due to their proximity to human activity. Coastal areas, such as the Chesapeake Bay, are vulnerable to eutrophication because of their proximity to human activity. This causes the impacts in this region to be especially severe.
Eutrophication has been extensively reviewed in the past, most papers treating all nutrient inputs as a combined total. Therefore, there is little existing literature that isolates the contribution of wastewater to the nutrient load. This paper focuses on the impacts of eutrophication in coastal ecosystems, as they provide some of the clearest examples of how nutrient overloading can destabilize marine environments. The paper will begin by outlining the primary causes and mechanisms of eutrophication, including wastewater discharge and the formation of dead zones. It will then analyze the environmental consequences of eutrophication, with a particular emphasis on global dead zone occurrences. Finally, the paper will explore the effects on marine life and conclude with a brief discussion of strategies for mitigating and preventing eutrophication.
Methods
This paper used a literature review method. Databases such as Google Scholar and the National Library of Medicine were queried for English language literature using the following key words: eutrophication, anthropogenic waste, wastewater, algal bloom. Sources were classified into two categories of acceptable references. Primary reputable sources were defined as peer-reviewed research articles in scientific databases such as PubMed or Web of Science. Secondary reputable sources were defined as publications, datasets, and program documents from established government and intergovernmental agencies. Such secondary sources include the U.S. Environmental Protection Agency, the National Oceanic and Atmospheric Administration, and the Chesapeake Bay Foundation. If available, data and trends were obtained from primary reputable sources, with secondary reputable sources used sparingly for some statistics and definitions. A small number of tertiary sources were used only for general definitions of well-established concepts where primary sources provided equivalent information. Relatedness was determined by topic relevance to wastewater-driven eutrophication and to coastal or estuarine marine ecosystems, with article abstracts screened to confirm both topical fit and methodological rigor. Papers older than 25 years were excluded unless they provided foundational data and are commonly cited by modern papers.
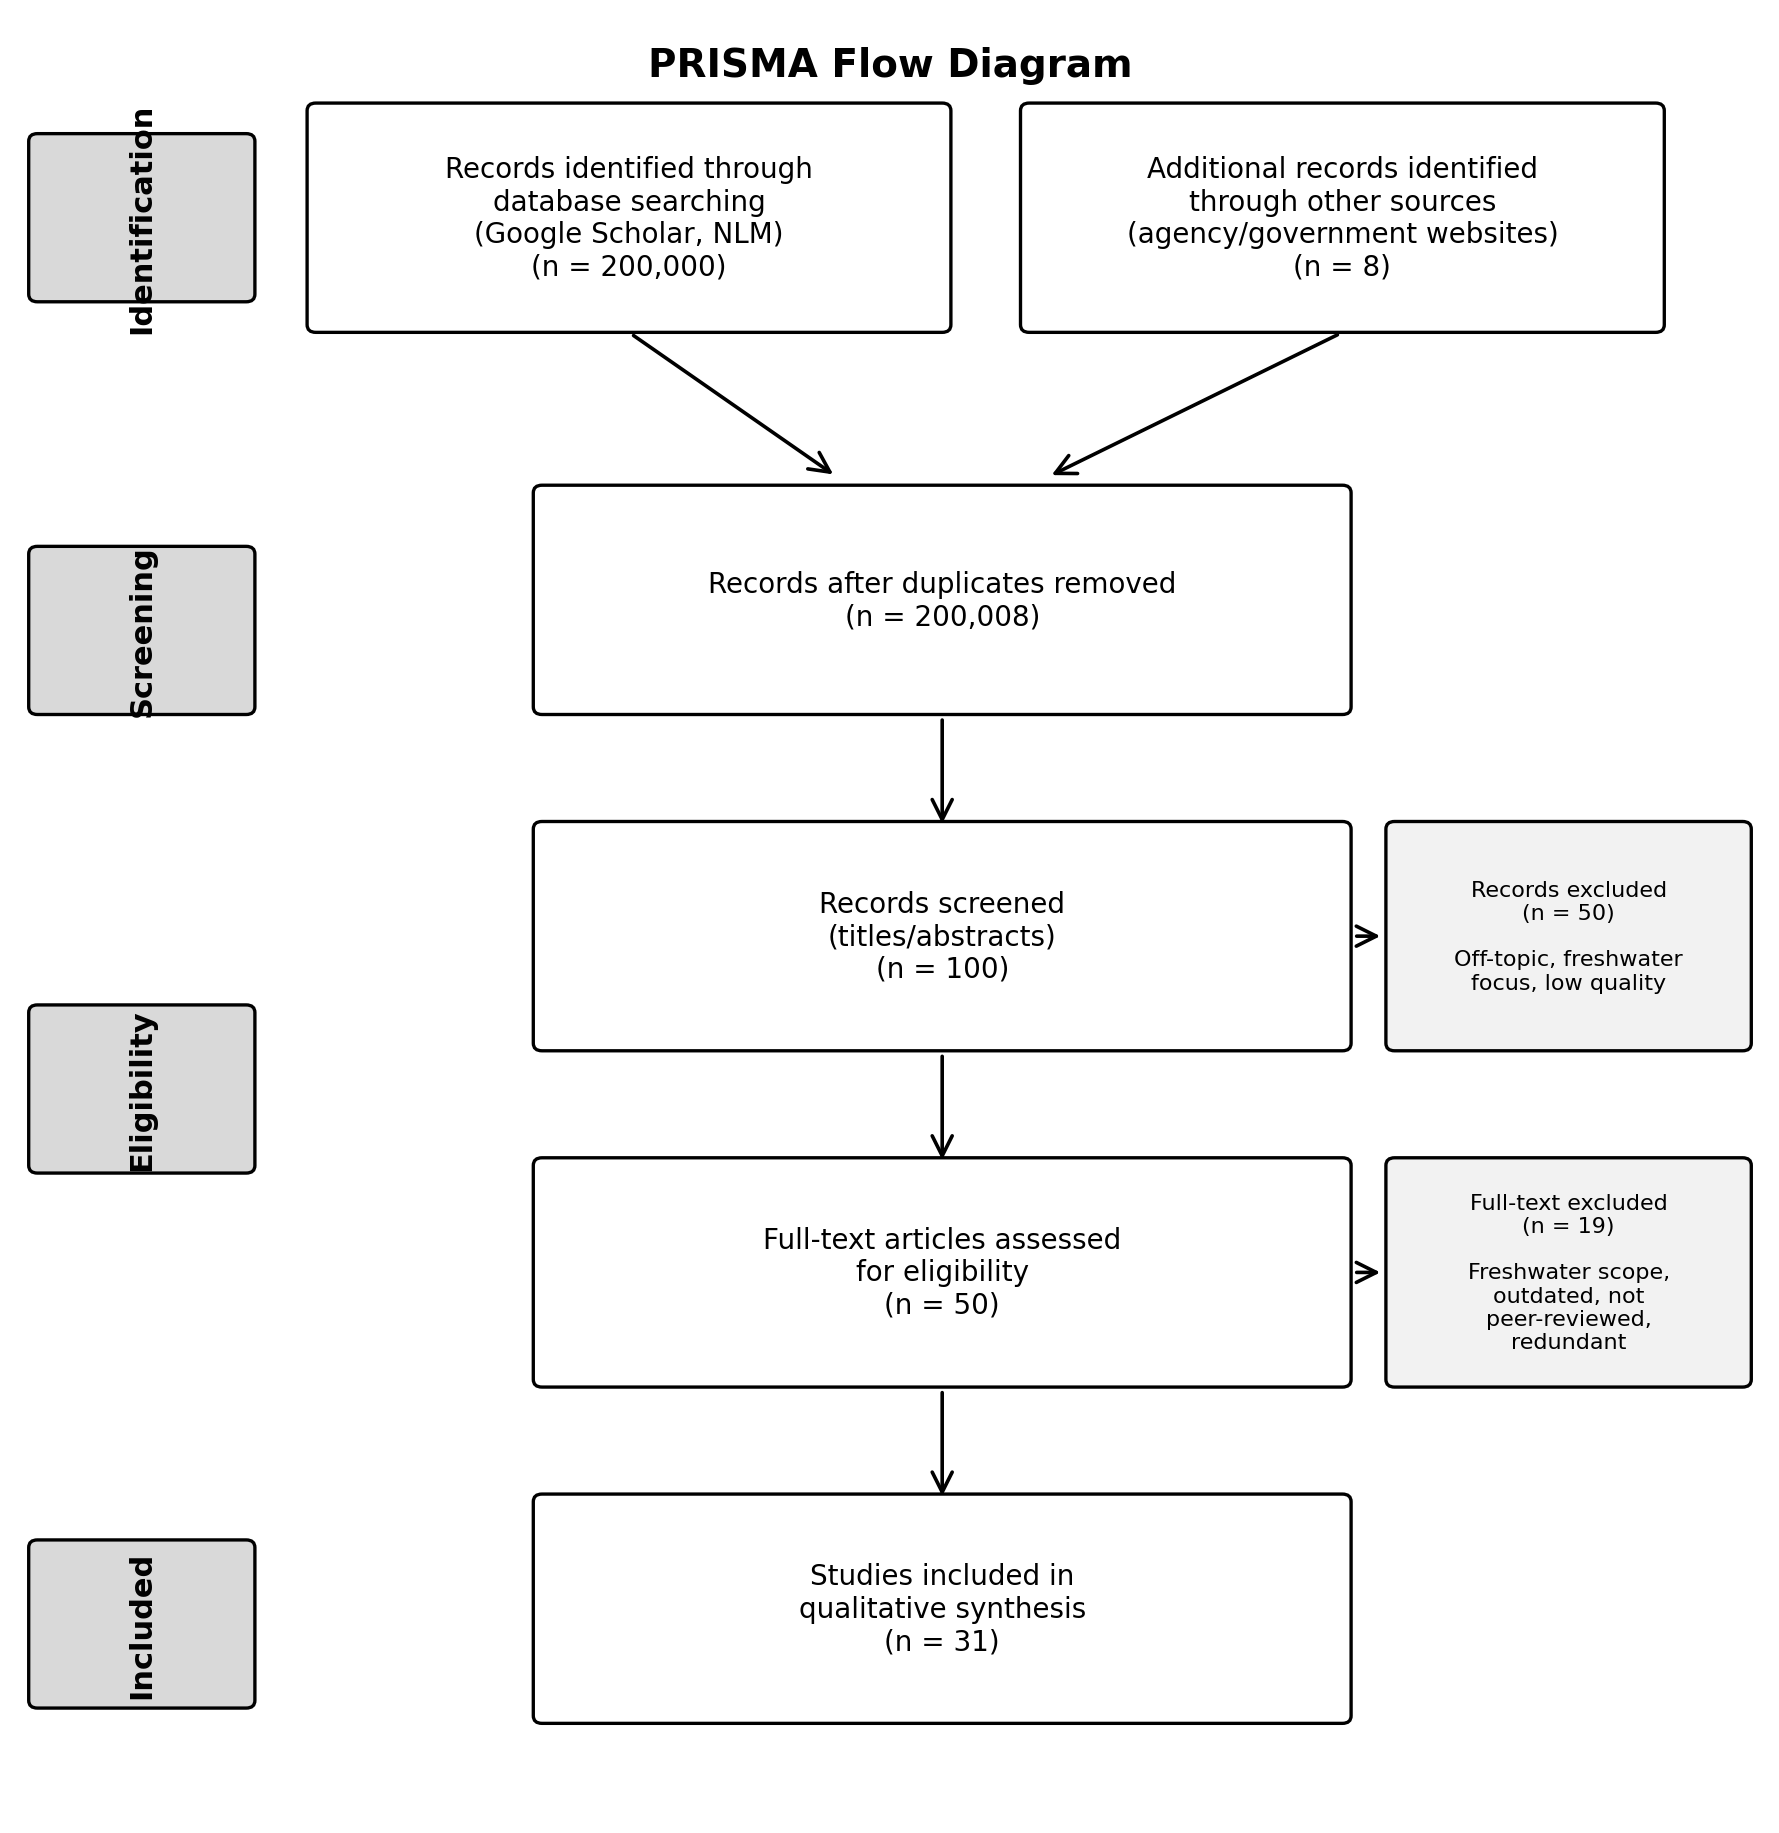
The PRISMA diagram below summarizes how the screening process was done. Initial database searches in Google Scholar and the National Library of Medicine specific key words yielded about 200,000 results. Eight additional sources were identified through direct visits to government and intergovernmental agency websites. After looking at titles and abstracts, 100 remaining papers were screened further and reduced to roughly 50 papers for being off topic. The remaining fifty articles were then checked to be relevant, many being removed because of similarities to other papers or outdated quantitative claims. Ultimately, thirty one studies were included in the final review.
Results
Causes and Mechanisms of Eutrophication
Coastal eutrophication is driven by anthropogenic nutrient inputs from multiple sources, mainly agricultural runoff (from fertilizers and animal manure), municipal wastewater discharge, and atmospheric deposition of reactive nitrogen from fossil fuel combustion4. The relative importance of each source varies by region. Agricultural runoff typically dominates nitrogen loading in areas with intensive farming, while municipal wastewater is a leading contributor in densely populated coastal regions, particularly where treatment infrastructure is limited4. This review concentrates on wastewaters contribution to coastal eutrophication while recognizing that overall nutrient loading reflects the combined effect of multiple anthropogenic causes.
Wastewater is the most significant contributor to nitrogen and phosphorus pollution in aquatic environments. Common sources include cesspools and septic systems, which often release untreated or partially treated effluent. Direct discharge of untreated municipal wastewater introduces concentrated nutrient and pathogen loads into receiving waters, with documented degradation of surface water quality following discharge events5. Globally, approximately 48% of the total volume of global wastewater production is discharged into the environment without adequate treatment. The amount of treated wastewater skews heavily based on the developmental status of the country. Treated wastewater reaches about 80% of all produced wastewater in North America and Europe, while the number dips as low as 25% in Sub-Saharan Africa and Central/Southern Asia6. In 2018, wastewater alone was estimated to have released around 9 ×10⁹ kg N yr–1 into natural ecosystems4. While the composition of wastewater varies by region, nitrogen concentrations typically range from 20-85 mg/L7. For example, at the Penrith Water Recycling Plant in Australia, Nitrogen was found to have an average concentration of 80.7 mg/L, making it the most prevalent pollutant in wastewater. Phosphorus, another key nutrient that drives eutrophication, also appeared in high concentrations, ranking second in abundance (Table 1). With industrial development, nutrient levels in water have risen dramatically. Among these, nitrogen is widely recognized as the primary nutrient driving eutrophication. In marine ecosystems, nitrogen most commonly exists in the forms of nitrate (NO₃⁻), ammonium (NH₄⁺), and nitrite (NO₂⁻), while phosphorus is typically found as phosphate (PO₄³⁻). Regardless of the specific chemical form, excessive concentrations of these nutrients can cause eutrophication.
| Pollutant | Average concentration (mg/L) |
| Nitrogen (total) | 80.7 |
| Phosphorus (total) | 13.43 |
| Aluminum | 7.91 |
| Copper | 0.30 |
| Iron | 5.90 |
| Zinc | 0.91 |
Note: Some insignificant pollutants not listed. Nitrogen and phosphorus levels included all types.
Although nitrogen and phosphorus are both essential for primary production, their relative importance as limiting nutrients differs systematically between aquatic environments. In freshwater lakes, multiple experiments have identified Phosphorus as the primary nutrient cause of eutrophication. The experiments showed reductions in phosphorus reliably reversing eutrophication9. In coastal marine ecosystems, eutrophication is primarily nitrogen-limited, which is attributed to higher rates of denitrification, sulfate inhibition of biological nitrogen fixation, and the rapid removal of phosphorus through adsorption to marine sediments10. This is why the review has an emphasis on nitrogen as the primary pollutant in regards to coastal marine ecosystems. Exceptions to this generalization do exist: low-salinity regions such as the Baltic Sea can support nitrogen-fixing cyanobacteria and shift toward phosphorus or co-limitation, and many estuaries experience seasonal switches between nitrogen and phosphorus limitation10. For this reason, current consensus is that managing both phosphorus and nitrogen are the favored approach when controlling eutrophication11.
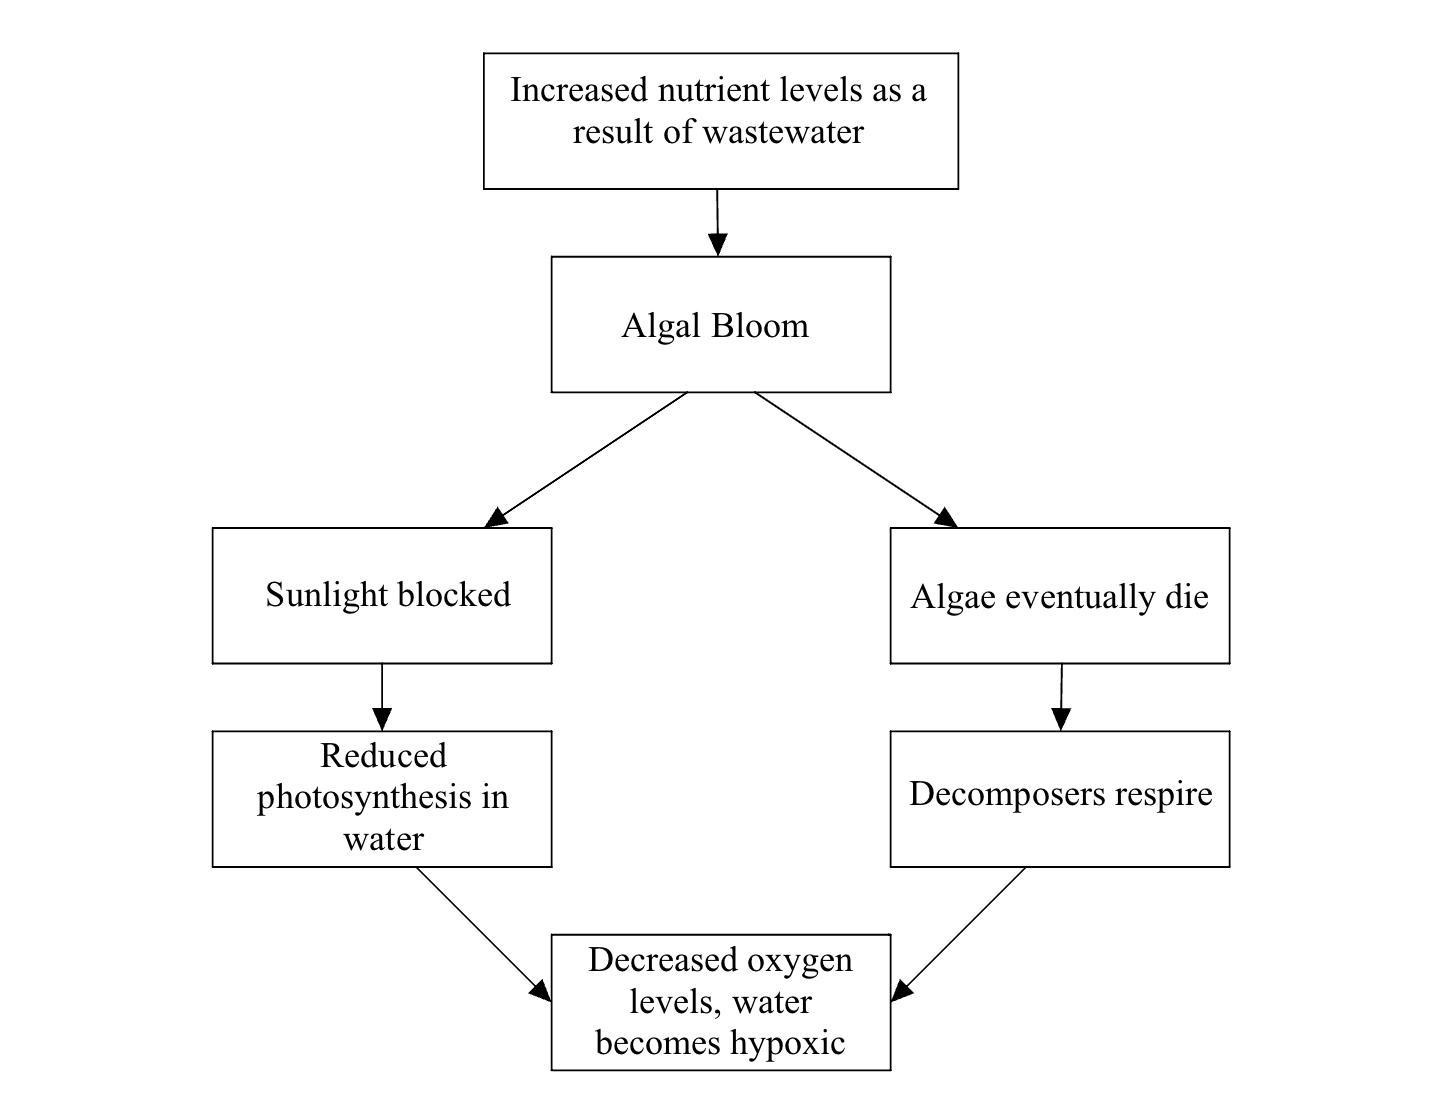
But how does eutrophication lead to decreased oxygen levels? The process begins when nitrogen and phosphorus from sources such as wastewater enter a water body. Both nutrients are important for the growth of photosynthetic organisms and have been shown to significantly increase their abundance in aquatic ecosystems. For example, a study of Chinese lakes found a strong positive correlation between total nitrogen (TN) and chlorophyll-a (Chla) levels, the latter being a key indicator of photosynthetic activity12. High levels of chlorophyll-a suggest algal blooms and dense populations of other photosynthetic organisms. Although it might seem that more photosynthetic organisms would increase oxygen levels, this effect is temporary. The critical drop in oxygen occurs during the decomposition of the algae. When the algae die, bacteria decompose the organic matter through aerobic respiration, consuming large amounts of dissolved oxygen in the process. Given the short lifespan of algae, large blooms are quickly followed by large-scale decomposition, leading to oxygen depletion-often resulting in hypoxic or anoxic conditions. While eutrophication is a natural process that can occur over natural geological timescales, human activities—particularly the discharge of nutrient-rich wastewater—greatly accelerate it and pose a significant threat to the stability of aquatic ecosystems.
Note: A dead zone is a zone of hypoxic water.
Impacts of Eutrophication
Environmental Effects of Eutrophication
One of the main environmental impacts of eutrophication is the formation of dead zones, also known as hypoxic zones. These are areas in aquatic systems where dissolved oxygen levels fall below 2-3 milligrams per liter, rendering the environment uninhabitable for most marine life. Rare anoxic zones do not accumulate often13, but they can have an even more severe effect on the surrounding environment. In these zones, the state of deoxygenation reaches near zero-oxygen levels14.
In recent years, global levels of dissolved nitrogen have risen substantially, coinciding with a rise in the occurrence and severity of hypoxic zones worldwide. Coastal ecosystems are particularly vulnerable due to their proximity to nutrient sources from land-based human activity. A study of over 15,000 rivers globally found that more than 10% exhibited hypoxic conditions, highlighting the widespread nature of the problem15. These dead zones are closely linked to eutrophication, as excessive nutrient input, especially nitrogen, triggers the chain of events that depletes oxygen.
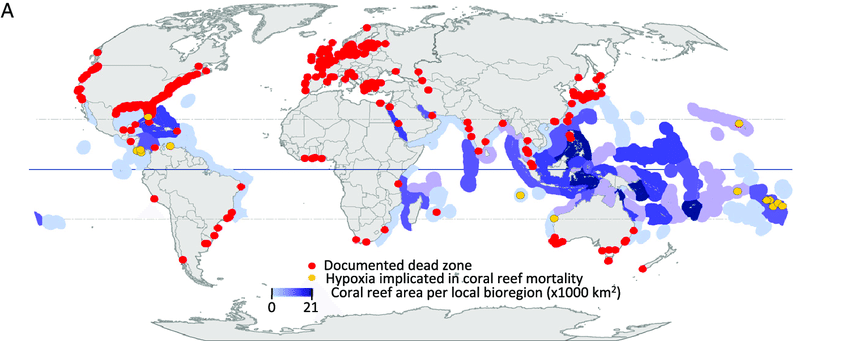
As shown by Figure 2, dead zones are distributed across the globe, with the highest concentrations found along coastlines. This distribution reflects the flow of nutrients from agricultural runoff, wastewater discharge, and other land-based sources. Areas with intense human activity, such as the coasts of Europe and North America, exhibit the highest density of dead zones. These zones consistently show dissolved oxygen levels below 2-3 mg/L, reinforcing their direct association with anthropogenic eutrophication16.
Note: Global map with all known dead zones (red dots) and coral reefs where hypoxia has been implicated in mass mortality of reef organisms (gold dots).
In many regions, the effects of eutrophication are worsening with time. The amount of hypoxic zones are increasing at a global scale. The number of dead zones has approximately doubled every decade from the 1960s to 200817. These documented dead zones have increased from roughly 10 recorded sites in the 1960s to over 500 in 201818. In the Baltic Proper, a sub-region of the Baltic Sea, hypoxic areas covered an average of 24% of the area, or approximately 60,600 square km in 201819. This marked the highest extent of hypoxia since 196019. The Baltic Sea as a whole is one of the most affected bodies of water globally, with some of the largest and most persistent dead zones. The volume of hypoxic water in the region continues to grow, driven largely by wastewater runoff from surrounding countries. This case serves as a stark example of the global rise in hypoxia and its escalating ecological consequences.
Effects of Eutrophication on Marine Life
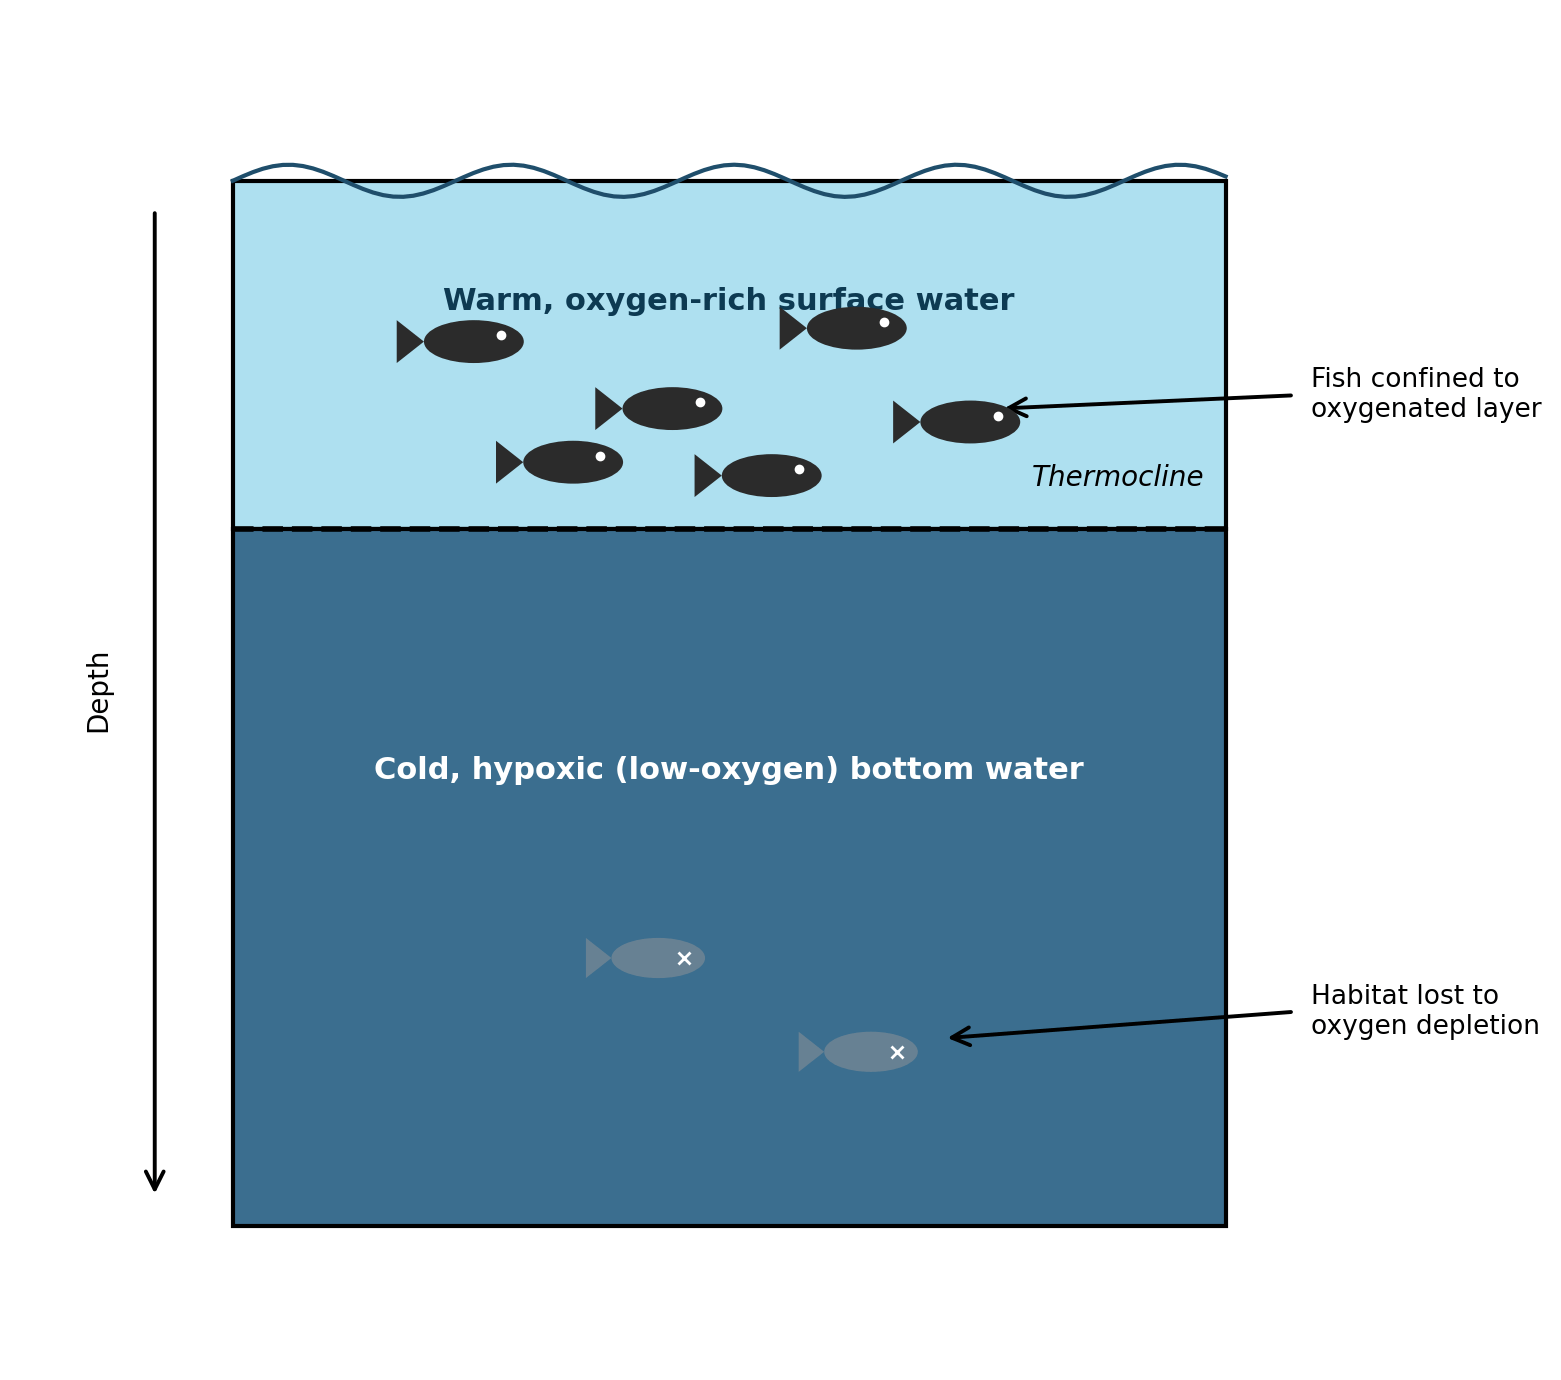
Eutrophication-induced dead zones can have a severe impact on organisms inhabiting affected regions. The excess nutrients introduced into these systems may benefit certain species, such as algae and jellyfish, while harming other species, such as fish and crabs. This imbalance can create an imbalance in ecosystem stability and reduce biodiversity. A key contributing process is stratification, which occurs when water separates into distinct layers. This is typically due to either temperature or salinity differences20. While hypoxic conditions can directly cause the death of aquatic organisms through oxygen deprivation, the impact is not always so direct. Stratification often limits mixing between oxygen-rich upper layers and deeper layers, low oxygen hypoxic zones being concentrated at the bottom. This reduced mixing can shrink the habitable zone for many species, particularly fish. As Wang20 explains, stratification is one of the primary mechanisms by which hypoxic zones affect fish populations. Species that are sensitive to warmer surface temperatures may be confined to the deeper, oxygen-poor layers, where they cannot survive. Conversely, species that tolerate higher temperatures may be excluded from deeper zones, reducing their available habitats. As shown in Figure 3, this restriction can significantly limit population sizes. As dead zones expand, the total amount of usable habitat decreases, which can pose a serious threat to the long-term survival of many marine species.
Aside from some producers and decomposers, eutrophication generally has detrimental effects on the larger ecosystem. In addition to algal blooms, eutrophication can also lead to jellyfish blooms—rapid population increases of jellyfish in a given area21. While hypoxic conditions are harmful or even lethal to most marine organisms, jellyfish are more tolerant of low-oxygen environments. This resilience allows them to survive and often thrive under conditions that would normally suppress or eliminate other species. Jellyfish gain a competitive advantage in hypoxic zones by occupying ecological niches left vacant by more sensitive species. In addition, some jellyfish benefit from eutrophication by feeding on plankton populations that proliferate in nutrient-rich waters. A study22 observed a close connection between human imprints on the environment and jellyfish hazards. They identified eutrophication as one of many multiple human imprints along with marine fisheries, sea surface temperature, and aquaculture production. This relationship indicates that eutrophication may contribute to more frequent jellyfish-related events. Although these effects may be beneficial for jellyfish populations individually, the broader consequences for ecosystem health are negative.
Impacts of Eutrophication on Terrestrial Life
The following impacts on birds, amphibians, and domestic animals are framed here as general consequences of eutrophication, primarily through food web disruption and exposure to cyanobacterial toxins, rather than as effects unique to wastewater-derived nutrients. These mechanisms commonly show up wherever eutrophication is severe, with documented examples drawn from systems affected by mixed nutrient sources. The effects of eutrophication extend beyond fully aquatic organisms, affecting a wide range of species that prey on aquatic organisms or are part of their life cycle. This includes piscivorous birds that feed on fish. As previously discussed, hypoxic conditions lead to declines in fish populations, which in turn reduce the food availability for piscivorous birds. This disruption in the food chain can negatively affect bird reproduction, survival rates, and overall population health. Amphibians are also particularly vulnerable to hypoxic zones because their eggs and larvae typically develop in water. The low dissolved oxygen levels can impair embryonic development, reduce hatching success, and increase mortality rates23. In addition, toxins released by cyanobacteria during algal blooms can accumulate and become toxic to household pets. The bioaccumulation of toxins can cause damage to the liver and central nervous system, typically affecting household animals24.
Effects of Eutrophication on the Food Chain
Disruption to population dynamics within an ecosystem can cause an imbalance in the food chain. This can trigger a trophic cascade, which is when changes at one trophic level cause ripple effects throughout the entire food web/chain, often dramatically changing the ecosystem25. For example, jellyfish blooms represent a significant disruption: the rapid population growth of jellyfish not only puts pressure on their prey species, such as zooplankton, but also negatively impacts their competitors that rely on the same food sources. This is true for any organism affected by eutrophication, such as crabs which have their food sources reduced.
The Chesapeake Bay: A Case Study
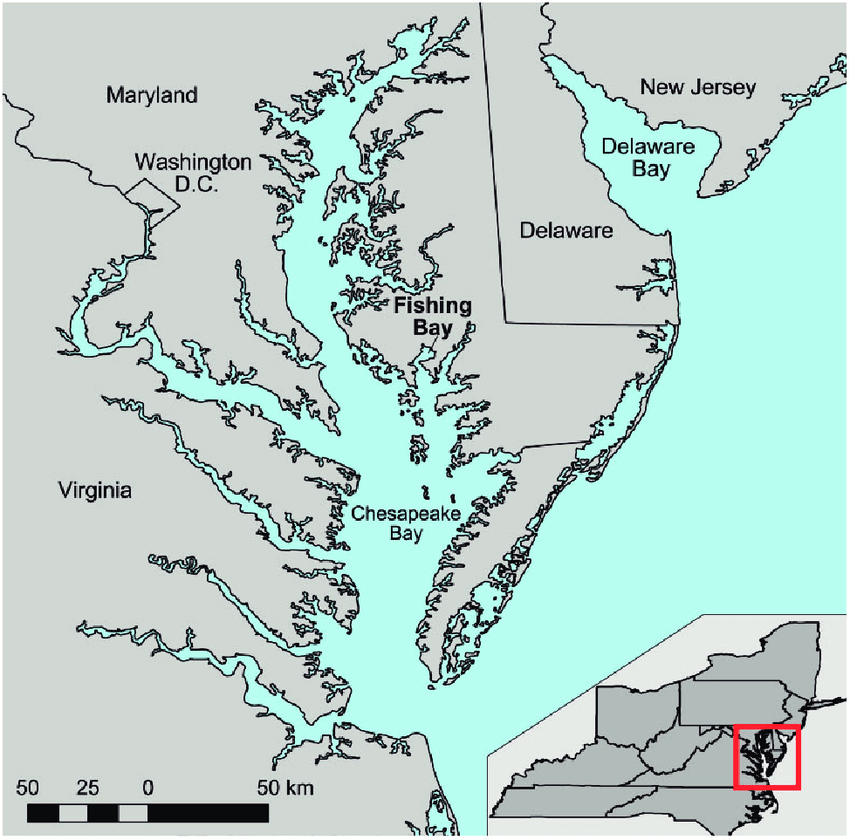
One specific example of an ecosystem harmed by eutrophication is Chesapeake Bay, the largest estuary in the United States. The bay’s location places it among the most severely affected by eutrophication. As shown by Figure 4, the bay is in close proximity to many heavily populated cities, such as Washington D.C. These cities allow for anthropogenic waste, a leading cause of eutrophication, to be deposited. In 2008, monitoring revealed that 40% of the bay was deficient in oxygen, the fourth highest level of hypoxia recorded since monitoring began in 198526. This steep decline in dissolved oxygen levels is largely attributed to nutrient pollution from wastewater. The bay is connected to numerous water sources, like rivers, including the Susquehanna River. The amount of nitrogen and phosphorus input from riverine sources was found to be much larger than direct precipitation in the bay4. In the southern part of the bay, widespread hypoxic conditions have led to the shrinkage of submerged grass beds, which are important habitats for many aquatic organisms. As these habitats disappear, the ecosystem becomes increasingly unstable.
One species particularly affected by these changes is the crabs, a key component of the Chesapeake Bay’s ecology and economy. While multiple factors play a role in the species’ decline, the Chesapeake Bay Foundation has identified eutrophication and low oxygen levels as one of the key causes26. Low oxygen levels can not only kill essential food sources for crabs, but also directly threaten their survival. One such threat is the shrinking of grass beds in the bay, the small patches leaving juvenile crabs more prone to predation, or even cannibalism27. Combined with overfishing, eutrophication has caused blue crab populations to decrease by the hundreds of millions and decrease their available food sources by about 10% from 1995 to 200826. In the bay’s 2025 survey, the surveyors reported a near 20 million adult male crab decrease from 2024 to 2025. Both adult and juvenile crab populations were well below the time series average(1990-2025), with adult male crabs being at an all time low. However, blue crab decline in the Chesapeake is widely understood to be multi-causal: fishing pressure, climate-driven warming, shoreline habitat loss, and disease have all been implicated alongside eutrophication in the species’ long-term trajectory27. The eutrophication-specific contribution operates primarily through hypoxia-driven loss of submerged grass beds, which juvenile crabs depend on as refuge from predation and cannibalism, and through reduction of benthic prey in oxygen-depleted bottom waters. The eutrophication-specific share therefore cannot be fully separated from co-occurring stressors without targeted statistical analysis. The continued expansion of hypoxic zones in the bay remains one of the primary causes behind these steep ecological declines.
Preventing and Mitigating Eutrophication
Since anthropogenic waste is the main cause of eutrophication, it can be directly mitigated by human intervention. Wastewater treatment and preventative measures can lead to decreased nutrient loading in the environment. In order to decrease nutrient loading in the environment, management of septic systems is necessary. In the United States, approximately 20% of homes use septic systems to locally treat wastewater, and about 10-20% of these septic systems experience failures somewhere in their lifetime29. Failure to maintain septic systems leads to the release of untreated wastewater into the environment. Simply mitigating the nutrient input into coastal watersheds can greatly reduce nutrient load in environments4. On a broader scale, mitigation efforts include reducing use of fertilizer and increasing the quantity and efficiency of wastewater treatment plans. These improvements will ensure that wastewater, if released, contains a lower concentration of nutrients.
Discussion
Eutrophication, being driven by nutrients from wastewater, can pose a serious threat to coastal marine ecosystems. It can threaten individual populations as well as the overall balance of the ecosystem. Human activity has caused an increased level of anthropogenic waste entering the environment. The dead zones that result from eutrophication have been shown to harm different ecosystems all around the world. Eutrophic processes such as water stratification directly harm organisms. Those affected include crabs, jellyfish, fish, and their entire ecosystems as a result of the trophic cascade. This paper has found eutrophication to be a negative influence on coastal ecosystems around the world, including the Chesapeake Bay. Should it continue, eutrophication will only further damage ecosystems around the world. To prevent this, further emphasis on reducing and mitigating eutrophication must happen. Future research on prevention and mitigation of eutrophication, analyzing the effectiveness of mitigation strategies will help to reduce the load eutrophication has on the world.
References
- UN Water. Progress on wastewater treatment – 2024 update. https://www.unwater.org/publications/progress-wastewater-treatment-2024-update (2024). [↩]
- National Oceanic and Atmospheric Administration. What is eutrophication? https://oceanservice.noaa.gov/facts/eutrophication.html [↩]
- National Oceanic and Atmospheric Administration. Low or depleted oxygen in a water body often leads to ’dead zones’—regions where life cannot be sustained. https://oceanservice.noaa.gov/news/jan18/dead-zones.html (2019). [↩]
- T. C. Malone, A. Newton. The globalization of cultural eutrophication in the coastal ocean: Causes and consequences. Frontiers in Marine Science. 7, 670 (2020). [↩] [↩] [↩] [↩] [↩]
- M. Preisner. Surface water pollution by untreated municipal wastewater discharge due to a sewer failure – environmental processes. Environmental Process. 7, 767-780 (2020). [↩]
- E. R. Jones, M. T. H. van Vliet, M. Qadir, M. F. P. Bierkens. Country-level and gridded estimates of wastewater production, collection, treatment and reuse. Earth System Science Data. 13, 237–254 (2021). [↩]
- U.S. Environmental Protection Agency. Wastewater technology fact sheet: Ammonia removal. https://nepis.epa.gov/Exe/ZyPURL.cgi?Dockey=P1008JE3.TXT (2002). [↩]
- Sydney Water. What’s in wastewater fact sheet. https://www.sydneywater.com.au/content/dam/sydneywater/documents/what-is-in-wastewater.pdf (2024). [↩]
- Schindler, D. W., Hecky, R. E., Findlay, D. L., Stainton, M. P., Parker, B. R., Paterson, M. J., Beaty, K. G., Lyng, M., Kasian, S. E. M. Eutrophication of lakes cannot be controlled by reducing nitrogen input: Results of a 37-year whole-ecosystem experiment. Proceedings of the National Academy of Sciences. 105, 11254–11258 (2008). [↩]
- Howarth, R. W., Marino, R. Nitrogen as the limiting nutrient for eutrophication in coastal marine ecosystems: Evolving views over three decades. Limnology and Oceanography. 51, 364–376 (2006). [↩] [↩]
- Conley, D. J., Paerl, H. W., Howarth, R. W., Boesch, D. F., Seitzinger, S. P., Havens, K. E., Lancelot, C., Likens, G. E. Controlling Eutrophication: Nitrogen and Phosphorus. Science. 323, 1014–1015 (2009). [↩]
- G. Yu, S. Zhang, W. Qin, Y. Guo, R. Zhao, C. Liu, C. Wang, D. Li, Y. Wang. Effects of nitrogen and phosphorus on chlorophyll a in lakes of China: a meta-analysis. Environmental Research Letters. 17, (2022). [↩]
- S. Giovannoni, F. Chan, E. Davis II, C. Deutsch, S. Wolf. Biochemical barriers on the path to ocean anoxia? mBio. 12 (2021). [↩]
- R. J. Diaz. Anoxia, hypoxia, and dead zones. Encyclopedia of Estuaries. 19-29 (2015). [↩]
- W. W. Wood, W. E. Sanford, J. A. Cherry, D. W. Hyndman, W. T. Wood. Global nitrogen mass flux from the active freshwater aquifer. 37, (2023). [↩]
- A. Altieri, S. B. Harrison, J. Seemann, R. Collin, R. J. Diaz, N. Knowlton. Tropical dead zones and mass mortalities on coral reefs. PNAS. 114, 3660-3665 (2017). [↩] [↩]
- R. J. Diaz, R. Rosenberg. Spreading dead zones and consequences for marine ecosystems. Science. 321, 926-929 (2008). [↩]
- D. Breitburg, L. A. Levin, A. Oschlies, M. Grégoire, F. P. Chavez, D. J. Conley, V. Garçon, D. Gilbert, D. Gutiérrez, K. Isensee, G. S. Jacinto, K. E. Limburg, I. Montes, S. W. A. Naqvi, G. C. Pitcher, N. N. Rabalais, M. R. Roman, K. A. Rose, B. A. Seibel, M. Telszewski, M. Yasuhara, J. Zhang. Declining oxygen in the global ocean and coastal waters. Science. 359, (2018). [↩]
- A. Almroth-Rosell, C. Humborg, S. Q. Duberg, C. Hallin, A. F. Bouwman, V. Brüchert. A regime shift toward a more anoxic environment in a eutrophic sea in Northern Europe. Front Mar Sci. 8, 799936 (2021). [↩] [↩]
- W. Wang. Eutrophication mechanisms and their impacts on coastal marine ecosystems. International Journal of Marine Science. 14, 285-294 (2024). [↩] [↩] [↩]
- J. Goldstein, U. K. Steiner. Ecological drivers of jellyfish blooms–the complex life history of a ‘well-known’ medusa (Aurelia aurita). Journal of Animal Ecology. 89, 910–920 (2019). [↩]
- S. H. Lee, L. C. Tseng, Y. H. Yoon, E. Ramirez-Romero, J. S. Hwang, J. C. Molinero. The global spread of jellyfish hazards mirrors the pace of human imprint in the marine environment. Environment International 170, 107699 (2023). [↩]
- N. E. Mills, M. C. Barnhart. Effects of hypoxia on embryonic development in two Ambystoma and two Rana species. Physiological and Biochemical Zoology. 72, 179–188 (1999). [↩]
- L. C. Backer, J. H. Landsberg, M. Miller, K. Keel, T. K. Taylor. Canine cyanotoxin poisonings in the United States (1920s–2012): Review of suspected and confirmed cases from three data sources. Toxins. 5, 1597–1628 (2013). [↩]
- S. R. Carpenter, J. F. Kitchell, J. R. Hodgson. Cascading trophic interactions and lake productivity. BioScience. 35, 634–639 (1985). [↩]
- Chesapeake Bay Foundation Bad water and the decline of Blue Crabs in the Chesapeake Bay (2008). [↩] [↩] [↩]
- E. G. Johnson, G. Abbe, A. Hines, D. M. Kahn, R. N. Lipcius, J. C. McConaugha, G. A. Messick, T. J. Miller, E. Schott, J. D. Shields, J. van Montfrans, Y. Zohar, G. M. Ralph. Ecosystem-based fisheries management for Chesapeake Bay: Blue crab species team background and issues briefs. Maryland Sea Grant. https://www.mdsg.umd.edu/sites/default/files/2019-12/EBFM-Blue-Crab-Summary.pdf (2010). [↩] [↩]
- A. Jansen, T. Rick, D. Lowery. Reconciling cultural technologies, chronologies, and the rising tide at Fishing Bay, Maryland. North American Archaeologist. 36, 141-164 (2015). [↩]
- Environmental Protection Agency. Sources and solutions: Wastewater. https://www.epa.gov/nutrientpollution/sources-and-solutions-wastewater (2024). [↩]