
Abstract
While image acquisition after contrast injection significantly improves diagnostic accuracy, it may introduce an uncomfortable complication such as contrast agent extravasation (CAE). We focused on creating a model to estimate the peak wall impact pressure (PWIP) within a peripheral vein by injection of a contrast agent into the catheter, as the basis for this mechanistic modeling framework to determine vascular wall load as a possible predisposing factor of CAE. This study developed a mathematical equation to estimate representing PWIP and examined the influence of injection-related parameters that may influence modeled pressure values, compared the findings with those of previous studies by substituting variables into this equation. Under the tested model assumptions, estimated PWIP appeared to be increased with increasing contrast-agent injection flow rate, decreasing catheter diameter, and increasing effective intravascular jet-orientation angle. Under the assumptions in this mathematical model 18 and 20G catheters were associated with lower PWIP regardless of other variables, suggesting that selecting 18 and 20G catheters may be the optimal factor to be used for further investigation in order to minimize CAE. However, clinical validation is needed before we can confirm that they play a role in reducing CAE. Because CAE is affected by multiple patient- and procedure-dependent variables, the proposed model could offer a mechanistic basis for future studies of personalized contrast agent injection approaches.
Keywords: Contrast agent injection, Contrast agent extravasation, Mathematical model, Peak wall impact pressure, Vessel wall
Introduction
Computed tomography (CT) and Magnetic resonance imaging (MRI) may improve diagnostic accuracy through the use of contrast agents. However, contrast agent extravasation (CAE), in which intravenously administered contrast agents (iodine- or gadolinium-based) leak into the surrounding soft tissues, can occur as a complication1. Contrast agents used for CT scan help qualitatively distinguish pathological changes by exploiting differences in absorption between normal tissues and lesions. For this purpose, CT contrast agents need to be injected intravenously at high pressure and high velocity2. In contrast, CAE associated with gadolinium-based contrast agents occurs less frequently than CAE associated with iodinated contrast agents because smaller volumes are administered, and the injection rates are lower3.
Intravenous injection of contrast agent for CT scan can lead to various complications including CAE with an incidence ranging from 0.1% to 1.2%4. CAE commonly causes pain, swelling, blisters, secondary wound infections and tissue adhesions, and in rare cases may result in serious complications such as compartment syndrome or even amputation. Still, most cases do not lead to serious outcomes. However, even if clinically minor, CAE can cause discomfort and stress to patients and may negatively affect their rapport with healthcare providers4,5. In order to reduce CAE as much as possible while producing diagnostically efficient images, many studies have been conducted. There are protocols for intravenous contrast agent injection that have been developed on this basis, but these protocols still require ongoing efforts and further empirical study1,5.
In this study, we modeled the relationship between various variables involved in intravenous contrast agent injection and the peak wall impact pressure (PWIP) exerted on the peripheral vein. We also evaluated the plausibility of the model by using parameter values from previous research. Instead of directly predicting vascular damage or contrast agent extravasation (CAE), the purpose of this study was to provide a perspective for investigating how injection related parameters can impact vessel wall loading as one of potential biomechanical contributors to CAE risk.
Methods
Schematic Modeling of Contrast Material Injection
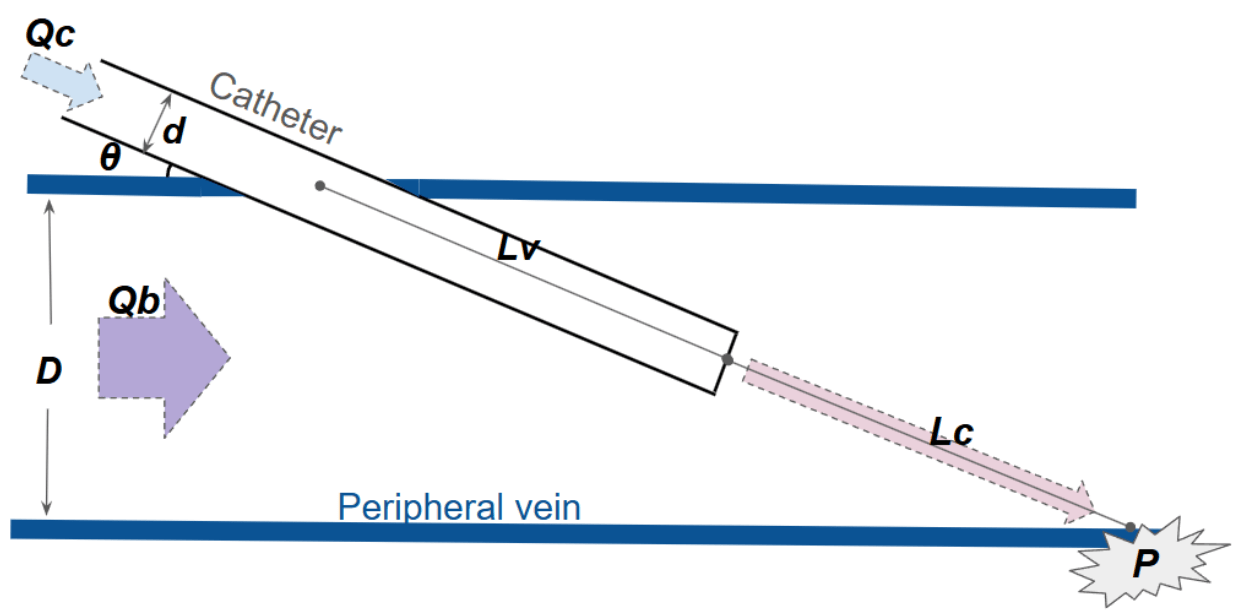
A schematically presented peripheral vein with a catheter inserted for contrast-agent injection is shown in Figure 1. We show in Figure 1 the injection related factors modeled, and we provide extensive definitions of symbols and units in Table 1. On the basis of the variables, we constructed a mathematical model that quantifies PWIP.
Mathematical Modeling
This model was developed to estimate the PWIP generated when the injected contrast agent jet exits a peripheral intravenous catheter and reaches the opposite vessel wall. The model assumes peripheral veins, including the median cubital vein, with contrast administered through a non-fenestrated catheter. All calculations were performed using SI units.
| Symbol | Definition | Units |
|---|---|---|
 | Cross-sectional area of the blood vessel | m2 |
 | Cross-sectional area of the catheter lumen | m2 |
 | Internal diameter of the blood vessel | m |
 | Internal diameter of the catheter lumen | m |
 | Contrast-agent volumetric injection rate | m3/s |
 | Blood volumetric flow rate | m3/s |
 | Average contrast-agent jet velocity in the catheter | m/s |
 | Average blood-flow velocity in the vessel | m/s |
 | Effective intravascular jet-wall orientation angle used in the model | degrees |
 | Catheter insertion angle relative to the vessel axis or skin surface, depending on model geometry | m/s |
 | Effective normal jet velocity at the opposite vessel wall | m/s |
 | Distance from catheter tip to opposite vessel wall | m |
 | Density of contrast agent | kg/m3 |
 | Blood-flow correction coefficient | dimensionless |
 | Jet-distance damping coefficient | dimensionless |
 | Blood-flow correction function | dimensionless |
 | Distance-based jet attenuation function | dimensionless |
 | Local baseline intravascular pressure | Pa |
 | Estimated peak wall impact pressure | Pa |
The average velocity of the contrast agent jet within the catheter and the average velocity of blood flow in the vessel can be expressed as follows:
(1) ![\[\begin{split}V_c &= \frac{Q_c}{A_c} = \frac{4Q_c}{\pi d^2} \\V_b &= \frac{Q_b}{A_v} = \frac{4Q_b}{\pi D^2}\end{split}\]](https://nhsjs.com/wp-content/ql-cache/quicklatex.com-b9307363cde243b48edb06ed88c0b106_l3.png "Rendered by QuickLaTeX.com")
The jet component directed toward the opposite vessel wall can be approximated by the following equation:
(2) ![\[V_{n,0} \approx V_c \sin\theta\]](https://nhsjs.com/wp-content/ql-cache/quicklatex.com-0effe71f63d0f7b8a959526867a098eb_l3.png "Rendered by QuickLaTeX.com")
The blood-flow correction term and the distance-dependent damping term were included as simplified correction functions rather than fully calibrated physical laws. These terms were chosen to keep the model mathematically tractable while still representing two expected fluid-mechanical behaviors.
To assess whether the injected contrast flow could reasonably involve jet spreading or turbulent-like attenuation, a Reynolds number analysis was performed. The Reynolds number was calculated as:
(3) ![\[R_e = \frac{\rho V_c d_1}{\mu}\]](https://nhsjs.com/wp-content/ql-cache/quicklatex.com-be46c4b93f2f11b4098a52679620a358_l3.png "Rendered by QuickLaTeX.com")
These values indicate that catheter outflow can be laminar at low injection rates and large catheter diameters as well as turbulent at high injection rates and small catheter diameters. Thus a distance dependent attenuation term was included to account for expected reduction in jet velocity directed toward the vessel wall as the jet travels from the catheter tip to the opposing wall. Such attenuation can be due to jet diffusion, entrainment of surrounding fluid, and interactions with the ambient blood. The distance-dependent damping function was defined as:
(4) ![\[g(L_v) = \frac{1}{1+\beta\frac{L_v}{d}}\]](https://nhsjs.com/wp-content/ql-cache/quicklatex.com-d8c712937925dab09796ca755b76f254_l3.png "Rendered by QuickLaTeX.com")
where is a dimensionless correction coefficient that modulates the strength of distance-dependent attenuation. The ratio  represents the travel distance normalized by the initial jet diameter. This ratio was used because jet spreading and velocity decay depend not only on absolute travel distance but also on the characteristic diameter of the jet at the catheter exit. A larger indicates that the jet travels farther before impact relative to its initial diameter, allowing greater attenuation before reaching the opposite vessel wall.
Although the diameter of the catheter is present in both the Reynolds number and the damping function, it has different functions. In the Reynolds number,  is the characteristic length scale used to estimate the catheter-exit flow regime. In the damping function, d normalizes the downstream travel distance as part of . The chosen damping function is dimensionless, remains finite at
  , equals 1 when , and decreases monotonically when
  . It qualitatively agrees with the predicted decrease in jet centerline velocity with downstream distance. However, as was not calibrated using experimental or CFD data, should be interpreted as a simplified attenuation approximation instead of a validated turbulent jet-decay law.
To account for the influence of blood flow velocity, we considered the higher blood flow rate tends to drag the jet more strongly in the axial direction, thereby reducing the component of the jet that hits the opposite wall. Accordingly, the wall reaching efficiency of the contrast agent jet is expressed by the following equation. In this equation, is a correction factor that represents the degree to which the jet weakens after being ejected from the catheter.
(5) ![\[f(V_b) = \frac{1}{1+\alpha\frac{V_b}{V_c \sin\theta}}\]](https://nhsjs.com/wp-content/ql-cache/quicklatex.com-aa314eb3afaec0667d573e79018936be_l3.png "Rendered by QuickLaTeX.com")
This was chosen because the form is dimensionless, it exists between 0 and 1, and it decreases as the ratio of blood-flow velocity to wall-directed jet velocity increases. If the blood velocity is small with respect to the normal jet velocity,  indicating that the weakening effect of blood-flow is negligible. As the blood velocity increases with respect to the wall‐directed jet velocity, decreases, indicating higher axial deflection or dispersion of the jet injected. In the baseline simulations,
  were considered as indicative values and were not experimentally calibrated constants. The value
  represents a proportional baseline case in which blood-flow weakening depends directly on the ratio
  . The value
  was selected as a medium magnitude of damping for a scenario where velocity attenuation is introduced but not at the expense of completely attenuating the wall-directed jet over the short distances between the catheter tip and wall within the peripheral veins. Since no computational fluid dynamics (CFD) or experimental measurements were performed to calibrate such coefficients, numerical PWIP values should be treated as scenario-based estimates rather than absolute physiological predictions.
The velocity component normal to the effective wall that generates the local wall impact pressure on the opposite vessel wall can be expressed as:
(6) ![\[\begin{split}V_{n, eff} = (V_c \sin \theta) f(V_b) g(L_v),\\V_{n, eff} = \big(V_c \sin \theta\big) \big(\frac{1}{1+\alpha\frac{V_b}{V_c \sin\theta}}\big) \big(\frac{1}{1+\beta\frac{L_v}{d}}\big)\end{split}\]](https://nhsjs.com/wp-content/ql-cache/quicklatex.com-5bb0b8cfaee281fe0d870c30bdd28c7e_l3.png "Rendered by QuickLaTeX.com")
When a contrast agent is injected through a catheter, the PWIP exerted on the vessel can be expressed as the sum of the pressure acting on the blood vessel and the dynamic pressure, which represents the kinetic energy per unit volume of the contrast medium. In this model, PWIP represents the normal component of the localized impact pressure generated when the contrast agent jet impinges upon the opposite wall of the vessel. It does not, however, represent the entirety of the biomechanical load experienced by the vein. Consequently, PWIP is regarded not as a definitive predictor of vascular injury, but rather as one of several mechanical factors constituting the stress environment to which the vessel wall is subjected. In the following equation, represents the density of the contrast agent.
(7) ![\[P_{impact, real} = P_{local} + \frac{1}{2}PV^2_{n, eff}\]](https://nhsjs.com/wp-content/ql-cache/quicklatex.com-6888cdb3fa505418d0d4ee08fe0c750b_l3.png "Rendered by QuickLaTeX.com")
By combining all the above equations, we could make the final equation.
(8) ![\[P_{impact,real} = P_{local} + \frac{1}{2}\rho \Bigg[ \left(\frac{4Q_c}{\pi d^2}\right)\sin\theta \cdot \frac{1}{1+\alpha\dfrac{\frac{4Q_b}{\pi D^2}}{\left(\frac{4Q_c}{\pi d^2}\right)\sin\theta}} \cdot \frac{1}{1+\beta\dfrac{Lv}{d}} \Bigg]^2\]](https://nhsjs.com/wp-content/ql-cache/quicklatex.com-a7889821335fa13b5b76eddcbea595a3_l3.png "Rendered by QuickLaTeX.com")
In this formulation,  is reported in pascals. For graphical presentation, values may be converted to kilopascals using:
1kPa = 1000Pa
In order to estimate the effect of the empirical correction coefficients, the sensitivity analysis for and was conducted. Blood-flow correction coefficient was changed from 0.5 to 3.0 and the distance damping coefficient was varied around its baseline value. These ranges were selected to represent weaker, baseline, and stronger correction scenarios. For each coefficient value, PWIP was recalculated while holding all other baseline parameters constant.
Since is depends on  differences in and may be amplified in the final estimate of PWIP. To this extent, this sensitivity analysis is performed to determine how strongly the predicted PWIP depends on the assumed correction coefficients instead of being an attempt to confirm the specific values of and .
All figures were produced in Python (NumPy for numerical calculations and Matplotlib for visualization). Values used were calculated from baseline unless otherwise indicated:
| Parameters | Baseline values | Rationale |
|---|---|---|
| Contrast agent density, | 1050 kg/m3 | Selected as a representative density for contrast-agent |
| Vessel diameter, | 4.0 mm | Ultrasound studies report mean median cubital vein diameters around 3.5 mm and adult antecubital vein diameters near 4–5 mm |
| Tip to wall distance, | 3.0 mm | Simplified “catheter tip-to-contralateral wall” distance, representing the short travel distance. This value was utilized as a geometric approximation |
| Contrast flow rate, | 4.0 mL/s | Selected as a representative contrast agent injection rate within the clinically utilized range for contrast-enhanced CT. |
| Blood flow rate, | 5.75 mL/min | Selected as an illustrative reference value, specifically as a reference value for low-flow peripheral veins. |
| Effective intravascular jet-wall orientation angle, | 20 degree | Used as a moderate scenario-based value for the effective intravascular jet-orientation angle. |
| Blood-flow correction coefficient, | 1.0 | Used as an illustrative baseline correction coefficient, not an experimentally calibrated constant. |
| Damping coefficient, | 0.6 | Used as a moderate illustrative damping coefficient, not an experimentally calibrated constant. |
| Local baseline pressure, | 0 Pa | To isolate only the dynamic pressure component of PWIP generated by injection, it is assumed that the baseline remains constant; furthermore, even in the presence of a non-zero local venous pressure, the relative influence of , , , , or would not be altered. |
| 18G catheter diameter | 1.27 mm | |
| 20G catheter diameter | 0.91 mm | |
| 22G catheter diameter | 0.72 mm | |
| 24G catheter diameter | 0.56 mm |
Model assumptions and scope
The parameter ranges used in this theoretical model were selected to reflect clinically relevant conditions for contrast agent injection through peripheral intravenous catheters.The contrast agent injection rate varied from 1 ml/s to 8 ml/s, and included values used in pediatric and adult patients6,7. Although CAE events were not reported in some previous studies of 16G catheters, this should not be interpreted as no risk, or the absence of events reported. The model assumed non-fenestrated, end-hole peripheral intravenous catheters with sizes of 18G, 20G, 22G, and 24G. A 16G catheter was not included because this study focused on commonly used peripheral catheter sizes for contrast injection7. The catheter diameters found for 18G, 20G, 22G and 24G were the commonly reported peripheral intravenous catheter size in the literature, but not from a manufacturer (18G=1.27mm, 20G=0.91mm, 22G=0.72mm, 24G=0.56 mm). In this model, θ was defined as the effective intravascular orientation angle of the catheter-tip jet relative to the vessel axis. Thus, θ is considered as a modeling parameter that accounts for the normal jet portion towards the wall of the opposing vessel. Median cubital veins, forearm veins, wrist veins, and hand veins are used when catheters are inserted in peripheral veins for contrast agent injection. In adult males, the median cubital vein diameter is an average of 4.2 mm before the application of a tourniquet and 4.9 mm after tourniquet application8. Hence, only the diameters of vessels below 5 mm were taken into account. Peripheral venous blood flow beneath the forearm level ranges from 2.5 to 9 mL/min9. Table 2 and 3 summarizes the core assumptions, rationale for use and limitations of the theoretical PWIP model. These assumptions served to make the model efficient and separate the effect of catheter size, injection flow rate, insertion angle, vessel diameter, and venous blood flow on the model PWIP.
| Variables | Assumption | Reason for use | Limitation |
|---|---|---|---|
| (1–8 mL/s) | This range includes rates used in pediatric and adult contrast-enhanced imaging. | Actual rates vary by protocol, contrast type, catheter size, and clinical setting. |
| 18G, 20G, 22G, 24G | These are commonly used peripheral IV catheter sizes for contrast injection.16G catheters were excluded because no cases of CAE had been reported in previous studies. | Other catheter sizes may be used. |
| (10 –30) –30) | Used as a moderate scenario-based value for the effective intravascular jet-orientation angle. | The actual intravascular angle may differ from the skin insertion angle. |
| (2–5 mm) | Common peripheral injection sites, including the median cubital, forearm, wrist, and hand veins, are often within this range. | Vein size varies by patient, location, tourniquet use, and hydration status. |
| (2.5–9 mL/min) | This represents reported peripheral venous flow below the forearm level. | Venous flow changes with position, compression, vascular condition, and individual anatomy. |
| Catheter | non-fenestrated | This simplified the model to focus on jet impact from the catheter tip. | Depending on whether or not the catheter penetrates, the flow direction and wall interactions can be altered. |
| Vessel wall interaction | jet impact on the opposite wall. | This allowed PWIP to be estimated as one possible mechanical factor. | Real CAE involves complex flow, vessel motion, tissue support, and catheter position. |
| Vessel compliance and Wall shear stress | not explicitly modeled. | The model focused on peak wall impact pressure as a simplified mechanical marker. | Veins are deformable, and shear stress may also contribute to local vessel effects. |
Therefore, rather than being a fully validated model for predicting the occurrence of CAE, this model is a mechanistic framework for estimating modeled PWIP values. Additional validation of this model is needed using bench experiments, vascular phantom models, CFD simulations, and patient outcome data to verify if the PWIP model is clinically associated with CAE.
Results
To separate the injection-related contribution to PWIP, the local intravascular pressure was treated as constant in the model. For this simulations, 𝑃𝑙𝑜𝑐𝑎𝑙 was fixed as a constant reference pressure such that any changes in PWIP represented changes in the jet-related dynamic pressure term, not in background venous pressure changes. This does not imply that peripheral venous pressure remains constant in clinical practice, as actual venous pressure depends on the patient’s clinical condition. This assumption does not imply that peripheral venous pressure remains constant in clinical practice, as actual venous pressure can vary depending on the patient’s clinical condition. Since the vascular environment is assumed to be constant, 𝑃𝑙𝑜𝑐𝑎𝑙 was set to 0 value and the values plotted represent the gauge impact pressure generated by the contrast-agent jet alone. This can be expressed by the following equation.
(9) ![\[P_{impact,real} \approx P_{local} + \frac{1}{2}\rho \Bigg[ \left(\frac{4Q_c}{\pi d^2}\right)\sin\theta \cdot \frac{1}{1+\alpha\dfrac{\frac{4Q_b}{\pi D^2}}{\left(\frac{4Q_c}{\pi d^2}\right)\sin\theta}} \cdot \frac{1}{1+\beta\dfrac{Lv}{d}} \Bigg]^2\]](https://nhsjs.com/wp-content/ql-cache/quicklatex.com-f8b76c57dd646ec2463bfd93fa3bea41_l3.png "Rendered by QuickLaTeX.com")
The catheter diameter is likely to have a great influence on estimated PWIP in the concluding equation because it influences contrast-agent jet velocity through the catheter cross-sectional area. Contrast injection volumetric rate also influences the estimated PWIP by changing the velocity of the jet and, by consequence, the dynamic pressure term. The angle of effective intravascular jet-orientation affects the PWIP by determining the wall-directed component of the jet. The blood flow and catheter-tip-to-wall distance were integrated by utilizing simplified attenuation functions to represent their gradual effects on effective normal jet velocity. Among the clinically tested range of variables, contrast injection volumetric flow rate produced the greatest variation in estimated PWIP under the baseline model assumptions.Catheter diameter and effective intravascular jet orientation angle also substantially influenced estimated PWIP. While the pressure term depends on the square of the effective normal velocity, the observed parameter effects were determined by the clinical ranges and by correction terms for blood-flow deflection and distance-dependent damping. Hence the relative effects of each variable should be treated as scenario-dependent rather than any categorical ranking (Table 4 and Figure 2(a)).
| Variables (a) | PWIP Max/Min (X) | Variables (b) | PWIP Max/Min (X) |
| Qc (1–8 mL/s) | 64.71 | d (18–24G) | 11.56 |
| d (18–24G) | 11.56 | θ (10°–30°) | 8.32 |
| θ (10°–30°) | 8.32 | Qc (3–5 mL/s) | 2.78 |
| D (2–5 mm) | 1.01 | D (2–5 mm) | 1.01 |
| Qb (2.5–9 mL/min) | 1.00 | Qb (2.5–9 mL/min) | 1.00 |
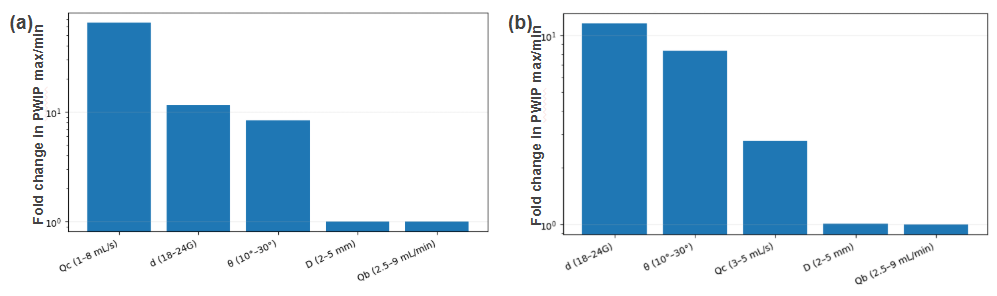
Under the selected baseline assumptions and within the contrast injection rate range of 3–5 mL/s, catheter diameter, catheter insertion angle, and contrast injection volumetric rate were associated with the largest changes in estimated PWIP, in that order (Table 4, Figure 2(b)). When the contrast agent volumetric rates between 1 to 8 mL/s were used, the PWIP variable exhibited the greatest variation in response to differing contrast injection rates. However, when the contrast injection volumetric rate was restricted to 3 to 5 mL/s, the effect of the flow rate on variation in PWIP was found to be minimal (Table 4, Figure2). In practice, vein size and blood flow rate are two of the important factors with respect to peripheral IV access in clinical settings. Nonetheless, the results from the model this study used suggest that the influence of vessel diameter and blood flow rate is relatively negligible. These findings might just be indicative of the structural properties and assumptions of the model. The model implies that, under conditions of high contrast agent injection rates, the momentum of the contrast jet rather than baseline venous blood flow may play a more dominant role in determining local vertical impact pressure. Nevertheless, since blood flow was described only by a simplified damping term, these findings should be regarded as a model-dependent hypothesis.
For Reynolds numbers, ρ = 1050 kg/m³ was the density value used. In addition to estimating the approximate order of magnitude, a representative contrast agent viscosity value of μ = 0.006 Pa⋅s was assumed. The flow rate was set within the range of Qc = 3–8 mL/s, and inner catheter diameters corresponding to gauges ranging from 18G to 24G were used for analysis. The results are shown in table 5.
| 18G | 20G | 22G | 24G | |
| Reynolds numbers at 3ml/s | 502 | 701 | 886 | 1138 |
| Reynolds numbers at 5ml/s | 837 | 1168 | 1477 | 1896 |
| Reynolds numbers at 8ml/s | 1339 | 1869 | 2363 | 3034 |
Higher injection rate and smaller catheter diameter resulted in higher estimations of Reynolds numbers. Under the tested conditions Reynolds numbers varied between about 502 at 3 mL/s for an 18G catheter and about 3034 for a 24G catheter at 8 mL/s, suggesting the injected flow was not uniformly laminar in all the model settings and might become transitional or turbulent under high-flow, small-catheter conditions. Thus, a distance-dependent attenuation term was introduced, taking into consideration the expected jet velocity lost to the vessel wall from the catheter tip to the opposing wall. This attenuation could be from jet diffusion, entrainment of surrounding fluid, and interactions with the ambient blood. This justifies the employment of a jet-attenuation correction term, and it reiterates that this damping function is a simplified approximation and is not a fully calibrated turbulence model.
To study the degree to which estimated PWIP is a consequence of the empirical correction coefficients α and β, we varied α and β around their baseline values. The blood flow correction coefficient α ranged in magnitude between 0.5 to 3.0 while keeping β constant at 0.6. The distance attenuation coefficient β ranged between 0.3 and 1.2 while controlling for α of 1.0. The results for this are shown in Table 6.
| 18G | 20G | 22G | 24G | |
| 𝛼=0.5 | 0.132 | 0.330 | 0.611 | 1.153 |
| 𝛼=1.0 | 0.131 | 0.329 | 0.610 | 1.151 |
| 𝛼=2.0 | 0.129 | 0.327 | 0.607 | 1.149 |
| 𝛼=3.0 | 0.128 | 0.325 | 0.605 | 1.146 |
| Percent decrease (0.5⟶ 3.0) | 3.1% | 1.6% | 1.0% | 0.6% |
| 𝛽=0.3 | 0.262 | 0.738 | 1.476 | 3.009 |
| 𝛽=0.6 | 0.131 | 0.329 | 0.610 | 1.151 |
| 𝛽=0.9 | 0.078 | 0.186 | 0.331 | 0.603 |
| 𝛽=1.2 | 0.052 | 0.119 | 0.208 | 0.371 |
| Percent decrease (0.3⟶ 1.2) | 80.1% | 83.9% | 85.9% | 87.7% |
The increase of α value reduced the estimated PWIP slightly. This is because a higher α value implies a stronger attenuating effect on the wall-directed jet caused by the axial blood flow. Between α = 0.5 and 3.0, it was noted that the PWIP decreased by approximately 0.6% to 3.1%. This indicates that the model had relatively low sensitivity to the value of α under the baseline blood flow conditions applied in this study. Furthermore, when the β range was increased from 0.3 to 1.2, a considerable decrease in PWIP occurred, decreasing by approximately 80.1% to 87.7%, which revealed that the model is very highly sensitive to the assumed distance attenuation coefficient. However, the overall qualitative trends remained consistent. In particular, the estimated PWIP values were observed to increase with higher infusion rates, smaller catheter diameters, and larger insertion angles. These results suggest that Figures 2 through 4 should be interpreted as scenario-based model predictions rather than experimentally calibrated pressure values. While the sensitivity analysis supports the directional trends of the model, calibrating the α and β values through the utilization of future experimental jet attenuation data, wall impingement pressure measurements, or CFD simulations will be required to derive accurate numerical PWIP values.
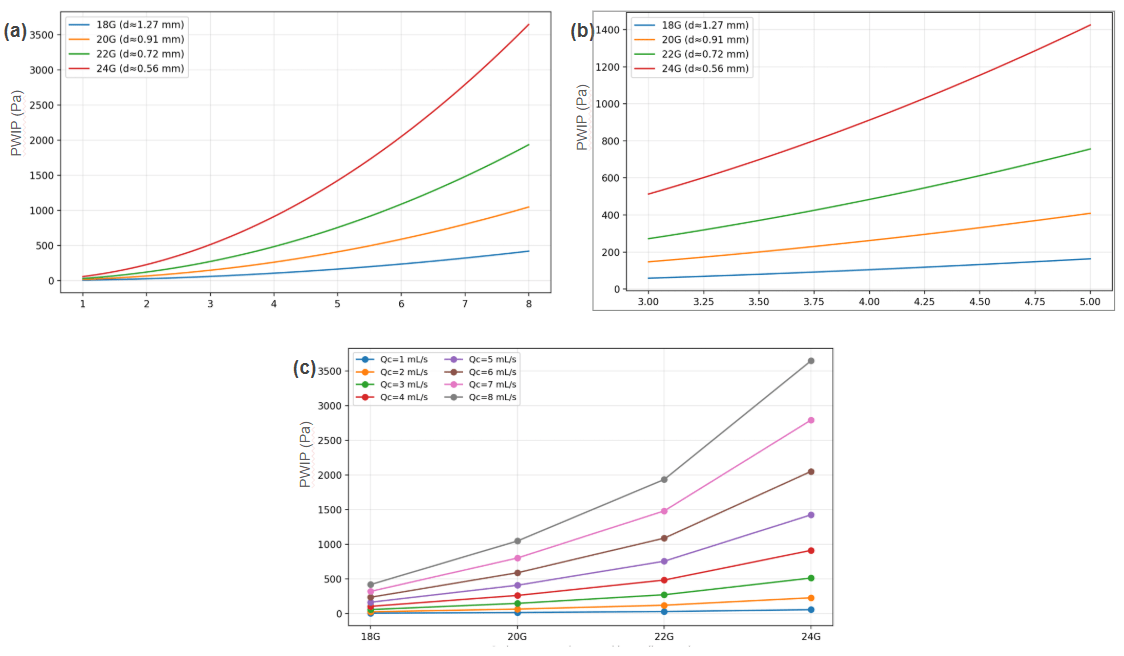
PWIP change with increasing contrast injection volume rate as per the diameter of a catheter is shown in Figure 3. PWIP exhibits a non-linear change as the diameter decreases (i.e., as gauge diameter increases) and is more sensitive to the contrast injection volume rate. Specifically, the slope representing the change in the PWIP becomes steeper at 5mL/s or higher, especially catheters with smaller diameters (Figure 3(a)). Figure 3(b) shows the factors affecting PWIP according to catheter diameter in the contrast injection volume rate range of 3-5mL/s. Within this range, 22 and 24G catheters demonstrate a nonlinear increase in PWIP with increasing contrast injection volumetric rate in this range, whereas 18 and 20G catheters showed a relatively linear increase. At contrast injection rates of 5mL/s or less, PWIP was less than 500 Pa, equivalent to approximately 3.8 mmHg for 18 and 20G catheters. This value is lower than or equivalent to expected resting peripheral venous pressures, which are reported to range from several mmHg. Therefore, PWIP values <500 Pa may be considered relatively small in comparison with normal venous pressures. However, since PWIP is a localized and transient normal impact pressure rather than a distributed intraluminal pressure, and because injury thresholds for contrast-agent jet impact are not well established, these values cannot be seen as definitive safety thresholds10. The increasing slope with decreasing catheter diameter indicated nonlinear amplification, meaning that smaller diameter catheters increase PWIP more sensitively as the contrast injection volume rate increases (Figures 3(a) and 3(b)). This trend is highlighted by Figure 3(c). Based on the model assumptions, 22G and 24G catheters were associated with greater estimated PWIP than 18G and 20G catheters across the tested injection-rate range. This separation between catheter sizes also increased as contrast injection rate increased. The slope of the PWIP change was steepest for the 24G catheter, indicating that the PWIP was most sensitive to changes in contrast injection volume rate. While PWIP with a higher contrast injection volume rate was more sensitive among the catheters, the degree of amplification was greater for smaller catheter diameters.
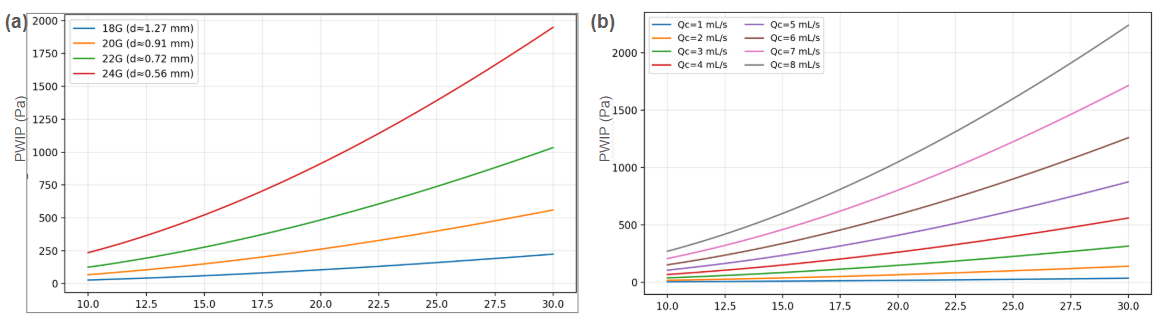
The varying PWIP per catheter diameter and contrast injection volume rate as intravascular jet orientation angle of catheter increases can be seen in Figure 4. As depicted in Figure 4(a), estimated PWIP increased as the effective intravascular jet-orientation angle increased. This increase became more pronounced for smaller-diameter catheters. Specifically, 22G and 24G catheters showed a steeper increase in estimated PWIP across the tested angle range than 18G and 20G catheters. The slope of the increase in PWIP was steeper for 24G catheter, which shows that PWIP is very sensitive to small changes of intravascular jet orientation angle for smaller diameter catheters. And with increased intravascular jet orientation angle catheter, the PWIP also increases in relation to contrast injection volume rate (Figure 4(b)). Upon the model assumptions, the estimated PWIP increased with effective intravascular jet-orientation angle when the contrast injection volumetric rate was 3 mL/s or lower. At higher injection rates, the increase in estimated PWIP became more pronounced, especially for smaller-diameter catheters. This suggests that, within the tested parameter ranges, estimated PWIP was more responsive to changes in effective intravascular jet-orientation angle when catheter diameter was smaller and injection rate was higher. For the 18G catheter at injection rates of 3 mL/s or lower, changes in effective intravascular jet-orientation angle produced only small changes in estimated PWIP (<500Pa) (Figure 4).
Additional clinically plausible scenarios were evaluated to determine whether the trends observed in the model depend on the selected baseline conditions. Following a high baseline flow rate (5.0 mL/s), the PWIP value for the 24G catheter increased from 0.910 kPa in the baseline case to 1.422 kPa. Conversely, in the lower angle of 10°, the PWIP value of the 24G catheter decreased to 0.234 kPa. A consistent correlation was noted across all scenarios with baseline conditions change. Smaller catheter diameters correlated with higher estimated PWIP values. While the absolute PWIP values might differ according to the baseline assumptions, the qualitative trends are consistent among the scenarios analyzed, as observed from these results. The added scenario testing confirms the robustness of the qualitative trend, but not the absolute numerical magnitude, which in turn will depend on continued experimental calibration or CFD calculation.
Discussion
High-quality contrast enhancement ensures consistent contrast resolution on diagnostic CT or MRI scans. This can be achieved in CT scans by using high concentration contrast agents or ramping up injection rate to increase the iodine delivery rate. Due to problems with peripheral venous access, high contrast injection volumetric rates may not be tolerated by cancer patients, intravenous drug users, elderly patients, pediatric patients, obese patients, and hypovolemic patients11. Although CAE is considered one of the most common adverse events in radiology, it has not been evaluated as extensively as other adverse events, including contrast-associated acute kidney injury, and its real incidence may thus be underreported. While CAE does not usually result in severe complications, it can cause anxiety in patients and have adverse effects on the interaction with the medical team5. Recent studies have suggested that sensor devices and leak-detection protocols may help detect or reduce contrast media extravasation during contrast administration. However, routine sensor placement for every patient may be difficult to implement in clinical practice because of time, workflow, and cost constraints12,13. While several efforts have been made to decrease CAE, there is a challenge in avoiding CAE entirely due to injections of high-pressure contrast agents needed to produce appropriate diagnostic images, as well as the inherent interindividual variability in patient conditions14. This study introduces a preliminary modeling framework to explore factors that may contribute to more individualized contrast-agent injection strategies related to CAE risk.
CAE can be explained using three models. The first model describes the leakage of contrast agent into the surrounding soft tissues due to the catheter dislocation or rupture of the catheter tip. The second model describes extravasation caused by leakage through the puncture site of a correctly inserted catheter. The third model describes direct vessel rupture and extravasation by jet pressure acting on the vessel wall5. This study focused on the PWIP of the jet of the third model.
Several studies have reported that CAE rates range from 0.3% to 1.2% when performing automated intravenous contrast injection volume rates of up to 8 mL/s, while the incidence is lower (<1.0%) at infusion rates of 5 mL/s or less. These studies also reported no clear correlation between contrast injection volumetric rate and CAE. However, their findings were limited by their small sample sizes6,15,16. Under the assumptions of this model, contrast injection volumetric rate affected estimated PWIP across the tested range of 1–8 mL/s, with a more pronounced nonlinear increase observed for smaller-diameter catheters such as 22G and 24G. Larger-diameter catheters, such as 18G and 20G, showed smaller changes in estimated PWIP across the same injection-rate range. Within the clinically relevant range of 3–5 mL/s, changes in injection rate had a smaller relative effect on estimated PWIP than catheter diameter or the effective intravascular jet-orientation angle. These findings suggest that injection rates above 5 mL/s may increase estimated normal impact pressure, particularly for smaller catheters. Retrospective cohort studies have shown that 22G catheters are associated with higher CAE rates than 18 and 20G catheters, while no significant difference has been observed between 18 and 20G catheters6,17,18. However, a prospective pediatric cohort study by Amaral et al. found that catheter size did not significantly affect the incidence of CAE15. Under the assumptions of this model, catheter diameter was an important factor influencing estimated PWIP, with smaller diameters associated with greater increases in estimated PWIP. In addition, 18G and 20G catheters showed relatively smaller changes in estimated PWIP as contrast injection rate or effective jet-orientation angle increased. Therefore, within the tested parameter ranges, larger-diameter catheters such as 18G and 20G may be less sensitive to changes in other injection-related variables and may help limit increases in estimated PWIP. Although PWIP should not be interpreted as an explicit predictor of CAE, it may indeed offer a biomechanical model of the vascular wall loads associated with injection. Koori et al. demonstrated the relationship between peak injection pressure and CAE on contrast-enhanced CT, therefore confirming the clinical importance of pressure‐related injection parameters. But because peak injector pressure is distinct from the local PWIP or contrast injection dynamics estimated in this model, this comparison should be seen as providing an indirect clinical context rather than validating the model formally19. To our knowledge, no studies have examined the relationship between the effective jet-orientation angle and CAE. In our model, a smaller effective jet-orientation angle minimized the influence of other variables on PWIP. Further studies are needed to investigate the relationship between effective jet-orientation angle and CAE, particularly using ultrasound-guided catheter insertion. Viscosity has been observed to influence CAE probability. A study by Hwang et al. found that viscosity exceeding 9.4 mPa·s increased the risk of CAE20. In liquids, viscosity and temperature are inversely related. Therefore, the viscosity and flow resistance of high-viscosity contrast agents decrease as temperature increases21. For this study, viscosity used in the equation was not included as a separate variable but as part of the coefficient β.
A limitation of this model is that the correction coefficients α and β have not been calibrated from experimental jet attenuation measurements, wall-impingement pressure data, or CFD simulations. Therefore, the selected reference values should not be treated as general constants that apply to unique patients or devices. In the present study, the reported values are rather simplified scenario assumptions to investigate the impact of catheter size, contrast injection rate, catheter insertion angle, and vessel geometry on the PWIP. Numerical PWIP results and sensitivity presented in Figures 2 through 4 are used as illustrative examples and not as experimental facts. Future studies should aim to estimate α and β by utilizing data derived from measured jet attenuation behaviors, in vitro vessel phantoms, wall-impingement pressure sensors, or CFD simulations. Once calibrated coefficient values and their associated uncertainty ranges are established, these uncertainties should be incorporated into the PWIP model to derive confidence intervals for the predicted pressure values. A limitation of this model is that the value of θ was not measured as the actual angle of the catheter tip within the vessel following catheter insertion. The angle utilized in this model represents an effective jet direction parameter that determines the vertical component of the contrast jet; in reality, the actual angle within the vessel may be smaller than the initial angle of needle entry through the skin. Future studies employing ultrasound, phantoms, or computational simulations should aim to empirically measure catheter-tip orientation after insertion and use these data to refine the range of θ values in the model.
The current investigation assumed the absence of a fenestrated catheter, considering only the diameter of the catheter as a variable. In addition, wall shear stress on the vessel wall was not accounted for. Such limitations can be overcome by making a bigger model by integrating other more variables. Moreover, this research utilized only one of the three CAE hypotheses, which the authors suggest further investigate CAE, its causes, and the variables which contribute to the occurrence of CAE. To improve the accuracy of this model, large-scale clinical trials that minimize the possibility of CAE underreporting are needed. Another limitation of this model is that PWIP does not fully reflect the biomechanical environment associated with the occurrence of injury in peripheral veins. This model focuses solely on the perpendicular pressure generated by the component of the contrast jet directed toward the vessel wall. In other words, it does not take into account factors such as shear stress, the intrinsic tension of the vessel itself, contact with the tip of the vascular catheter, or biological reactions to the contrast agent. Recent clinical studies further support that CAE is a multifactorial outcome rather than a process determined by injection pressure, catheter size, or injection rate alone. Cooper et al. identified clinical and procedural predictors of contrast extravasation in an emergency department setting, while Wang et al. reported that contrast media extravasation injury during contrast-enhanced CT was associated with multiple patient- and procedure-related factors22,23. Other studies have also identified old age, female sex, diabetes, venous thrombosis, multi-site angiography, contrast injection rates exceeding 3 mL/s, a BMI of less than 18.5, emergency patient status, and the absence of a saline flush as major risk factors for CAE24,25. As part of an effort to mitigate these clinical factors associated with CAE, Shigematsu et al. sought to assess venous fragility and establish a preventive scanning protocol26. This model has the limitation of not reflecting these clinical factors known to influence CAE. Consequently, this model should not be interpreted as a definitive predictor of contrast extravasation or vascular injury. Instead, it serves as a mechanical metric that aids in comparing factors such as injection rate, catheter diameter, effective jet-orientation angle, and vascular geometry to influence specific components of the load exerted on the vessel wall.
Under the tested model assumptions, estimated PWIP tended to increase with higher contrast injection volumetric rates, smaller catheter diameters, and larger effective intravascular jet-orientation angles. Within the contrast injection-rate range of 3–5 mL/s, which overlaps with conditions in selected clinical studies reporting low CAE incidence, changes in injection rate appeared to have a smaller relative effect on estimated PWIP than catheter diameter or effective intravascular jet-orientation angle. Across the tested parameter ranges, 18G and 20G catheters generally showed smaller increases in estimated PWIP than 22G and 24G catheters. This trend appears qualitatively consistent with selected clinical observations, although direct comparison is limited because previous studies reported CAE incidence, whereas the present model estimates PWIP rather than clinical outcome data.
Therefore, based on our results, it seems reasonable to suggest that 18G and 20G catheters may be associated with lower modeled PWIP under the conditions analyzed in this study. Nevertheless, these findings should not be taken as a direct clinical recommendation, since the association between PWIP and actual CAE outcomes remains to be confirmed. Rather, factors which impact PWIP may be taken into account in follow-up studies which examine how injection parameters and patient-specific venous conditions influence vessel wall loading. With additional experimental, computational, and clinical validation, this model could help inform the development of more personalized contrast agent injection strategies.
Acknowledgments
I would like to express my deepest gratitude to Dr. Sanghoon Jung of the Department of Radiology at Emory University School of Medicine for his generous support and encouragement. I am also deeply grateful to Ms. Sema Duzyol, High School Math Teacher and Department Chair at Fulton Science Academy, whose guidance inspired me to explore a topic of personal interest through a mathematical lens.
References
- M.-F. Bellin, J. A. Jakobsen, I. Tomassin, H. S. Thomsen, S. K. Morcos, T. Almén, P. Aspelin, W. Clauss, H. Flaten, N. Grenier, J.-M. Ideé, G. P. Krestin, F. Stacul, J. A. W. Webb. Contrast medium extravasation injury: guidelines for prevention and management. European Radiology. Vol. 12, pg. 2807-2812, 2002, https://doi.org/10.1007/s00330-002-1630-9. [↩] [↩]
- T. M. Dykes, M. Bhargavan-Chatfield, R. B. Dyer. Intravenous contrast extravasation during CT: a national data registry and practice quality improvement initiative. Journal of the American College of Radiology. Vol. 12, pg. 183-191, 2015, http://doi.org/10.1016/j.jacr.2014.07.021. [↩]
- R. Soler-Fernández, C. Méndez-Díaz, E. Rodríguez-García. Extracellular gadolinium-based contrast agents. Radiologia. Vol. 66 Suppl 2, pg. S51-S64, 2024, http://doi.org/10.1016/j.rxeng.2024.04.004. [↩]
- W. Liu, P. Wang, H. Zhu, H. Tang, H. Guan, X. Wang, C. Wang, Y. Qiu, L. He. Contrast media extravasation injury: a prospective observational cohort study. European Journal of Medical Research. Vol. 28, pg. 458, 2023, http://doi.org/10.1186/s40001-023-01444-5. [↩] [↩]
- G. Roditi, N. Khan, A. J. van der Molen, M.-F. Bellin, M. Bertolotto, T. Brismar, J.-M. Correas, I. A. Dekkers, R. W. F. Geenen, G. Heinz-Peer, A. H. Mahnken, C. C. Quattrocchi, A. Radbruch, P. Reimer, L. Romanini, F. Stacul, H. S. Thomsen, O. Clément. Intravenous contrast medium extravasation: systematic review and updated ESUR Contrast Media Safety Committee Guidelines. European Radiology. Vol. 32, pg. 3056-3066, 2022, http://doi.org/10.1007/s00330-021-08433-4. [↩] [↩] [↩] [↩]
- S. Wienbeck, R. Fischbach, S. P. Kloska, P. Seidensticker, N. Osada, W. Heindel, K. U. Juergens. Prospective study of access site complications of automated contrast injection with peripheral venous access in MDCT. American Journal of Roentgenology. Vol. 195, pg. 825-829, 2010, http://doi.org/10.2214/AJR.09.3739. [↩] [↩] [↩]
- M. Kok, C. Mihl, B. M. F. Hendriks, S. Altintas, N. G. Eijsvoogel, B. L. J. H. Kietselaer, J. E. Wildberger, M. Das. Patient comfort during contrast media injection in coronary computed tomographic angiography using varying contrast media concentrations and flow rates: results from the EICAR trial. Investigative Radiology. Vol. 51, pg. 810-815, 2016, http://doi.org/10.1097/RLI.0000000000000284. [↩] [↩]
- K. Mukai, Y. Nakajima, T. Nakano, M. Okuhira, A. Kasashima, R. Hayashi, M. Yamashita, T. Urai, T. Nakatani. Safety of venipuncture sites at the cubital fossa as assessed by ultrasonography. Journal of Patient Safety. Vol. 16, pg. 98-105, 2020, http://doi.org/10.1097/PTS.0000000000000441. [↩]
- J. S. Foor, N. L. Moureau, D. Gibbons, S. M. Gibson. Investigative study of hemodilution ratio: 4Vs for vein diameter, valve, velocity, and volumetric blood flow as factors for optimal forearm vein selection for intravenous infusion. Journal of Vascular Access. Vol. 25, pg. 140-148, 2024, http://doi.org/10.1177/11297298211052528. [↩]
- S. Raju, A. Knight, L. Lamanilao, N. Pace, T. Jones. Peripheral venous hypertension in chronic venous disease. Journal of Vascular Surgery: Venous and Lymphatic Disorders. Vol. 7, pg. 706-714, 2019, https://doi.org/10.1016/j.jvsv.2019.03.006. [↩]
- P. T. Johnson, G. M. Christensen, E. K. Fishman. I.v. contrast administration with dual source 128-MDCT: a randomized controlled study comparing 18-gauge nonfenestrated and 20-gauge fenestrated catheters for catheter placement success, infusion rate, image quality, and complications. American Journal of Roentgenology. Vol. 202, pg. 1166-1170, 2014, http://doi.org/10.2214/AJR.13.11730. [↩]
- Y. Matsumoto, A. Chikasue, M. Kondo, T. Akita, M. Kiguchi, Y. Nakamura, K. Awai. Feasibility of preventing massive contrast media extravasation using a sensor device in contrast-enhanced CT: an observational study. Acta Radiologica. Vol. 65, pg. 1325-1331, 2024, https://doi.org/10.1177/02841851241287314. [↩]
- Y. Matsumoto, Y. Nakamura, M. Kondo, S. Kamioka, K. Yokomachi, C. Fujioka, Y. Ochi, M. Kiguchi, W. Fukumoto, H. Mitani, K. Chosa, K. Awai. Clinical utility of a new protocol using saline test injection and a leak detection sensor to reduce the frequency and amount of extravasation during contrast-enhanced CT. Journal of Computer Assisted Tomography. Vol. 50, pg. 441-447,2026, https://doi.org/10.1097/RCT.0000000000001824 [↩]
- V. Mandlik, L. Prantl, A. G. Schreyer. Contrast media extravasation in CT and MRI: a literature review and strategies for therapy. Rofo. Vol. 191, pg. 25-32, 2019, http://doi.org/10.1055/a-0628-7095. [↩]
- J. G. Amaral, J. Traubici, G. BenDavid, G. Reintamm, A. Daneman. Safety of power injector use in children as measured by incidence of extravasation. American Journal of Roentgenology. Vol. 187, pg. 580-583, 2006, http://doi.org/10.2214/AJR.05.0667. [↩] [↩]
- J. E. Jacobs, B. A. Birnbaum, C. P. Langlotz. Contrast media reactions and extravasation: relationship to intravenous injection rates. Radiology. Vol. 209, pg. 411-416, 1998, http://doi.org/10.1148/radiology.209.2.9807567. [↩]
- S. A. Schwab, M. A. Kuefner, K. Anders, B. Adamietz, M. C. Heinrich, J. F. Baigger, R. Janka, M. Uder, M. Kramer. Peripheral intravenous power injection of iodinated contrast media: the impact of temperature on maximum injection pressures at different cannula sizes. Academic Radiology. Vol. 16, pg. 1502-1508, 2009, http://doi.org/10.1016/j.acra.2009.07.026. [↩]
- T. Sinan, H. Al-Khawari, F. A. Chishti, O. M. Al Saeed, M. Sheikh. Contrast media extravasation: manual versus power injector. Medical Principles and Practice. Vol. 14, pg. 107-110, 2005, http://doi.org/10.1159/000083921. [↩]
- N. Koori, R. Sugai, T. Hasegawa, H. Fuse, T. Sasajima, T. Suzuki, H. Kudo, K. Takeda, S. Miyakawa, K. Sasaki, K. Yasue, M. Takahashi, H. Nosaka. Relationship between maximum injection pressure and extravasation rate of contrast media in computed tomography. Clinical Radiology. Vol. 88, pg. 107011, 2025, https://doi.org/10.1016/j.crad.2025.107011. [↩]
- E. J. Hwang, C.-I. Shin, Y. H. Choi, C. M. Park. Frequency, outcome, and risk factors of contrast media extravasation in 142,651 intravenous contrast-enhanced CT scans. European Radiology. Vol. 28, pg. 5368-5375, 2018, http://doi.org/10.1007/s00330-018-5507-y. [↩]
- M. S. Davenport, C. L. Wang, M. R. Bashir, A. M. Neville, E. K. Paulson. Rate of contrast material extravasations and allergic-like reactions: effect of extrinsic warming of low-osmolality iodinated CT contrast material to 37 degrees C. Radiology. Vol. 262, pg. 475-484, 2012, http://doi.org/10.1148/radiol.11111282. [↩]
- G. Cooper, J. V. Downing, Y. Lin, J. M. Yang, S. Asuncion, M. Sutherland, S. Sommerkamp, R. Chasm, M. C. Bond, Q. K. Tran. Predictors of contrast extravasation in the emergency department: a case-control multi-center retrospective study. Journal of Emergency Medicine. Vol. 83, pg. 35-46, 2026, https://doi.org/10.1016/j.jemermed.2025.11.004 [↩]
- L. Wang, Q. Chen, H. Liu, X. Wang, Q. Qian, M. Xu, L. Ma, X. Wang. Incidence, outcome, and risk factors of contrast media extravasation injury during contrast-enhanced computed tomography scans: an observational cohort study. Quantitative Imaging in Medicine and Surgery. Vol. 15, pg. 7338-7351, 2025, https://doi.org/10.21037/qims-24-2332 [↩]
- W. Liu, P. Wang, H. Zhu, H. Tang, X. Wang, H. Guan, C. Wang, Y. Qiu, A. Peng, L. He. Risk factors for contrast media extravasation in intravenous contrast-enhanced computed tomography: an observational cohort study. Academic Radiology. Vol. 31, pg. 1792-1798, 2024, https://doi.org/10.1016/j.acra.2023.09.027 [↩]
- L. Wang, Q. Chen, H. Liu, X. Wang, Q. Qian, M. Xu, L. Ma, X. Wang. Frequency and risk factors of contrast media extravasation in 378,082 intravenous contrast-enhanced CT scans. European Journal of Radiology. Vol. 184, pg. 111992, 2025, https://doi.org/10.1016/j.ejrad.2025.111992 [↩]
- S. Shigematsu, S. Oda, D. Utsunomiya, et al. Practical preventive strategies for extravasation of contrast media during CT: what the radiology team should do. Academic Radiology. Vol. 29, pg. 1462-1469, 2022, https://doi.org/10.1016/j.acra.2022.01.023 [↩]


