Abstract
Due to increase in human activity, gray wolves in Yellowstone became extinct, which resulted in the exponential growth of elk populations. Although Yellowstone’s decision in 1995 to reintroduce gray wolves stabilized the ecosystem temporarily, the elk population has reincreased again from 2013, which might unstabilize Yellowstone ecosystem again. Due to the lack of research on evaluating the new solutions from researches that provide single solution, this research evaluated the impact of three new policies on elk overpopulation and Yellowstone ecosystem after 2026 – reintroduction of wolves and grizzly bears and introduction of harvesting rate – by developing the advanced Lotka-Volterra model through correlational research and trend analysis with hypothesis that the ecosystem stabilized more for less change of the harmonized period(HP) and maximum population value of gray wolves on every HP. In conclusion, the reintroduction of grizzly bears is determined as the best policy on both decreasing the elk population effectively and stabilizing the whole ecosystem while harvesting policy can be used if elk population decreased significantly although it needs another new policy to stabilize the Yellowstone ecosystem. Even though this research has some limitations on adding more details, such as animal seasonal movements, it will be used as the base research to develop advanced Lotka-Volterra model with more accuracy to apply more reliable and effective policies in real Yellowstone ecosystem to stabilize the Yellowstone ecosystem.
Keywords: Lotka-Volterra Predator-Prey Model, Ecosystem Stabilization, Harvesting Rate, Reintroduction of Species, Trophic Cascade, Harmonic Period, Yellowstone National Park
Introduction
Environmental Devastation in Yellowstone
The increase of human activity resulted in a significant decline of global diversity and ecosystem around the global environment, such as Yellowstone National Park1. By the end of 1920s, humans hunted gray wolves until the eradication2. As a result, in the early 1990s, due to the fewer predators in Yellowstone, the population of elk became overpopulated and in 1994, the population of elk reached 17,0003. The overpopulated elk started to destroy the environment by killing streamside vegetation4. Not only the environment, but overpopulated elk also impacted whole species in Yellowstone. For example, the overpopulated elk became the food source for grizzly bears and other predators, which allowed the population of grizzly bears to increase5. However, due to the destruction of the environment, grizzly bears could not get plant-based food sources, and this also impacted the grizzly bear’s diet and changed the whole food chain of Yellowstone6.
The effort to decrease the population of elk and stabilize the Yellowstone ecosystem already had worked once through reintroducing gray wolves. Since more elk density was easily seen and hunted by wolves, it allowed the control of elk populations7. Therefore, from 1995 to 1997, Yellowstone decided to reintroduce a total of 41 wolves in Yellowstone, and the impact of this decision was very significant8. From 17,000 in 1995, 8,335 in 2004, and reached between 6,000 and 7,000 in 20139,10. Furthermore, with the decrease in the elk population, other animals were also influenced. For example, while the elk population decreased, the habitat of grizzly bears increased by 48% from the 1970s11. Also, reintroduction of wolves decreased the density of the coyote population12. As a result, reduction of the elk population on land lessened the competition on the land with other animals and this gave more forage available to bison13. However, this impact was periodic; since 2013, the elk calves started to increase and the population of elk increased from 6070 in 2010 to 6673 in 202214. While researchers are suggesting various solutions that can protect the Yellowstone ecosystem, such as protecting megasites in Greater Yellowstone Ecosystem to increase environmental variation and protect endangered species more effectively, these policies were not applied to Yellowstone due to its uncertainty in real life application15. If this tendency continues without applying any new policies due to this uncertainty, the elk population will increase again and repeat the serious environmental devastation before 1995.
Lotka-Volterra Predator-Prey Model in Yellowstone
To estimate the impact of interactions between two species, in 1926, Lotka and Volterra developed the Lotka-Volterra equations and model16. Lotka-Volterra equations use various differential equations for the population growth of each variable17. Through the Lotka-Volterra equations, researchers are able to find the population graph over time and realize there was a specific tendency on the graph; populations of prey and predators rise and fall in a loop18. When the population of prey increases, the predator population starts to grow by eating more prey, and vice versa, when the predator population increases, prey population starts to decrease and if there is not enough prey to eat, predators start to decrease again19. In fact, to estimate the impact of gray wolves after the reintroduction in Yellowstone, the researchers have analyzed the relationship between elk and gray wolves and developed an accurate model for its estimated population20.
While the classic Lotka-Volterra model helps people to estimate the populations of two species during their interaction, estimating the whole ecosystem through interaction between only two species is insufficient in applying a realistic model. Therefore, many scientists have started to develop an advanced Lotka-Volterra model by adding one more variable and estimate interactions among three species21. For example, the advanced three-species Lotka-Volterra model which applied bifurcation theory showed the complex interactions among elk, beavers, and wolves due to various factors, such as carrying capacity and living areas22. Three species models are also used to demonstrate omnivory models. For example, the model that demonstrated interactions of prey, middle predator, and top predator graphed prey peaks first, followed by middle predator, then top predator23. However, another study found in an omnivorous model, the small changes of variable values can result in significantly different results on their interaction24.
New Policies to Prevent Environmental Devastation
To decrease the overpopulation of elk populaiton, many studies have suggested various applicable solutions, such as regulating the amount of harvesting rate. Since harvesting can target specific animal populations, harvesting on elk populations is considered as more efficient to solve the overpopulation of the Yellowstone ecosystem faster25. In fact, restricted harvesting can help ecosystems to be protected for other animals from extinction by wolves while more research should be conducted in political and ethical perspectives26. Furthermore, protecting the megasite in Yellowstone can increase the protection of the highly endangered species to 71%15.
In contrast, some researchers have considered reintroducing predators again to prevent overpopulation of elk. For example, the Markov predator-prey model simulation shows that reintroduction of wolves can lower deer densities, which can give stability to Scotland’s ecosystem27. Additionally, the reintroduction of largemouth bass in a Michigan lake has resulted in significant increase of zooplankton biomass and water clarity28.
While these policies can give impactful benefits to the Yellowstone ecosystem by decreasing elk overpopulation, it can also result in devastating extinctions. For example, through the mathematical model, researchers state that the small changes of harvesting rate can result in big population changes, even extinction of species29. Moreover, while building the mathematical model, it is important to consider different hunting targets to increase accuracy. For example, hunting preferences of wolves and humans are different since while hunters commonly hunt 2-9 years old elk, gray wolves hunt calves who are immature to increase hunt success rate30. Additionally, the results of reintroduction of predators are varied regardless of complication and relationship of the system31. For example, the reintroduction of Acinonyx jubatus in South Africa’s Eastern Cape Province was not successful after decreasing its number from 59 to 4132.
Gap
Due to the exponential growth of the elk population, Yellowstone is having a serious problem in stabilizing the ecosystem. If this elk population tendency continues, this will repeat the serious environmental devastation and impact the whole Yellowstone ecosystem significantly. Therefore, to stabilize the Yellowstone ecosystem, determining the best policy is significant. While many new policies, such as harvesting rates and reintroduction of grizzly bears or gray wolves, are discussed as solutions to restabilize the ecosystem, most of the research only presents single solutions instead of comparing those policies to find the most effective policies. Furthermore, since the classic Lotka-Volterra model can only generate the relationship between two components, it is hard to simulate the whole Yellowstone ecosystem, which consists of various animals. Due to the lack of research comparing these policies and lack of reliability on results with classic Lotka-Volterra model, Yellowstone cannot apply solutions into real life immediately. Therefore, it is necessary to compare the impact of three new policies and find the best policy that can stabilize the Yellowstone ecosystem. This research used correlational research and trend analysis by analyzing the population of 8 animal compartments in a controlled environment and adding three new policies to compare and determine the best policy for Yellowstone ecosystem.
Methods
Methodology Design
The goal of this research was to find the proper policy that can stabilize the Yellowstone ecosystem. Therefore, it was significant to analyze the relationship among populations of elks, grizzly bears, cutthroat trout and wolves and determine the impact of new policies on the Yellowstone ecosystem over time. To accomplish this goal, this research used deterministic compartment differential equations as methodology design. Deterministic compartment models were effective on this research since it identified the relationship among animal compartments and applied them onto its rate of population change equations. Furthermore, to reach the main goal to evaluate each new policies simulated in different models, deterministic compartment differential equations could analyze the tendency of animal populations in controlled environments and predict the impact of new policies over time. Since this research analyzed the population change of each animal depending on its interaction with other animal compartments over time, it perfectly aligned with deterministic compartment differential equations to evaluate the population change over time with new policies and determine the best policy to stabilize the Yellowstone ecosystem.
Instrument and Data Collection
Since this research had to estimate the impact of new policy that can stabilize the Yellowstone ecosystem before applying it to the real world, this research was conducted in a controlled environment with specific compartments and variables. Moreover, to improve the accuracy of the model, each animal compartment had baby and adult stages since only adult predators can hunt, and they prefer baby prey who are weaker than adults. Since applying the new policies in the real world would take a lot of risks, requirements, and time, this research was conducted through computer simulation and didn’t require any human or animal subjects. To track the animal population and analyze the changes over time, the computer simulation program called Vensim was used. In Vensim, each animal compartment stored independent variables, such as birth and death rate, survival rate and hunting rate, and the simulated data from Vensim were collected and graphed to be analyzed.
To prevent the AI over-reliance on unreviewed data, all the data of animal population and its variables were collected through the official Yellowstone website provided by the US government. In addition, all journals used in this research were peer-reviewed academic journals published after 1990 by reliable journal publishers, such as EBSCO, Wiley, and JSTOR. Furthermore, all the references were reviewed to ensure that it is tier 1 source through Annotated Bibliography and cited the keywords from research through narrative synthesis.
Establishing Background
This research used 4 main animal types that impact the advanced Lotka-Volterra model most impactfully; elk and gray wolf to address the problems addressed in this research, grizzly bear to simulate food chain relationship before gray wolf reintroduction, and cutthroat trout to prevent grizzly bear to extinct after gray wolf reintroduction due to high competition on prey; for simplicity and clarity, cutthroat trout was called as salmon and gray wolf as wolf. In this research, there were a total eight compartments: Baby Elk (BE), Adult Elk (AE), Baby Salmon (BS), Adult Salmon (AS), Baby Grizzly Bear (BG), Adult Grizzly Bear (AG), Baby Wolf (BW), Adult Wolf (AW). Each compartment had its own birth and death rate, and the baby animal compartments moved to adult animal compartments after a specific time interval depending on its survival rate. Moreover, depending on the relationship of compartments, the compartments had decreased or increased their population with its hunting rate, encountering rate, and survival rate.
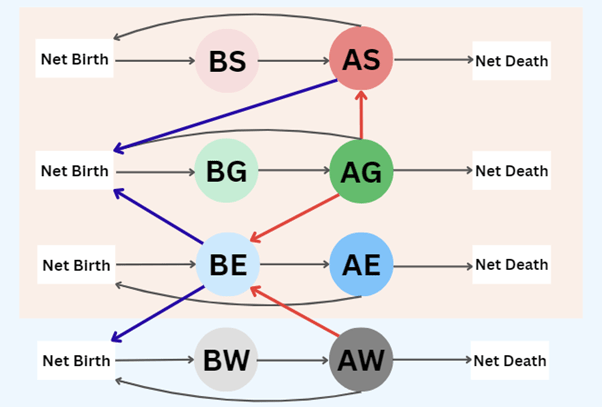
Figure 1 visualized the relationship of animal compartments in the Advanced Lotka-Volterra Model. Each alphabet in the circle represented different animal compartments and the arrows represented the relationship between two variables or compartments. There were different derivation formulas for each directional arrow that represented the size of population moving through the compartments per year. The red highlighted area is the relationship from 1950 to 1994, and the blue highlighted area is the relationship from 1995 to 2025.
While elks, salmon and grizzly bears have existed continuously throughout Yellowstone, wolves were reintroduced in 1995 to reduce the overpopulation of elk. Therefore, this research built 2 different models from 1950 to 2025 that establish the background information about the impact of reintroduction of wolves in 1995 – model from 1950 to 1994 and model from 1995 to 2025. Furthermore, to evaluate the three new policies, four different models including each policy and without any policy were built from 2025. Each animal was divided into two stages, adult animal (AA) and baby animal (BA). In addition, only adult grizzly bears (AG) were able to hunt the baby elks (BE) and adult salmon while adult gray wolves (AW) only hunt baby elks (BE) in this controlled environment.
Based on the data of and relationship among animal compartments, equations for Vensim were built. Each animal contained 2 variables, net birth (NB) and net death (ND). Since only female adult animals can give birth to a certain number of babies annually with specific reproduction rate, the equation for natural birth rate (NB) included sex ratio, reproduction rate, and annual number of babies. Moreover, the net death rate (ND) for all animals was calculated by considering its average life span, natural death rate in adult age. Since this research assumed that the number of populations on each age are same, 1/(average life span) was used to calculate the probability that specific population is reached the maximum age in average life span.
NB = (female ratio * reproduction rate * annual baby number) * AA
ND = (adult natural death rate * (1/(average life span)) * AA
To transfer the baby animal population (BA) to adult animal population (AA) after the specific age is passed, the survival rate (SR) was considered the survival rate from baby to adult and its age to be adult. This equation assumed that all ages in the baby stage have the same distribution and calculate the probability of the number of babies getting into the adult stage among the baby animal population, which is 1/(years in baby stage). Furthermore, the adult predators were able to hunt the baby elks (BE) and adult grizzly bears (AG) could also consume adult salmon (AS) in this controlled environment. Also, considering that prey and predators are living in different areas and habitats, the equation for hunting rate on prey (HR) included encounter rate and hunting success rate.
SR = (baby survival rate * 1/years in baby stage)
HR = (encounter rate * hunting success rate)
Compared to praise, the hunting rate impacted the net birth of predators (NBP) since the animal should pass the baby stage before becoming an adult stage. Moreover, in the net birth of predators (NBP), the food availability was added considering that there would be more prey besides elks and salmon.
NBP = NB * (HR * targeted prey) / (food availability + targeted preys)
Model 1: Ecosystem Before Reintroduction (1950~1994)
All baby animal components get net birth rate and decrease due to its hunting rate from predators or survival rate, which goes as growth rate of adult animal components. Then the adult animal population get its growth rate from survival rate while it decreases by its net death rate or hunting rate from predators. In the controlled environment from this research, from 1950 to 1994, wolves were extinct at the end of 1920s due to over harvesting and therefore elks, salmon and grizzly bears were the only animal variables that existed. Also, since the adult grizzly bears (AG) could hunt only baby elks (BE) and adult salmon (AS), its hunting rate impacted the rate of change of adult salmon and baby elk.
dBE/dt = NB – (SR + HR * AG) * BE
dAE/dt = (SR * BE) – ND
dBS/dt = NB – (SR * BE)
dAS/dt = (SR * BE) – (HR * AG * AS) – ND
dBG/dt = NBP – (SR * BG)
dAG/dt = (SR * BG) – ND
Model 2: Ecosystem After Reintroduction (1995~2025)
Although the gray wolves were released partially from 1995 to 1997, for the simplicity, this research reintroduced total 41 gray wolves in 1995 in the model. To build this model, the population of elk, salmon, and grizzly bears in 1994 from Model 1 was set as the initial population value to stabilize the overpopulated elk. Since adult gray wolves (AW) hunt baby elks (BE) only, wolves don’t have a relationship with salmon. Also, the derivative equation for baby elks (BE) changed by adding the hunting rate of gray wolves on elks.
dBE/dt = NB – (SR + HR * AG + HR * AW) * BE
dBW/dt = NBP – (SR * BW)
dAW/dt = (SR * BW) – ND
Constants of Lotka-Volterra Model
| Elk | Salmon | Grizzly Bear | Gray Wolf | |
| Initial BA | 6250 | 17647 | 90 | 0 |
| Initial AA | 18750 | 353 | 810 | 41 |
| Female Ratio | 0.4 | 0.5 | 0.5 | 0.5 |
| Reproduction Rate | 0.6 | 0.6 | 0.35 | 0.4 |
| # of BA in Birth Annually | 1 | 1000 | 0.5 | 4 |
| # of Years in BA Stage | 2 | 2 | 4 | 2 |
| BA Survival Rate | 0.45 | 0.32 | 0.65 | 0.4 |
| AA Natural Death Rate | 0.01 | 0.48 | 0.09 | 0.024 |
| Average Life Span | 8 | 12 | 20 | 5 |
| Food Availability | – | – | 600 | 1000 |
| AG Encounter Rate | 0.3 | 0.14 | – | – |
| AG Hunting Success Rate | 0.2 | 0.61 | – | – |
| AW Encounter Rate | 0.18 | – | – | – |
| AW Hunting Success Rate | 0.28 | – | – | – |
Table 1 showed the numerical values that were used for each constant on the equations for the animal compartments. The initial population of BA and AA were calculated considering age distribution. Additionally, if the AA didn’t give birth annually, the year was divided by the number of babies; for example, since grizzly bears give 2 babies a birth per 4 years, it was calculated as 0.5 baby per year. Initial values of elks, salmon, and grizzly bear are in 1950 while gray wolf is in 1995. These constants were applied from academic journals and reviews, studied by National Park Service, Okisamen et al., and Yellowstone official website managed by the US government.
Models for New Policies
To stabilize the increasing elk population, three new policies were added in Model 2. Due to the limitation of Vensim model on introducing temporary factors, this research only used new policy that adds populations of specific components or introduces constant rate. Therefore, as a new policy, this research reintroduced each wolf and grizzly bear and introduced harvesting rate on elk. Each policy was generated based on the population of each compartment from the previous model in 2024 and models were compared with its tendency instead of actual population value. The value of each added compartment population and rate were set as the best value that can stabilize and have most effective impact on the Yellowstone ecosystem after repeated simulations of the model with various values.
All the graphs in Model 3 set its initial population of all 8 animal compartments in 2025 from both Model 2 and actual population. Also, to compare the difference between new policies more effectively, the Model 3.1 that doesn’t introduce any policies was generated.
Model 3.2: Ecosystem with Harvesting Rate (2025~)
In this research, it assumed that the harvesting rate impacted only on the adult elk’s population (AE). The animal population values depending on the value of the harvesting rate were collected and determined the best value that can stabilize the ecosystem effectively. The harvest rate was set as 0.2% of the elk population.
dAE/dt = (SR * BE) – [ND + (harvesting rate * AE)]
Model 3.3 & 3.4: Ecosystem with Wolves and Grizzly Bears (2025~)
Instead of introducing harvesting rate, Model 3.3 and 3.4 reintroduced more wolf or grizzly bear population. Equations of each animal compartment were the same as Model 2 while Model 3.3 added 100 more adult wolves and Model 3.4 added 300 more adult grizzly bears in its initial population.
Analyzing the Data
The population of all animal compartments from models were collected through Vensim to generate the graphs. Instead of comparing the actual value, the tendency of the graphs was analyzed. In particular, Model 1 and 2 focused on the impact of reintroduction of wolves while Model 3 focused on determining the best policy that is more effective to stabilize the Yellowstone ecosystem by comparing its stabilizing period and population dynamics of each animal compartment.
Results
Based on the constructed values and relationships among animal compartments, a total of six models were constructed. Among those, two models from 1950 to 2025 focused on evaluating the impact of reintroduction of wolves while other four focused on determining the best policy for the future Yellowstone ecosystem. All models graphed the population of each adult animal compartment over time.
In the Lotka-Volterra Model, there is a specific period that repeats the same pattern over time, which is called harmonized period (HP) in this research. To have a stabilized environment, each compartment has the same harmonized period with the same maximum and minimum population value over time33,34. In this research, since gray wolves have direct interaction with elks and showed the clearest maximum and minimum point, this research used harmonized period and maximum population value of gray wolves to determine the stability of the Yellowstone ecosystem. Furthermore, this research hypothesized that the ecosystem has more stability when the harmonized period and maximum population value of gray wolves change less in every HP. However, considering the population change of prey and change of specific population value through new policies, the change of maximum population value was compared instead of its maximum value by itself.
Impact of Reintroduction of Wolves
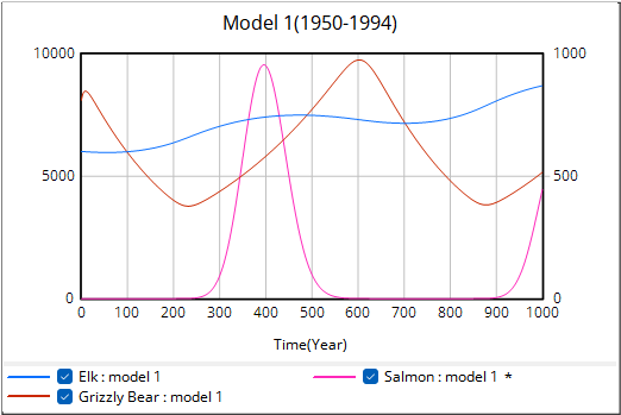
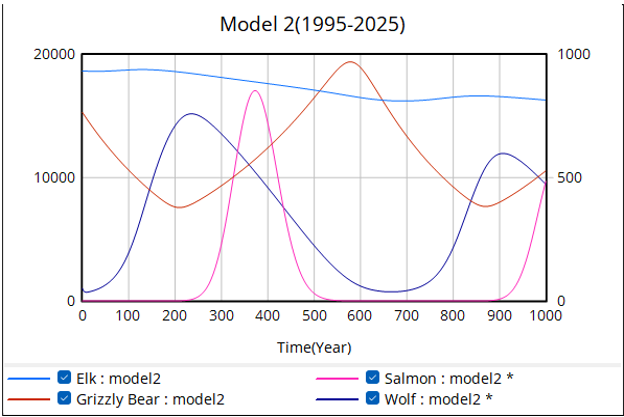
Figure 2 and 3 graphed Model 1 and model 2 to compare the population tendency of animal compartments based on the reintroduction of wolves. In Model 1, all animal compartments had harmonized periods in their own specific periods. Furthermore, preys and predators had similar characteristics shown in the Lotka-Volterra Model. For example, when the population of grizzly bears decreased, the salmon population increased, and vice versa. However, the elk compartment had different tendencies. While it had harmonic patterns in every specific period, the elk population increased at most 4760 at each harmonized period when each harmonized pattern reached its maximum and minimum point kept increasing over time.
On the other hand, the Model 2, after the reintroduction of wolves, showed the opposite tendency. While all populations of the animal compartments had regular harmonic patterns in their own harmonized period, the elk population decreased and its maximum point kept decreasing over time. However, compared to what the elk population increased in Model 1, the maximum decrease of elk population in Model 2 was 2526. Moreover, the maximum population value of gray wolves decreased from 602 to 478 and its harmonization period decreased from 659 years to 491 years.
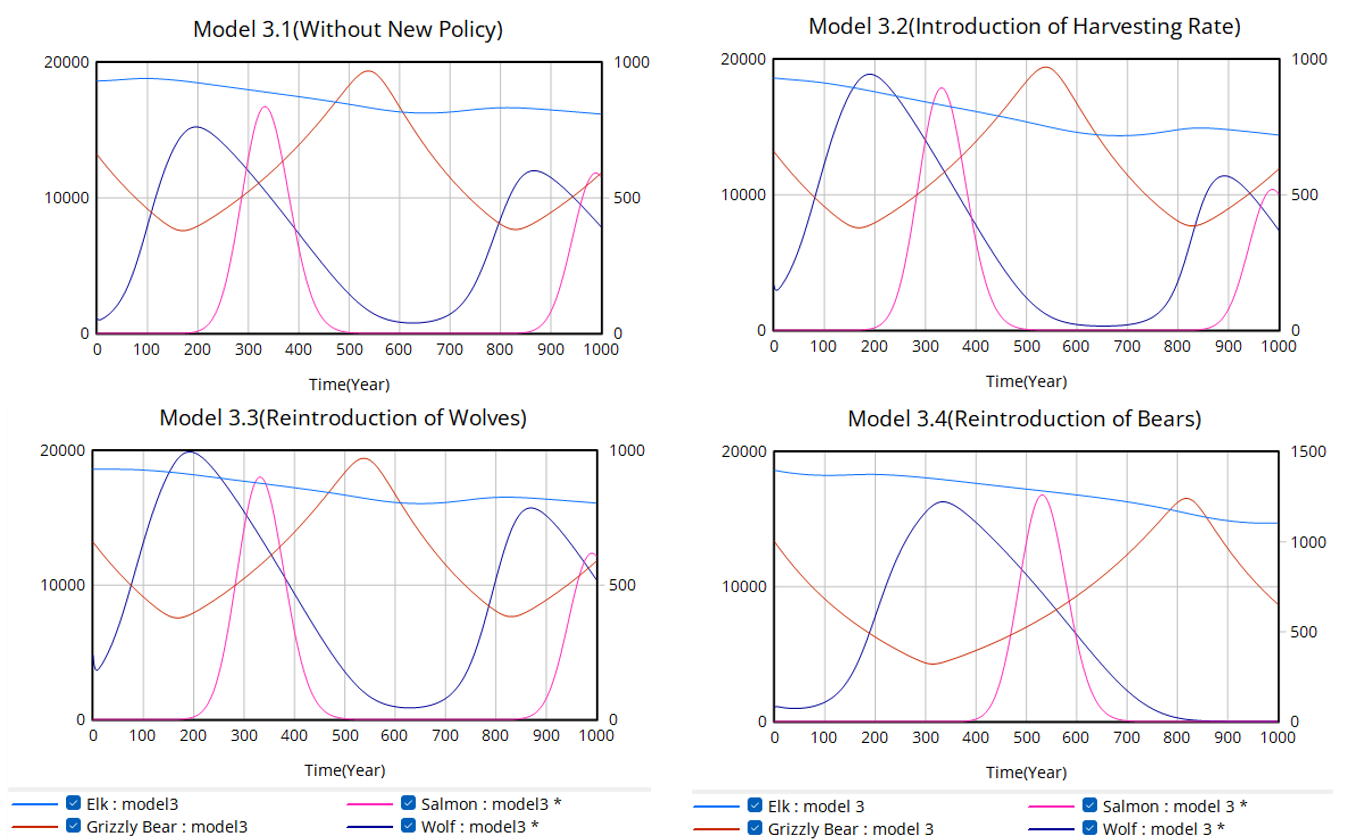
Figure 4 included 4 different models that introduced different policies for Yellowstone ecosystem: introduction of harvesting rate, reintroduction of grizzly bear, reintroduction of gray wolves, and without any new policy.
The Model 3.1 in Table 3 simulated without any policy to observe how the population dynamics of the Yellowstone ecosystem will be affected if there is no policy that regulates the ecosystem. Overall, its tendency was similar to the tendency shown in Model 2. The elk population decreased 2457 at most in one harmonized period and the harmonized period of wolves was shortened from 624 years to 543 years over time. In addition, the first maximum population value of wolves was 610, but it decreased to 480 in the second maximum point.
To decrease the elk population and regulate the harmonized period, the harvesting rate was introduced in Model 3.2. Even though the harmonized period of gray wolves was similar with Model 3.1 with a decrease rate from 641 years to 559 years, compared to Model 3.1, it showed a significant decrease in the elk population with 4263. However, the maximum population of gray wolves decreased even more than Model 3.1, with value from 565 to 341.
In Model 3.3, the wolves were reintroduced again as a new policy that can regulate the Yellowstone ecosystem. Like Model 3.1, the maximum decrease of elk population was about 2531 and the difference between the maximum wolf population value in first and second harmonized periods, maximum height was about 126. However, while the first harmonized period of gray wolves was 622 years, which was similar with Model 3.1, the second harmonized period was about 608 years.
The last policy that was introduced to decrease the elk population and stabilize the Yellowstone ecosystem was reintroduction of grizzly bears. In this Model 3.4, the population of elk decreased 3973 at most, which was close to the increase rate from Model 1 compared to Model 3.1 and 3.3. In addition, the harmonized period of gray wolves didn’t reach until more than 950 years later.
Discussions
The goal of this research was to decrease the elk population and stabilize the Yellowstone ecosystem. Based on the analysis of the impact of reintroduction of wolves in 1995, the new policies were compared to determine the best policy that can decrease the overpopulation of elk and stabilize the Yellowstone ecosystem after 2026.
Before comparing the impact of new policies, this research analyzed the impact of reintroduction of wolves through Model 1 and 2. After the reintroduction, the elk population decreased with a harmonized period. However, the small decrease rate of the elk population compared to the increased rate in Model 1 showed that even though it could decrease the population of elk a bit, it couldn’t catch up with the increase of elk population going on in Yellowstone before 2025. In addition, the harmonized period of all animal compartments in Model 2 decreased over time; for example, harmonized period of gray wolves decreased from 683 years to 537 years. Overall, the decrease of harmonized periods and small change of overpopulated elk can lead to the unstabilized Yellowstone ecosystem again in short periods of time, which shows the necessity of new policy introduction to stabilize the whole ecosystem.
To prevent the instability of the Yellowstone ecosystem, four models with new policies were compared. While introduction of harvesting rate decreased the elk population significantly, it shortened the harmonized period over time, which means the Yellowstone ecosystem could be ecologically destabilized easily. In addition, the big difference of maximum population between the first and second harmonized period showed that animal compartments can be endangered. While reintroduction of gray wolves could give a stable harmonized period over time, its low decrease rate on elk population and decrease of maximum population warned the unstable Yellowstone ecosystem. In conclusion, while the harvesting rate could decrease the elk population significantly, to use this policy, another policy should be introduced to stabilize the ecosystem.
Compared with those three models, the reintroduction of grizzly bears gave the most ideal stabilization of the Yellowstone ecosystem. Although it couldn’t decrease the elk population more than Model 3.3 and the increase rate in Model 1, it could decrease more than Model 3.1 and 3.3. Therefore, reintroducing the grizzly bears was determined as the best policy among new policies in this research to stabilize the Yellowstone ecosystem for a long time.
Connection to Objectives
Through Model 3.1, this research could observe that the elk population kept increasing while the harmonized period of all animal compartments is getting shorter over time. This showed the concern on exponential growth of the elk population after 2025, which means Yellowstone should apply policies that could reduce the elk population quickly. Therefore, applying the harvesting rate first to decrease the elk population would be the best policy among new policies introduced in Model 3. However, if Yellowstone keeps applying the harvesting rate for a long time, this might result in the extinction of the elk population, which can result in the instability of the Yellowstone ecosystem. Therefore, after using the harvesting rate, Yellowstone should apply another new policy to stabilize the Yellowstone ecosystem fully.
Accuracy Testing on Advanced Lotka-Volterra Model
To evaluate the accuracy of the advanced Lotka-Volterra Model developed in this research, parameter sensitivity analysis was conducted in all Model 3. In this research, parameter sensitivity analysis was conducted by changing the value of constants, such as reintroducing grizzly bear and gray wolf population value and harvesting rate value and compared difference between first and second harmonic period of gray wolf and most significant decrease value of elk population. While harvesting rate were modified  0.1%, the wolf and grizzly bear population were modified 10%.
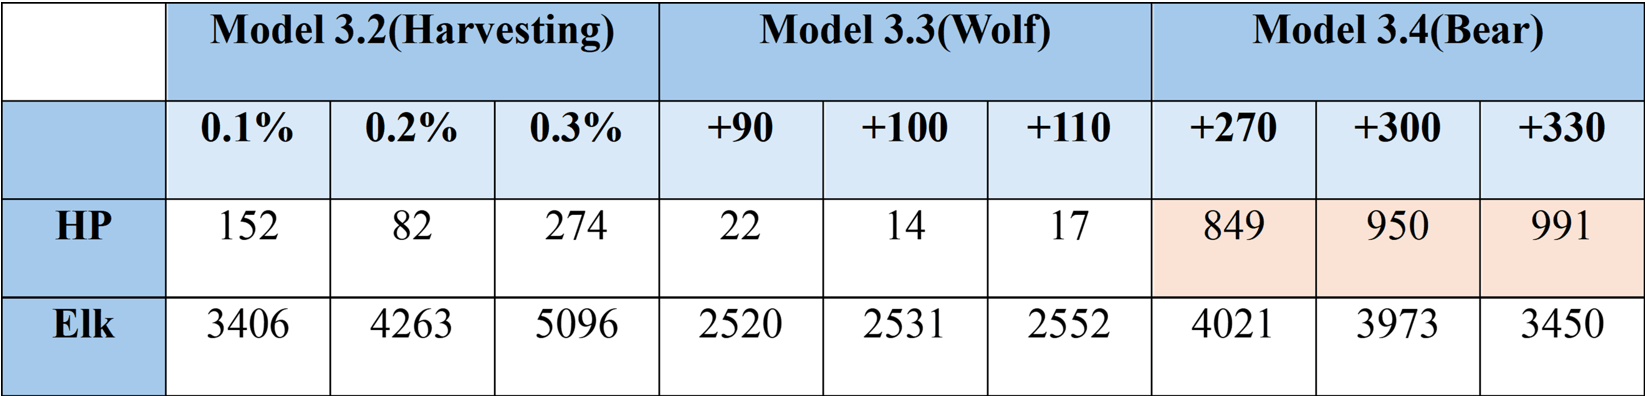
Figure 5 is a table that shows the value of first and second harmonic period and maximum population of gray wolf depending on the model and the value that were modified for sensitivity analysis. While HP represents the difference between first and second harmonized period and Elk represent the largest decrease of elk population, the bear reintroduction calculated the value of duration of first harmonized value due to its long-harmonized period.
For Model 3.2, the introduction of harvesting rate, both harmonized period differences and decrease of elk population were very significant with the small change of harvesting rate. For example, when the 0.3% of harvesting rate was reintroduced, the elk population decreased more compared to the original rate, 0.2%, while the harmonized period difference was very large with 274 years, compared to 82 years in 0.2%. Therefore, it shows that harvesting rate has significant sensitivity on its value, which means when it is applied into real-life, it requires a lot of cautious on modifying this value to prevent ecosystem destruction and stabilize ecosystem effectively.
In contrast, Model 3.3 and 3.4, the gray wolf and grizzly bear reintroduction, had the less sensitivity in both harmonized period difference and elk population decrease. In addition, Model 3.3 had very small the harmonized period difference compared to Model 3.2, which shows more stabilization in ecological ways. However, since its first harmonized period lasted for about 600 years, Model 3.4, which has first harmonized period lasting more than 900 years, Model 3.4 has more stabilized ecosystem compared to Model 3.2 and 3.3.
Limitations
To observe the interactions among the animal compartments, this research focused on 4 animals living in Yellowstone. However, since there are over 67 different mammals living in Yellowstone, using only 4 animal compartments in this research might limit the population change of each compartment, which can give different observations and analysis on impact of new policies in Yellowstone ecosystem35. Furthermore, since this model used only four animal types due to the goal of this research, the prey preferences and interspecies competition might be biased or limited.
The model simulation and interpretation might be limited compared to the real population dynamics in Yellowstone ecosystem. For example, since Vensim could simulate its data only for 1000 years, only one or two harmonized periods were observed, which could result in limited predictions on further population dynamics of animal compartments, which can give inaccurate data on evaluating and predicting the impact of new policies. Moreover, since this research used the change of harmonized period and maximum gray wolf population in every HP, this research didn’t consider the factors, such as resilience, biodiversity maintenance, and equilibrium persistence, which can impact the interpretation of ecological stability significantly.
Environmental factors, such as seasons, migration, disease, and spatial heterogeneity, such as torpor and abundance area, were not considered in this research. For example, grizzly bears can survive 5-7 months without food and predators usually have torpor during the winter, which means they don’t encounter or hunt the prey at that period36. In addition, the death rate of many preys, especially elk, increases during the winter due to the lack of food resources and severe weather conditions37. However, since Vensim can’t simulate the temporary or seasonal factors in its model, those environmental factors couldn’t be considered, which can result significant differences between simulated models and real population dynamics in Yellowstone ecosystem.
Implications and Future Directions
To improve the accuracy of the model and find more reliable policy for the ecosystem, researchers can add more details. For example, by minimizing the mean absolute percentage error, it can improve the prediction accuracy of the Lotka-Volterra model38. Additionally, Baker and his colleagues applied their own method to prioritize the major species that contribute to the ecosystem for the Lotka-Volterra model39. Furthermore, after developing the model, using stability and bifurcation analysis which can identify the range that all animal compartments can exist would help the model to consider whether it is reliable or not40. If these details apply, the advanced Lotka-Volterra model introduced in this research will be able to improve its accuracy and identify the complex relationships of major animal species in Yellowstone.
Closing Thought
To stabilize the Yellowstone ecosystem from overpopulation of elk, this research developed the advanced Lotka-Volterra model. This research applied three different new policies and concluded that among new policies introduced in this research, introducing the harvesting rate should be applied if the elk population should be decreased significantly while reintroducing the grizzly bears would be the best policy that can not only decrease the elk population but also stabilize the whole ecosystem most effectively. Even though there are still problems that need to be solved to improve the accuracy of this model, this model will be used as the base research that could develop more accurate models in further research that will give the new policy that can apply to the Yellowstone system.
References
- P. Cafaro, P. Hansson, F. Götmark. Overpopulation is a major cause of biodiversity loss and smaller human populations are necessary to preserve what is left. Biological Conservation. Vol. 272, pg. 109646, 2022. [↩]
- T. Peglar. Yellowstone’s Most Controversial Residents. Yellowstone National Park, 2022. [↩]
- L. L. Eberhardt, P. J. White, R. A. Garrott, D. B. Houston. A seventy-year history of trends in Yellowstone’s northern elk herd. Journal of Wildlife Management. Vol. 71, pg. 594–602, 2005. [↩]
- How wolves help willows. Environment. Vol. 47, pg. 4-5, 2005. [↩]
- D. Middleton, T. A. Morrison, J. K. Fortin, C. T. Robbins, K. M. Proffitt, P. J. White, D. E. McWhirter, T. M. Koel, D. G. Brimeyer, W. S. Fairbanks, M. J. Kauffman. Grizzly bear predation links the loss of native trout to the demography of migratory elk in yellowstone. Proceedings Biological sciences. Vol. 280, pg. 20130870, 2013. [↩]
- J. R. McClelland, N. C. Coops, S. P. Kearney, A. C. Burton, S. E. Nielsen, G. B. Stenhouse. Variations in grizzly bear habitat selection in relation to the daily and seasonal availability of annual plant-food resources. Ecological Informatics. Vol. 58, pg. 101116, 2020. [↩]
- H. Martin, L. Mech, J. Fieberg, M. Metz, D. Macnulty, D. Stahler, D. Smith. Factors affecting gray wolf (Canis lupus) encounter rate with elk (Cervus elaphus) in yellowstone national park. Canadian Journal of Zoology. Vol. 96, pg. 1032-1042, 2018. [↩]
- National Geographic. Wolves of yellowstone. National Geographic, 2023. [↩]
- D. R. MacNulty. The challenge of understanding northern yellowstone elk dynamics after wolf reintroduction, 2016. [↩]
- P. White. Northern yellowstone elk after wolf restoration [review of northern yellowstone elk after wolf restoration]. The Wildlife Society. Vol. 33, pg. 942–955, 2010. [↩]
- C. C. Schwartz, M. A. Haroldson, K. A. Gunther, D. Moody. Distribution of grizzly bears in the greater yellowstone ecosystem, JSTOR. Vol. 13, pg. 203–212, 2022. [↩]
- D. W. Smith, R. O. Peterson, D. B. Houston. Yellowstone after wolves. BioScience. Vol. 53, pg. 330–340, 2003. [↩]
- W. J. Ripple. Wolves, elk, bison, and secondary trophic cascades in yellowstone national park. The Open Ecology Journal. Vol. 3, pg. 31–37, 2011. [↩]
- National Park Service. Elk – Yellowstone national park. Nps.gov, 2016. [↩]
- R. F. Noss, C. Carroll, K. Vance-Borland, G. Wuerthner. A multicriteria assessment of the irreplaceability and vulnerability of sites in the greater yellowstone ecosystem. Conservation Biology. Vol. 16, pg. 895–908, 2002. [↩] [↩]
- S. Kingsland, J. Alfred. Lotka and the origins of theoretical population ecology. Proceedings of the National Academy of Sciences of the United States of America. Vol. 112, pg. 9493–9495, 2015. [↩]
- P. J. Wangersky. Lotka-Volterra population models. Annual Review of Ecology and Systematics. Vol. 9, pg. 189–218, 1978. [↩]
- P. Qi, K. Tomoaki. An example of Differential Equation: Lotka-Volterra Equation, 2022. [↩]
- S. Baigent. Lotka–Volterra dynamical systems. Dynamical and Complex Systems. pg. 157–188, 2016. [↩]
- Okisamen, J. Miller, N. Knepp. Analyzing the relationship between elk and gray wolves at yellowstone national park. Mathematical modeling and simulation project. ResearchGate, 2020. [↩]
- E. Chauvet, J. E. Paullet, J. P. Previte, Z. Walls. A Lotka-Volterra three-species food chain. Mathematics Magazine. Vol. 75, pg. 243–255, 2002. [↩]
- L. Tamjidi. Stability and bifurcation analysis of three species in yellowstone park consisting of prey, predator and competitor and the effects of predator reduction on living species in the ecosystem. UNB Scholar Research Repository, 2024. [↩]
- H. A. Adamu. Mathematical analysis of predator-prey model with two preys and one predator. Journal of Applied Sciences, 2018. [↩]
- D. Fields. Sensitivity analysis of wolf restoration in yellowstone nation park using omnivory models. Marshall Digital Scholar, 2017. [↩]
- D. W. Coltman. Molecular ecological approaches to studying the evolutionary impact of selective harvesting in wildlife. Molecular ecology. Vol. 17, pg. 221–235, 2008. [↩]
- Sjölander-Lindqvist. Targeted removal of wolves: analysis of the motives for controlled hunting. Wildlife Biology. Vol. 21, pg. 138–146, 2015. [↩]
- E. B. Nilsen, E. J. Milner-Gulland, L. Schofield, A. Mysterud, N. C. Stenseth, T. Coulson. Wolf reintroduction to Scotland: public attitudes and consequences for red deer management. Proceedings of the Royal Society B: Biological Sciences. Vol. 274, pg. 995–1003, 2007. [↩]
- G. G. Mittelbach, A. M. Turner, D. J. Hall, J. E. Rettig, C. W. Osenberg, Perturbation and resilience: a long-term, whole-lake study of predator extinction and reintroduction. Ecology. Vol. 76, pg. 2347–2360, 1995. [↩]
- P. R. Pokhrel, L. Bhabani. Dynamic analysis of prey-predator model with harvesting. Mathematics Education Forum Chitwan. Vol. 5, pg. 22–27, 2020. [↩]
- G. J. Wright, R. O. Peterson, D. W. Smith, T. O. Lemke. Selection of northern yellowstone elk by gray wolves and hunters. Journal of Wildlife Management. Vol. 70, pg. 1070–1078, 2006. [↩]
- J. M. Alston, B. M. Maitland, B. T. Brito, S. Esmaeili, A. T. Ford, B. Hays, B. R. Jesmer, F. J. Molina, J. R. Goheen. Reciprocity in restoration ecology: When might large carnivore reintroduction restore ecosystems? Biological Conservation. Vol. 234, pg. 82–89, 2019. [↩]
- M. W. Hayward, J. Adendorff, J. O’Brien, A. Sholto-Douglas, C. Bissett, L. C. Moolman, P. Bean, A. Fogarty, D. Howarth, R. Slater, G. I. H. Kerley. Practical considerations for the reintroduction of large, terrestrial,mammalian predators based on reintroductions to south Africa’s Eastern Cape Province. The Open Conservation Biology Journal. Vol. 1, pg. 1–11, 2007. [↩]
- H. Seno. Persistent prey species in the Lotka–Volterra apparent competition system with a single shared predator. Journal of Mathematical Biology. Vol. 90, 2025. [↩]
- Y. Li, Z. Zhao, B. Fu, Y. Zhang, Y. Lu, T. Li, S. Liu, G. Wu, X. Zheng, X. Wu. Ecological restorations enhance ecosystem stability by improving ecological resilience in a typical basin of the Yangtze River, China. Geography and Sustainability. Vol. 6, 2025. [↩]
- National Park Service. Mammals – Yellowstone national park. Nps.gov, 2016. [↩]
- C. C. Schwartz, M. A. Haroldson, G. C. White. Hazards affecting grizzly bear survival in the greater yellowstone ecosystem. Journal of Wildlife Management. Vol. 74, pg. 654–667, 2010. [↩]
- J. S. Horne, M. A. Hurley, C. G. White, J. Rachael, Effects of wolf pack size and winter conditions on elk mortality. The Journal of Wildlife Management. Vol. 83, pg. 1103–1116, 2019. [↩]
- L. Wu, Y. Wang. Estimation the parameters of Lotka–Volterra model based on grey direct modelling method and its application. Expert Systems with Applications. Vol. 38, pg. 6412–6416, 2011. [↩]
- C. M. Baker, A. Gordon, M. Bode. Ensemble ecosystem modeling for predicting ecosystem response to predator reintroduction. Conservation Biology. Vol. 31, pg. 376–38, 2016. [↩]
- Singh, N. Kumari, A. Kumar. The first mathematical model for elk wolf interaction in Yellowstone National Park using the E-SINDy algorithm. ArXiv.org, 2025. [↩]