Abstract
Drug resistance in cancer can develop within 6–12 months of treatment. This challenge motivates the continued development of additional therapeutic strategies. Drug synergy, achieved through combining different drugs, offers a potential solution by amplifying therapeutic effects. Although advantageous, the identification of therapeutic combinations that will achieve drug synergy is largely limited by laboratory resources. Identification of therapeutic combinations takes lengthy testing to determine effective combinations. To increase efficiency, this study developed a hypothesis-generating computational analysis that evaluates whether drug-gene interaction patterns are associated with previously reported drug synergy. These associations were then used to create an exploratory framework for prioritizing candidate drug combinations for future in vitro testing. The method begins with the Drug-Gene Interaction Database (DGIdb), a database of thousands of drugs and the genes that they likely interact with. Shared-gene counts and summed DGIdb interaction scores were compared between 60 published synergistic and non-synergistic drug pairs. Each drug was assessed using its combination to quantify the common genes and sum up their respective interaction scores. Using this computational method, candidate drug combinations were selected as hypotheses for future laboratory testing. Overall, this work suggests that DGIdb-based drug-gene interaction scores may help prioritize possible synergistic drug combinations, but prospective experimental validation is required before these combinations can be classified as synergistic.
Keywords: Drug Resistance, Drug Synergy, Drug-gene Interactions, Computational Screening, Cancer Therapeutics
Literature Review
Drug resistance has become a large issue, especially in the field of oncological research.1 Researchers investigate drugs to be administered that are personalized for the patient, but this process takes a substantial amount of time for laboratory testing to find positive combinations.2 As researchers explore the administration of many different drugs and their effects on diseases or conditions, certain trends start to form.3 Specifically, when two or more drugs are administered together, three types of outputs can be observed: synergistic, additive, and antagonistic.3
Drug synergy is defined as the occurrence when two drugs have a larger effect when combined than their individual sums would have.4 Additivity is when the drugs combined have an expected outcome, and antagonism is when one drug inhibits the other.3The outputs are measured by the dosages given to have a combined effect.4 This could be especially helpful if one drug has a side effect that can be harmful.Pairing it with another that boosts its effect with a lower dosage can be a good solution for many.5
The benefits of drug synergy are numerous. Because of the innovative combinations drug synergy presents, there is an increased chance that synergistic combinations will work in drug-resistant patients more than traditional treatments. Additionally, synergy can produce the same effect with a lower dose of drugs, as it reduces any harmful side effects from these drugs that many patients face.1 Lower doses and reduced side effects lead to less expensive treatments, largely increasing accessibility to the underprivileged.
However, a large problem emerges. Drug synergy combination discovery is an extremely lengthy process.6 This is because researchers must test thousands of combinations in the wet laboratory and do not have a specific marker for possible synergistic combinations.7 Because of this, a new way of identifying potential combinations started emerging through computational biology.2 As it is not feasible to test every ‘random’ combination of drugs to create a synergistic effect, creating a computational method that could shortlist combinations can significantly decrease the longevity of this process.2 Most computational models focus on two or three characteristics that are predicted by the researchers to have the strongest effect on synergism. These characteristics can include drug targets, gene pathways, drug-protein interactions, and more.8 Then, databases are created to analyze these characteristics. Computational models are usually multi-step. They use multiple of these databases to shortlist drug combinations that have previously been determined through laboratory testing.
Currently, these databases include AlphaFold, AutoDock, and DGIdb, to name a few. AlphaFold has been one of the most discussed databases today for its highly detailed images and user-friendly interface for protein-protein interaction docking. AlphaFold makes protein structure prediction very efficient for the user to get their job done without downloading any extensions.9 However, AlphaFold does not take into account different types of bonding, such as orthosteric (normal ligand sites) or allosteric (inhibition through non-active site ligands).10 Additionally, AlphaFold does not work for some types of drugs and only focuses on small molecules, which reduces the scope of applicability if used in a model.Autodock, however, is a docking database that includes many drugs as well as the small molecules AlphaFold uses.11 DGIdb is a gene interaction database that predicts interaction scores with drugs and genes, behaviors such as inhibition, and whether the drugs are regulated or not.12
However, most of these models that use some databases have drawbacks, reducing the accessibility and applicability of the model. For example, SynPathy is a model that has proven to work on ovarian cancer cell lines with a very small error, but it requires highly specific drug target data that may require testing itself.13 Other highly cited computational methods have also been developed to predict drug synergy, especially using machine learning and deep learning. DeepSynergy uses chemical descriptors and cell-line genomic information to predict anti-cancer drug synergy and showed improved prediction performance compared with several traditional machine-learning models.14 MatchMaker similarly uses drug chemical structure information and gene-expression profiles from cancer cell lines to predict synergy scores in a deep-learning framework.15 ComboFM uses factorization machines to model higher-order interactions among drugs, cell lines, and experimental response data in preclinical drug-combination screens.16 These methods are powerful because they learn from large experimental synergy datasets; however, they often require dose-response data, cell-line molecular profiles, or screening results that may not be available for every candidate drug pair. Contrastingly, the present study uses DGIdb-derived drug-gene interaction features as a more accessible, gene-partner-based screening approach.
Introduction
Although many computational methods exist, there has yet to be a universally reliable single feature that identifies drug synergy.8 Unlike these supervised methods, the present study does not attempt to outperform existing prediction models. It evaluates whether two readily available DGIdb-derived features may be useful for preliminary candidate prioritization when matched dose-response and cell-line omics data are unavailable. The purpose of this study was to see if shared gene overlap and summed interaction scores are associated with known synergy labels. Based on these associations, a preliminary computational framework was created to narrow candidate combinations for future in vitro testing.
Biologically, this approach is based on the idea that drug synergy can happen when two drugs affect related genes or connected molecular pathways instead of acting through completely separate mechanisms.17 A second drug that affects an overlapping or functionally connected gene may strengthen the overall therapeutic effect or reduce the cell’s ability to bypass the first drug. Therefore, shared DGIdb gene partners and higher summed interaction scores may suggest that two drugs act within related biological systems, making them reasonable candidates for further synergy testing. However, these shared gene-interaction patterns themselves do not prove synergy, and therefore the present framework uses shared drug-gene interactions only to prioritize combinations for future in vitro validation.
More specifically, functional synergy can arise through several related mechanisms. Two drugs may inhibit different points within the same signaling pathway, suppress parallel pathways that can compensate for one another, or prevent activation of an alternative pathway that allows a cancer cell to escape the effects of the first drug.18 Drug combinations may also produce synthetic-lethal effects, where simultaneous disruption of two interacting biological processes is more damaging to the cancer than the disruption of either process alone.19 In this context, functionally related drug-gene interactions could mean coordinated effects on these intertwined mechanisms. However, gene overlap cannot determine which mechanism is at play and may also reflect unnecessary targeting rather than true synergy. Therefore, this analysis treats shared gene interactions as associations for candidate prioritization rather than as evidence of synergy.
Methods
This study was designed as a hypothesis-generating computational association analysis and preliminary screening framework. Previously reported synergistic and non-synergistic drug combinations were compared using DGIdb features such as the number of shared gene targets and the summed interaction scores of shared genes. The goal was to evaluate whether these features distinguish reported synergistic combinations and use this pattern to see if a predictive screening framework could be made to prioritize candidate synergistic drug combinations. Because no wet-laboratory experiments were performed, the framework aims to generate candidates and needs further in-vitro testing.
DGIdb was selected because it provides drug-gene interaction information rather than requiring new experimental dose-response data. Traditional synergy metrics such as Bliss, Loewe, HSA (Highest Single Agent), and ZIP (Zero Interaction Potency) are calculated from experimental drug-response measurements, often across specific cell lines and dose matrices.20 Because this study was designed as a hypothesis-generating computational analysis, it did not attempt to generate new Bliss, Loewe, HSA, or ZIP scores. Instead, DGIdb relates gene partners and the drug-gene interaction features were used to prioritize combinations.
Combinatorial Drug Data Collection
An association between drug-gene interactions and synergism was sought by starting with a publicly available database of drug-gene interactions. The use of a public database allows replication of methods by others. A database that gathered information from multiple sources was chosen. DGIdb—a drug mining database that integrates data from over five other databases containing more than 10,000 drugs and 20,000 genes in its results—was used.
Thirty synergistic drug pairs were retained for analysis when a primary experimental study reported synergy for the pair in a defined experimental model and both drugs could be identified in DGIdb. The original experimental source and model used to support each classification are reported in Table 1. A total of 60 synergistic and non-synergistic combinations were collected. The drug combinations were then input into DGIdb, and a list of interaction scores was obtained.Each drug’s interactions with several genes were identified, with each interaction assigned a score. The drugs were added to a table, where genes common to both drugs were highlighted. Increasing interaction scores then sorted the genes, and the total and average sums of interaction scores for synergistic drugs were examined. The non-synergistic comparison group was not generated through random pairing. 30 drug pairs were selected from a published experimental drug-combination screen in which the combinations had been tested in breast cancer cell lines and reported as non-synergistic under the conditions of that study.21 These experimentally evaluated pairs were used as the comparison group for the DGIdb feature analysis. Pairs were included only when both drugs could be identified in DGIdb, and their drug-gene interaction information could be retrieved.
For each drug pair, the experimental classification, experimental model or cell line, synergy assessment method when available, and original primary source were recorded. Synergistic pairs were supported by primary experimental studies reporting synergistic or supra-additive combination activity in a defined experimental model. The non-synergistic comparison group was obtained from a standardized published drug-combination screen and consisted of pairs that did not meet the study’s synergy criteria under the tested conditions. These classifications were treated as specific to the experimental model, dose, and treatment schedule reported by each source instead of universal properties of the drug pairs.
Data Origin and External Synergy Labels
For each drug combination, the source study was recorded, along with the reported synergy classification and cell line when available. Because different studies used different experimental systems, cell lines, drug concentrations, and synergy definitions, numeric Bliss, Loewe, HSA, and ZIP values were not pooled into a single continuous outcome. Instead, combinations were classified according to the published source as synergistic or non-synergistic/additive/antagonistic. This allowed DGIdb features to be compared against experimentally reported labels while avoiding direct comparison of non-equivalent synergy scores across studies.
DGIdb interaction scores are generated from drug specificity, gene specificity, and evidence score, where evidence score reflects the number of supporting sources and publications.22 These values are multiplied to generate the final interaction score. Therefore, the summed DGIdb score used in this study reflects the strength and specificity of shared drug-gene interactions. The experimental classification, model or cell line, primary source, and DGIdb-derived features for each included drug pair are summarized in Tables 1 and 2.
| Drug combination | Experimental model/cell line | Primary experimental source | Source URL | # shared genes | DGIdb score sum |
| Carboplatin + Paclitaxel | 4 ovarian carcinoma cell lines; supra-additive in UT-OC-3, UT-OC-5, SK-OV-3 | Engblom et al., 1999 | https://pubmed.ncbi.nlm.nih.gov/10570433/ | 41 | 10.6339 |
| Carboplatin + Gemcitabine | 3 NSCLC cell lines; strongest in A549 when gemcitabine preceded carboplatin | Edelman et al., 2001 | https://pubmed.ncbi.nlm.nih.gov/11561780/ | 36 | 16.9997 |
| Cyclophosphamide + Doxorubicin | Murine carcinoma model | Tongu et al., 2010 | https://pubmed.ncbi.nlm.nih.gov/19940990/ | 32 | 3.9327 |
| Doxorubicin + Paclitaxel | BRC-230 breast cancer cells; doxorubicin → paclitaxel | Zoli et al., 1999 | https://pubmed.ncbi.nlm.nih.gov/9935183/ | 24 | 1.6626 |
| Cisplatin + Docetaxel | MKN-45, MKN-74, TMK-1 gastric cancer cells | Maeda et al., 2004 | https://pubmed.ncbi.nlm.nih.gov/15298732/ | 22 | 1.5377 |
| Cisplatin + Gemcitabine | Ovarian and colon cancer cell-line models | Bergman et al. | https://pubmed.ncbi.nlm.nih.gov/7660877/ | 22 | 4.3435 |
| Cisplatin + Irinotecan | Panel of 20 tumor cell lines; synergistic and antagonistic regions depended on drug ratio | Tardi et al., 2009 | https://pubmed.ncbi.nlm.nih.gov/19671743/ | 22 | 5.3328 |
| Fludarabine + Cytarabine | SKW-3, JOK-1, SALT-3, ED-40810 leukemia lines | Kano et al., 2000 | https://pubmed.ncbi.nlm.nih.gov/10720130/ | 22 | 8.3168 |
| Oxaliplatin + Fluorouracil | MKN-1, NUGC-3, NUGC-5, AZ-521 gastric cancer lines | Qin et al., 2006 | https://pubmed.ncbi.nlm.nih.gov/16550003/ | 22 | 8.4249 |
| Dabrafenib + Trametinib | BRAF-V600E preclinical tumor models | King et al., 2013 | https://pubmed.ncbi.nlm.nih.gov/23844038/ | 21 | 9.9588 |
| Carboplatin + Docetaxel | 4 ovarian carcinoma cell lines | Engblom et al., 1999 | https://pubmed.ncbi.nlm.nih.gov/10570433/ | 19 | 2.5837 |
| Cisplatin + Etoposide | Neuroblastoma cell lines | Meczes et al., 2002 | https://pubmed.ncbi.nlm.nih.gov/11875719/ | 15 | 1.1597 |
| Gemcitabine + Docetaxel | RAL and CAEP NSCLC cells; strongest with appropriate sequence | Zoli et al., 1999 | https://pubmed.ncbi.nlm.nih.gov/10574245/ | 14 | 1.5424 |
| Methotrexate + Fluorouracil | HCT-8 colon and 47-DN breast cancer cells | Benz et al., 1980 | https://pubmed.ncbi.nlm.nih.gov/7430346/ | 14 | 1.3398 |
| Irinotecan + Capecitabine | HCT-8, HT-29, A253, FaDu human tumor xenografts | Cao et al., 2005 | https://pubmed.ncbi.nlm.nih.gov/15663838/ | 12 | 1.8281 |
| Irinotecan + Oxaliplatin | HCT-116, HCT-8, HT-29, SW-620 colon cancer cells and xenografts | Guichard et al., 2001 | https://pubmed.ncbi.nlm.nih.gov/11593056/ | 12 | 2.3959 |
| Lapatinib + Neratinib | HER2+ breast models exist for each drug, but not the exact pair | Collins et al., 2019 | https://pubmed.ncbi.nlm.nih.gov/31141894/ | 12 | 2.5769 |
| Nivolumab + Ipilimumab | MC38 and CT26 mouse tumor models plus immune functional assays | Selby et al., 2016 | https://pubmed.ncbi.nlm.nih.gov/27610613/ | 12 | 7.2088 |
| Paclitaxel + Oxaliplatin | Colon cancer cells including DLD1 and SW480 | Fujie et al., 2005 | https://pubmed.ncbi.nlm.nih.gov/16024531/ | 12 | 1.114 |
| Trastuzumab + Lapatinib | HER2-amplified cancer cell models | Wainberg et al., 2010 | https://pubmed.ncbi.nlm.nih.gov/20179222/ | 12 | 2.1461 |
| Palbociclib + Fulvestrant | Breast cancer cell models | Warth et al., 2019 | https://pubmed.ncbi.nlm.nih.gov/30609717/ | 11 | 1.9492 |
| Olaparib + Temozolomide | UV-associated angiosarcoma cell lines | Weidema et al., 2021 | https://pubmed.ncbi.nlm.nih.gov/34085099/ | 10 | 3.9591 |
| Vemurafenib + Cetuximab | BRAF-V600E colorectal cancer models | Hong et al., 2016 | https://pubmed.ncbi.nlm.nih.gov/27729313/ | 10 | 4.5908 |
| Vemurafenib + Cobimetinib | BRAF-mutant melanoma patients | Ribas et al., 2014 | https://pubmed.ncbi.nlm.nih.gov/25037139/ | 10 | 5.136 |
| Afatinib + Cetuximab | K562 cells expressing EGFR L858R/T790M | Watanuki et al., 2014 | https://pubmed.ncbi.nlm.nih.gov/25446083/ | 9 | 4.1485 |
| Alpelisib + Fulvestrant | ER+ breast cancer / xenograft models | Bosch et al., 2015 | https://pubmed.ncbi.nlm.nih.gov/25877889/ | 9 | 1.2502 |
| Dabrafenib + Panitumumab | BRAF-V600E colorectal cancer patients | Corcoran et al., 2018 | https://pubmed.ncbi.nlm.nih.gov/29431699/ | 9 | 6.3311 |
| Everolimus + Paclitaxel | Breast cancer cell lines | Houdaihed et al., 2018 | https://pubmed.ncbi.nlm.nih.gov/29863881/ | 9 | 0.7018 |
| Gemcitabine + Oxaliplatin | Gallbladder cancer cell-line models | Makiyama et al., 2009 | https://pubmed.ncbi.nlm.nih.gov/19209029/ | 9 | 2.7161 |
| Osimertinib + Selumetinib | PC9 and NCI-H1975 EGFR-mutant NSCLC models | Cross et al., 2015 | https://pubmed.ncbi.nlm.nih.gov/25870145/ | 8 | 0.9478 |
| Drug combination | Experimental model / cell line | Primary experimental source | Source URL | # shared genes | DGIdb score sum |
| Docetaxel + Luminespib | Breast cancer cell-line panel | Jaaks et al., 2022 | https://www.nature.com/articles/s41586-022-04437-2 | 0 | 0 |
| Docetaxel + MK-2206 | Breast cancer cell-line panel | Jaaks et al., 2022 | https://www.nature.com/articles/s41586-022-04437-2 | 0 | 0 |
| Luminespib + Axitinib | Breast cancer cell-line panel | Jaaks et al., 2022 | https://www.nature.com/articles/s41586-022-04437-2 | 0 | 0 |
| MK-2206 + Camptothecin | Breast + colon cell-line panels | Jaaks et al., 2022 | https://www.nature.com/articles/s41586-022-04437-2 | 0 | 0 |
| Sapitinib + AZD7762 | Breast + colon cell-line panels | Jaaks et al., 2022 | https://www.nature.com/articles/s41586-022-04437-2 | 0 | 0 |
| Sapitinib + Camptothecin | Breast + colon cell-line panels | Jaaks et al., 2022 | https://www.nature.com/articles/s41586-022-04437-2 | 0 | 0 |
| AZD7762 + Axitinib | Breast cancer cell-line panel | Jaaks et al., 2022 | https://www.nature.com/articles/s41586-022-04437-2 | 1 | 0.0572 |
| Olaparib + PD173074 | Breast cancer cell-line panel | Jaaks et al., 2022 | https://www.nature.com/articles/s41586-022-04437-2 | 1 | 0.0406 |
| 5-Fluorouracil + AZD8055 | Breast + colon cell-line panels | Jaaks et al., 2022 | https://www.nature.com/articles/s41586-022-04437-2 | 2 | 0.1235 |
| Axitinib + Pictilisib | Breast cancer cell-line panel | Jaaks et al., 2022 | https://www.nature.com/articles/s41586-022-04437-2 | 2 | 0.0761 |
| AZD7762 + Paclitaxel | Breast + pancreatic cell-line panels | Jaaks et al., 2022 | https://www.nature.com/articles/s41586-022-04437-2 | 2 | 0.6123 |
| Olaparib + Sapitinib | Breast + colon cell-line panels | Jaaks et al., 2022 | https://www.nature.com/articles/s41586-022-04437-2 | 2 | 0.247 |
| OSI-027 + Camptothecin | Breast cancer cell-line panel | Jaaks et al., 2022 | https://www.nature.com/articles/s41586-022-04437-2 | 2 | 0.2417 |
| OSI-027 + Olaparib | Breast + pancreatic cell-line panels | Jaaks et al., 2022 | https://www.nature.com/articles/s41586-022-04437-2 | 2 | 0.1639 |
| OSI-027 + Paclitaxel | Breast + pancreatic cell-line panels | Jaaks et al., 2022 | https://www.nature.com/articles/s41586-022-04437-2 | 2 | 0.1856 |
| PD173074 + Paclitaxel | Breast cancer cell-line panel | Jaaks et al., 2022 | https://www.nature.com/articles/s41586-022-04437-2 | 2 | 0.4235 |
| 5-Fluorouracil + Axitinib | Breast cancer cell-line panel | Jaaks et al., 2022 | https://www.nature.com/articles/s41586-022-04437-2 | 3 | 0.1631 |
| Adavosertib (MK-1775) + Paclitaxel | Breast + pancreatic cell-line panels | Jaaks et al., 2022 | https://www.nature.com/articles/s41586-022-04437-2 | 3 | 0.1555 |
| Olaparib + Axitinib | Breast cancer cell-line panel | Jaaks et al., 2022 | https://www.nature.com/articles/s41586-022-04437-2 | 3 | 0.4289 |
| PD173074 + Docetaxel | Breast cancer cell-line panel | Jaaks et al., 2022 | https://www.nature.com/articles/s41586-022-04437-2 | 3 | 0.778 |
| PD173074 + Gemcitabine | Breast cancer cell-line panel | Jaaks et al., 2022 | https://www.nature.com/articles/s41586-022-04437-2 | 3 | 1.1298 |
| Camptothecin + Palbociclib | Breast + colon cell-line panels | Jaaks et al., 2022 | https://www.nature.com/articles/s41586-022-04437-2 | 4 | 0.4316 |
| Axitinib + Trametinib | Breast cancer cell-line panel | Jaaks et al., 2022 | https://www.nature.com/articles/s41586-022-04437-2 | 5 | 2.1934 |
| Crizotinib + Docetaxel | Breast cancer cell-line panel | Jaaks et al., 2022 | https://www.nature.com/articles/s41586-022-04437-2 | 5 | 0.1765 |
| Olaparib + Crizotinib | Breast + colon + pancreatic cell-line panels | Jaaks et al., 2022 | https://www.nature.com/articles/s41586-022-04437-2 | 5 | 0.1767 |
| Docetaxel + Olaparib | Breast cancer cell-line panel | Jaaks et al., 2022 | https://www.nature.com/articles/s41586-022-04437-2 | 7 | 0.1766 |
| 5-Fluorouracil + Docetaxel | Breast cancer cell-line panel | Jaaks et al., 2022 | https://www.nature.com/articles/s41586-022-04437-2 | 8 | 0.8867 |
| Docetaxel + Palbociclib | Breast cancer cell-line panel | Jaaks et al., 2022 | https://www.nature.com/articles/s41586-022-04437-2 | 8 | 0.2269 |
| Docetaxel + Trametinib | Breast cancer cell-line panel | Jaaks et al., 2022 | https://www.nature.com/articles/s41586-022-04437-2 | 8 | 0.5285 |
| Olaparib + Sorafenib | Breast + pancreatic cell-line panels | Jaaks et al., 2022 | https://www.nature.com/articles/s41586-022-04437-2 | 8 | 0.7234 |
Statistical Methods
Student T-tests were used to analyze the differences in the number of matching genes and the sums of matching gene interaction scores for both synergistic and non-synergistic genes. Each group contained 30 drug combinations. With groups this size, the t-test is generally robust to moderate differences from normality, so it was considered appropriate.23 The student’s t-test was employed to find significant differences in the means of the two data sets with a level of significance set to 0.05. Two 95% confidence intervals were created to describe the observed range of shared gene counts and summed interaction scores among the synergistic and non-synergistic combinations in this dataset. The intervals were used as preliminary thresholds for candidate drug combinations for in vitro testing.
Results
First, the mean number of genes overlapping between two drugs and standard deviations in known synergistic and non-synergistic drug combinations was calculated. This was 16.4 ± 3.05 for synergistic combinations and 3.03 ± 0.937 for non-synergistic combinations (Figure 1). Next, the mean number of the sum of interaction scores and standard deviations of these matching genes was calculated. This was 4.23 ± 1.32 for synergistic combinations and 0.345 ± 0.163 for non-synergistic combinations (Figure 2).
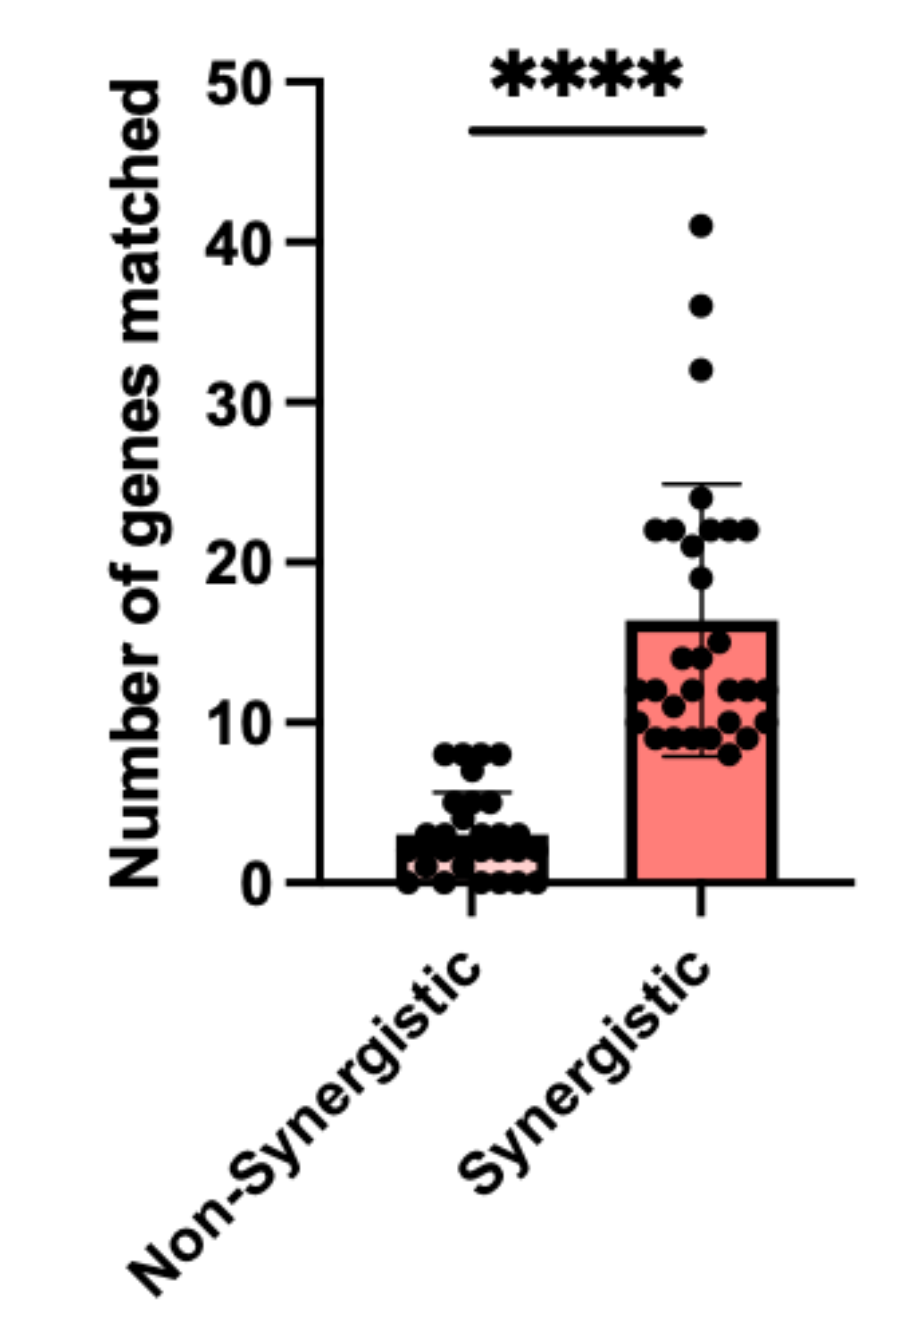
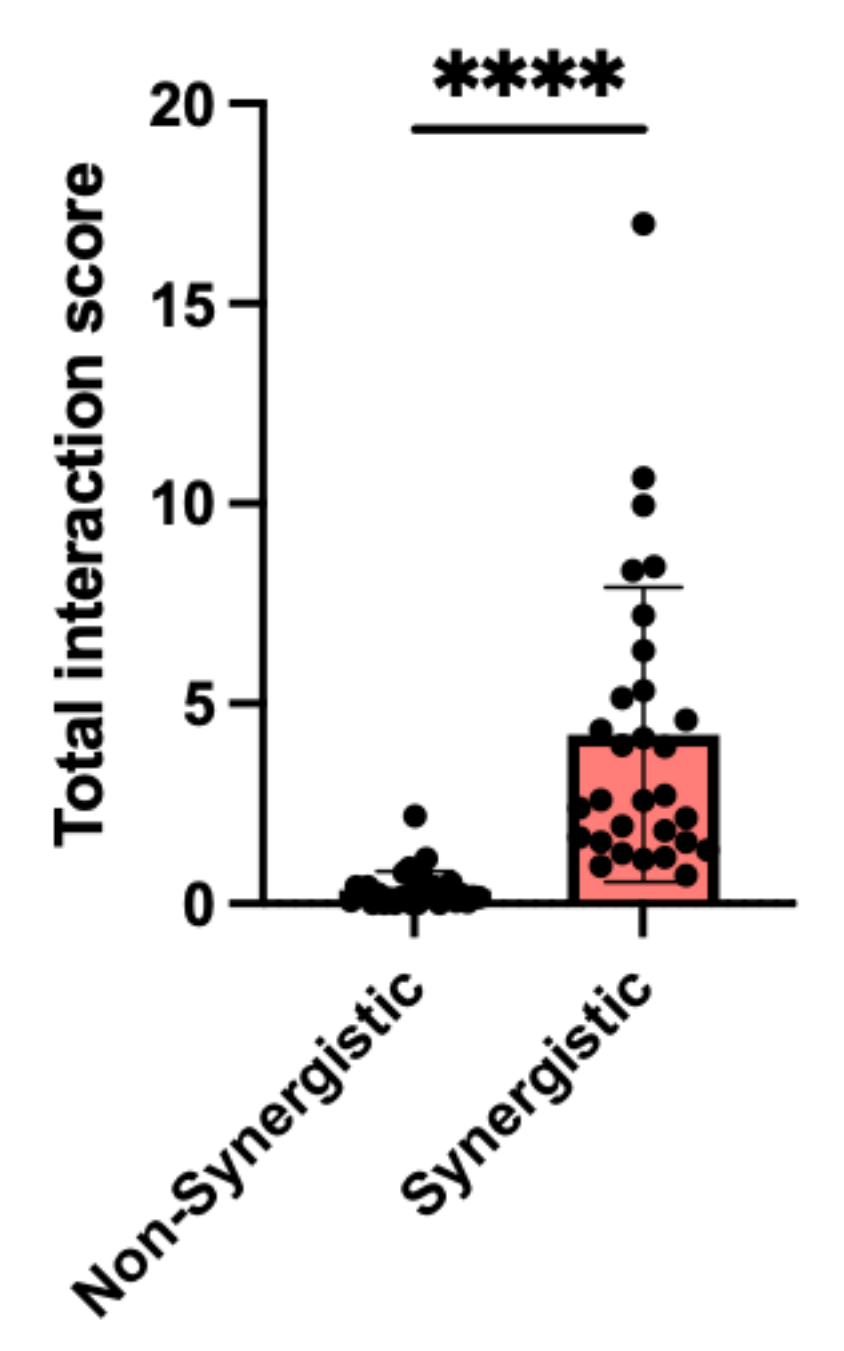
Although the interaction scores are small, they still affect the model, as interaction scores range between 0 and 1, with most falling towards the bottom. This suggests that, within this dataset, reported synergistic combinations were associated with greater shared gene overlap and higher summed interaction scores than the non-synergistic comparison group. The two 95% confidence intervals created were [15.26, 17.54] for the number of gene matches in synergistic combinations and [2.68, 3.38] for the sums of these matches. These values were used to develop a preliminary screening framework for choosing candidate drug combinations with DGIdb interaction characteristics similar to those observed among reported synergistic pairs.
Preliminary Candidate-Prioritization Framework
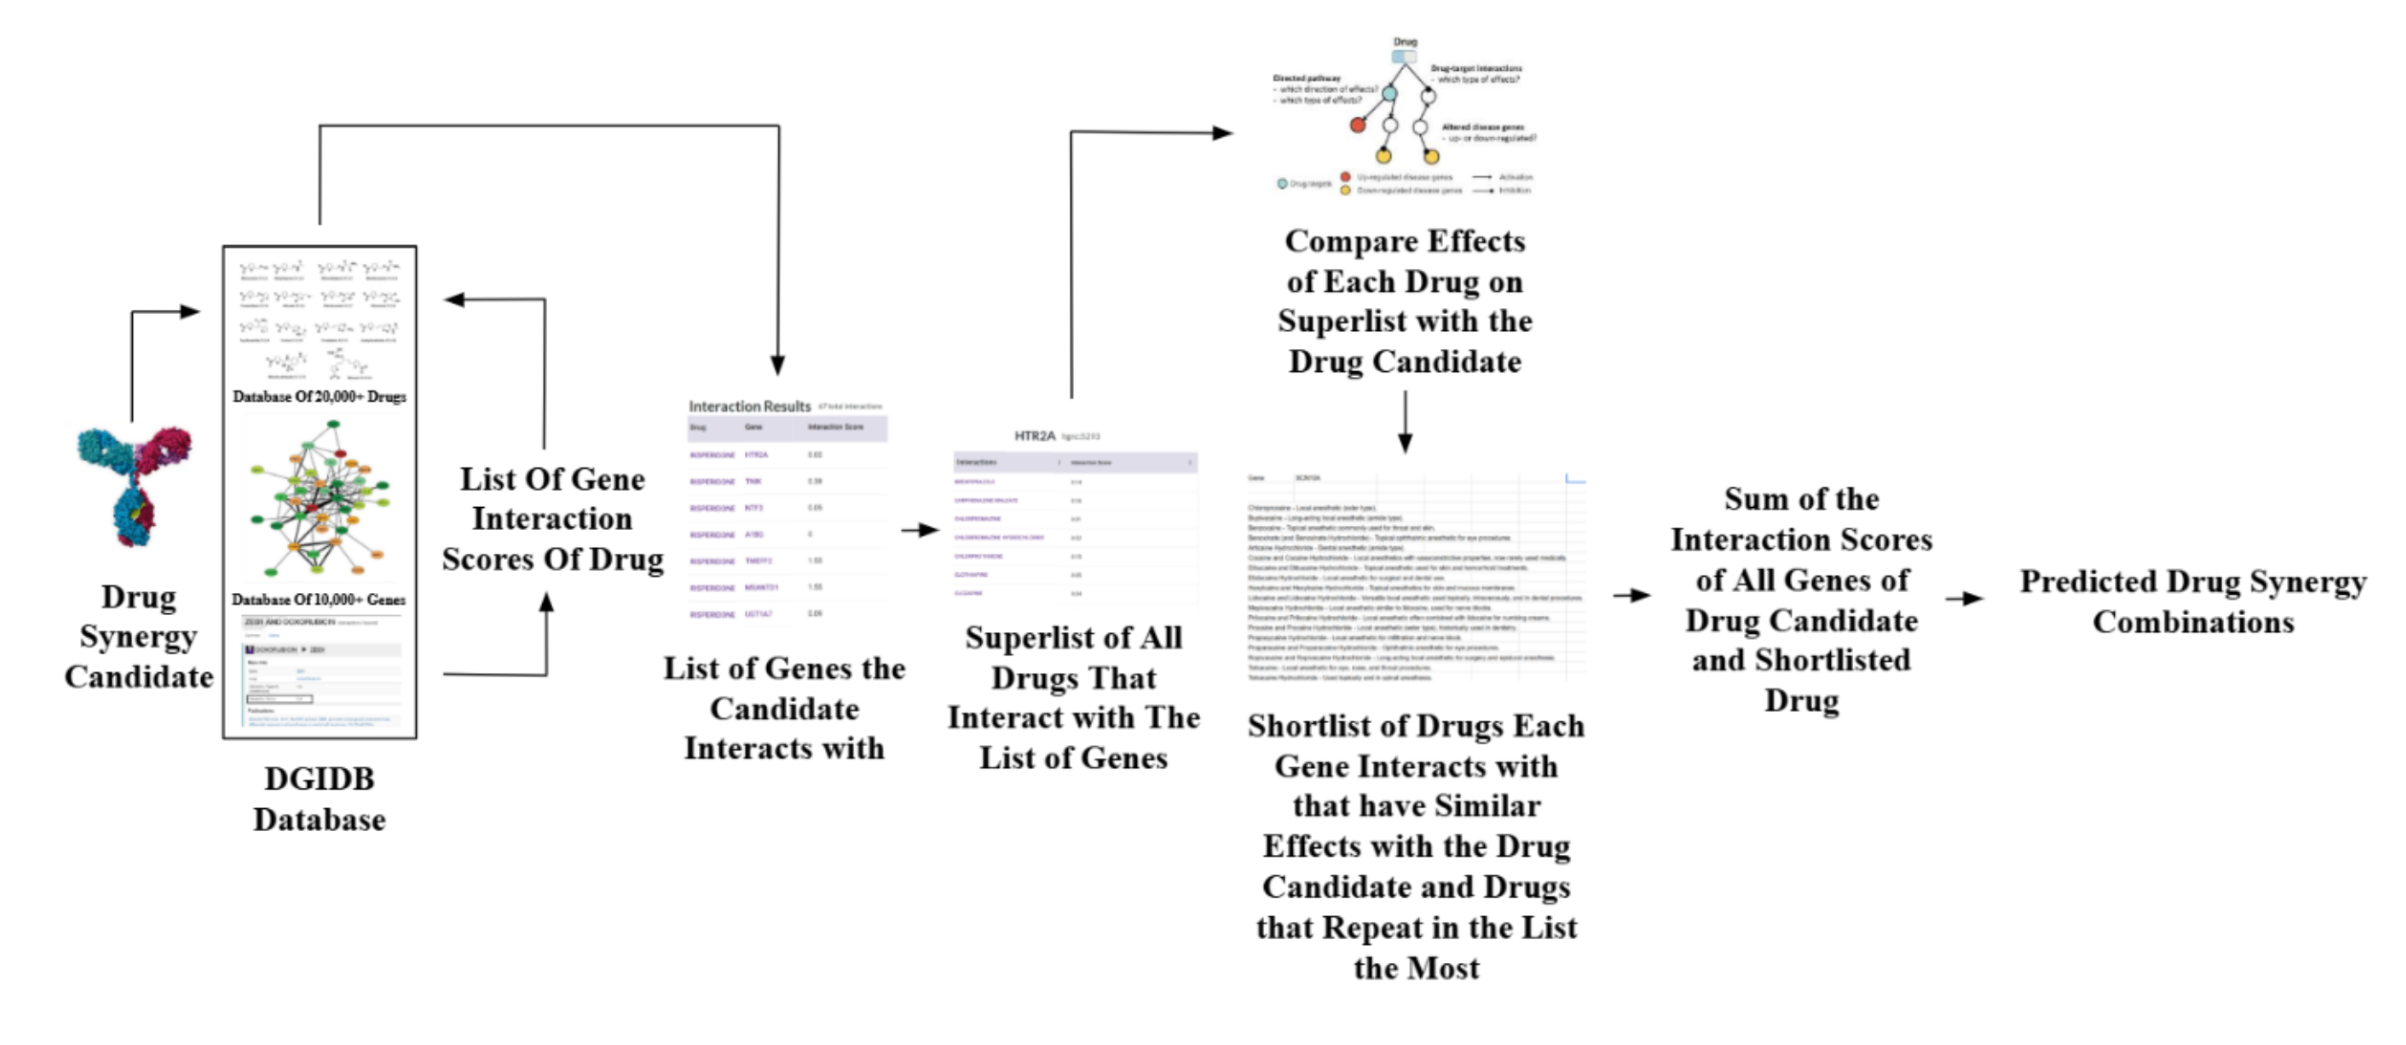
A preliminary screening framework was created to choose possible synergistic drug combinations from one input drug by using the observed differences in shared genes and summed interaction scores between reported synergistic and non-synergistic combinations (Figure 3). First, the drug target is used as an input into the DGIdb database, returning a list of genes with which the drug interacts. Each of these output genes is then used as an input back into the same database, but now returning its list of drugs with which it interacts. After collecting all of the genes for each drug’s interaction, the effects of the drugs on the body are considered by searching their mechanisms of action and disease indications in databases such as The Clinical Journal of Anesthesia and DrugBank. With this information, the properties, mechanism of action, or disease indications of the first input drug are compared with each of the drugs in the new table to identify a list of drugs through which biological pathways are similar. Drugs with similar mechanisms, indications, or biological effects are prioritized because they may be more plausible candidates for laboratory synergy testing. Finally, these drugs’ gene interaction scores are summed and compared to the confidence interval previously created. To illustrate retrospective application of the candidate-prioritization procedure, the framework was applied to four published combinations that were not used to derive the exploratory criteria. These examples were not treated as a formal performance evaluation or independent validation. Because these combinations were not prospectively selected or experimentally tested in this study, they were treated as case illustrations rather than evidence of predictive accuracy or independent validation. In vitro testing is required to determine whether newly prioritized combinations are truly synergistic.
Lastly, applying this screening framework prioritized Entrectinib and Tamatinib as a candidate combination for future laboratory testing.
Discussion
In this dataset, synergistic drug combinations had more shared genes and higher summed DGIdb interaction scores than the non-synergistic group. This suggests that drug-gene interaction patterns may be useful for prioritizing combinations for further testing. However, these results do not prove that shared genes cause synergy or that the framework can accurately predict synergistic combinations on its own.
There may also be other reasons for the differences between the groups. Some cancer drugs are studied more often and may therefore have more recorded gene interactions in DGIdb. The synergistic and non-synergistic combinations also came from different studies that used different cell lines, drug doses, and methods for measuring synergy. Because of this, some of the differences may be caused by these study conditions rather than synergy alone. DGIdb scores also measure evidence for drug-gene interactions, not experimental synergy itself.
This framework is different from models such as DeepSynergy, MatchMaker, ComboFM, and SynPathy. These methods use more detailed information, such as chemical structure, gene expression, cell-line data, and experimental drug responses. The present framework uses simpler and more accessible DGIdb-based information. It is not meant to perform better than these models, but instead to explore whether drug-gene interactions can help narrow down combinations for future testing.
There are several limitations to this study. The analysis relies mainly on one database, DGIdb, which may have incomplete or unequal information for different drugs and genes. The dataset is also relatively small, and the drug combinations were tested under different experimental conditions. The retrospective examples do not count as independent validation, and no new laboratory experiments were performed. Future studies should test the framework on larger independent datasets and experimentally test prioritized combinations in relevant cancer cell lines. Other information, such as drug-protein interactions, gene expression, or pathway data, could also be added to see whether they improve the framework. This study also did not measure reductions in cost, testing time, or laboratory workload, so these possible benefits would need to be studied in the future.
Conclusion
The field of drug synergy is rapidly growing. The need for new drug combinations is increasing due to highly resistant diseases such as cancer, Human Immunodeficiency Virus (HIV), and tuberculosis. Computational methods can shorten the timeframe for synergistic combination discovery. The study developed a preliminary computational screening framework to prioritize possible drug synergy combinations using drug-gene interaction scores from DGIdb. The framework was retrospectively compared with previously reported synergistic combinations, but it was not independently validated through prospective experimental testing. If experimentally validated in future studies, this approach could help reduce the number of drug combinations selected for laboratory testing and support more efficient discovery of synergistic therapies.
References
- G. Housman et al. “Drug resistance in cancer: an overview.” Cancers vol. 6,3 (2014): 1769–1792. doi:10.3390/cancers6031769 [↩] [↩]
- W. Kong et al. “Systematic review of computational methods for drug combination prediction.” Computational and Structural Biotechnology Journal vol. 20 (2022): 2807–2814. [↩] [↩] [↩]
- K. Roel et al. “An Introduction to Terminology and Methodology of Chemical Synergy-Perspectives from Across Disciplines.” Frontiers in pharmacology vol. 8 158. 20 Apr. 2017, doi:10.3389/fphar.2017.00158 [↩] [↩] [↩]
- R. Tallarida “Quantitative methods for assessing drug synergism” Genes & Cancer vol. 2,11 (2011): 1003-8. doi:10.1177/1947601912440575 [↩] [↩]
- J. Lehár et al. “Synergistic drug combinations tend to improve therapeutically relevant selectivity.” Nature Biotechnology vol. 27,7 (2009): 659–666. doi:10.1038/nbt.1549 [↩]
- P. Shinn et al. “High-Throughput Screening for Drug Combinations.” Methods in Molecular Biology vol. 1939 (2019): 11–35. doi:10.1007/978-1-4939-9089-4_2 [↩]
- M. Cokol-Cakmak et al. “Guided screen for synergistic three-drug combinations.” PLoS One vol. 15,7 (2020): e0235929. doi:10.1371/journal.pone.0235929 [↩]
- M. P. Menden et al. “Community assessment to advance computational prediction of cancer drug combinations in a pharmacogenomic screen.” Nature Communications vol. 10 (2019): 2674. doi:10.1038/s41467-019-09799-2 [↩] [↩]
- J. Abramson et al. “Accurate structure prediction of biomolecular interactions with AlphaFold 3.” Nature vol. 630 (2024): 493–500. [↩]
- R. Nussinov, M. Zhang, Y. Liu, H. Jang. “AlphaFold, allosteric, and orthosteric drug discovery: Ways forward.” Drug Discovery Today vol. 28,6 (2023): 103551. [↩]
- O. Trott and A. J. Olson. “AutoDock Vina: improving the speed and accuracy of docking with a new scoring function, efficient optimization, and multithreading.” Journal of Computational Chemistry vol. 31,2 (2010): 455–461. doi:10.1002/jcc.21334 [↩]
- M. Cannon et al. “DGIdb 5.0: rebuilding the drug-gene interaction database for precision medicine and drug discovery platforms.” Nucleic Acids Research vol. 52,D1 (2024): D1227–D1235. doi:10.1093/nar/gkad1040 [↩]
- Y. Tang and A. Gottlieb. “SynPathy: Predicting Drug Synergy through Drug-Associated Pathways Using Deep Learning.” Molecular Cancer Research vol. 20,5 (2022): 762–769. doi:10.1158/1541-7786.MCR-21-0735 [↩]
- K. Preuer et al. “DeepSynergy: predicting anti-cancer drug synergy with Deep Learning.” Bioinformatics vol. 34,9 (2018): 1538–1546. doi:10.1093/bioinformatics/btx806 [↩]
- H. I. Kuru, O. Tastan, A. E. Cicek. “MatchMaker: A Deep Learning Framework for Drug Synergy Prediction.” IEEE/ACM Transactions on Computational Biology and Bioinformatics vol. 19,4 (2022): 2334–2344. doi:10.1109/TCBB.2021.3086702 [↩]
- H. Julkunen et al. “Leveraging multi-way interactions for systematic prediction of pre-clinical drug combination effects.” Nature Communications vol. 11 (2020): 6136. doi:10.1038/s41467-020-19950- [↩]
- J. B. Fitzgerald, B. Schoeberl, U. B. Nielsen, P. K. Sorger. “Systems biology and combination therapy in the quest for clinical efficacy.” Nature Chemical Biology vol. 2,9 (2006): 458–466. doi:10.1038/nchembio817 [↩]
- R. B. Corcoran et al. “EGFR-mediated re-activation of MAPK signaling contributes to insensitivity of BRAF mutant colorectal cancers to RAF inhibition with vemurafenib.” Cancer Discovery vol. 2,3 (2012): 227–235. doi:10.1158/2159-8290.CD-11-0341 [↩]
- H. Farmer et al. “Targeting the DNA repair defect in BRCA mutant cells as a therapeutic strategy.” Nature vol. 434,7035 (2005): 917–921. doi:10.1038/nature03445 [↩]
- B. Yadav, K. Wennerberg, T. Aittokallio, J. Tang. “Searching for Drug Synergy in Complex Dose–Response Landscapes Using an Interaction Potency Model.” Computational and Structural Biotechnology Journal vol. 13 (2015): 504–513. doi:10.1016/j.csbj.2015.09.001 [↩]
- P. Jaaks et al. “Effective drug combinations in breast, colon and pancreatic cancer cells.” Nature vol. 603 (2022): 166–173. doi:10.1038/s41586-022-04437-2 [↩]
- S. L. Freshour et al. “Integration of the Drug–Gene Interaction Database (DGIdb 4.0) with open crowdsource efforts.” Nucleic Acids Research vol. 49,D1 (2021): D1144–D1151. doi:10.1093/nar/gkaa1084 [↩]
- M.W. Fagerland. “t-tests, non-parametric tests, and large studies—a paradox of statistical practice?” BMC Medical Research Methodology vol. 12 (2012): 78. doi:10.1186/1471-2288-12-78 [↩]
- M. Cannon et al. “DGIdb 5.0: rebuilding the drug-gene interaction database for precision medicine and drug discovery platforms.” Nucleic Acids Research vol. 52,D1 (2024): D1227–D1235. doi:10.1093/nar/gkad1040 [↩]
- H. Yu et al. “Prediction of drugs having opposite effects on disease genes in a directed network.” BMC Systems Biology vol. 10, Suppl 1 (2016): S2. doi:10.1186/s12918-015-0243-2 [↩]
- C. Bergonzo and D. T. Gallagher. “Atomic Model Structure of the NIST Monoclonal Antibody (NISTmAb) Reference Material.” Journal of Research of the National Institute of Standards and Technology vol. 126 (2021): 126012. doi:10.6028/jres.126.012 [↩]