Abstract
Ships crossing paths in waters with key whale feeding, migration, and resting habitats cause collisions with these marine animals. The AI Marine Sentinel is a hypothesis generating, decision supporting prototype which has not yet been validated as a predictive model or an operational management tool against real-time whale sightings. The prototype incorporates several sources of data by combining real-time Automatic Identification System (AIS) vessel data, observations of sea-surface temperature (SST) from NOAA using Google Earth Engine, and NOAA buoy data observations when available. It also uses bathymetric habitat context, historical whale sighting records, and recent user reports to assess risk. The risk formulation framework uses an encounter-opportunity rather than an additive score. As a result, the risk-prioritization values move toward zero in the absence of vessel exposure or whale evidence. This platform is different from acoustic- and camera-based detection systems because it sets explicit transfer functions for model input, defines target species parameters, and reporting boundaries, and sets clear ethical and safety constraints. One 30-minute run tracked 147 unique AIS vessels, opened one candidate review zone, fetched SST, and logged the model state in BigQuery. Whale presence was not checked. These tests demonstrate the system was working properly although they fail to confirm the biological accuracy. The output is intended to guide areas for future validation and does not constitute confirmed whale presence, legal advice, or a scientifically calibrated collision probability.
Keywords: Whale-vessel strike; AIS; dynamic ocean management; sea-surface temperature; risk prioritization; marine conservation; decision-support prototype
Introduction
Global studies reveal that large whales collide with ships when crossing feeding, migration or resting grounds. Unfortunately, they also indicate that many high-use whale areas have yet to be formally protected. Due to this overlap, AIS information, whale-distribution models, and vessel-speed analyses have become valuable resources to study vessel-strike risk. AI Marine Sentinel maps that issue as an auditable, and a hypothesis-generating prototype. It is designed to combine the information of the vessel and the environment into one workflow. One of the most difficult aspects of whale protection is timing. Many alerts start once a whale has been seen, reported and communicated. Although observation-dependent systems are useful, they can lack the ability to detect whales in the dark, fog, offshore distance, survey effort, or amidst reporting delays. Notably, a part of this gap can be bridged using dynamic ocean management tools and environmental models by predicting where risks might rise based on the ocean conditions and habitat patterns1,2,3,4,5 Broader dynamic-ocean-management work also describes how time-sensitive ocean information can guide management decisions.6
Speed makes the problem worse. Prior studies show that lethal-injury probability rises with vessel speed and that vessel size and whale species can change expected lethality.7,8,9 Off California, vessel-speed reduction programs request that ocean-going vessels of 300 gross tons or larger travel at 10 knots or less in defined zones, but voluntary adherence remains uneven.10,11
The project’s question is narrow by assessing how to integrate live vessel data, environmental context, habitat data and whale evidence into a meaningful, transparent prototype to support future whale-vessel risk review locations? The prototype is not validated and fails to identify and does not show confirmed locations where whales exist. Moreover, the prototype is not capable of supporting operations independently without human supervision and independent testing.
Related Work and System Differentiation
Whale detection and risk management is already being addressed by several existing systems. WhaleWatch derived blue whale density predictions in the California Current by combining the information from satellite tagging with environmental data, and tested the performance of the models using specific criteria.1 Ship-strike forecasting studies have combined whale distributions, vessel traffic, and mitigation scenarios to estimate strike risk.12,13,14,15 Other projects use detection technologies, including thermal cameras and passive acoustics, to identify whales more directly.16,17 An AI-assisted thermal-camera system that continuously scans for whale presence and relies on expert verification before alerts are delivered in San Francisco Bay is used in the Whale Spotter18 AI Marine Sentinel differs from WhaleSpotter in several basic ways: it does not use thermal cameras or claim direct whale detection. Its role is narrower: a software prototype that combines public and authorized data streams into a transparent risk-prioritization workflow.
The ecological basis for including SST, bathymetry, and habitat context emerges from the research connecting movement of whales and feeding to ocean conditions, prey fields, and seasonal patterns.2,3,19,20 Work on shelf features, canyons, and prey aggregation also supports using bathymetry and seafloor context as indirect habitat indicators.21,22,23 These variables can suggest habitat context, but fail to prove the presence of the whales. The contribution is narrower compared to the whale detection or system replacement. The project offers a clear architecture and model specification for data stream integration, retaining source provenance, dropping unavailable data streams, and logging the model state to validate in the future. This addresses the questions of implementation in the dynamic ocean management literature on making predictions operational, auditable and interpretable.5,24,25
Methods
Study Area and Target Species
The prototype is concentrated in San Francisco Bay and the adjacent offshore approaches, such as the waters off the Gulf of the Farallones, Cordell Bank and the prominent shipping lanes. During testing, the AIS bounding box was approximately 37.3 degrees N, 123.5 degrees W to 38.3 degrees N, 121.8 degrees W.
Large whales are referred to as a group because the current prototype does not yet allow for separate species-specific models. Relevant species in the region include humpback whales, blue whales, fin whales and gray whales. The diving behaviour, seasonality, prey associations and spatial use of these different species of whales differ making the pooled model a limitation. Separate likelihood and exposure terms for each species should be estimated using a validated future version.
Prototype Scope and Safety Status
AI Marine Sentinel is currently in its demonstration prototype phase. It does not have mariner deployment or enforcement powers. Public dashboard displays data integration, visualization and model logging. It should not be used to influence the operation of vessels unless it has been reviewed, validated and authorized by the scientific and maritime authorities.
For accuracy, this paper employs the term risk-prioritization index rather than collision-risk probability. The index has the function of ranking the candidate locations for further validation and review. There is no calibration for probability of whale presence or collision.
Data Sources and Quality Controls
Live vessel data are received from AIS providers. A valid record must entail an identifier for the vessel, a time stamp, latitude and longitude, and an acceptable range of latitude and longitude. The pipeline discards invalid coordinates, negative speed, unrealistic speed, old stale timestamps and duplicate old records. However, AIS coverage is incomplete as many small recreational or fishing vessels may not be transmitting AIS, and Class B transmitters may update less frequently than Class A transmitters.10,26
Environmental SST is retrieved from NOAA OISST through Google Earth Engine.27 NOAA NDBC buoy observations are used only when current values are available. Bathymetry is treated as a static habitat layer.
Historical whale records and user reports are handled as distinct types of evidence, and recent user reports must include a label, a timestamp and a set of coordinates. Recent user reports are treated as supporting evidence rather than the ground truth. The levels of experience among the users vary. Image reviewing can help support plausibility checking, but cannot alone confirm exact location, species, number of animals, behaviour or movement in the future. Validation studies should have the gold standard as either independent visual expert survey or acoustic detection or telemetry data from outside the prototype scoring pipeline.
Transfer Functions for Model Inputs
The normalized inputs are given to each candidate grid cell,  . These prototype functions were used to check and repeat the scoring process. These are temporary until independent observations can be used for calibration. Environmental SST suitability is calculated as
 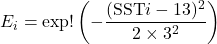 when a current SST value exists. The California Current foraging-context value of 13 degrees C is provisional. It is not a best optimum for a particular species. Values are capped to the range 0 to 1. Buoy suitability Ni uses the same temperature response when a current buoy observation is available. If the buoy value is stale or unavailable, then Ni is missing, with no default value assigned. The bathymetric suitability Bi is assigned based on habitat class: nearshore/shallow shelf = 0.30, shelf = 0.55, shelf break or slope = 0.80, canyon-associated cell = 0.90, and unresolved location = missing. These values are just simple choices of prototypes. They are a reflection of the concept that canyon and shelf breaks might facilitate prey aggregation. Seasonal suitability
  is a monthly scaling factor: peak months for whale use in a given area = 1.00; shoulder months = 0.65; off seasons = 0.30. This is an approximate modifier as the current version combines species. It should be replaced by species specific calendars in a validated system. Historical evidence
  is defined by
  , where
  is the geodesic distance (m) between cell and historical record
  . This is a kernel with spatial components and does not correct for survey effort.
Recent report evidence  is calculated as
  , where distance is in meters, age is in hours, and
  is 0.40 for unverified reports, 0.70 for image-reviewed reports, and 1.00 for expert-verified reports. The current evidence only includes reports not older than 24 hours. If an independent detection source is not available, additional detection evidence
  is missing. The current prototype does not incorporate active production inputs of the thermal-camera or passive-acoustic detections.
Whale-Likelihood and Encounter-Opportunity Model
Our whale-likelihood index is  , respectively using original weights of 0.25, 0.10, 0.15, 0.10, 0.20, 0.15, and 0.05. If no source is available, the other weights are renormalized only if the sum of all weights available from the source is at least 0.50. Else,
  is not calculated. There’s only one primary reason for using an encounter-opportunity structure. An additive collision-risk equation could assign high values even when whale likelihood is zero, when vessel exposure is high. The final prioritization value trends towards zero if whale-likelihood evidence and whale exposure by vessel are not present with the current structure. Proximity is given by
  for vessel
  near cell where
  is the geodesic distance in meters. The route-overlap modifier is:
  . The vessel lethality is estimated as
  , with the size factor of 1.00 for large cargo/tanker vessels, 0.70 for medium commercial vessels, and 0.40 if the vessel type is not known. This function follows the reported speed-lethality relationship, albeit in a provisional manner.
Vessel exposure is  . In the absence of suitable live vessels in the vicinity of the cell,
  . The final risk-prioritization index is
  . The product of and
  will keep the score close to zero if no whale evidence is present or if there is no vessel opportunity.
Candidate review zones are created only when  and the source completeness is
  and at least one current eligible vessel is in or approaching the candidate area. The labels Priority 1, Priority 2, and Priority 3 are candidate review zone labels only. They are not scientifically validated high, moderate, or low collision risk classes. The geodesic clustering is used to merge adjacent candidate cells.
Compliance Metric Reframing
This is referred to as speed-advisory alignment in the dashboard. It is not a legal or behavioral compliance. It is calculated only for those eligible live vessels that have valid current speed records and are located within a candidate review zone.Vessels outside the zone are not included. Stale AIS records and vessels missing speed are not included either. This is a measure with limitations. There may be vessels that are already slow due to approaching port, maneuvering, or traffic or other rules. The duration of a vessel’s time in a zone must exceed one update interval to be counted. The metric does not account for the type of vessel, navigational safety constraints or operational necessity. It ensures the description of alignment with an advisory threshold, rather than a legal compliance. This metric was defined for the prototype but was not computed in the 30 minute live evaluation.
Ethical and Safety Considerations
A false positive could point attention to an area without whales. A false negative result may result in a loss of monitoring of an area where whales are present. Both problems are important because the person might use the map to make decisions. Therefore, the prototype should be considered as an informational layer for research and expert review purposes only. Before any public advisory and operational recommendation are issued, human oversight is needed.
The system should not be used for instructions, fines or enforcement. A new version for operation would require scientific validation, uncertainty statements, agency review, liability planning and protocol for mariners to understand how to interpret the results. Sensitive species-location data may require to be generalized or delayed.
Evaluation Plan
Implementation performance is reported in this study. Does not report biological validation. A validation study needs to freeze model v1.1.0, make predictions that are timestamped, and compare the outputs with independent observations recorded at a time after the predictions were logged. The performance should be reported within pre-defined spatial and temporal windows with sensitivity, specificity, precision, recall, false-positive rate, false-negative rate, lead time, calibration and observation to zone distance. The full model should be compared to the models for vessels only, habitat only, historical-density, report-only, and established habitat-model only. Ablation tests should eliminate one input group at a time to determine if integration is worth the effort.
Results
Implementation Results
A prototype of the integrated vessel records, environmental SST, habitat context, report evidence, mapping visualization and BigQuery logging is included in a demonstration dashboard. Tests of implementation showed that backend AIS records, frontend state and map markers could be synchronized. The system identified 147 distinct AIS vessels during a 30-minute real-time evaluation, and one active candidate review zone. SST came from NOAA OISST through Earth Engine and the fetch worked. The date of the run was not kept. The buoy reading was missing in the log, so it was left out instead of filled in. These results indicate the integration of software and do not create ecological accuracy.
The availability of the source, effective weights, zone geometry, version of model, and vessel counts in BigQuery are stored in the system. The audit trail is important as it documents the information the model used at the time that each candidate zone was created, which is required for later validation.
Formula and Logic Corrections
In the previous additive equation, that score was  . In the present model, , so the output approaches zero if or approaches zero. Moreover, the speed term was also revised. The model now computes a per-vessel lethality factor from a logistic curve and combines vessel-level exposure terms rather than assigning exactly zero risk at 10 knots or below and using an area-wide average speed. This curve is a placeholder and needs to be calibrated for species, vessel class, draft and encounter geometry.
Tables
Active inputs along their interpretation are summarized in Table 1.
Discussion
Interpretation of the Prototype
AI Marine Sentinel is merely a risk-prioritization prototype. Its function is to structure evidence prior to validation. The information should not be used as information for direct whale detection or a calibrated prediction model or guidance for operational maritime management.
Auditability is the prototype’s most useful part and the logic for scoring is explicit. Fabricated values are not used to replace the missing sources. Source states and weights can be traced to each output. There is also one obvious drawback where the transfer functions and thresholds are still manually selected.
Comparison with Existing Systems
AI Marine Sentinel has not yet been trained or evaluated on tagged-whale data, unlike WhaleWatch. It also differs from WhaleSpotter, which uses a thermal camera and an expert check before an alert. AI Marine Sentinel does not use a camera and does not detect whales. Passive-acoustic systems respond to a different question via the identification of whale calls. The main goal is to integrate the ecological context and vessel exposure into a software workflow that can be repeated later to be validated.
That difference is significant as the Whale detection systems and systems that focus on the risk from indirect evidence address different questions. A detection system asks if a whale was detected. A risk-prioritization prototype asks where combined evidence indicates it might be helpful to review closer.
Limitations
The biggest constraint is that there is no independent empirical validation. The reliability of the prototype in predicting whale presence and collision events has yet to be demonstrated. The 0.55 candidate-zone threshold is a prototype setting that deliberately calls for more than half-scale combined whale and exposure evidence, and is not a statistically optimized threshold.
Limitations of AIS are still significant. Not all boats broadcast AIS. Class B records might be updated less frequently, type of vessel may be missing or incorrect, and the speed transmitted may not accurately reflect the level of maneuvering risk. The study also covers smaller craft and ferries whose behavior may also be underrepresented.
Species-specific behaviour is not yet modeled. Humpback whales, blue whales, fin whales and gray whales are different in migrating, feeding, dive depth, and habitat association. Species-specific models should be used instead of the pooled model before validation or use in operations.
Other risk factors not included are visibility, fog, sea state, time of day, vessel draft, traffic-separation rules, whale behavioral state, group size, and diving depth. These variables are potential candidates for future versions. However, variable addition without validation cannot solely enhance the scientific reliability.
Generalizability, Cost, and Sustainability
New species calendars, local habitat functions, vessel-route layers, observation sources, source-availability tests, and stakeholder review would all have to be developed for the new area if the prototype was to be adopted in another geographical area. The San Francisco Bay formula should not be applied to another coast.
The sustainability of the operation would rely on the cost of AIS subscriptions, cloud hosting, access to Earth Engine, storage on BigQuery, expert review, monitoring and data governance. Those costs are not quantified in the current study, but would need to be assessed prior to any operational pilot.
Conclusion
This paper demonstrates AI Marine Sentinel as a transparent and traceable prototype. It incorporates vessel traffic, ocean conditions, habitat context and whale evidence to prioritize whale-vessel risk. The model does not consider additive vessel exposure as collision risk as it uses encounter opportunity. Moreover, the validated predictive capability is not claimed by the model.
The prototype demonstrates that a software system can accept the live data from a vessel, query for SST context, keep track of the source of the data, create review zones based on the candidates, and capture the logic used to produce the results for reproducibility. It provides unvalidated prioritization indices as its outputs. The next scientific step is a “prospective” validation study using independent observations of whales, established metrics, comparisons to baseline, and ablation testing. The project’s value on a wider scale lies in methodological issues where whale protection tools need to be open about uncertainty and explicit about data provenance. In addition, indirect environmental evidence should not be presented as proven whale detection.
Data Availability
The manuscript utilizes information from public sources and live, public or authorized data feeds. Public environmental data include NOAA OISST through Google Earth Engine and NOAA NDBC buoy records when a current reading is available. Vessel-message structure is outlined in the AIS provider documentation and live access to AIS may be subject to provider authorization. The live prototype link is not granted during anonymous review and is only made available after review if requested. Future work entails a validated source code release and anonymized test dataset.
| Input | Prototype Transfer Function | Main Limitation |
| SST environmental term (E_i) | Gaussian suitability around 13 degrees C; missing if unavailable. | Indirect habitat proxy, not whale or krill detection. |
| Buoy term (N_i) | Same temperature response if current; otherwise missing. | Point measurement, not gridded habitat. |
| Bathymetry (B_i) | Categorical lookup from shelf/slope/canyon class. | Manual placeholder values. |
| Seasonality (M_i) | Peak, shoulder, and off-season monthly modifier. | Not species-specific. |
| Historical evidence (H_i) | Exponential spatial kernel around historical records. | Affected by survey effort. |
| Recent reports (S_i) | Distance and age decay with verification multiplier. | Not ground truth without expert confirmation. |
| Vessel exposure (V_i) | Per-vessel proximity, speed lethality, and size factor. | AIS coverage incomplete. |
Appendix A. Deterministic model pseudocode for validation
1. For each update window, load valid AIS, SST, buoy, bathymetry, historical record, and recent-report inputs.
2. For each candidate cell, compute  ,
,  ,
,  , , , , and using the transfer functions in Section 3.4.
3. If original available weight sum is below 0.50, mark the cell insufficient and do not generate a candidate zone.
4. Compute as the renormalized weighted mean of available whale-evidence inputs.
5. For each eligible live vessel near the cell, compute geodesic distance, proximity  , speed-lethality
  , and size factor.
6. Compute .
7. Compute .
8. Promote a cell to a candidate review zone only if , completeness , and at least one eligible live vessel is inside or approaching.
9. Merge adjacent candidate cells using geodesic clustering, log inputs and outputs, and display uncertainty labels.
References
- E. L. Hazen, D. M. Palacios, K. A. Forney, E. A. Howell, E. A. Becker, A. L. Hoover, L. M. Irvine, M. L. DeAngelis, S. J. Bograd, B. R. Mate, H. Bailey. WhaleWatch: A dynamic management tool for predicting blue whale density in the California Current. Journal of Applied Ecology. Vol. 54, pg. 1415-1428, 2017, https://doi.org/10.1111/1365-2664.12820. [↩] [↩]
- D. M. Palacios, H. Bailey, E. A. Becker, S. J. Bograd, M. L. DeAngelis, K. A. Forney, E. L. Hazen, L. M. Irvine, B. R. Mate. Ecological correlates of blue whale movement behavior and its predictability in the California Current Ecosystem during the summer-fall feeding season. Movement Ecology. Vol. 7, article 26, 2019, https://doi.org/10.1186/s40462-019-0164-6. [↩] [↩]
- L. M. Irvine, B. A. Lagerquist, G. S. Schorr, E. A. Falcone, B. R. Mate, D. M. Palacios. Ecological drivers of movement for two sympatric marine predators in the California Current large marine ecosystem. Movement Ecology. Vol. 13, article 19, 2025, https://doi.org/10.1186/s40462-025-00542-9. [↩] [↩]
- D. R. Barlow, L. G. Torres, B. C. Hodge, K. E. Steel, C. S. Baker, T. E. Chandler, E. A. Bottorff, B. A. Lagerquist, D. M. Palacios, L. M. Irvine, S. J. Bograd, E. L. Hazen. Planning ahead: Dynamic models forecast blue whale distribution with applications for spatial management. Journal of Applied Ecology. Vol. 58, pg. 2493-2504, 2021, https://doi.org/10.1111/1365-2664.13992. [↩]
- H. Welch, E. L. Hazen, S. J. Bograd, M. Jacox, S. Brodie, D. Robinson, H. Bailey, L. M. Irvine, D. M. Palacios, B. R. Mate. Practical considerations for operationalizing dynamic management tools. Journal of Applied Ecology. Vol. 56, pg. 459-469, 2019, https://doi.org/10.1111/1365-2664.13281. [↩] [↩]
- R. L. Lewison, A. J. Hobday, S. Maxwell, E. Hazen, J. R. Hartog, D. C. Dunn, D. Briscoe, S. Fossette, C. E. O’Keefe, M. Barnes, M. Abecassis, S. J. Bograd, N. D. Bethoney, H. Bailey, D. Wiley, S. Andrews, L. Hazen, L. B. Crowder. Dynamic ocean management: Identifying the critical ingredients of dynamic approaches to ocean resource management. BioScience. Vol. 65, pg. 486-498, 2015, https://doi.org/10.1093/biosci/biv018. [↩]
- A. S. M. Vanderlaan, C. T. Taggart. Vessel collisions with whales: The probability of lethal injury based on vessel speed. Marine Mammal Science. Vol. 23, pg. 144-156, 2007, https://doi.org/10.1111/j.1748-7692.2006.00098.x. [↩]
- L. P. Garrison, J. Adams, E. M. Patterson, C. P. Good. The effects of vessel speed and size on the lethality of strikes of large whales in U.S. waters. Frontiers in Marine Science. Vol. 11, article 1467387, 2024, https://doi.org/10.3389/fmars.2024.1467387. [↩]
- H. Blondin, L. P. Garrison, J. D. Adams, J. J. Roberts, C. P. Good, M. P. Gahm, N. E. Lisi, E. M. Patterson. Vessel strike encounter risk model informs mortality risk for endangered North Atlantic right whales along the United States East Coast. Scientific Reports. Vol. 15, article 736, 2025, https://doi.org/10.1038/s41598-024-84886-z. [↩]
- J. Morten, R. Freedman, J. D. Adams, J. Wilson, A. Rubinstein, S. Hastings. Evaluating adherence with voluntary slow speed initiatives to protect endangered whales. Frontiers in Marine Science. Vol. 9, article 833206, 2022, https://doi.org/10.3389/fmars.2022.833206. [↩] [↩]
- Greater Farallones National Marine Sanctuary. Voluntary Vessel Speed Reduction. National Oceanic and Atmospheric Administration, 2026, https://farallones.noaa.gov/eco/whales/voluntary-vessel-speed-reduction.html. [↩]
- J. V. Redfern, B. C. Hodge, D. E. Pendleton, A. R. Knowlton, J. Adams, E. M. Patterson, C. P. Good, J. J. Roberts. Estimating reductions in the risk of vessels striking whales achieved by management strategies. Biological Conservation. Vol. 290, article 110427, 2024, https://doi.org/10.1016/j.biocon.2023.110427. [↩]
- E. M. Keen, E. O’Mahony, L. M. Nichol, B. M. Wright, C. Shine, B. Hendricks, H. Meuter, H. M. Alidina, J. Wray. Ship-strike forecast and mitigation for whales in Gitga’at First Nation territory. Endangered Species Research. Vol. 51, pg. 31-58, 2023, https://doi.org/10.3354/esr01244. [↩]
- R. C. Rockwood, J. Calambokidis, J. Jahncke. High mortality of blue, humpback and fin whales from modeling of vessel collisions on the U.S. West Coast suggests population impacts and insufficient protection. PLOS ONE. Vol. 12, article e0183052, 2017, https://doi.org/10.1371/journal.pone.0183052. [↩]
- P. B. Conn, G. K. Silber. Vessel speed restrictions reduce risk of collision-related mortality for North Atlantic right whales. Ecosphere. Vol. 4, article 43, 2013, https://doi.org/10.1890/ES13-00004.1. [↩]
- S. Paoletti, B. Rumes, N. Pierantonio, S. Panigada, R. Jan, T. Folegot, A. Schilling, N. Riviere, V. Carrier, A. Dumoulin, et al. SEADETECT: Developing an automated detection system to reduce whale-vessel collision risk. Research Ideas and Outcomes. Vol. 9, article e113968, 2023, https://doi.org/10.3897/rio.9.e113968. [↩]
- M. Baumgartner. Efficacy of real-time passive acoustic monitoring near wind energy industrial activities for mitigating risks to right whales. Endangered Species Research. Vol. 57, pg. 413-430, 2025, https://doi.org/10.3354/esr01432. [↩]
- WhaleSpotter. Technology. WhaleSpotter, 2026, https://www.whalespotter.com/technology/. [↩]
- B. Abrahms, E. L. Hazen, E. O. Aikens, M. S. Savoca, J. A. Goldbogen, S. J. Bograd, M. G. Jacox, L. M. Irvine, D. M. Palacios, B. R. Mate. Memory and resource tracking drive blue whale migrations. Proceedings of the National Academy of Sciences. Vol. 116, pg. 5582-5587, 2019, https://doi.org/10.1073/pnas.1819031116. [↩]
- E. A. Becker, K. A. Forney, J. V. Redfern, J. Barlow, M. G. Jacox, J. J. Roberts, D. M. Palacios. Predicting cetacean abundance and distribution in a changing climate. Diversity and Distributions. Vol. 22, pg. 626-643, 2016. [↩]
- J. A. Santora, R. Zeno, J. G. Dorman, W. J. Sydeman. Submarine canyons represent an essential habitat network for krill hotspots in a large marine ecosystem. Scientific Reports. Vol. 8, article 7579, 2018, https://doi.org/10.1038/s41598-018-25742-9. [↩]
- J. A. Santora, W. J. Sydeman, I. D. Schroeder, B. K. Wells, J. C. Field. Mesoscale structure and oceanographic determinants of krill hotspots in the California Current: Implications for trophic transfer and conservation. Progress in Oceanography. Vol. 91, pg. 397-409, 2011. [↩]
- J. G. Dorman, W. J. Sydeman, M. Garcia-Reyes, R. A. Zeno, J. A. Santora. Modeling krill aggregations in the central-northern California Current. Marine Ecology Progress Series. Vol. 528, pg. 87-99, 2015. [↩]
- S. Brodie, A. J. Hobday, J. A. Smith, R. A. Everett, M. Taylor, A. J. Gray, J. Hartog, H. Welch, J. P. Eveson, E. L. Hazen. A standardized framework for evaluating dynamic ocean management. Conservation Biology. Vol. 32, pg. 643-654, 2018. [↩]
- S. M. Maxwell, E. L. Hazen, R. L. Lewison, D. C. Dunn, H. Bailey, S. J. Bograd, D. K. Briscoe, S. Fossette, A. J. Hobday, M. Bennett, S. Benson, M. R. Caldwell, D. P. Costa, H. Dewar, T. Eguchi, L. Hazen, S. Kohin, T. Sippel, L. B. Crowder. Dynamic ocean management: Defining and conceptualizing real-time management of the ocean. Marine Policy. Vol. 58, pg. 42-50, 2015. [↩]
- G. K. Silber, A. S. M. Vanderlaan, A. Tejedor Arceredillo, L. Johnson, C. T. Taggart, M. W. Brown, S. Bettridge, R. Sagarminaga. The role of the International Maritime Organization in reducing vessel threat to whales: Process, options, action and effectiveness. Marine Policy. Vol. 36, pg. 1221-1233, 2012. [↩]
- Google Earth Engine Data Catalog. NOAA CDR OISST V2.1: Optimum Interpolation Sea Surface Temperature. Google, 2026, https://developers.google.com/earth-engine/datasets/catalog/NOAA_CDR_OISST_V2_1. [↩]