
Abstract
TERT (Telomerase Reverse Transcriptase), a catalytic subunit of the telomerase enzyme that drives increased cell proliferation by lengthening telomeres and delaying apoptosis, is commonly mutated in glioma. This study evaluates the connection between the TERT gene and glioma outcomes using different bioinformatics tools – the cBioPortal for Cancer Genomics, the UCSC Genome Browser, and UALCAN. It utilizes a multi-omics framework by integrating genomics (TERT mutations and copy number alterations via cBioPortal) and transcriptomics (mRNA expression levels via UALCAN). The main source of data for this study was the cBioPortal MSK Clinical Cancer Research dataset for glioma, which utilized a sample of 923 patients to conduct survival and mutation analysis. The objective of this study was to assess whether TERT expression can serve as a biomarker for the diagnosis and treatment of glioma. The hypothesis is that TERT will be a potential diagnostic biomarker candidate due to its expression being associated with glioma malignancy and negative outcomes. The most frequent mutations associated with TERT are 5’flank mutations in the noncoding promoter regions of DNA that increase TERT transcription by creating binding sites for ETS transcription factors. Survival analysis using Kaplan-Meier plots indicates that mutated TERT in glioma patients is associated with negative outcomes and lower survival rates. UALCAN analysis reveals that high expression of TERT is associated with glioma malignancy and increased tumor progression. These results suggest a strong relationship between TERT expression and glioma, supporting its potential as a biomarker for enhanced diagnosis and treatment options.
Keywords: TERT, glioma, data mining, multi-omics, cancer bioinformatics, survival analysis, biomarker, bioinformatics, telomerase
Introduction
In 2026, more than two million Americans are projected to be diagnosed with cancer. One of the most deadly cancers, glioma, or tumors of the brain and spinal cord, is found in over 20,000 Americans each year and can vary in severity depending on the type1. For example, Glioblastoma (GBM), a type of glioma, is one of the fastest-growing cancers and is the most common brain cancer, with a median survival rate for adults of 15 months2. This is incredibly low compared to diseases such as breast cancer, where patients may live upwards of 10 years depending on the progression of the cancer upon diagnosis3. Common risk factors for glioma include aging, exposure to ionizing radiation, and a family history of the disease in some cases4. Despite continued research into improving diagnosis and treatment options, the five-year survival rate for glioma remains very low, at only 35.7% for all patients with a malignant brain tumor, and glioma research continues to be incredibly prevalent5.
Glioma originates from glial cells, which are non-neural cells in the central nervous system that support neurons but do not conduct synaptic interactions or electrical signaling. Malignant glioma is generally classified into three common subtypes based on the type of glial cell the tumor originates from: Astrocytomas, Oligodendrogliomas, and Ependymomas6,7,8. Astrocytomas stem from astrocytes, the most common type of glial cell, and can vary in aggressiveness, with Glioblastoma being the most severe. Oligodendrogliomas develop from oligodendrocytes and are less infiltrating, often being found in middle-aged adults. The least common of the subtypes, Ependymomas, originate from Ependymal cells that line the ventricular cavities and the central canal of the spinal cord, and are common in children4.
The Telomerase Reverse Transcriptase (TERT) gene is a catalytic subunit of telomerase that allows the enzyme to be reactivated in cells9. Telomerase is responsible for maintaining telomeres, the protective end caps of cell DNA composed of a repetitive set of six base pairs, 5′-TTAGGG-3′10. These telomeres shorten following every cycle of mitosis, eventually triggering apoptosis, or cell death. As most human somatic cells have low levels of telomerase or lack the enzyme altogether, cells follow a programmed cycle of senescence and do not proliferate infinitely. The reactivation of the TERT gene has the potential to enable a cell to continuously regenerate its telomeres, thereby avoiding apoptosis altogether. This has significant implications for tumor growth and the proliferation of cancer cells11,12,13.
This study examines the impact of TERT expression on glioma outcomes and investigates whether it can serve as a biomarker for glioma diagnosis and prognosis. While previous studies have investigated TERT for its involvement in pan-cancer, this study aims to expand on that research by focusing specifically on glioma. The hypothesis is that TERT will be a potential diagnostic biomarker candidate because the expression of TERT will be associated with malignant glioma. This will be evaluated through the use of online tools for data analysis to examine survival curves, mRNA expression, and mutations. This study is significant for the improvement of patient-specific diagnosis based on the use of TERT as an indicator of glioma. In the future, these findings could also lead to personalized gene-targeting therapies to treat cancer by inhibiting the ability of TERT to enhance cancer cell proliferation.
Methods
This study utilizes several bioinformatics tools to analyze the expression of TERT and its effects on glioma. The cBioPortal for Cancer Genomics (v6.4, accessed 4/11/2026) was used to detail the mutated form of TERT and conduct survival analysis based on the expression of TERT’s effects on both survival and progression-free rates. CBioPortal imports data directly from the TCGA firehouse legacy dataset. This study uses data from a study that uses targeted sequencing on MSK-IMPACT and FMI panels of 923 Glioma patients14. Log-rank tests and hazard ratios were calculated in order to assess the statistical significance of the differences in survival and progression-free rates for the unaltered and altered groups, as well as the magnitude of these differences. The UCSC genome browser (hg38, accessed 4/11/2026) was used to locate the TERT gene15. Finally, the University of Alabama’s UALCAN-TCGA dataset (accessed 4/11/2026) was used to plot the expression of TERT based on sample types, patient age, and tumor grade for both Glioblastoma and brain lower-grade glioma in order to find associations between TERT expression and negative glioma outcomes16,17. UALCAN utilizes level 3 TCGA RNA-seq data18. Log-rank testing was conducted to calculate statistical significance between the survival rates of high-expression and low/medium-expression groups. This study utilizes a multi-omics framework by integrating genomics (TERT mutations and copy number alterations via cBioPortal) and transcriptomics (mRNA expression levels via UALCAN).
Results
TERT Mutation Analysis
The TERT gene is located on the p arm of chromosome 5, on the 15.33 band. Specifically, it is located between 1,253,187 – 1,295,068 bp (base pairs) and has a length of 41,902 bp [Figure 1B]. Mutations and copy number alterations are examined for 923 glioma patients using the OncoPrint tool in cBioPortal for Cancer Genomics, a tool that compacts all genetic alterations across multiple cancer samples for easy visualization and analysis of trends. Of the 923 patients, 564 were classified as altered due to having at least one alteration to the gene, with an overall alteration frequency of 60.9%. The most common mutation is a 5’ flank, or a mutation in the noncoding promoter regions of DNA, with 95.51% of the 564 altered cases having it. Mutations in the promoter regions of TERT, particularly the C228T and C250T hotspots, have been found to increase transcription of TERT by creating new binding sites for ETS transcription factors19. This allows for the reactivation of the telomerase enzyme that often begins tumorigenesis12,20. In total, there are 596 putative driver mutations, all of which are 5’flank. Additionally, there are 28 total mutations with unknown significance, with 26 missense, one truncating, and one fusion mutation. The somatic mutation frequency is 60.3% [Figure 1A].
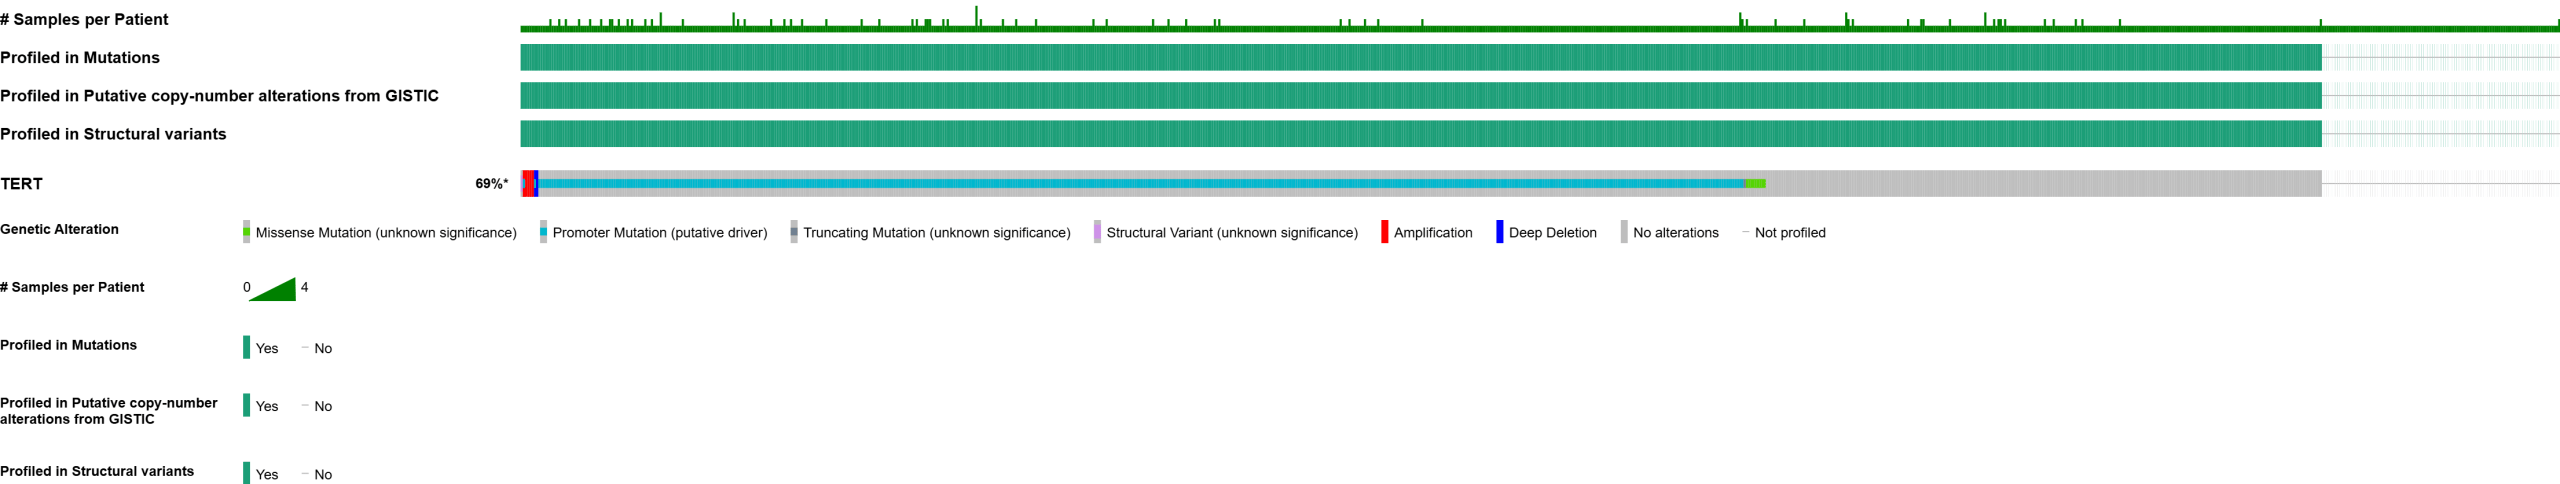

Figure 1 | Mutation analysis and gene location are displayed. (A) In this dataset, 564 out of 923 samples were classified as altered due to having at least one alteration to the gene. Mutation Analysis in the cBioPortal OncoPrint tool shows that the most common mutation on the TERT gene is promoter (putative driver).(B) The TERT gene is located on the p arm of the 5th chromosome, on the 15.33 band. This figure was taken from the UCSC genome browser.
Of the 923 patients, 813 were used to calculate overall survival between the TERT unaltered (n=252) and TERT altered (n=561) groups. The altered group includes all patients with at least one alteration to the TERT gene. The TERT unaltered group predicts a higher overall survival rate than the altered group in the cBioPortal MSK Clinical Cancer Research dataset for glioma (log-rank test P=9.01e-9). The hazard ratio (HR) is 0.459 (95% confidence interval 0.362 – 0.582) [Figure 2A]. Additionally, 547 of the 923 patients were used to calculate progression free rates between the TERT unaltered (n=201) and TERT altered (n=346) groups. The TERT unaltered group predicts a higher progression-free rate than the altered group (log-rank test P=2.09e-8). The HR is expressed as 0.512 (95% confidence interval 0.411-0.637) [Figure 2B]. This data indicates that TERT is statistically significant for both overall survival and progression-free rates, as the P value is below 0.05 for both curves. Furthermore, high expression of TERT predicts a lower survival rate than low/medium expression of TERT in the UALCAN survival curve for Lower Grade Glioma (LGG). This analysis uses 511 samples from the TCGA database to compare high expression(n=126) and low/medium expression (n=385) groups. Expression levels are calculated in transcripts per million, with samples with gene expression levels greater than or equal to the 3rd quartile of expression levels classified as high expression, and samples with levels less than the 3rd quartile classified as low/medium expression17. The p-value again falls under 0.05 (P=4.1e-3), indicating that TERT is statistically significant and the high expression of TERT is associated with negative outcomes for LGG [Figure 2C].
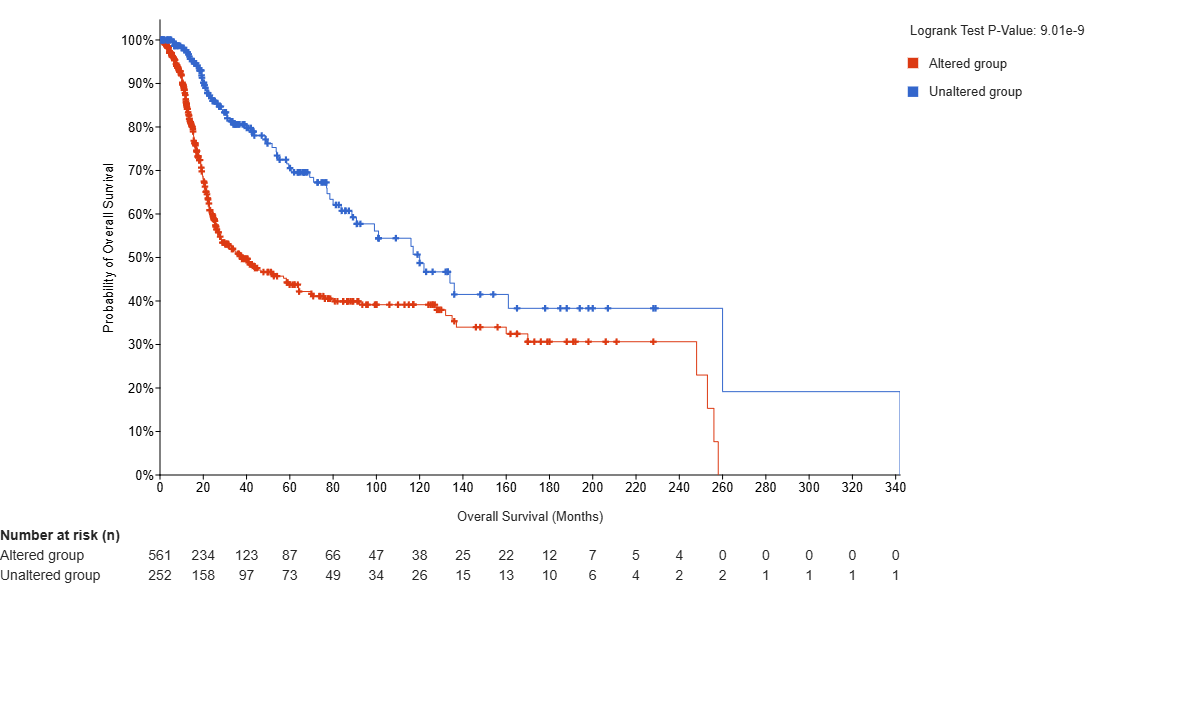
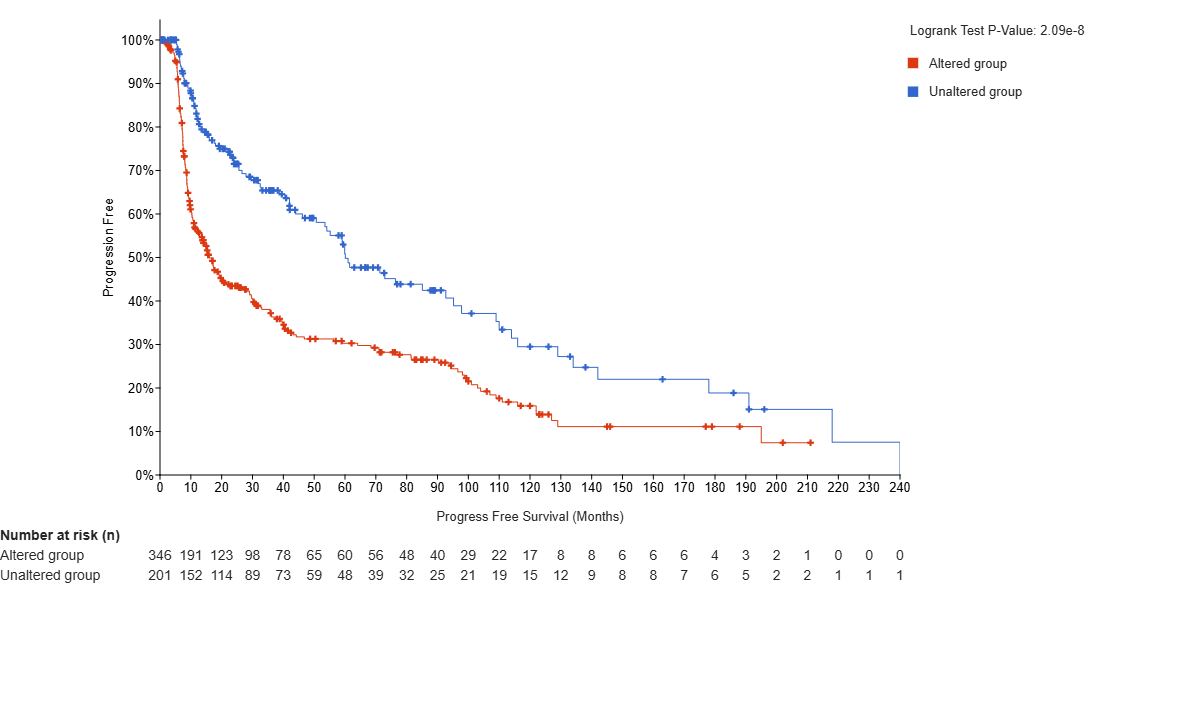

Figure 2 | Survival Curves or Kaplan-Meier plots using log-rank tests display the overall survival (OS) probability and the progression-free (PF) probability versus time. Plots A and B are taken from the cBioPortal for Cancer Genomics. (A) TERT is shown to be statistically significant in OS, as the p-value falls under 0.05 (P=2.09e-8), so mutated TERT expression is associated with lower rates of survival. (B) TERT is found to be statistically significant in PF rates, as the p-value falls under 0.05(P=9.01e-9), so mutated TERT expression is associated with lower PF as well. (C) is from the UALCAN survival plots based on high and low/medium expression of TERT in Lower Grade Glioma (LGG). Expression levels are calculated in transcripts per million, with samples with gene expression levels greater than or equal to the 3rd quartile of expression levels classified as high expression, and samples with levels less than the 3rd quartile classified as low/medium expression16,17. TERT is shown to be statistically significant, as the p-value again falls under 0.05 (P=4.1e-03). Therefore, high expression of TERT is associated with negative outcomes for LGG. The cBioPortal and UALCAN-TCGA datasets draw from comparable but independent cohorts. Statistics In figures A and B, the altered group includes all patients with at least one alteration (a mutation of any type) to the TERT gene. (A) Utilizes a log-rank test to compare overall survival rates of TERT unaltered (n=252) vs TERT altered (n=561) patients. (B) Utilizes a log-rank test to compare progression-free rates of patients with TERT unaltered (n=201) vs TERT altered (n=346) patients (C) Utilizes a log-rank test to compare survival probability rates of patients with high expression (n=126) and low expression (n=385) of TERT. Limitations The observed survival difference may be a result of several confounding variables, as univariate Kaplan-Meier analyses do not demonstrate independent prognostic value. Due to the nature of the dataset, multivariable validation was not possible, but would be necessary in further studies to eliminate the interference of covariates including age, grade, MGMT methylation20, subtype, IDH status, and treatment.
Expression of TERT in Glioblastoma and Low-Grade Glioma
The UALCAN-TCGA Glioblastoma multiform (GBM) dataset is used to plot the expression levels of TERT based on sample types and patient age, using Welch’s T-test for all statistical comparisons. For sample types, a cohort of 161 was used to compare TERT expression in transcripts per million between the normal tissue (n=5), coming from TCGA adjacent normal, and the primary tumor tissue (n=156). The comparison between the two is statistically significant (P=4.36e-05) [Figure 4A]. The expression of TERT in primary tumor tissue is significantly higher than that in normal tissue, indicating that high levels of TERT RNA expression are positively associated with glioblastoma diagnosis. Expression of TERT is compared in GBM between normal tissue (n=5) and 4 age groups: 21-40 years (n=12), 41-60 years (n=67), 61-80 years (n=69), and 81-100 years (n=7).There was initial statistical significance between Normal -vs-Age (41-60Yrs) (P=1.05e-02) , Normal-vs-Age (61-80Yrs)(P=4.60e-07), Normal-vs-Age (81-100Yrs)(P=1.86e-02), Age(21-40Yrs) -vs-Age(41-60Yrs) (P=2.81e-02), Age(21-40Yrs)-vs-Age(61-80Yrs) (P=1.48e-03), and Age(21-40Yrs)-vs-Age(81-100Yrs) (P=4.54e-02). To account for multiple testing, the Bonferroni correction was applied to create a statistically significant p-value threshold of 0.01. After this correction, there remains statistical significance between Normal-vs-Age (41-60Yrs), Normal-vs-Age(61-80Yrs), and Age(21-40Yrs)-vs-Age(61-80Yrs). [Figure 4B]. Overall, there are significantly higher levels of TERT expression in primary tumor tissues compared to normal tissue, and in ages 61-80 compared to 21-40.
Additionally, the UALCAN-TCGA brain lower-grade glioma (LGG) dataset is used to plot the expression levels of TERT in transcripts per million based on patient age and tumor grade. Expression of TERT is compared in LGG based on patient age for 504 samples in 4 groups: 21-40 years (n=243), 41-60 years (n=200), 61-80 years (n=60), and 81-100 years (n=1). There was initially found to be statistical significance between Age(21-40Yrs)-vs-Age(41-60Yrs)(P=7.62e-05) and Age(21-40Yrs)-vs-Age(61-80Yrs) (P=4.73e-02) To account for multiple testing, the Bonferroni correction was applied to create a statistically significant p-value threshold of 1.25E-02. After this correction, there remains statistical significance between Age(21-40Yrs)-vs-Age(41-60Yrs). [Figure 4C]. When comparing TERT expression based on tumor grade, there is statistical significance between grades 2 and 3 (P=2.54e-03), which could indicate that TERT RNA expression is positively associated with cancer progression [Figure 4D].
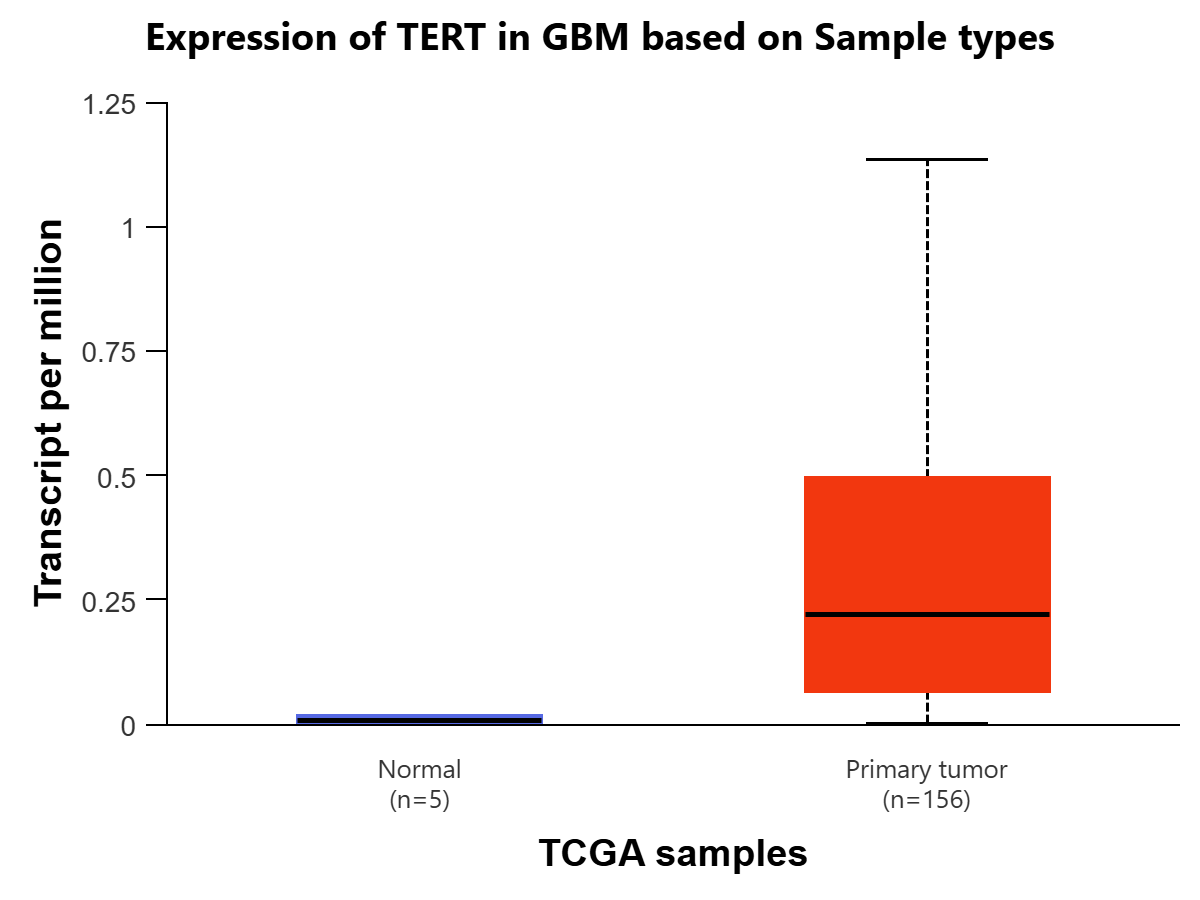
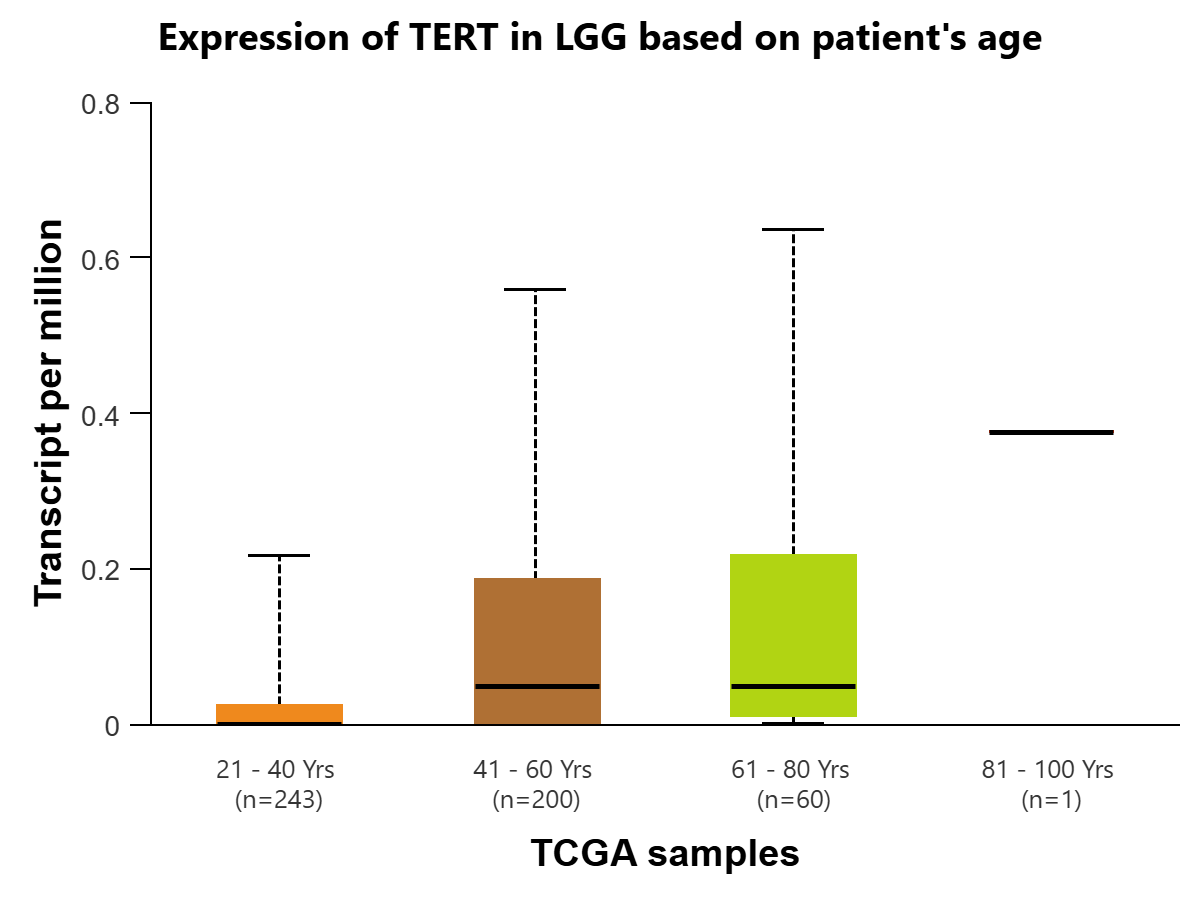
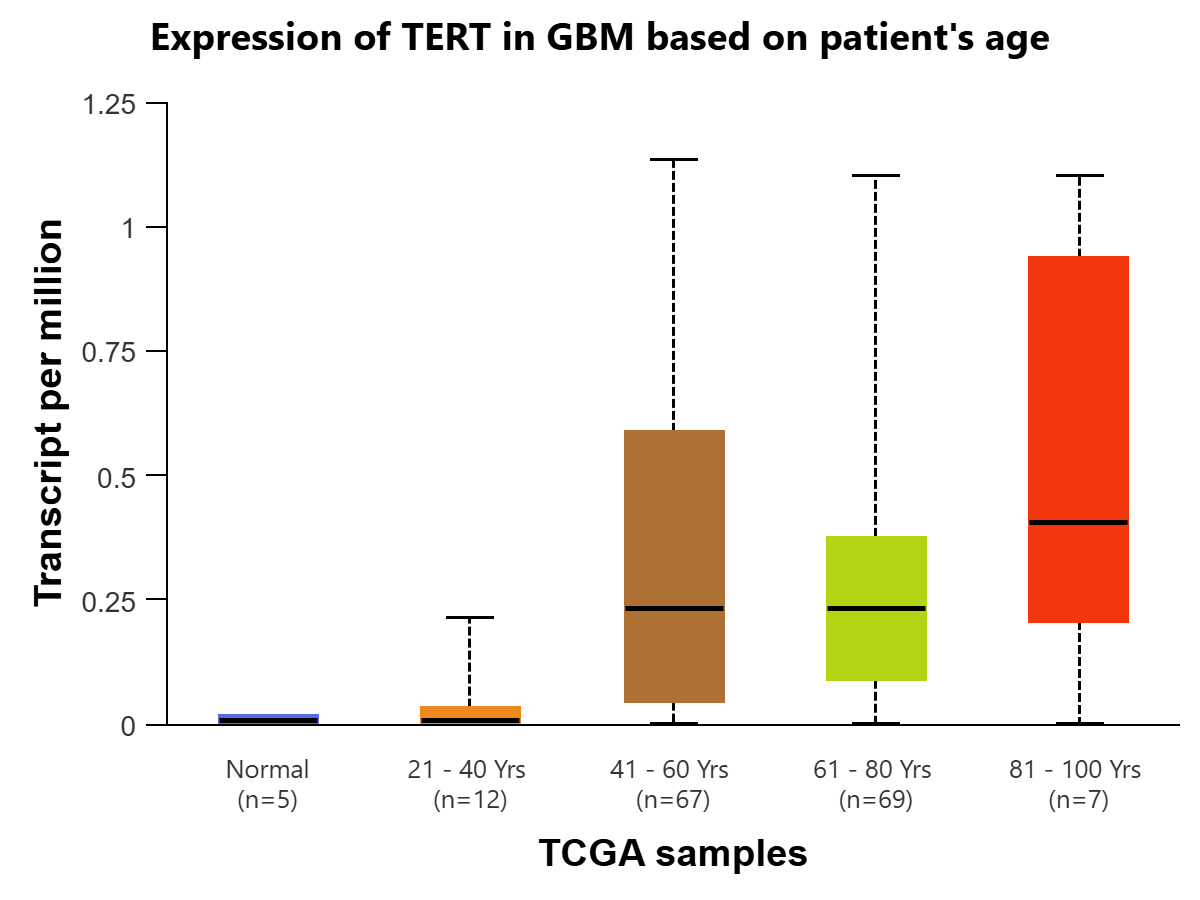
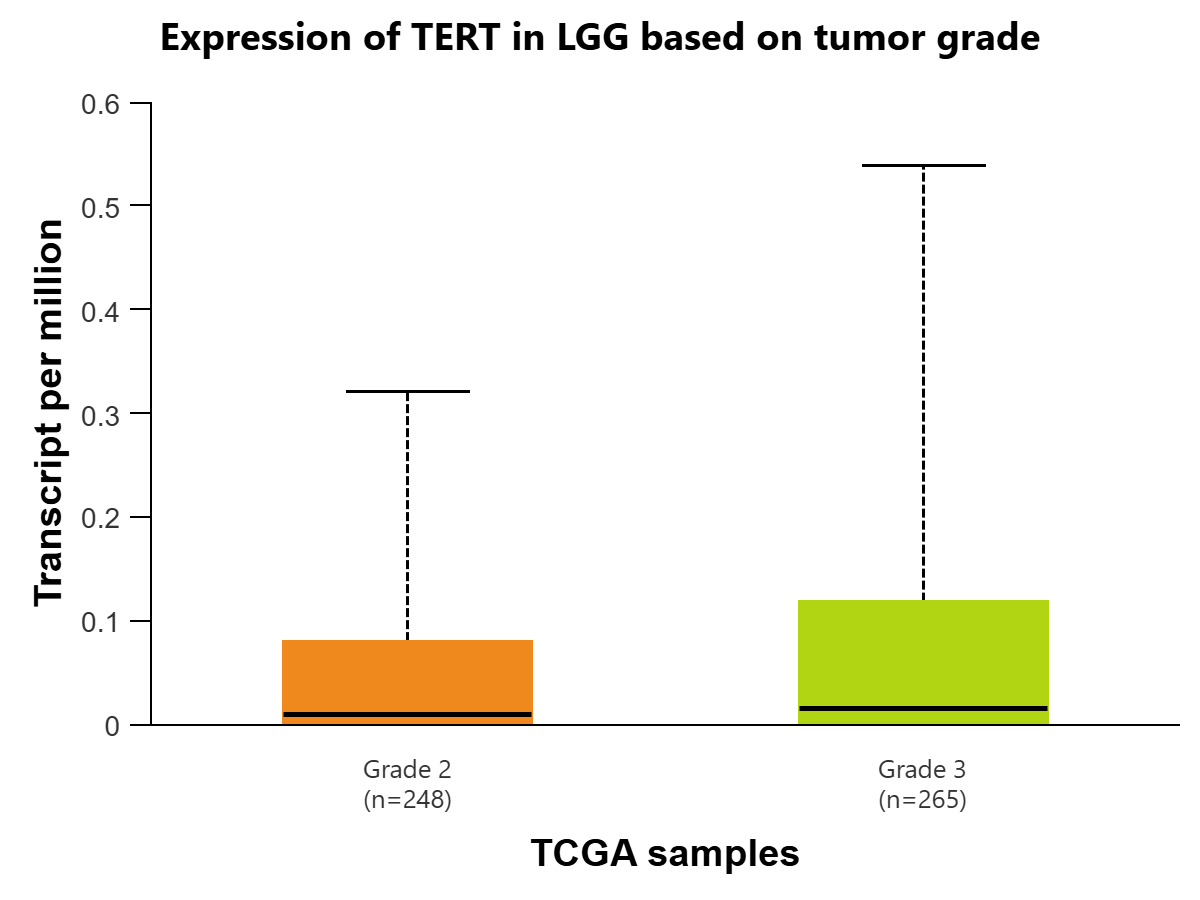
Figure 3 | Expression of TERT in transcripts per million in Glioblastoma multiforme (GBM) (figures A and B) and LGG (figures C and D) is displayed using the UALCAN database for the Glioblastoma and LGG datasets, respectively. All comparisons use Welch’s T-test to compare expression levels for various groups. (A) Expression of TERT is compared in GBM based on sample types, normal tissue (n=5) (IQR 0.016) (SD=0.012) and primary tumor tissue (n=156) (IQR=0.427) (SD=0.320). The difference between the two is found to be statistically significant (P=4.36E-05) (log2 fold-change=4.794), meaning TERT is expressed at a higher rate in cancer cells. (B) Expression of TERT is compared in GBM between normal tissue (n=5) (IQR=0.016) (SD=0.012) and 4 age groups: 21-40 years (n=12) (IQR=0.033) (SD=0.025), 41-60 years (n=67) (IQR=0.542) (SD=0.407), 61-80 years (n=69) (IQR=0.287) (SD=0.215) , and 81-100 years (n=7) (IQR=0.73) (SD=0.548).There was initial statistical significance between Normal-vs-Age (41-60Yrs) (P=1.05e-02), Normal-vs-Age (61-80Yrs) (P=4.60e-07), Normal-vs-Age (81-100Yrs) (P=1.86e-02), Age(21-40Yrs)-vs-Age(41-60Yrs) (P=2.81e-02), Age(21-40Yrs)-vs-Age(61-80Yrs) (P=1.48e-03), and Age(21-40Yrs)-vs-Age(81-100Yrs) (P=4.54e-02). To account for multiple testing, the Bonferroni correction was applied to create a statistically significant p-value threshold of 0.01. After this correction, there remains statistical significance between Normal-vs-Age (41-60Yrs) (log2 fold-change=4.858), Normal-vs-Age(61-80Yrs) (log2 fold-change=4.870), and Age(21-40Yrs)-vs-Age(61-80Yrs) (log2 fold-change=5.285). (C) Expression of TERT is compared in LGG based on patient age, in 4 groups: 21-40 years (n=243) (IQR=0.024) (SD=0.018), 41-60 years (n=200) (IQR=0.185) (SD=0.139), 61-80 years (n=60) (IQR=0.206) (SD=0.155), and 81-100 years (n=1) (IQR=0) (SD=0). There was initial statistical significance between Age(21-40Yrs)-vs-Age(41-60Yrs) (P=7.62e-05) and Age(21-40Yrs)-vs-Age(61-80Yrs) (P=4.73e-02). To account for multiple testing, the Bonferroni correction was applied to create a statistically significant p-value threshold of 1.25E-02. After this correction, there remains statistical significance between Age(21-40Yrs)-vs-Age(41-60Yrs) (log2 fold-change=5.555). (D) Expression of TERT is compared in LGG based on tumor grades 2 (n=248) (IQR=0.08) (SD=0.06) and 3 (n=265) (IQR=0.118) (SD=0.089). The comparison is statistically significant (P=2.5429E-03) (log2 fold-change=0.485), indicating that expression of TERT is positively associated with greater progression of glioma.
Discussion
Survival curve data of glioma regarding TERT, including overall survival rate and progression-free rate based on high and low expression, was analyzed in Figure 2. The data for OS (log-rank test P=9.01e-9) and progression-free (log-rank test P=2.09e-8) is found to be statistically significant. This means that TERT expression is negatively associated with survival and lack of progression, indicating that TERT can prolong cell life and increase proliferation, thereby leading to the progression of the disease.
TERT’s expression level for Glioblastoma, in transcripts per million, is statistically significant when comparing the normal tissue and primary tumor tissue samples. This indicates that TERT is found at a significantly higher level in cancer cells as compared to human somatic cells, so the presence of TERT would be a clear indicator of the disease, making it a viable biomarker. There is also statistical significance when comparing TERT expression in the age group of 21-40 to the age group of 61-80. One possible explanation for this is the fact that Glioblastoma primarily affects those above 60, with the median age of diagnosis at 68-70 years of age21. Additionally, the expression level of TERT for lower-grade glioma is found to be statistically significant when comparing stages 2 and 3. This could indicate that in lower-grade glioma, TERT expression is positively associated with the progression and spread of the disease, as it is more expressed in later stages of cancer.
This study advances research into glioma by confirming that TERT expression in the human body results in greater proliferation of cancer cells. Therefore, scientists can diagnose glioma by identifying TERT because it is indicative of cancer, as it was found to be expressed at a significantly lower rate in normal human somatic cells. This helps to ease diagnosis and prognosis and contributes to more efficient testing practices. This method of data collection is quite reliable due to the wide range of datasets available through online resources. However, since some of the data comes from older studies, there is a possibility that certain information may be slightly outdated. The research hypothesis was supported by data showing that high TERT mutation expression is linked to lower overall survival rates, indicating a negative association with glioma progression and making TERT a potential diagnostic biomarker candidate for the disease. However, further clinical testing and performance metrics showcasing sensitivity (correctly identifying positive cases) and specificity (correctly identifying negative cases) would be necessary to confirm its status as a biomarker22.
Limitations
This study was limited due to the fact that it relied on available online resources and was therefore unable to utilize laboratory testing to explore the impacts of the TERT gene in a clinical setting. Additionally, much of the research was retrospective analysis on cancer patient cohorts, so there is a high risk of selection bias and the influence of certain confounding variables (including age, grade, subtype, and available treatment) is unknown. There is also a lack of dataset heterogeneity as the TCGA dataset was the primary source for survival analysis, and diverse sources or data collection methods were not used.
Conclusion
Future research for this topic could explore possible gene-targeting therapies to deactivate TERT in glioma cells and thereby restrict cell proliferation and cancer progression. Overall, this research emphasizes the ongoing need to support glioma research, as significant challenges remain and there is still much progress to be made in understanding and treating the disease.
Acknowledgements
I would like to thank Dr. Begum-Akman from Cambridge University and Dr. Taner Tuncer from Cambridge University for giving me some guidance while conducting this project.
References
- R. L. Siegel, T. B. Kratzer, N. S. Wagle, H. Sung, A. Jemal. Cancer statistics, 2026. CA: A Cancer Journal for Clinicians. Vol. 76, pg. e70043, 2026 https://doi.org/10.3322/caac.70043 [↩]
- T. Kanderi, S. Munakomi, V. Gupta. Glioblastoma multiforme. in StatPearls StatPearls Publishing, Treasure Island (FL), 2026, https://www.ncbi.nlm.nih.gov/books/NBK558954/ [↩]
- Breast cancer survival rate. moffitt https://www.moffitt.org/cancers/breast-cancer/survival-rate/ [↩]
- What is the survival rate for someone with a glioma? Cleveland Clinic https://my.clevelandclinic.org/health/diseases/21969-glioma [↩] [↩]
- Brain tumor facts. National Brain Tumor Society https://braintumor.org/brain-tumors/about-brain-tumors/brain-tumor-facts/ [↩]
- R. Chen, M. Smith-Cohn, A. L. Cohen, H. Colman. Glioma subclassifications and their clinical significance. Neurotherapeutics. Vol. 14, pg. 284–297, 2017 https://doi.org/10.1007/s13311-017-0519-x [↩]
- Y. Li, Q. Qin, Y. Zhang, Y. Cao. Noninvasive determination of the idh status of gliomas using mri and mri-based radiomics: impact on diagnosis and prognosis. Current Oncology. Vol. 29, pg. 6893–6907, 2022 https://doi.org/10.3390/curroncol29100542 [↩]
- D. N. Louis, A. Perry, P. Wesseling, D. J. Brat, I. A. Cree, D. Figarella-Branger, C. Hawkins, H. K. Ng, S. M. Pfister, G. Reifenberger, R. Soffietti, A. von Deimling, D. W. Ellison. The 2021 who classification of tumors of the central nervous system: a summary. Neuro-Oncology. Vol. 23, pg. 1231–1251, 2021 https://doi.org/10.1093/neuonc/noab106 [↩]
- H. D. M. Wyatt, S. C. West, T. L. Beattie. InTERTpreting telomerase structure and function. Nucleic Acids Research. Vol. 38, pg. 5609–5622, 2010 https://doi.org/10.1093/nar/gkq370 [↩]
- J. Lee, M. V. Pellegrini. Biochemistry, telomere and telomerase. in StatPearls StatPearls Publishing, Treasure Island (FL), 2025, https://www.ncbi.nlm.nih.gov/books/NBK576429/ [↩]
- P. J. Killela, Z. J. Reitman, Y. Jiao, C. Bettegowda, N. Agrawal, L. A. Diaz, A. H. Friedman, H. Friedman, G. L. Gallia, B. C. Giovanella, A. P. Grollman, T.-C. He, Y. He, R. H. Hruban, G. I. Jallo, N. Mandahl, A. K. Meeker, F. Mertens, G. J. Netto, B. A. Rasheed, G. J. Riggins, T. A. Rosenquist, M. Schiffman, I.-M. Shih, D. Theodorescu, M. S. Torbenson, V. E. Velculescu, T.-L. Wang, N. Wentzensen, L. D. Wood, M. Zhang, R. E. McLendon, D. D. Bigner, K. W. Kinzler, B. Vogelstein, N. Papadopoulos, H. Yan. TERT promoter mutations occur frequently in gliomas and a subset of tumors derived from cells with low rates of self-renewal. Proceedings of the National Academy of Sciences of the United States of America. Vol. 110, pg. 6021–6026, 2013 https://doi.org/10.1073/pnas.1303607110 [↩]
- R. J. A. Bell, H. T. Rube, A. Xavier-Magalhães, B. M. Costa, A. Mancini, J. S. Song, J. F. Costello. Understanding tert promoter mutations: a common path to immortality. Molecular Cancer Research : MCR. Vol. 14, pg. 315–323, 2016 https://doi.org/10.1158/1541-7786.MCR-16-0003 [↩] [↩]
- M. Dratwa, B. Wysoczańska, P. Łacina, T. Kubik, K. Bogunia-Kubik. TERT—regulation and roles in cancer formation. Frontiers in Immunology. Vol. 11, pg. 589929, 2020 https://doi.org/10.3389/fimmu.2020.589929 [↩]
- P. Jonsson, A. L. Lin, R. J. Young, N. M. DiStefano, D. M. Hyman, B. T. Li, M. F. Berger, A. Zehir, M. Ladanyi, D. B. Solit, A. G. Arnold, Z. K. Stadler, D. Mandelker, M. E. Goldberg, J. Chmielecki, M. Pourmaleki, S. Q. Ogilvie, S. S. Chavan, A. T. McKeown, M. Manne, A. Hyde, K. Beal, T. J. Yang, C. P. Nolan, E. Pentsova, A. Omuro, I. T. Gavrilovic, T. J. Kaley, E. L. Diamond, J. B. Stone, C. Grommes, A. Boire, M. Daras, A. F. Piotrowski, A. M. Miller, P. H. Gutin, T. A. Chan, V. S. Tabar, C. W. Brennan, M. Rosenblum, L. M. DeAngelis, I. K. Mellinghoff, B. S. Taylor. Genomic correlates of disease progression and treatment response in prospectively characterized gliomas. Clinical Cancer Research: An Official Journal of the American Association for Cancer Research. Vol. 25, pg. 5537–5547, 2019 https://doi.org/10.1158/1078-0432.CCR-19-0032 [↩]
- G. Perez, G. P. Barber, A. Benet-Pages, J. Casper, H. Clawson, M. Diekhans, C. Fischer, J. N. Gonzalez, A. S. Hinrichs, C. M. Lee, L. R. Nassar, B. J. Raney, M. L. Speir, M. J. van Baren, C. J. Vaske, D. Haussler, W. J. Kent, M. Haeussler. The ucsc genome browser database: 2025 update. [↩]
- D. S. Chandrashekar, B. Bashel, S. A. H. Balasubramanya, C. J. Creighton, I. Ponce-Rodriguez, B. V. S. K. Chakravarthi, S. Varambally. UALCAN: a portal for facilitating tumor subgroup gene expression and survival analyses. Neoplasia. Vol. 19, pg. 649–658, 2017 https://doi.org/10.1016/j.neo.2017.05.002 [↩] [↩]
- D. S. Chandrashekar, S. K. Karthikeyan, P. K. Korla, H. Patel, A. R. Shovon, M. Athar, G. J. Netto, Z. S. Qin, S. Kumar, U. Manne, C. J. Creighton, S. Varambally. UALCAN: an update to the integrated cancer data analysis platform. Neoplasia. Vol. 25, pg. 18–27, 2022 https://doi.org/10.1016/j.neo.2022.01.001 [↩] [↩] [↩]
- M. Rahman, L. K. Jackson, W. E. Johnson, D. Y. Li, A. H. Bild, S. R. Piccolo. Alternative preprocessing of rna-sequencing data in the cancer genome atlas leads to improved analysis results. Bioinformatics. Vol. 31, pg. 3666–3672, 2015 https://doi.org/10.1093/bioinformatics/btv377 [↩]
- Y. Yang, X. Han, L. Sun, F. Shao, Y. Yin, W. Zhang. ETS transcription factors in immune cells and immune-related diseases. International Journal of Molecular Sciences. Vol. 25, pg. 10004, 2024 https://doi.org/10.3390/ijms251810004 [↩]
- K. Ashkan, A. Baig Mirza, C. Soumpasis, C. Syrris, D. Kalaitzoglou, C. Sharma, Z. J. James, A. K. Khoja, R. Ahmed, A. Vastani, J. Bartram, K. Chia, O. Al-Salihi, A. Swampilai, L. Brazil, R. Laxton, Z. Reisz, I. Bodi, A. King, R. Gullan, F. Vergani, R. Bhangoo, S. Al-Sarraj, J. P. Lavrador. MGMT promoter methylation: prognostication beyond treatment response. Journal of Personalized Medicine. Vol. 13, pg. 999, 2023 https://doi.org/10.3390/jpm13060999 [↩] [↩]
- M. Kim, E. Ladomersky, A. Mozny, M. Kocherginsky, K. O’Shea, Z. Z. Reinstein, L. Zhai, A. Bell, K. L. Lauing, L. Bollu, E. Rabin, K. Dixit, P. Kumthekar, L. C. Platanias, L. Hou, Y. Zheng, J. Wu, B. Zhang, M. Hrachova, S. A. Merrill, M. M. Mrugala, V. C. Prabhu, C. Horbinski, C. D. James, B. Yamini, Q. T. Ostrom, M. O. Johnson, D. A. Reardon, R. V. Lukas, D. A. Wainwright. Glioblastoma as an age-related neurological disorder in adults. Neuro-Oncology Advances. Vol. 3, pg. vdab125, 2021 https://doi.org/10.1093/noajnl/vdab125 [↩]
- F.-S. Ou, S. Michiels, Y. Shyr, A. A. Adjei, A. L. Oberg. Biomarker discovery and validation: statistical considerations. Journal of Thoracic Oncology : Official Publication of the International Association for the Study of Lung Cancer. Vol. 16, pg. 537–545, 2021 https://doi.org/10.1016/j.jtho.2021.01.1616 [↩]


