
Abstract
As machine learning models are increasingly used in high-stakes domains like criminal justice, concerns regarding their fairness have grown. This study evaluates the fairness and performance of three machine learning models (Random Forest, XGBoost, and Logistic Regression) in predicting recidivism. The purpose of the study was to identify which model was the least biased and which demographic feature influenced model predictions the most. The study aims to help address systemic bias in the criminal justice system by uncovering areas of potential bias. The models were evaluated using SHAP values, partial dependence plots, and fairness metrics across racial, gender, and age-based subgroups. While XGBoost achieved the highest predictive accuracy, results indicate that Logistic Regression maintained a better balance of fairness by exhibiting more stable error rates across groups. Age was the most influential predictor overall; notably, higher False Positive Rates were observed within younger age groups. However, racial disparities also remained a critical factor, as Black defendants consistently faced higher false positive rates than White defendants across all models. These findings suggest that high accuracy may mask systematic inequities, emphasizing the need for rigorous fairness auditing that prioritizes equitable error distribution over solely predictive power in judicial settings.
Keywords: Criminal Justice, Machine Learning, Recidivism, Fairness Analysis
Introduction
In recent years, machine learning algorithms have been integrated into the carceral system to assist in decision-making processes, including parole and sentencing1. From predictive policing to risk assessment, the accuracy and precision of these models play a life-changing role in ensuring fair and effective outcomes. One prominent example is the Correctional Offender Management Profiling for Alternative Sanctions (COMPAS) tool. COMPAS is used in several U.S. states to assess the probability of recidivism and assign risk assessment scores accordingly2. These scores are used in parole decisions, judicial sentencing, and supervision levels. Consequently, the underlying models have become highly influential in shaping people’s lives2. The COMPAS tool was developed using the standard statistical methods of logistic regression and Lasso regression3.
Both COMPAS and predictive policing tools have been the subject of significant controversy, with numerous studies revealing how they perpetuate discriminatory practices under the guise of objectivity4. Because these models are often trained on historically biased data, their outputs risk unfairly predicting higher risks of reoffense for individuals of color5. While these tools can offer data-driven insights, they can also perpetuate existing racial and socioeconomic biases if not carefully evaluated for fairness6.
In this paper, XGBoost, random forest, and logistic regression models are compared on their ability to predict recidivism over a three-year window. Beyond accuracy, we assess each model’s fairness across key demographic groups, including race, age, and gender. To evaluate this, we use established fairness metrics such as equalized odds and demographic parity. The goal of this study is to determine which model is most proficient in predicting recidivism without favoring particular demographic groups, and to determine which demographic variable influences predictions the most. Currently, the usage of machine learning in the criminal justice system presents significant fairness challenges if the algorithms being used cannot fairly evaluate individuals. The results of this study can be used to inform policymakers and administrators in the carceral system about the risk of using these tools. Specifically, it aims to help identify which demographic features require careful handling to prevent disparate impact.
This research seeks to answer the following questions: which model achieves the best balance between predictive accuracy and demographic parity? To what extent do complex ensemble models rely on immutable demographic features compared to linear baselines? Which specific demographic variable is the most strongly associated with false-positive disparities in model predictions? In terms of this study’s contributions to the field, much of the existing literature focuses primarily on racial bias alone. There is a notable research gap in understanding how high-capacity ensemble models, such as XGBoost and Random Forest, handle the intersection of age, gender, and race compared to traditional baseline models. While racial bias is well-documented, the impact of age remains underexplored in recidivism literature. Furthermore, the trade-off between the increased accuracy of ensemble models and the potential for these models to amplify subgroup disparities is not fully understood.
Methodology
Research Design
This study followed an observational, longitudinal format using publicly available data from the Georgia Department of Corrections. The data is non-experimental in nature because the data was not produced through controlled experiments. The design is longitudinal as individuals released on parole were observed and studied over three years, focusing on whether they would recidivate. The overall goal of the study was to determine which model was the most accurate and fair, and which demographic variable introduced bias into recidivism predictions. This was done through comparing performance metrics, fairness metrics, and decision trees produced for each model.
Dataset Information
The dataset used in this study originates from the National Institute of Justice Recidivism Forecasting Challenge (2021). It covers nearly 26,000 parolees released by the Georgia Department of Corrections during the 2013 calendar year7. It tracks their outcomes and supervisory information over a three-year follow-up period to measure recidivism. The dataset focuses on parolees who were under community supervision, which provided information regarding their behavior while on parole.
The dataset contains a large set of variables grouped into the following categories: Demographics
- Race
- Gender
- Age at release
Criminal history
- Number of prior felony and misdemeanor arrests
- Number of prior convictions
Prison and release information
- Most serious offense leading to incarceration
- Time served prior to release
- Education level at prison entry
- Gang affiliation status
- Parole supervision level
- Risk score at the time of release
Behavior during parole
- Employment metrics
- Drug test results
- Number of residence changes
- Program attendances and unexcused absences
- Parole violations
Outcome variable
- Binary indicator of recidivism
- Separate binary indicators for arrest within the three year period post-release
Geographic information
- Public Use Microdata Area (PUMA) code corresponding to the individual’s residence at release
The models were trained on pre-released static factors to isolate the impact of supervision and policy-mediated features on disparities. Consequently, the variables “Parole supervision level” and “risk score at time of release” were removed from the training and testing datasets.
Data Preprocessing
In order to evaluate data completeness, a table of missing values and the percentage of them within the dataset was created. Overall, the most significant pattern observed was an equal number of missing values across four drug tests: THC, cocaine, meth, and other. To address missing values, categorical variables were coded as False, and numerical columns were filled using median imputation8.
| Variable Name | Missing Values | Percentage |
| Avg_Days_per_DrugTest | 6103 | 23.622992 |
| DrugTests_THC_Positive | 5172 | 20.019354 |
| DrugTests_Cocaine_Positive | 5172 | 20.019354 |
| DrugTests_Other_Positive | 5172 | 20.019354 |
| DrugTests_Meth_Positive | 5172 | 20.019354 |
| Prison_Offense | 3277 | 12.684343 |
| Gang_Affiliated | 3167 | 12.258564 |
| Supervision_Level_First | 1720 | 6.657635 |
| Jobs_Per_Year | 808 | 3.127540 |
| Supervision_Risk_Score_First | 475 | 1.838591 |
| Percent_Days_Employed | 462 | 1.788272 |
Logistic regression, random forest, and XGBoost were the three classification models trained to predict recidivism in this study. The dataset was split into 70% training and 30% testing data.
To address class imbalance in the training dataset, oversampling techniques were applied. For tree-based models (XGBoost & random forest), SMOTENC was used to handle datasets, while standard SMOTE was applied for non-tree-based models (Logistic Regression)9.
Model Training & Performance
Logistic regression, random forest, and XGBoost were the three classification models trained to predict recidivism in this study. The three models were selected due to their placement on the interpretability-complexity spectrum to examine performance-fairness trade-offs. Logistic regression provides an interpretable baseline with demonstrated effectiveness in fairness-aware recidivism prediction10. Random forest offers ensemble learning that handles non-linear relationships while maintaining interpretability through feature importance metrics. Finally, XGBoost was selected for its efficiency in handling multi-dimensional data and class imbalances11. These models allow for a systematic evaluation of trade-offs between prediction accuracy, interpretability, and fairness.
Regarding the data, one-hot encoding was used to convert categorical data to a numerical format. Next, the data for logistic regression were standardized. Hyperparameter tuning with 5-fold cross-validation was implemented using GridSearchCV for all 3 models, with ROC-AUC serving as the optimization metric. Feature importance analysis was conducted post-training to identify the most influential predictors. A second model was trained using the top-10 features and compared to the full model for all 3 models. Finally, XGBoost achieved regularization through its built-in mechanisms, including the tuned subsample parameters, max_depth, and default L2 regularization11. Random Forest has inherent regularization through random feature subsampling at each split and bootstrap aggregation. Finally, regularization was achieved for the logistic regression model using L2 regularization via the C parameter in GridSearchCV. Regarding 5-fold cross-validation, the best cross-validation accuracy achieved was 82.75% for XGBoost, 74.52% for random forest, and 70.96% for logistic regression. Predictions were binarized using a standard classification threshold of 0.5; however, the implications of this fixed threshold are addressed as a core limitation in the discussion section.
Predictive utility was evaluated using accuracy, representing the proportion of correct total predictions, and precision, which measures the ratio of true positives to total predicted positives, to assess the model’s ability to avoid false alarms. Additionally, recall was calculated to measure the model’s ability to identify all true recidivists, and the F1 Score was the harmonic mean of precision and recall to provide a balanced measure of performance. The AUC (Area Under the ROC Curve) was utilized to measure the model’s ability to distinguish between classes across all possible thresholds.
Decision Visualization and Feature Attribution
This study utilized SHAP (SHapley Additive exPlanations) values to provide a transparent look into how each model arrived at its recidivism predictions12. The study employed global feature importance to rank the overall impact of variables across the entire dataset, while SHAP summary plots were used to visualize the direction of these effects. To further understand the models’ logic, SHAP main effect and interaction plots were used to evaluate the impact of individual features and consider how sensitive variables like race might be affected by factors like gender or age. Finally, class-conditional partial dependence plots (PDPs) were implemented to show the effect of protected attributes on the average predicted probability of recidivism13.
Fairness Evaluation
Fairness was assessed using equalized odds and demographic parity metrics. These were computed across subgroups defined by race (Black, White), gender (male, female), and age (18-32, 33-47, 48+). Demographic parity assesses whether each group receives positive predictions (predicted to recidivate) at equal rates, regardless of actual recidivism outcomes14. This checks whether protected groups are being disproportionately labeled as high-risk despite having similar risk profiles as non-protected groups. It is defined mathematically as:
P(Ŷ = 1 | A = a) = P(Ŷ = 1 | A = b)
where Ŷ is the model prediction, and A represents the protected attribute.
Next, equalized odds is a metric that checks whether a model’s true positive rate (TPR) and false positive rate (FPR) are equal across different subgroups15. Essentially, the comparison of these two rates ensures that the model makes equally accurate predictions for all groups and doesn’t unfairly misclassify one group more than another. A model satisfies equalized odds if:
P(Ŷ = 1 | A = a, Y = y) = P(Ŷ = 1 | A = b, Y = y), y ∈ {0, 1}
where Ŷ is the actual recidivism outcome.
This study also employed intersectional analysis. Rather than treating race and gender as isolated variables, we evaluated four distinct intersectional subgroups: Black men, Black women, White men, and White women. This approach acknowledges that biases often compound for individuals belonging to multiple protected classes, which may be obscured in single-variable analyses16.
Finally, a counterfactual fairness approach was implemented to test the impact of “fairness through blindness.” This involved an ablation study where models were retrained after removing race, gender, and age (individually and then collectively) from the feature set. By comparing the resulting performance metrics against the baseline models, we evaluated the extent to which the models relied on these sensitive attributes to generate predictions.
To ensure the statistical significance of these fairness metrics, this study implemented a bootstrap resampling framework. We generated 1,000 bootstrap samples for each model to calculate 95% confidence intervals (CI) for every fairness disparity. Furthermore, we conducted permutation tests to calculate p-values for each demographic comparison. By shuffling the protected attribute labels while keeping the model predictions constant, we established a null hypothesis distribution to determine the probability of observing such disparities by chance.
Results
Predictive Performance
To evaluate the predictive performance of each model, standard classification metrics were computed on the test data, including accuracy, precision, recall, F1 score, and area under the ROC curve (AUC). These metrics illustrate each model’s effectiveness in distinguishing between individuals who did and did not recidivate within three years.
| Accuracy | Precision | Recall | F1 Score | AUC | |
| XGBoost | 71.39% | 74.54% | 75.80% | 0.7516 | 0.707 |
| Random Forest | 71.24% | 71.54% | 82.42% | 0.7659 | 0.694 |
| Logistic Regression | 69.40% | 74.27%. | 71.00% | 0.7260 | 0.691 |
| Naive Approach | 57.10% | N/A | N/A | N/A | 0.500 |
To evaluate the predictive utility of the models, we first established a Naive Approach (majority class baseline). Given the distribution of the dataset, a simple classifier predicting only the majority outcome would achieve an accuracy of 57.10% and an AUC of 0.500, as shown in Table 1. All three models significantly outperformed this baseline, confirming that they are extracting meaningful patterns from the features rather than merely relying on the base rates of the target variable.
In terms of precision, XGBoost outperformed the other models with a rate of 74.54% in comparison to Logistic Regression (74.27%) and Random Forest (71.54%). This indicates that XGBoost had the fewest false-positive predictions relative to its total positive predictions, demonstrating that XGBoost had the highest precision among the tested models when predicting high-risk labels. Among the three models, XGBoost also achieved the highest accuracy at 71.39%, followed by Random Forest (71.24%) and Logistic Regression (69.40%). This represents a predictive gain of 14.29% for XGBoost over the naive baseline.
The following metric, recall, measures the ability of a model to identify all positive cases for a dataset. In this investigation, this translates to the proportion of recidivists that were correctly identified. In a shift from the other metrics, Random Forest achieved the highest recall at 82.42%, significantly outperforming XGBoost (75.80%) and Logistic Regression (71.00%). This suggests that while Random Forest is more likely to flag individuals as high-risk, it is the most effective at capturing the majority of actual recidivism events.
The F1 score factors both precision and recall into a single measure to evaluate performance without being influenced by class imbalances. Table 1 shows that Random Forest received the highest score of 0.7659, closely followed by XGBoost (0.7516) and Logistic Regression (0.7260).
Finally, in terms of Area Under the ROC Curve (AUC), XGBoost maintained the highest value (0.707), followed by Random Forest (0.694) and Logistic Regression (0.691). AUC summarizes a model’s ability to distinguish between two predictive outcomes. While these models perform significantly better than the 0.500 baseline of a naive approach, the modest AUC values (approximately 0.7) reflect limited discriminative power.
Decision Visualization
Baseline Analysis: Logistic Regression
| Feature Category | Subgroup | Coefficient | Odds Ratio |
| Race | Black | -0.0356 | 0.9650 |
| White | 0.0584 | 1.0601 | |
| Gender | Female | -0.2323 | 0.7927 |
| Male | 0.2550 | 1.2905 | |
| Age (18-32) | 18-22 | 1.1340 | 3.1081 |
| 23-27 | 0.6599 | 1.9346 | |
| 28-32 | 0.1889 | 1.2079 | |
| Age (33-47) | 33-37 | -0.1176 | 0.8890 |
| 38-42 | -0.3477 | 0.7063 | |
| 43-47 | -0.5867 | 0.5562 | |
| Age (48+) | 48+ | -0.9080 | 0.4033 |
The baseline logistic regression model reveals that Age_at_Release is the most significant demographic driver of recidivism risk scores. Individuals in the 18–22 age subgroup face the highest predictive weighting, with an Odds Ratio of 3.1081, indicating they are over three times more likely to be classified as high-risk compared to the baseline. As individuals move into older cohorts, the model’s association with risk diminishes significantly, reaching an Odds Ratio of 0.4033 for the 48 or older subgroups. In comparison, the effects of race and gender are notably less pronounced. While being Male increases the odds of a high-risk prediction by approximately 29% (OR: 1.2905), the impact of Race is marginal, with White individuals showing only a slight 6% increase (OR: 1.0601) in odds relative to the baseline.
Global Feature Importance
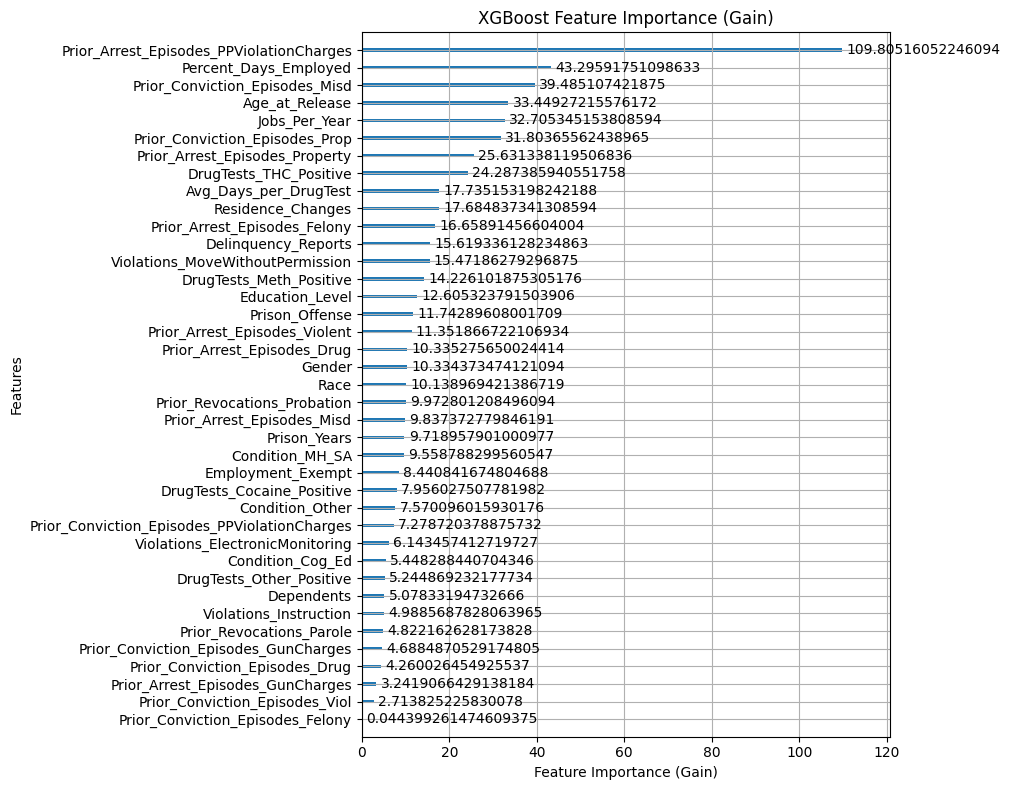
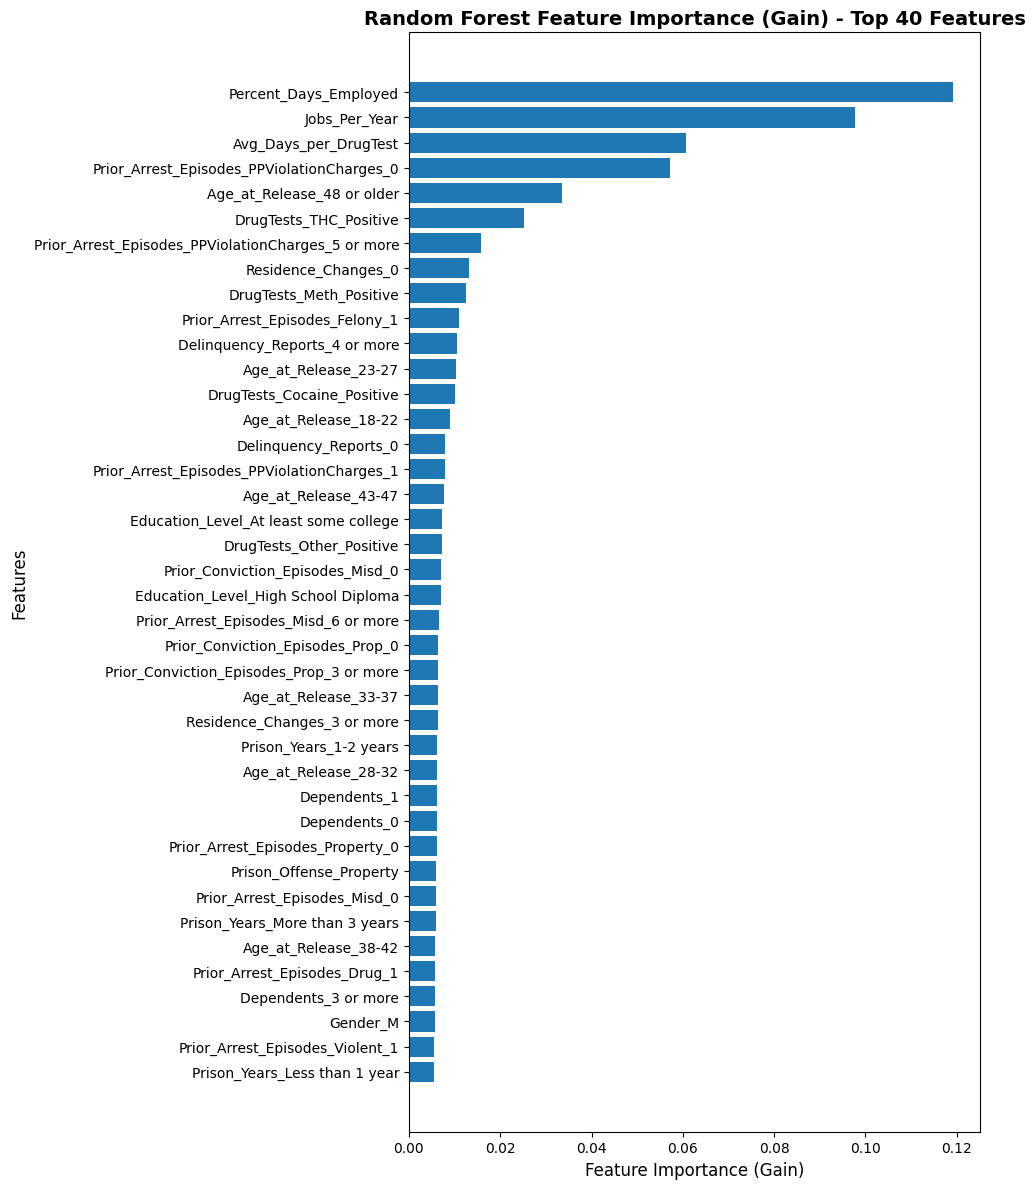
Consistent with the logistic regression baseline, Age_at_Release remains the only protected attribute with significant global influence. In the Random Forest model, age-related categories like “Age_at_Release_48 or older” and “Age_at_Release_23-27” appear within the top 15 features, while in XGBoost, Age_at_Release ranks as the fourth most important feature overall (Gain ≈ 33.45). Conversely, Race and Gender occupy much lower positions in the feature hierarchy. In XGBoost, Gender (Gain ≈ 11.74) and Race (Gain ≈ 10.33) are ranked in the bottom half of identified features. In Random Forest, while specific subgroups like “Gender_M” are present, their relative gain is marginal compared to employment status and drug test results.
SHAP Main Effects and Interactions
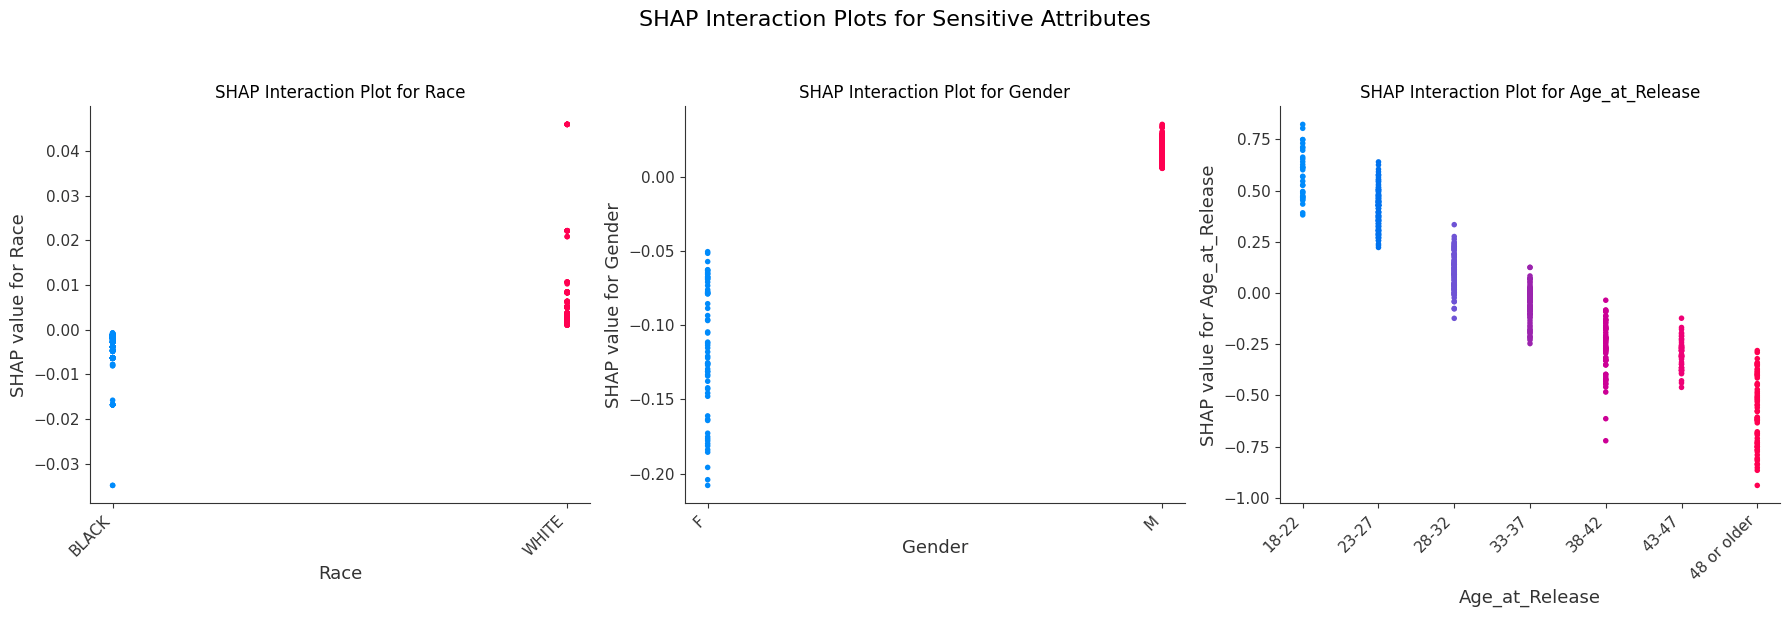
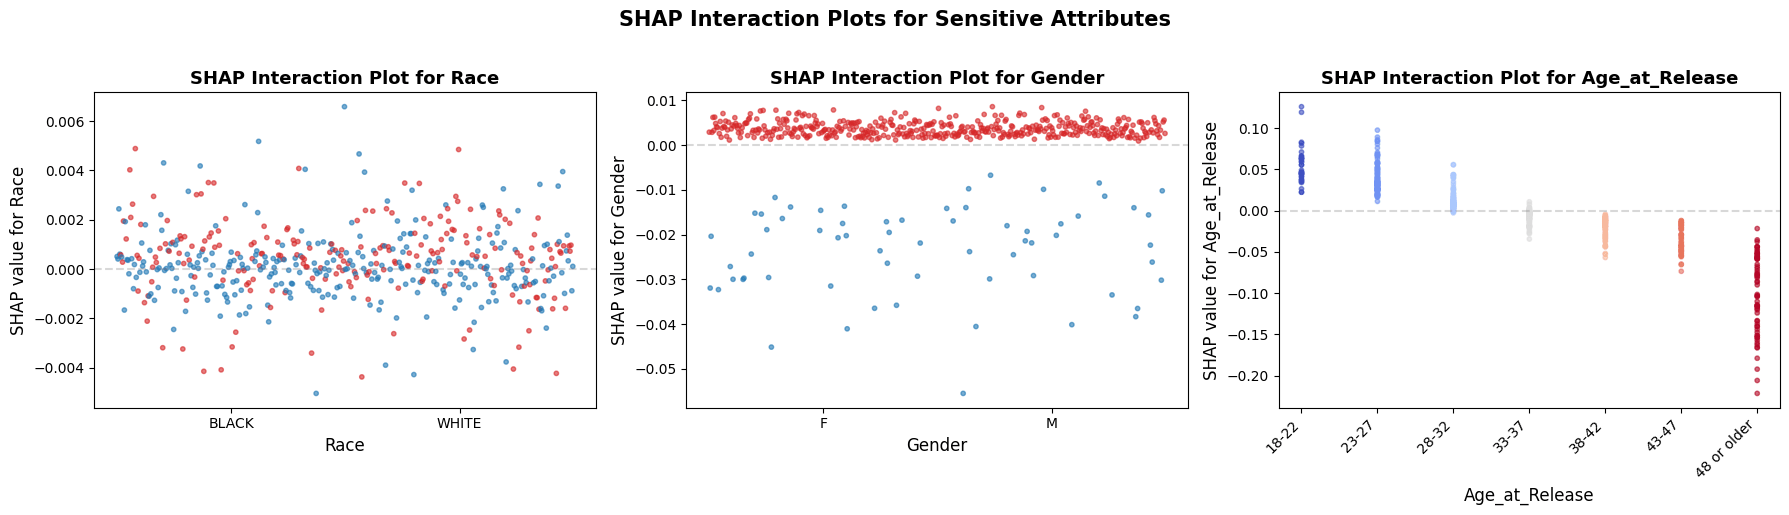
XGBoost demonstrates high-magnitude, polarized interactions, particularly for Age_at_Release, where SHAP values range from approximately +0.75 for the youngest cohort (18–22) to nearly -1.00 for the oldest (48 or older). The distinct vertical “stacking” in the XGBoost plots indicates that the model has created consistent rules for these subgroups. Conversely, the Random Forest interaction plots show much lower SHAP magnitudes (ranging roughly from +0.12 to -0.20 for age) and a significantly higher degree of overlap among data points. This suggests that while Random Forest recognizes the same general trends, it applies a more generalized approach than XGBoost. For Race and Gender, both models show relatively low interaction impact, though XGBoost again displays more deliberate clustering (e.g., a tight positive cluster for males and a negative cluster for females) compared to the dispersed interactions in Random Forest.
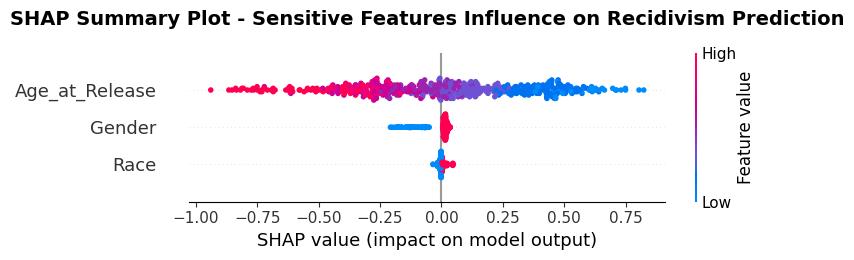
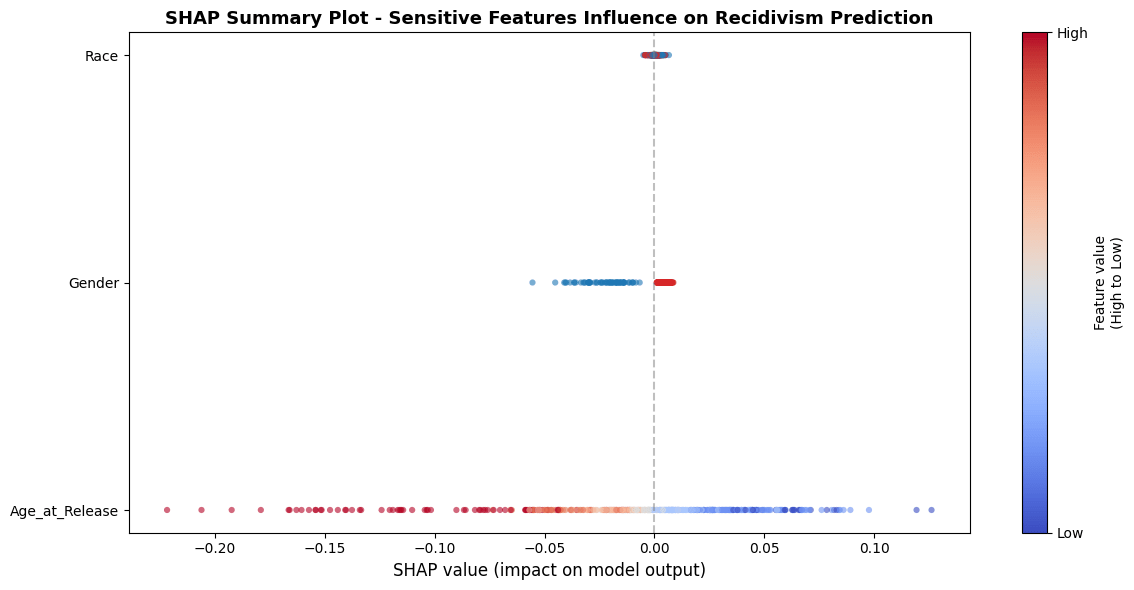
Across both XGBoost and Random Forest, Age_at_Release exhibits the most significant horizontal spread, indicating it has the highest impact on model output among protected attributes. In the XGBoost model, younger individuals (represented by blue/purple dots) are pushed toward positive SHAP values as high as +0.75, directly increasing their risk scores. Conversely, older individuals (red dots) are pushed toward negative SHAP values reaching -1.00, lowering their predicted risk. Random Forest follows this same trend but with a smaller magnitude (ranging from approximately +0.12 to -0.22), suggesting a more conservative application of the age-based risk assessment.
The impact of gender is noticeably more polarized in the XGBoost model compared to Random Forest. In XGBoost, a distinct cluster of blue dots (representing one gender) is associated with negative SHAP values (roughly -0.20), while a tight cluster of red dots aligns with near-zero or slightly positive impact.
In both, Race demonstrates the least influence on the predictive outcome. The data points for both Black and White subgroups are heavily concentrated around the zero SHAP value. While XGBoost shows a very slight horizontal spread (±0.05), the Random Forest plot shows almost no deviation from the center line.
Class-Conditional Partial Dependence
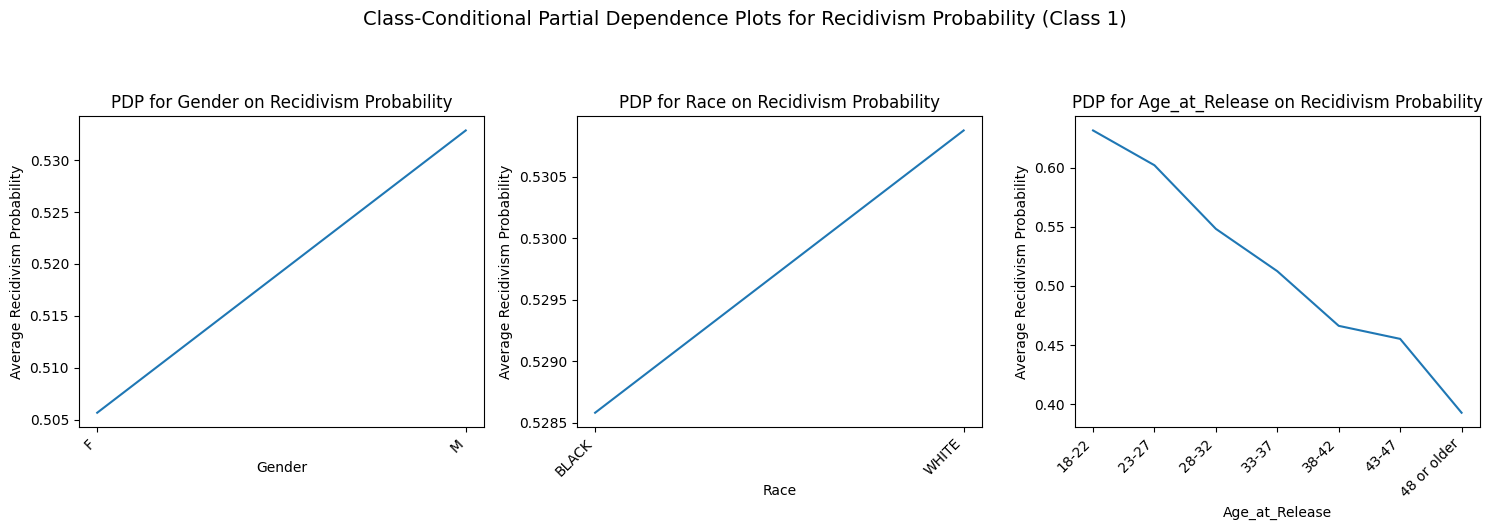
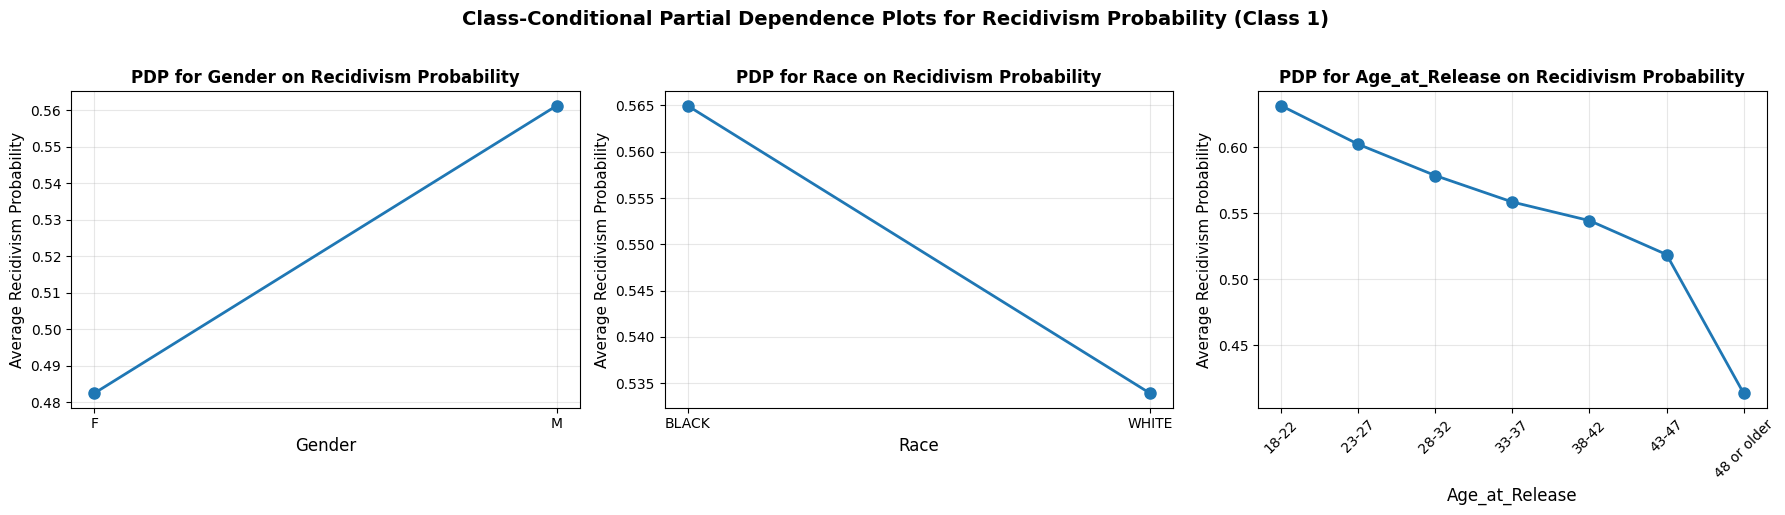
Across all models, age displays the most consistent marginal effect. For both XGBoost and Random Forest, the probability of being classified as high-risk (Class 1) starts at its peak for the 18–22 age group (approximately 63%) and follows a steep decline as age increases. By the 48 or older category, the average predicted probability drops to approximately 0.40 (40%).
The PDP for gender reveals a consistent upward slope from Female to Male. In the XGBoost model, the average predicted probability increases from roughly 0.505 to 0.533, a marginal increase of about 2.8%. In the Random Forest model, the slope is slightly steeper, moving from approximately 0.48 to 0.56, an 8% increase.
The models show divergent marginal effects for race. In the XGBoost model, the trend line shows a slight increase in predicted probability for White individuals compared to Black individuals (moving from roughly 0.5285 to 0.5305). Conversely, the Random Forest model shows a downward slope, where Black individuals have a higher average marginal probability (0.565) compared to White individuals (0.534).
Subgroup Error Analysis
| Model | Subgroup | True Positives | False Positives | True Negatives | False Negatives |
| XGBoost | Black | 44.69% | 15.83% | 25.82% | 13.66% |
| White | 41.38% | 13.37% | 31.20% | 14.04% | |
| Female | 32.07% | 17.08% | 37.16% | 13.69% | |
| Male | 44.83% | 14.47% | 26.86% | 13.84% | |
| 18-32 | 50.83% | 16.09% | 20.12% | 12.95% | |
| 33-47 | 40.46% | 14.74% | 31.37% | 13.43% | |
| 48+ | 24.75% | 10.40% | 47.01% | 17.85% | |
| Random Forest | Black | 47.34% | 17.82% | 23.83% | 11.01% |
| White | 43.54% | 16.31% | 28.27% | 11.89% | |
| Female | 33.12% | 18.51% | 35.72% | 12.65% | |
| Male | 47.46% | 16.99% | 24.34% | 11.21% | |
| 18-32 | 52.50% | 17.99% | 18.22% | 11.29% | |
| 33-47 | 44.51% | 17.89% | 28.21% | 9.39% | |
| 48+ | 25.54% | 12.43% | 44.97% | 17.06% | |
| Logistic Regression | Black | 41.41% | 14.62% | 27.03% | 16.94% |
| White | 39.26% | 13.37% | 31.20% | 16.16% | |
| Female | 24.25% | 10.56% | 43.68% | 21.51% | |
| Male | 42.74% | 14.58% | 26.76% | 15.93% | |
| 18-32 | 49.92% | 16.81% | 19.40% | 13.87% | |
| 33-47 | 36.29% | 12.51% | 33.60% | 17.60% | |
| 48+ | 19.21% | 8.93% | 48.47% | 23.39% |
As shown in the error table, Black defendants consistently experienced the highest percentages of False Positives across all three models, with the Random Forest model flagging 17.82% of this group incorrectly as high-risk, compared to 16.31% for White defendants. Interestingly, while the models struggle with over-prediction for Black individuals, they also demonstrate higher True Positive rates for this group. For instance, XGBoost correctly identified 44.69% of Black recidivists compared to 41.38% of White recidivists. This suggests that while the models are more attentive to risk in Black subgroups, that attention comes at the cost of a significantly higher error rate for those who do not go on to recidivate.
Age-based disparities were even more pronounced. In the Random Forest model, this youngest cohort saw a True Positive rate of 52.50%, but also a False Positive rate of 17.99%, the highest of any age group. In contrast, the 48+ demographic experienced the highest False Negative rates (reaching 23.39% in Logistic Regression) indicating that the models are far more likely to underestimate the risk of older individuals than younger ones. Gender-based analysis revealed that females generally had the lowest True Positive rates, particularly in Logistic Regression (24.25%), highlighting a potential failure of the models to capture the specific risk variables relevant to female recidivism.
Fairness Analysis
Beyond overall accuracy and the importance of different demographic variables, it was critical to evaluate how equally the models performed across different demographic groups. In order to do so, fairness metrics such as demographic parity and equalized odds were calculated across racial, gender, and age-based subgroups. These metrics helped reveal whether certain populations were disproportionately determined to be recidivists or not based on the model’s predictions and to what extent.
To evaluate the fairness of the XGBoost, random forest, and logistic regression models towards racial groups, a comparative analysis, disaggregating by race, was conducted. The values were stratified by groups of Black and White individuals as per the racial information provided from the NIJ Recidivism Challenge.
| Model | DP (Black) | DP (White) | FPR (Black) | FPR (White) | TPR (Black) | TPR (White) |
| XGBoost | 0.6052 | 0.5475 | 0.3801 | 0.3000 | 0.7660 | 0.7466 |
| Random Forest | 0.6811 | 0.6267 | 0.4662 | 0.3992 | 0.8345 | 0.8097 |
| Logistic Regression | 0.5603 | 0.5264 | 0.3510 | 0.300 | 0.7097 | 0.7084 |
The most consistent trend observed across all three models is that Demographic Parity (DP) and False Positive Rates (FPR) are systematically higher for Black individuals compared to White individuals. Essentially, this means that every single model predicts recidivism more often for Black individuals and incorrectly flags non-recidivists at a higher rate. The data in Figure 4 shows differences in demographic parity values between the two racial subgroups, ranging from 0.0339 (Logistic Regression) to 0.0577 (XGBoost). These data points suggest that these models disadvantage Black defendants by increasing their likelihood of being classified as high-risk, impacting parole and sentencing outcomes.
In terms of True Positive Rates (TPR), both Random Forest and XGBoost exhibited higher rates for Black individuals, with differences of +0.0248 and +0.0194, respectively. Conversely, the Logistic Regression model showed a negligible difference of only 0.0013. When higher TPRs are coupled with significantly higher FPRs, reaching a gap of 0.0801 in the XGBoost model, it indicates that the models achieve higher predictive “accuracy” for recidivists at the cost of disproportionately high false accusations against Black non-recidivists. This trade-off underscores a fundamental constraint on the models’ utility | while they identify more recidivists, they do so by over-identifying a larger population of Black individuals as guilty.
Overall, in regard to model comparison, Figure 4 shows that the logistic regression had the smallest disparities across all fairness metrics, particularly in terms of TPRs. Although XGBoost and Random Forest had higher TPRs, the models also exhibited larger gaps in demographic parity and FPRs. This suggests that while they may perform better, it is at the cost of more equitable predictions. Analysis of racial fairness metrics (Figure 4) revealed a consistent trend of higher False Positive Rates (FPR) for Black individuals. Specifically, the FPR for Black defendants reached 0.4662 in the Random Forest model and 0.3801 in XGBoost, compared to White FPRs of 0.3992 and 0.3000, respectively.
| Model | DP (Female) | DP (Male) | FPR (Female) | FPR (Male) | TPR (Female) | TPR (Male) |
| XGBoost | 0.4915 | 0.5930 | 0.3149 | 0.3500 | 0.7009 | 0.7641 |
| Random Forest | 0.5059 | 0.6789 | 0.3365 | 0.4547 | 0.7066 | 0.8369 |
| Logistic Regression | 0.3481 | 0.5732 | 0.1947 | 0.3527 | 0.5299 | 0.7285 |
Across all three models, males consistently had higher demographic parity values than females, essentially meaning that the models predicted that a male would recidivate more often than a female. The difference ranged from 0.1015 in the XGBoost model to 0.2251 in the Logistic Regression model. This outlines a disparity in the frequency at which both genders are flagged as high-risk. While this by itself is not a signifier of bias, it is coupled with elevated false positive rates for males. This points to males being more likely to be incorrectly classified as re-offenders. Essentially, every single model, despite predicting that more of the male population would recidivate, disproportionately over-predicted risk for men.
Interestingly, the true positive rates (TPRs) favored men, with differences of 0.0632 (XGBoost), 0.1303 (Random Forest), and 0.1986 (Logistic Regression). This means that the models were more successful at correctly identifying actual male re-offenders compared to females. Altogether, these metrics point to the conclusion that every single model was simultaneously failing to identify female recidivists at a much higher rate. Overall, these models’ performances become questionable as they show significant signs of over-predicting males as re-offenders while females are systematically under-identified.
Overall, Logistic Regression exhibited the largest gender gap in TPR and demographic parity, indicating that it was the least equitable in consistently identifying female recidivists. While Random Forest and XGBoost had smaller disparities, the logistic regression model had the largest FPR gap (0.1580), indicating a larger amount of false predictions of recidivism amongst men relative to women. Though disparities were still present in XGBoost predictions, it had the smallest differences between the fairness metrics calculated for both genders.
| Models | DP (18-32) | DP (33-47) | DP (48+) | FPR (18-32) | FPR (33-47) | FPR (48+) | TPR (18-32) | TPR (33-47) | TPR (48+) |
| XGBoost | 0.6693 | 0.5520 | 0.3514 | 0.4444 | 0.3169 | 0.1811 | 0.7969 | 0.7508 | 0.5809 |
| Random Forest | 0.7226 | 0.6535 | 0.4463 | 0.5221 | 0.4301 | 0.2638 | 0.8364 | 0.8445 | 0.6923 |
| Logistic Regression | 0.6673 | 0.4880 | 0.2814 | 0.4643 | 0.2712 | 0.1555 | 0.7826 | 0.6734 | 0.4509 |
Across all three models, the disparities in demographic parity highlight that younger individuals were disproportionately predicted as re-offenders. Starting with XGBoost, the predicted recidivism rate of individuals ages 18-32 was 0.6693 compared to only 0.3514 for those 48 and older, a gap of over 31 percentage points. The Random Forest model exhibited a similarly large divide (0.7226 vs 0.4463), while Logistic Regression had the largest divide of over 38 percentage points (0.6673 vs 0.2814). These differences point to the fact that all three models label younger individuals as high-risk significantly more frequently than older individuals.
By itself, demographic parity doesn’t point to bias; however, it is coupled with consistently high false positive rates across the board. All three models produced FPRs between 0.4444 and 0.5221 for individuals ages 18-32 in comparison to FPRs ranging from 0.1555 to 0.2638 for the oldest age group. On the other hand, TPRs corroborated this data, with rates generally highest for younger individuals and lowest for the oldest group across all models. For instance, Logistic Regression correctly identified 78.26% of re-offenders ages 18–32 but only 45.09% for those 48 and older, leaving older individuals under-identified as recidivists.
Overall, these results reveal a clear bias towards younger individuals across all three models | youth face disproportionately high false positive rates, while older individuals are systematically under-identified as re-offenders, creating a pattern of overprediction in one group and underprediction in another.
| Model | Subgroup | DP | FPR | TPR |
| XGBoost | Black Male | 0.6188 | 0.3871 | 0.7754 |
| Black Female | 0.5018 | 0.3648 | 0.6897 | |
| White Male | 0.5641 | 0.2990 | 0.7629 | |
| White Female | 0.4878 | 0.3152 | 0.6766 | |
| Random Forest | Black Male | 0.6624 | 0.4360 | 0.8154 |
| Black Female | 0.5200 | 0.3585 | 0.7414 | |
| White Male | 0.6173 | 0.3754 | 0.7987 | |
| White Female | 0.5142 | 0.3307 | 0.7149 | |
| Logistic Regression | Black Male | 0.5746 | 0.3612 | 0.7189 |
| Black Female | 0.3600 | 0.2201 | 0.5517 | |
| White Male | 0.5641 | 0.3266 | 0.7422 | |
| White Female | 0.3720 | 0.2179 | 0.5404 |
The intersectional analysis presented in Figure 7 reveals that the models’ predictive biases are highly concentrated within specific subgroups, with Black males facing the most severe disparities across all fairness metrics. For instance, in the Random Forest model, Black males experienced the highest False Positive Rate (FPR) of 0.4360, compared to 0.3307 for White females and 0.3585 for Black females. This indicates that nearly 44% of Black men who do not recidivate are flagged as high-risk, a disparity that is significantly more pronounced than when analyzing race or gender as independent variables.
Furthermore, race appears to be a more influential variable in comparison to gender, particularly concerning Demographic Parity. Across all three models, Black females received higher positive prediction rates (DP) than White males. In XGBoost, for example, the DP for Black females (0.5018) exceeded that of White females (0.4878), despite males generally having much higher risk profiles in the broader dataset. This suggests that the “Black” racial attribute exerts a stronger upward pressure on high-risk classification than the “Female” gender attribute exerts downward pressure.
In terms of model stability, Logistic Regression appeared to be the most swayed by intersectional identities, with the largest gaps in TPRs. It correctly identified only 55% of white female recidivists while maintaining a much higher accuracy for males, effectively failing to recognize risk patterns in women. XGBoost demonstrated the most stable model performance, with its TPR gaps between Black females and White females being the narrowest across all the models.
| Model | Sensitive Variable | Accuracy | Precision | Recall | F1 | AUC |
| XGBoost | Race removed | 0.7357 | 0.7463 | 0.8140 | 0.7787 | 0.803 |
| Gender removed | 0.7299 | 0.7401 | 0.8123 | 0.7745 | 0.801 | |
| Age Removed | 0.7276 | 0.7323 | 0.8242 | 0.7755 | 0.792 | |
| All 3 removed | 0.7228 | 0.7280 | 0.8215 | 0.7719 | 0.785 | |
| Random Forest | Race removed | 0.7166 | 0.7292 | 0.8012 | 0.7635 | 0.782 |
| Gender removed | 0.7143 | 0.7272 | 0.7996 | 0.7617 | 0.780 | |
| Age Removed | 0.7106 | 0.7204 | 0.8059 | 0.7608 | 0.771 | |
| All 3 removed | 0.7094 | 0.7185 | 0.8073 | 0.7603 | 0.769 | |
| Logistic Regression | Race removed | 0.6964 | 0.7451 | 0.7117 | 0.7280 | 0.758 |
| Gender removed | 0.6950 | 0.7414 | 0.7153 | 0.7281 | 0.756 | |
| Age Removed | 0.6734 | 0.7267 | 0.6862 | 0.7058 | 0.733 | |
| All 3 removed | 0.6714 | 0.7248 | 0.6842 | 0.7039 | 0.731 |
Across all three models, age appears to be the most influential variable regarding overall predictive utility. The removal of age resulted in the most significant drops in Accuracy and AUC. For instance, in the Logistic Regression model, removing age caused the AUC to plummet from 0.758 (race removed) to 0.733.
XGBoost proved to be the most resilient model to the removal of sensitive variables, maintaining an AUC of 0.785 even when race, gender, and age were all excluded. Conversely, Logistic Regression was the most “swayed” by these variables, showing a total AUC decline from 0.758 to 0.731 upon the removal of all three attributes.
While the removal of race and gender only marginally impacted accuracy, the continued presence of high recall values (0.8215 for XGBoost with all three removed) suggests that the models are likely leveraging proxy variables, such as criminal history or socioeconomic indicators, that correlate with these protected classes.
Statistical Significance
| Model | Metric | Comparison | Observed Difference | CI Lower | CI Upper | P-Value |
| XGBoost | TPR | Black vs. White | 0.019309 | -0.007612 | 0.047649 | 0.357 |
| FPR | Black vs. White | 0.080132 | 0.043034 | 0.114376 | 0.004 | |
| TPR | Male vs. Female | 0.063273 | 0.014453 | 0.0.111664 | 0.053 | |
| FPR | Male vs. Female | 0.035140 | -0.013667 | 0.0.086973 | 0.358 | |
| TPR | 18-32 vs. 33-47 | 0.046142 | 0.018698 | 0.075714 | 0.024 | |
| FPR | 18-32 vs. 33-47 | 0.124810 | 0.085415 | 0.164514 | 0.000 | |
| TPR | 33-47 vs. 48+ | 0.169879 | 0.117572 | 0.0.224653 | 0.0 | |
| FPR | 33-47 vs. 48+ | 0.138532 | 0.099789 | 0.181602 | 0.0 | |
| TPR | 18-32 vs. 48+ | 0.216021 | 0.160576 | 0.263923 | 0.0 | |
| FPR | 18-32 vs. 48+ | 0.263342 | 0.220300 | 0.309445 | 0.0 | |
| Random Forest | TPR | Black vs. White | 0.025825 | -0.001515 | 0.051444 | 0.155 |
| FPR | Black vs. White | 0.061981 | 0.025049 | 0.0.098210 | 0.024 | |
| TPR | Male vs. Female | 0.085321 | 0.039971 | 0.140223 | 0.001 | |
| FPR | Male vs. Female | 0.069726 | 0.017544 | 0.118164 | 0.095 | |
| TPR | 18-32 vs. 33-47 | -0.002704 | -0.03001 | 0.023049 | 0.88 | |
| FPR | 18-32 vs. 33-47 | 0.108710 | 0.06889 | 0.149052 | 0.0 | |
| TPR | 33-47 vs. 48+ | 0.226312 | 0.172990 | 0.279564 | 0.0 | |
| FPR | 33-47 vs. 48+ | 0.171592 | 0.0.125257 | 0.215407 | 0.0 | |
| TPR | 18-32 vs. 48+ | 0.223607 | 0.174501 | 0.274456 | 0.0 | |
| FPR | 18-32 vs. 48+ | 0.280303 | 0.234162 | 0.327806 | 0.0 | |
| Logistic Regression | TPR | Black vs. White | 0.001248 | -0.030550 | 0.028183 | 0.977 |
| FPR | Black vs. White | 0.050993 | 0.007589 | 0.079376 | 0.093 | |
| TPR | Male vs. Female | 0.198587 | 0.129481 | 0.237801 | 0.000 | |
| FPR | Male vs. Female | 0.157948 | 0.083999 | 0.168439 | 0.001 | |
| TPR | 18-32 vs. 33-47 | 0.121530 | 0.091363 | 0.153004 | 0.0 | |
| FPR | 18-32 vs. 33-47 | 0.191269 | 0.150770 | 0.229243 | 0.0 | |
| TPR | 33-47 vs. 48+ | 0.218912 | 0.159776 | 0.275297 | 0.0 | |
| FPR | 33-47 vs. 48+ | 0.122540 | 0.080140 | 0.163582 | 0.0 | |
| TPR | 18-32 vs. 48+ | 0.340442 | 0.288241 | 0.395918 | 0.0 | |
| FPR | 18-32 vs. 48+ | 0.313808 | 0.271413 | 0.351175 | 0.0 |
The statistical significance testing provides validation for the disparities identified in the SHAP and PDP analyses. While the models achieved high predictive accuracy, the p-values of 0.000 for age-based False Positive Rates across all architectures confirm a systemic bias towards youth that cannot be attributed to random noise. Furthermore, the p-value of 0.004 for racial disparities in XGBoost’s FPR confirms that Black defendants are subjected to a statistically significant higher rate of false-positive predictions.
Discussion
Overall, the evaluation of XGBoost, Random Forest, and Logistic Regression models highlights a trade-off between predictive power and equitable outcomes17. Across performance metrics, XGBoost demonstrated the highest overall accuracy, precision, and AUC, followed closely by Random Forest, while Logistic Regression consistently underperformed. However, this study reveals a distinct accuracy-fairness trade-off. While XGBoost achieved the highest technical performance, Logistic Regression maintained more stable error rates across subgroups, suggesting that the complexity of ensemble models may risk amplifying demographic disparities.
Fairness analyses reveal that the strong performance of ensemble models is not uniform. Younger individuals and men exhibited higher Positive Prediction Rates and significantly higher False Positive Rates (FPRs). This indicates that high-capacity models overclassify youth and men as recidivists, failing at a higher rate for these groups. The SHAP interaction and Class-Conditional Partial Dependence Plots confirm this possible bias towards younger individuals is not consistent across the models, with XGBoost assigning a risk penalty to the 18–22 age group nearly six times larger than that of Random Forest. While age and gender disparities are significant, the racial bias identified in the FPR analysis represents one of the most important findings of this study. Despite race having low global feature importance in SHAP summaries, Black defendants consistently faced higher false positive rates than White defendants across all models, even when their true positive rates (TPR) were comparable or lower18.
In practical terms, these patterns indicate that even the most accurate models carry embedded biases. Younger and male individuals were flagged more often, older and female individuals are under-identified.The disparity in FPRs between Black and White defendants underscores that high average performance can mask systematic inequities, especially in high-stakes decisions like parole or sentencing. Furthermore, while existing literature extensively documents racial bias, this study contributes to the broader discourse by highlighting the interaction between age and race. Specifically, enforcement bias potentially compounds for younger Black individuals, who are assigned higher risk scores due to the mix of immutable demographic variables and behavioral proxies19.
The findings of this study are subject to fundamental constraints regarding their generalizability. First, the use of 2013 Georgia data introduces temporal drift and lacks representativeness, as the results may not reflect current policies or diverse racial identities beyond a Black/White binary20. Second, our reliance on hard labels at a fixed 0.5 threshold is a primary limitation; fairness is highly threshold-sensitive, and using a single cutoff for all groups can mask deeper disparities21. Finally, the sensitivity of fairness metrics represents context-specific trade-offs rather than absolute measures of bias. Consequently, these models should be viewed as historical benchmarks of systemic bias rather than universally applicable tools.
Moving forward, research must shift from identifying bias to mitigating it through targeted algorithmic intervention. Future studies should explore pre-processing techniques, such as reweighting training samples to neutralize historical disparities before model training. Additionally, in-processing strategies like adversarial debiasing could ensure that performance optimization does not risk equity22. Finally, investigating post-processing threshold optimization would allow for subgroup-specific adjustments to minimize the disparate impact of false positives identified in the study.
Ultimately, this research provides two main contributions to the broader discourse on algorithmic fairness. First, while existing literature focuses heavily on racial disparities, this study identifies age as a primary factor that carries a risk penalty disproportionate to its actual predictive utility23. By using SHAP interaction plots, this study demonstrates that age-based bias is a penalty that ensemble models apply more aggressively than traditional linear models. Second, this study highlights a critical complexity-fairness trade-off24. XGBoost yielded a 5% gain in accuracy but a nearly double increase in FPR volatility across age and race subgroups. This suggests that the pursuit of higher AUC may inherently lead to the amplification of subgroup disparities.
Acknowledgements
I would like to extend my gratitude to my senior mentor, Jennifer Gao. Throughout the study, Jennifer provided invaluable guidance and support, assisting in the research process. Jennifer’s thoughtful feedback was vital in forming the methodology used in the study. Furthermore, I would like to sincerely thank the Polygence Writing Team Fellows for reviewing and providing feedback on my article. Their in-depth commentary and suggestions enabled me to further explore the topic, offering new insights and analysis.
References
- R. Berk, S. B. Sorenson. Algorithmic bias in policing: An age-old problem. Annual Review of Criminology. Vol. 3, pg. 473–491, 2020. [↩]
- J. Larson, S. Mattu, L. Kirchner, J. Angwin. How we analyzed the COMPAS recidivism algorithm. https://www.propublica.org/article/how-we-analyzed-the-compas-recidivism-algorithm. 2016. [↩] [↩]
- Northpointe. COMPAS scales and risk models: Validity and reliability. https://archive.epic.org/algorithmic-transparency/crim-justice/EPIC-16-06-23-WI-FOIA-201600805-COMPASSummaryResults.pdf. 2010. [↩]
- W. D. Heaven. Predictive policing algorithms are racist. They need to be dismantled. https://www.technologyreview.com/2020/07/17/1005396/predictive-policing-algorithms-racist-dismantled-machine-learning-bias-criminal-justice/. 2020. [↩]
- NAACP. Artificial intelligence in predictive policing issue brief. https://naacp.org/resources/artificial-intelligence-predictive-policing-issue-brief. n.d. [↩]
- S. Prince, N. Schwarzenberg. Proxy discrimination in the age of algorithms and big data. Iowa Law Review. Vol. 105, pg. 1257–1318, 2020. [↩]
- National Institute of Justice. Recidivism forecasting challenge. https://nij.ojp.gov/funding/recidivism-forecasting-challenge. 2021. [↩]
- R. J. A. Little, D. B. Rubin. Statistical analysis with missing data. 2019. [↩]
- N. V. Chawla, K. W. Bowyer, L. O. Hall, W. P. Kegelmeyer. Smote: Synthetic minority over-sampling technique. Journal of Artificial Intelligence Research. Vol. 16, pg. 321–357, 2002. [↩]
- C. Rudin. Stop explaining black box machine learning models for high stakes decisions and use interpretable models instead. Nature Machine Intelligence. Vol. 1, pg. 206–215, 2019. [↩]
- T. Chen, C. Guestrin. XGBoost: A scalable tree boosting system. Proceedings of the 22nd ACM SIGKDD International Conference on Knowledge Discovery and Data Mining. pg. 785–794, 2016. [↩] [↩]
- S. M. Lundberg, S. I. Lee. A unified approach to interpreting model predictions. Advances in Neural Information Processing Systems. Vol. 30, 2017. [↩]
- J. H. Friedman. Greedy function approximation: A gradient boosting machine. The Annals of Statistics. Vol. 29, pg. 1189–1232, 2001. [↩]
- C. Dwork, M. Hardt, T. Pitassi, O. Reingold, R. Zemel. Fairness through awareness. Proceedings of the 3rd Innovations in Theoretical Computer Science Conference. pg. 214–226, 2012. [↩]
- M. Hardt, E. Price, N. Srebro. Equality of opportunity in supervised learning. Advances in Neural Information Processing Systems. Vol. 29, pg. 3315–3323, 2016. [↩]
- J. Buolamwini, T. Gebru. Gender shades: Intersectional accuracy disparities in commercial gender classification. Proceedings of the 1st Conference on Fairness, Accountability, and Transparency. pg. 77–91, 2018. [↩]
- J. Kleinberg, S. Mullainathan, M. Raghavan. Inherent trade-offs in the fair determination of risk scores. Proceedings of the 8th Innovations in Theoretical Computer Science Conference. 2016. [↩]
- A. Chouldechova. Fair prediction with disparate impact: A study of bias in recidivism prediction instruments. Big Data. Vol. 5, pg. 153–163, 2017. [↩]
- J. L. Skeem, C. T. Lowenkamp. Risk, race, and recidivism: Predictive bias and disparate impact. Criminology. Vol. 54, pg. 680–712, 2016. [↩]
- A. Coston, A. Rambachan, A. Chouldechova. Characterizing fairness over time and under drift. Proceedings of the 2021 AAAI/ACM Conference on AI, Ethics, and Society. pg. 344–355, 2021. [↩]
- S. Davies, E. Pierson, A. Feller, S. Goel, A. Huq. Algorithmic decision making and the cost of fairness. Proceedings of the 23rd ACM SIGKDD International Conference on Knowledge Discovery and Data Mining. pg. 797–806, 2017. [↩]
- B. H. Zhang, B. Lemoine, M. Beutel. Mitigating unwanted biases with adversarial learning. Proceedings of the 2018 AAAI/ACM Conference on AI, Ethics, and Society. pg. 335–340, 2018. [↩]
- A. M. Martel. Machine learning in bail decisions and judges’ trustworthiness. https://pmc.ncbi.nlm.nih.gov/articles/PMC10120473/. 2023. [↩]
- D. Plecko, E. Bareinboim. Fairness-accuracy trade-offs: A causal perspective. Proceedings of the 38th AAAI Conference on Artificial Intelligence. 2024. [↩]


