
Abstract
Schizophrenia (SZ) and Schizoaffective disorder (SZA) are closely related psychotic disorders that share common clinical features but differ in neurobiological mechanisms. Structural neuroimaging evidence suggests that white matter and cortical alterations play a crucial role in the pathophysiology of psychotic disorders. This study investigated structural neuroimaging differences across psychotic disorder subtypes and their associations with illness duration. Open-source neuroimaging data were obtained from the Human Connectome Project – Early Psychosis (HCP-EP), including 68 healthy controls and 174 patients across diagnostic groups of SZ, SZA, Bipolar disorder, and Major Depressive Disorder (MDD). Magnetic Resonance Imaging (MRI) outcome categories, including cortical thickness, white matter volume focusing on frontal and temporal regions, white matter regions of interest, and white/non-white matter hypointensities were analyzed using one-way Analysis of Variance (ANOVA) with False Discovery Rate (FDR) correction, controlling for covariates. Group comparisons between Bipolar disorder and MDD were conducted using Welch’s t-tests and associations with illness duration were calculated using Pearson analyses. Results indicated that cortical thickness differed significantly between controls and patient groups, with patients showing alterations relative to healthy controls; however, no cortical thickness metrics significantly distinguished between the patient groups themselves. Furthermore, no significant differences were observed in white matter regions of interest when directly comparing Bipolar and MDD groups. Regression analyses revealed that both white and non–white matter hypointensities were positively associated with longer illness duration. Nevertheless, as hypointensities represent MRI signal changes commonly linked to aging processes and were observed across both white and gray matter regions, these findings may reflect nonspecific age-related effects rather than disorder-specific progression.
Keywords: Schizophrenia (SZ), Schizoaffective disorder (SZA), Bipolar, Major Depressive Disorder (MDD), Schizophrenia-spectrum, Psychotic disorders, Cortical Thickness, White Matter, Illness Duration, Human Connectome Project
Introduction
Schizophrenia (SZ) and Schizoaffective disorder (SZA) are closely related psychotic disorders that share different neurobiological underlying mechanisms but similar clinical symptoms1. Structural neuroimaging evidence indicates that white matter and cortical alterations play a crucial role in the pathophysiology of psychotic disorders2. By definition, Schizophrenia (SZ) is a complex, chronic mental health disorder characterized by alterations in cognition, behavior and perception. Closely related to SZ is schizoaffective disorder (SZA), which is characterized with similar features of SZ and major mood disorder, like mania and depression3. Although SZ and SZA are classified distinctly in diagnosis manuals, significant overlap occurs in clinical symptoms, treatment options and biological bases. The symptoms of psychotic disorders are commonly divided into positive symptoms and negative symptoms. Positive symptoms are changes in thoughts and feelings that are “added on” to a person’s experiences. Whereas negative symptoms are things that are “taken away” or reduced4.
This clinical and biological overlap has driven researchers to conceptualize these occurrences as elements of a substantial psychosis spectrum rather than completely distinct disorders5. Investigation of the neurobiological mechanisms underlying these disorders is necessary to clarify diagnostic boundaries and evaluate structural brain alterations across diagnostic groups.
To accurately assess these mechanisms, explicit structural neuroimaging terminology must be delineated. Gray matter consists of neural cell bodies, dendrites and synapses, whereas cortical gray matte thickness quantifies the depth of the cerebral cortex across brain regions6. Conversely, subcortical and cerebellar white matter volumes reflect macrostructural tissue volume comprising myelinated axon tracts7. Furthermore, white matter (WM) and non-white matter (non-WM) hypointensities represent localized signal reductions on T1-weighted MRI scans, reflecting microstructural tissue alterations, vascular changes, age-related tissue shifts, etc.8. White matter hypointensities are especially important because they may indicate disrupted neural connectivity between cortical regions involved in cognition and emotion regulation9. Structural alterations in psychotic disorders generally involve frontal and temporal cortical regions10 which are essential for emotion regulation, executive control, auditory processing and language11. Additionally, cross-sectional studies suggest that structural measures of the brain may correlate with the has elapsed since illness onset12.
The psychotic abnormalities suggest impaired connectivity between frontal, temporal, and limbic regions, which are critical for cognition, emotion regulation, and perception. Crucially, white matter abnormalities may be linked to specific aspects of patient symptoms and outcomes. For example, disruptions in fronto-temporal connectivity have been associated with hallucinations and thought disorder, while abnormalities in frontal white matter tracts are often linked to executive dysfunction and negative symptoms13. Furthermore, research suggests that white matter changes may worsen with longer duration of illness14.
The present study aimed to evaluate regional structural brain measures, specifically frontal and temporal cortical thicknesses, white matter volumes and tissue hypointensities, across psychotic disorder subtypes using open-access data HCP-EP. Specifically, the study evaluates diagnostic group differences between healthy controls, schizophrenia-spectrum (SZ and Schizophrenia-form), Schizoaffective, Bipolar and MDD while examining their cross-sectional associations with illness duration. It was hypothesized that patient groups would show regional cortical thickness alterations in frontal and temporal regions compared to healthy controls,15 and illness duration would show cross-sectional associations with tissue hypointensity volumes after accounting for key demographic covariates like age and sex16.
Methods
Data was obtained from HCP-EP release, accessible via the Connectome Coordination Facility (CCF)17. All statistical analyses of this research paper were conducted in a Google Colab environment using Python based scientific computing frameworks. Python 3.10 was selected as a programming language and scientific computing packages were integrated like pandas, scipy.stats and statsmodels. MRI outcome categories, including cortical thickness, white matter volume focusing on frontal and temporal regions, white matter regions of interest, and white/non-white matter hypointensities were analyzed using ANOVA with FDR correction, controlling for covariates. Group comparisons between Bipolar disorder and MDD were conducted using Welch’s t-tests and associations with illness duration were calculated using Pearson analyses. Multiple linear regression analyses were performed to evaluate whether illness duration was associated with white matter hypointensity volume and non-white matter hypointensity volume after adjustment for age, sex, scan site, and diagnostic group. Illness duration was entered as the predictor of interest, while age, sex, scan site, and diagnosis were included as covariates.
The initial dataset comprised 242 participants with structural MRI and clinical data (N=174 patients, N=68 healthy controls) (Table 1). Scans and clinical data were acquired across three independent data collection sites: Indiana University (IU) (N = 106), Brigham and Women’s Hospital (BWH) (N = 76), and McLean Hospital (N = 60) (Table 4). Imaging was performed using identical 3T Siemens Prisma MRI scanners using standard HCP acquisition protocols. Primary data collection was approved by the Institutional Review Boards (IRBs) of the scan sites18.
Participants were assigned to standardized diagnostic categories based on structured clinical evaluations (Diagnostic_label_detailed). To ensure transparent grouping, diagnostic recording rules were established prior to hypothesis testing. Bipolar disorder and MDD were classified as distinct mood disorder cohorts and were explicitly not treated as subtypes of schizoaffective disorder (Table 3).
Duration of illness in years was calculated for all patient participants using the formula of
Where exact calendar dates were missing or recorded via placeholder fields, clinical records detailing age at first psychotic episode were subtracted from age at MRI acquisition. Duration since the first psychotic episode was treated as a continuous variable. Participants with irrational or negative duration values were excluded from duration analyses.
| Patient | 174 |
| Control | 68 |
| Male | 155 |
| Female | 87 |
| Recorded Diagnostic Category | Included Diagnostic Labels | Sample Size (N) |
| Schizophrenia-spectrum | Schizophrenia, Schizophrenia-Form Disorder | 92 |
| Control | Healthy Control | 68 |
| Bipolar | Bipolar I, Bipolar II, Bipolar NOS | 45 |
| Schizoaffective | Schizoaffective Disorder | 20 |
| MDD | Major Depressive Disorder | 8 |
| Other patient | Brief Psychotic Disorder, Psychosis NOS | 9 |
| IU | 106 |
| BWH | 76 |
| McLean | 60 |
Results
Cortical thickness of Schizophrenia-spectrum and Schizoaffective in patients is altered in temporal and frontal regions relative to controls.
This study investigated structural MRI measures in individuals with psychosis, with a particular focus on white matter integrity and frontal and temporal cortical thickness. The primary aim was to examine group differences between healthy controls and individuals diagnosed with schizophrenia (SZ) or schizoaffective disorder (SZA), as well as to explore potential structural distinctions between SZ and SZA.
ANCOVA models adjusting for age, sex, and scan site demonstrated significant diagnostic group main effects for cortical thickness across temporal and frontal regions, whereas genuine white matter volume measures, cortical and cerebellar white matter volumes, did not show significance after FDR correction (pFDR > 0.05).
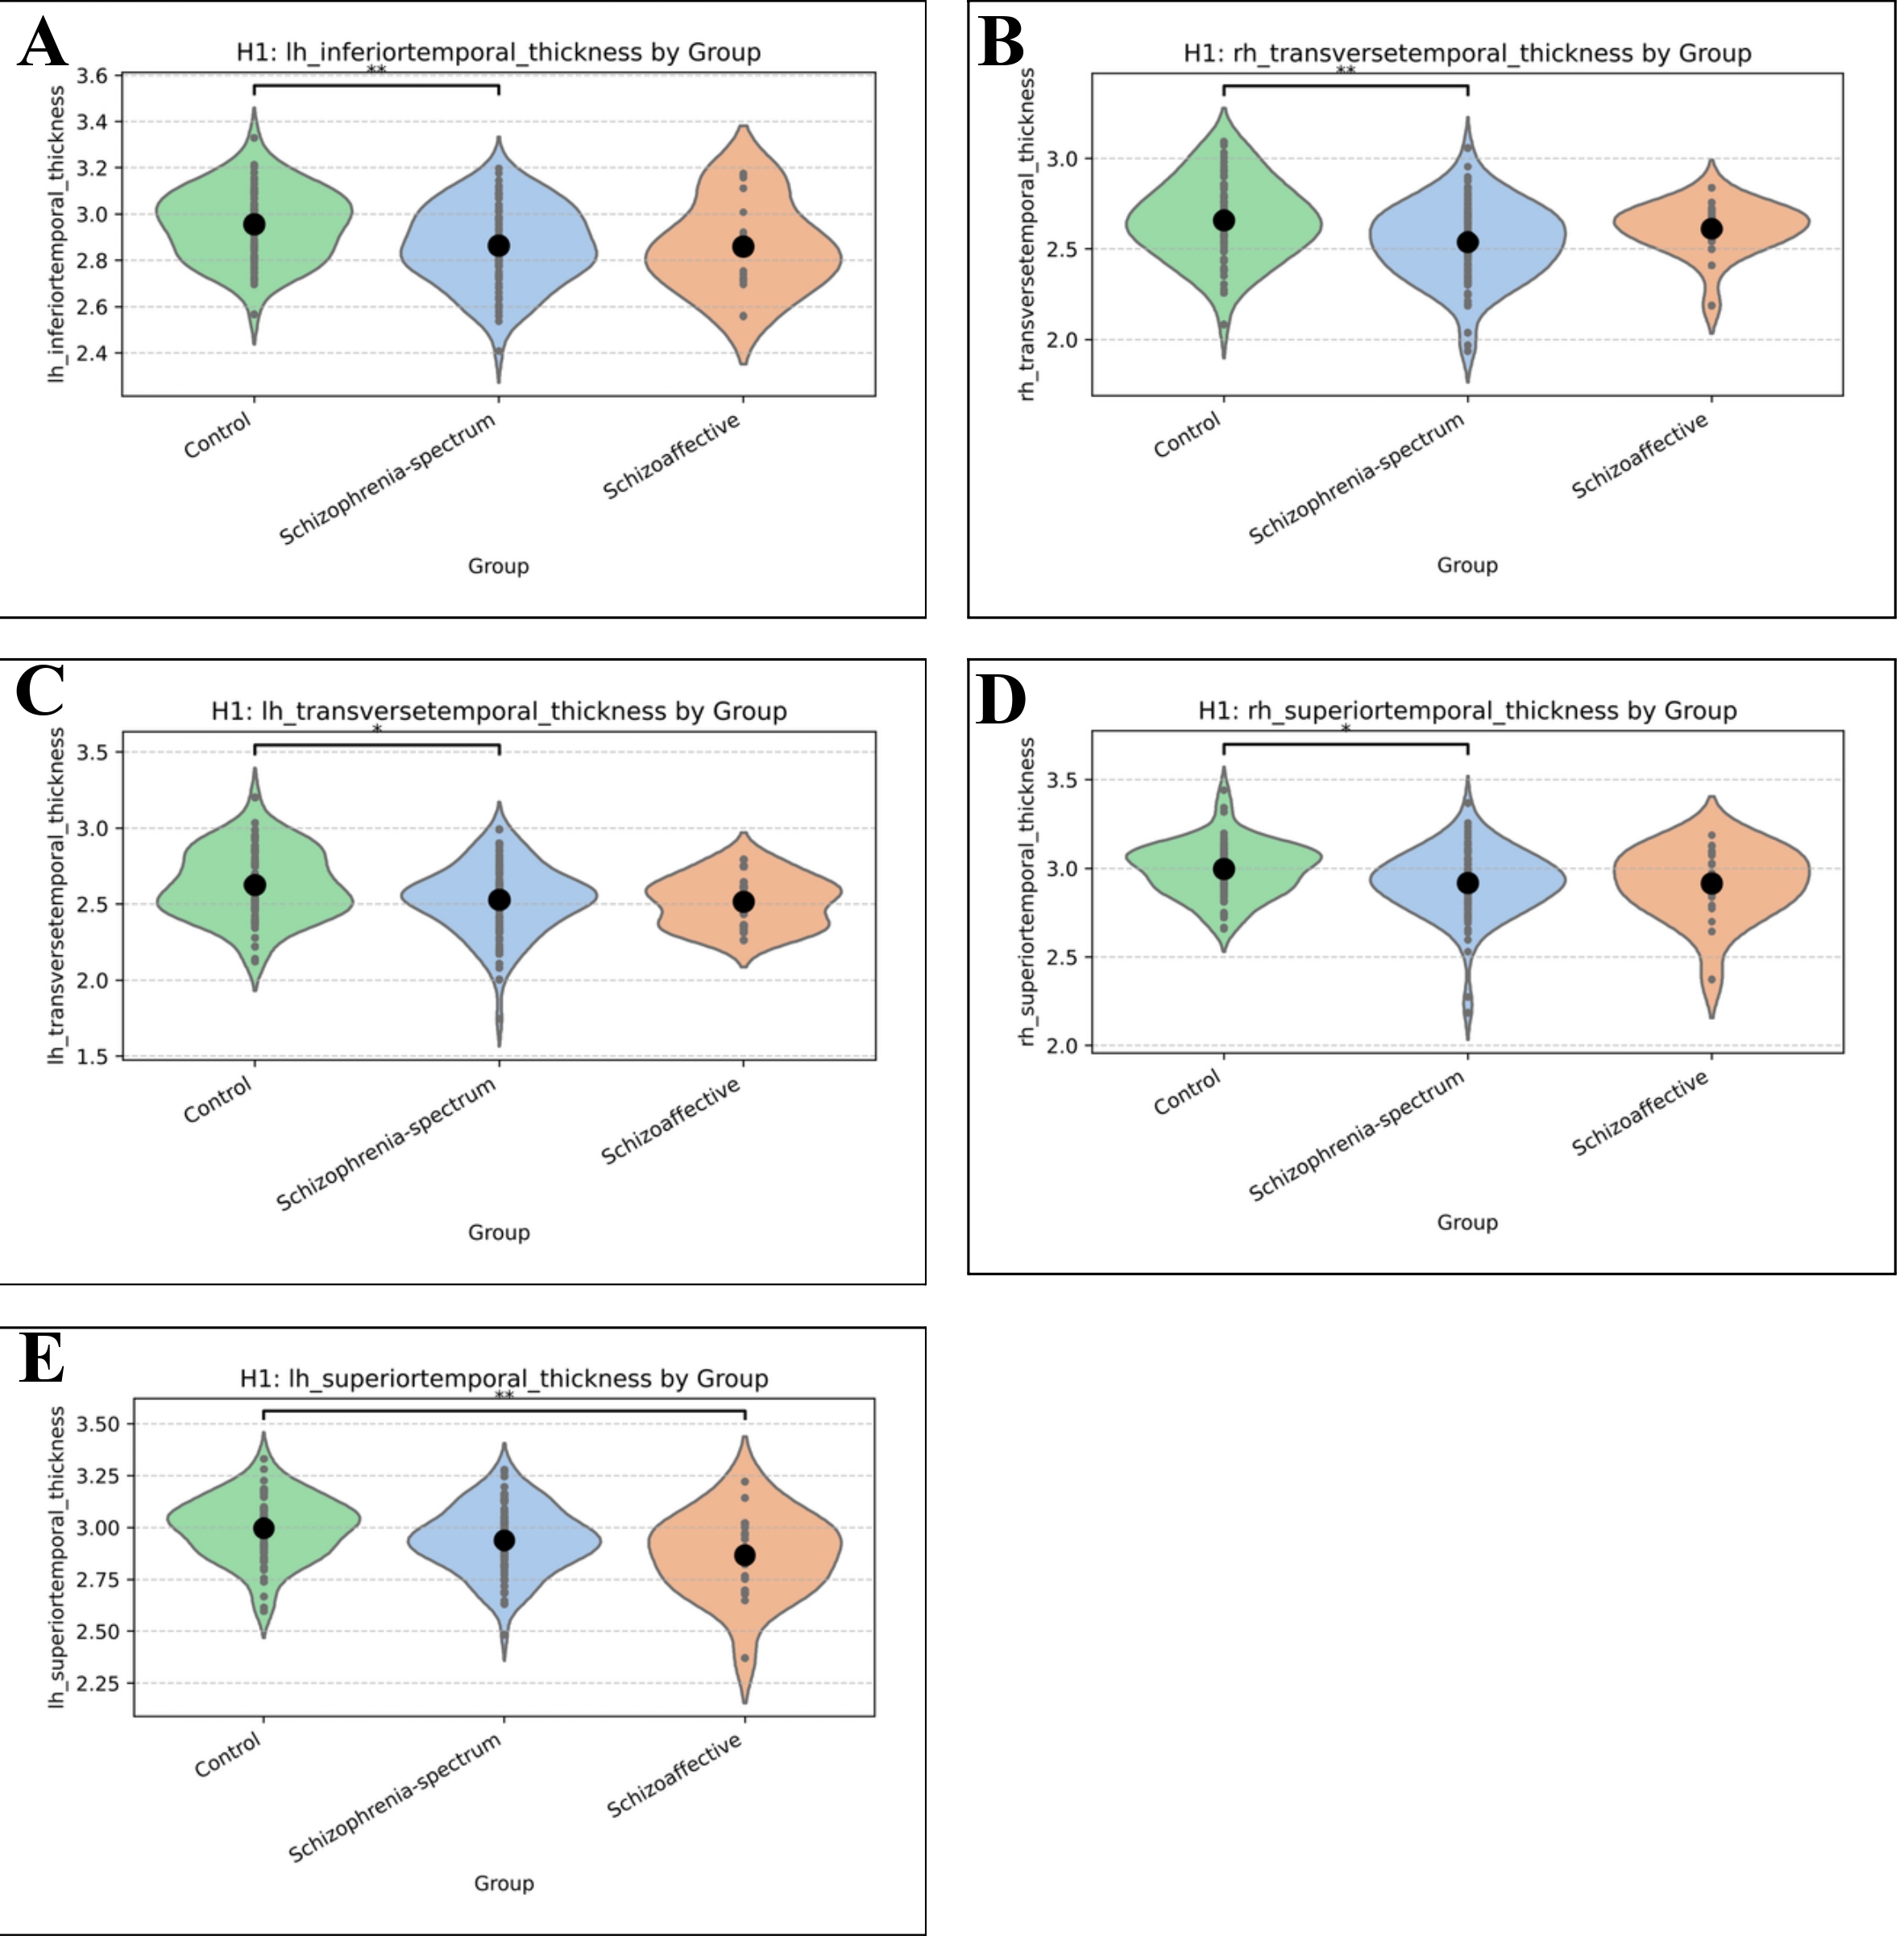
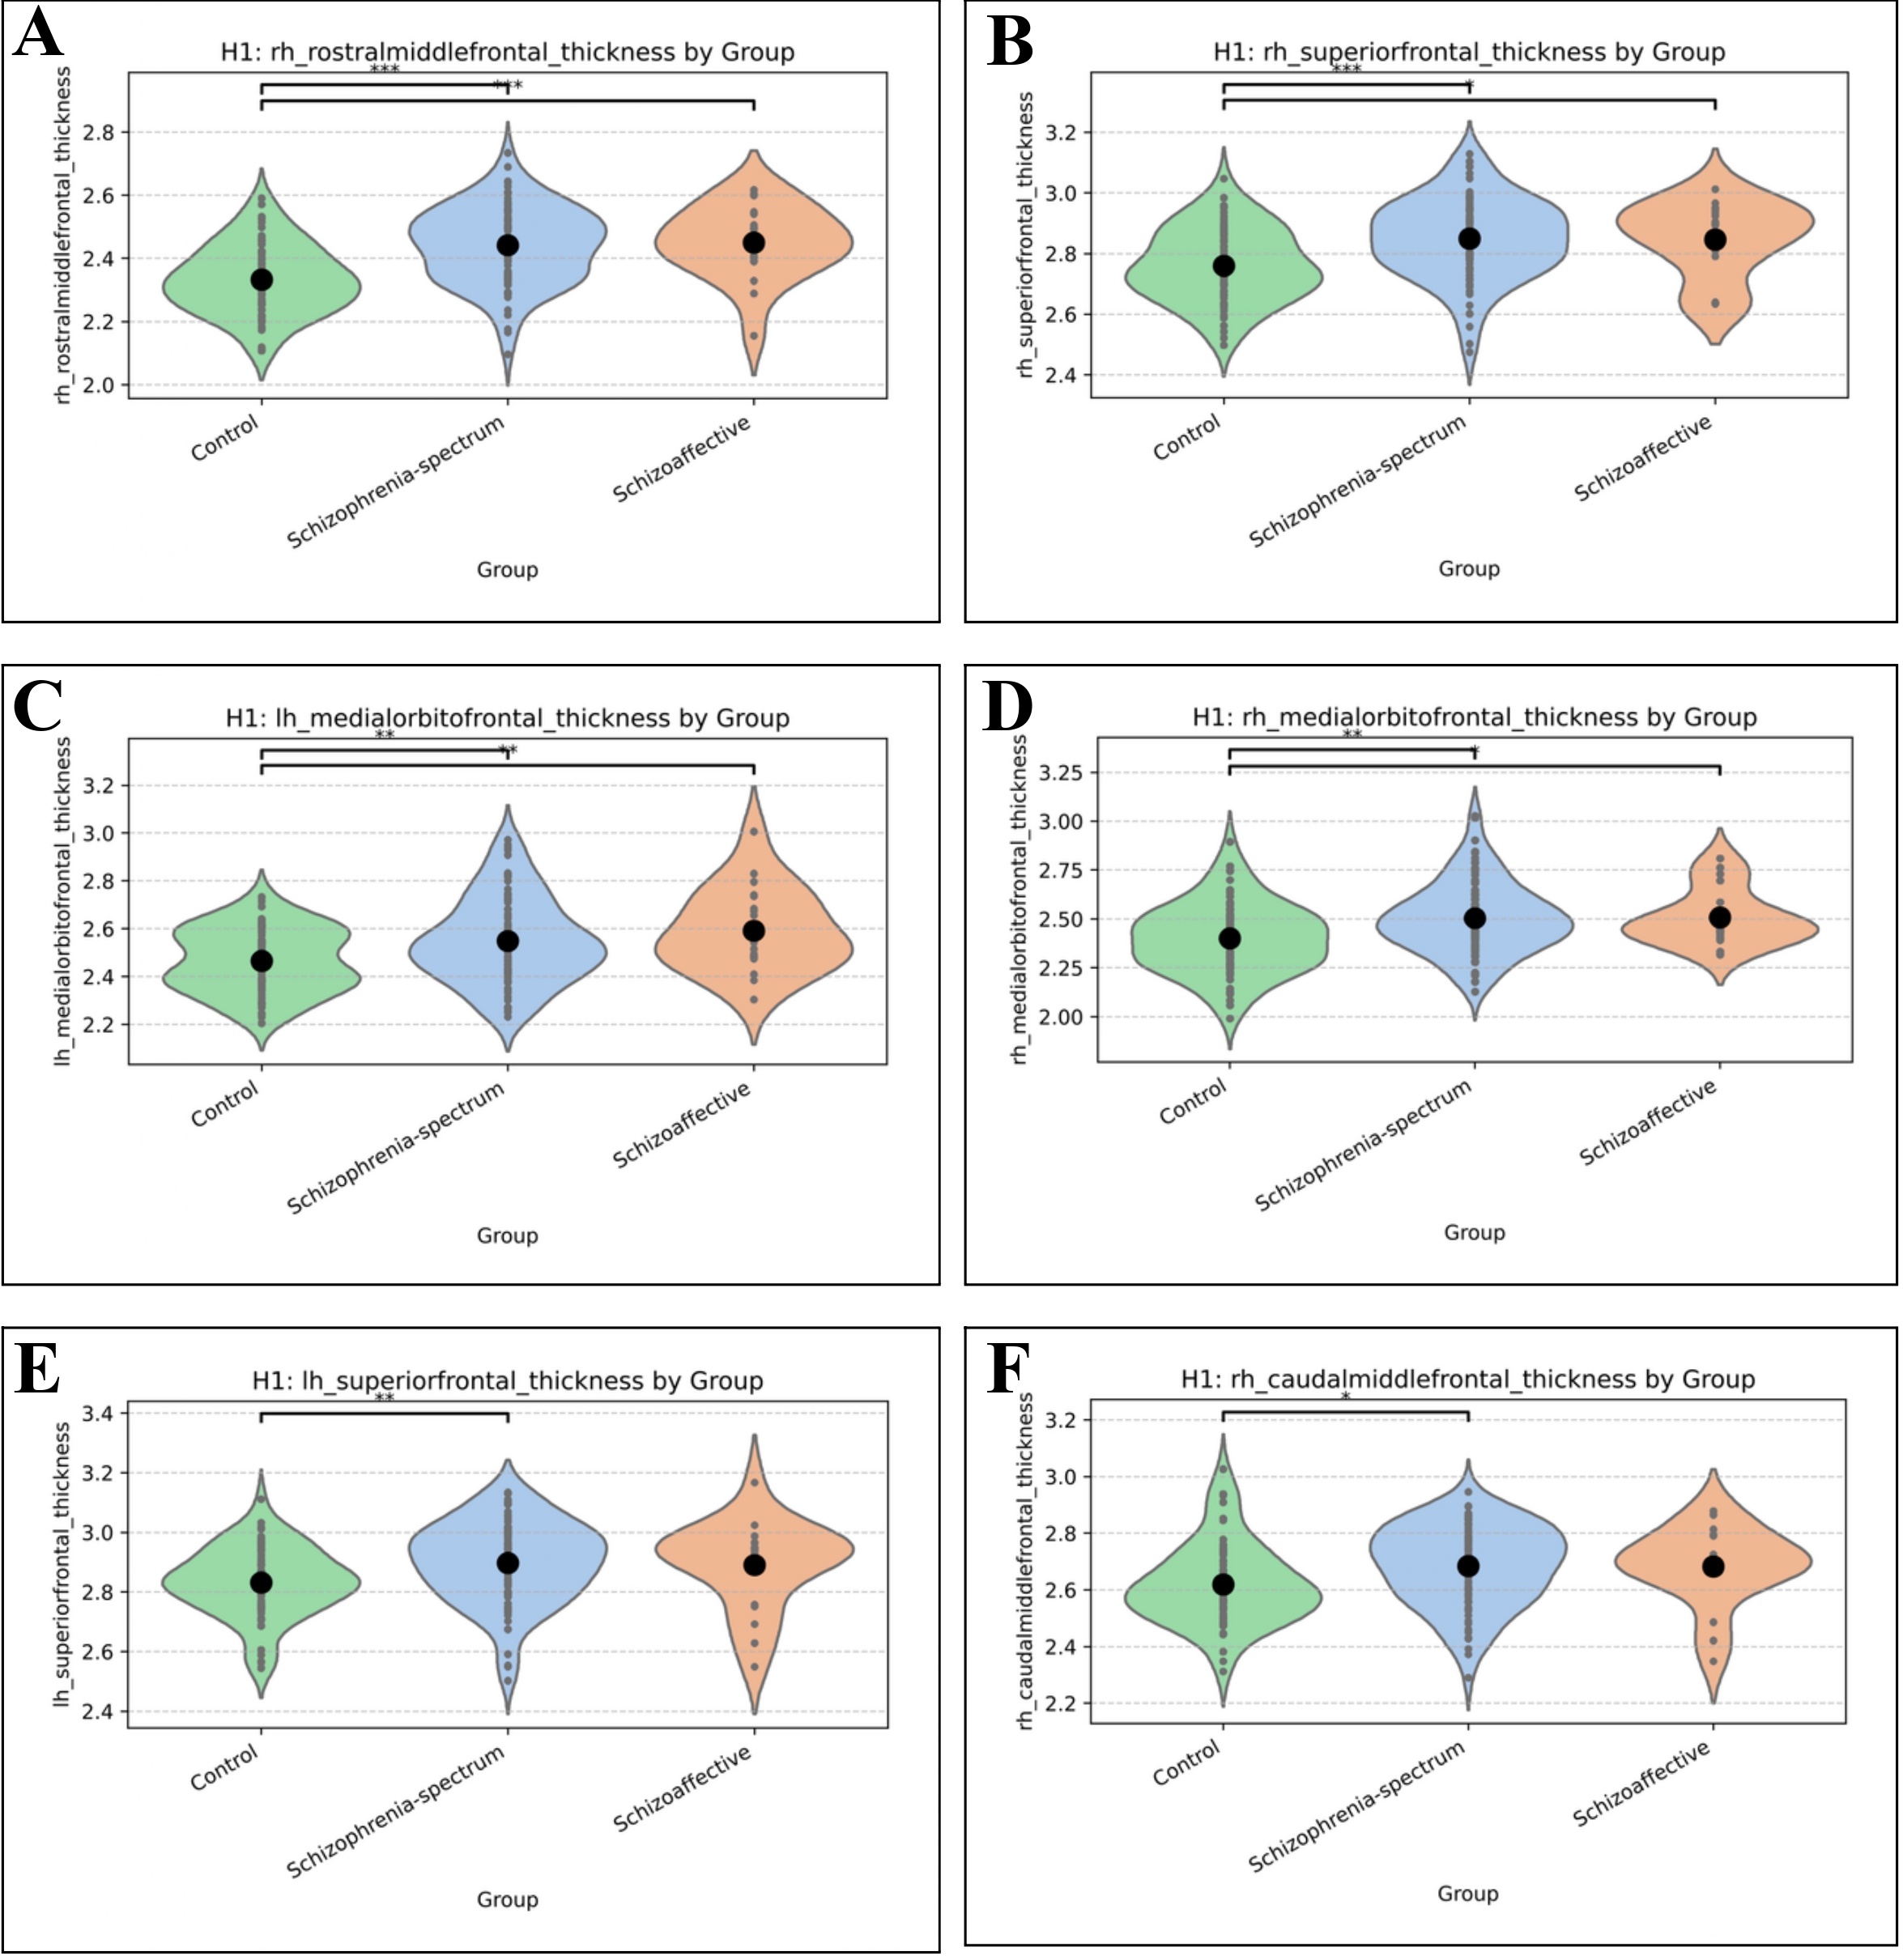
There were 5 temporal (Figure 1A-E) and 6 frontal (Figure 2A-F) cortical regions with significantly altered thickness across controls and patients (Table 5).
For temporal regions, the left hemisphere inferior temporal (Figure 1A) and transverse temporal (Figure 1B) thickness were decreased in schizophrenia-spectrum disorder compared to controls. On the right hemisphere side, transverse temporal (Figure 1C) and superior temporal (Figure 1D) thickness was decreased in schizophrenia-spectrum disorder relative to controls. Interestingly, the left hemisphere superior temporal thickness was decreased in schizoaffective disorder compared to controls (Figure 1E). Importantly, although each group differed from controls in the aforementioned brain regions, no significant differences were observed between schizophrenia-spectrum and schizoaffective disorder.
Out of the regions compared, there were 6 frontal brain regions with significantly altered thickness across controls and patients. These included the right hemisphere rostral middle frontal thickness (Figure 2A), right hemisphere superior frontal thickness (Figure 2B), left hemisphere medial orbitofrontal thickness (Figure 2C), right hemisphere medial orbitofrontal thickness (Figure 2D), left hemisphere superior frontal thickness (Figure 2E), and right hemisphere caudal middle frontal thickness (Figure 2F). Specifically, the right hemisphere rostral middle frontal thickness and right hemisphere superior frontal thickness showed increased thickness in both schizophrenia-spectrum and schizoaffective groups compared to controls. The left hemisphere medial orbitofrontal thickness, right hemisphere medial orbitofrontal thickness, left hemisphere superior frontal thickness, and right hemisphere caudal middle frontal thickness all showed significant increases in the schizophrenia-spectrum group compared to controls. Overall, no significant differences were observed between the schizophrenia-spectrum and schizoaffective disorders for these frontal regions, but both patient groups tended to show increased thickness compared to healthy controls.
| Brain Region of interest (ROI) | n | Groups | p from ANOVA | ETA-Squared | FDR-Corrected p |
| Right Hemisphere Rostral Middle Frontal Thickness | 180 | 3 | 2.47848E-08 (< 0.001) | 0.179537776 (0.180) | 6.93974E-07 (< 0.001) |
| Right Hemisphere Superior Frontal Thickness | 180 | 3 | 4.7997E-05 (< 0.001) | 0.10628271 (0.106) | 0.000671958 (0.001) |
| Left Hemisphere Medial Orbitofrontal Thickness | 180 | 3 | 0.000826137 (0.001) | 0.077079213 (0.077) | 0.006503365 (0.007) |
| Right Hemisphere Medial Orbitofrontal Thickness | 180 | 3 | 0.000929052 (0.001) | 0.075854047 (0.076) | 0.006503365 (0.007) |
| Left Hemisphere Inferior Temporal Thickness | 180 | 3 | 0.00137141 (0.001) | 0.071778533 (0.072) | 0.006960296 (0.007) |
| Right Hemisphere Transverse Temporal Thickness | 180 | 3 | 0.001491492 (0.001) | 0.070897747 (0.071) | 0.006960296 (0.007) |
| Left Hemisphere Superior Temporal Thickness | 180 | 3 | 0.003096347 (0.003) | 0.063197548 (0.063) | 0.012385389 (0.012) |
| Left Hemisphere Superior Frontal Thickness | 180 | 3 | 0.006058321 (0.006) | 0.056065555 (0.056) | 0.021204125 (0.021) |
| Right Hemisphere Caudal Middle Frontal Thickness | 180 | 3 | 0.012197542 (0.012) | 0.048571934 (0.049) | 0.034367318 (0.034) |
| Left Hemisphere Transverse Temporal Thickness | 180 | 3 | 0.012274042 (0.012) | 0.048504717 (0.049) | 0.034367318 (0.034) |
| Right Hemisphere Superior Temporal Thickness | 180 | 3 | 0.014811221 (0.015) | 0.046482408 (0.046) | 0.037701289 (0.038) |
| Right Hemisphere Frontal Pole Thickness | 180 | 3 | 0.017087219 (0.017) | 0.044941036 (0.045) | 0.039870179 (0.040) |
| Right Hemisphere Middle Temporal Thickness | 180 | 3 | 0.032708176 (0.033) | 0.037908327 (0.038) | 0.070448378 (0.070) |
| Right Hemisphere Lateral Orbitofrontal Thickness | 180 | 3 | 0.042522427 (0.043) | 0.035051448 (0.035) | 0.081142804 (0.081) |
| Left Hemisphere Cortical White Matter Volume | 180 | 3 | 0.043469359 (0.043) | 0.034811275 (0.035) | 0.081142804 (0.081) |
| Right Cerebellar White Matter Volume | 180 | 3 | 0.050583538 (0.051) | 0.033156824 (0.033) | 0.088521192 (0.081) |
| Total Cortical White Matter Volume | 180 | 3 | 0.076049697 (0.076) | 0.028691848 (0.029) | 0.125258324 (0.125) |
| Left Cerebellar White Matter Volume | 180 | 3 | 0.102240988 (0.102) | 0.025438339 (0.025) | 0.159041536 (0.159) |
| Left Hemisphere Caudal Middle Frontal Thickness | 180 | 3 | 0.116408913 (0.116) | 0.024008193 (0.024) | 0.171549978 (0.172) |
| Right Hemisphere Cortical White Matter Volume | 180 | 3 | 0.127535514 (0.128) | 0.02300096 (0.023) | 0.17193366 (0.172) |
| Left Hemisphere Middle Temporal Thickness | 180 | 3 | 0.130178486 (0.130) | 0.022774495 (0.023) | 0.17193366 (0.172) |
| Right Hemisphere Inferior Temporal Thickness | 180 | 3 | 0.135090733 (0.135) | 0.022365408 (0.022) | 0.17193366 (0.172) |
| Left Hemisphere Frontal Pole Thickness | 180 | 3 | 0.199032235 (0.199) | 0.018075196 (0.018) | 0.242300112 (0.242) |
| Left Hemisphere Rostral Middle Frontal Thickness | 180 | 3 | 0.214082304 (0.214) | 0.017266092 (0.017) | 0.249762687 (0.250) |
| White Matter Hypointensities | 180 | 3 | 0.443646207 (0.444) | 0.009141327 (0.009) | 0.496883751 (0.497) |
White matter integrity was unchanged between Bipolar and MDD patients.
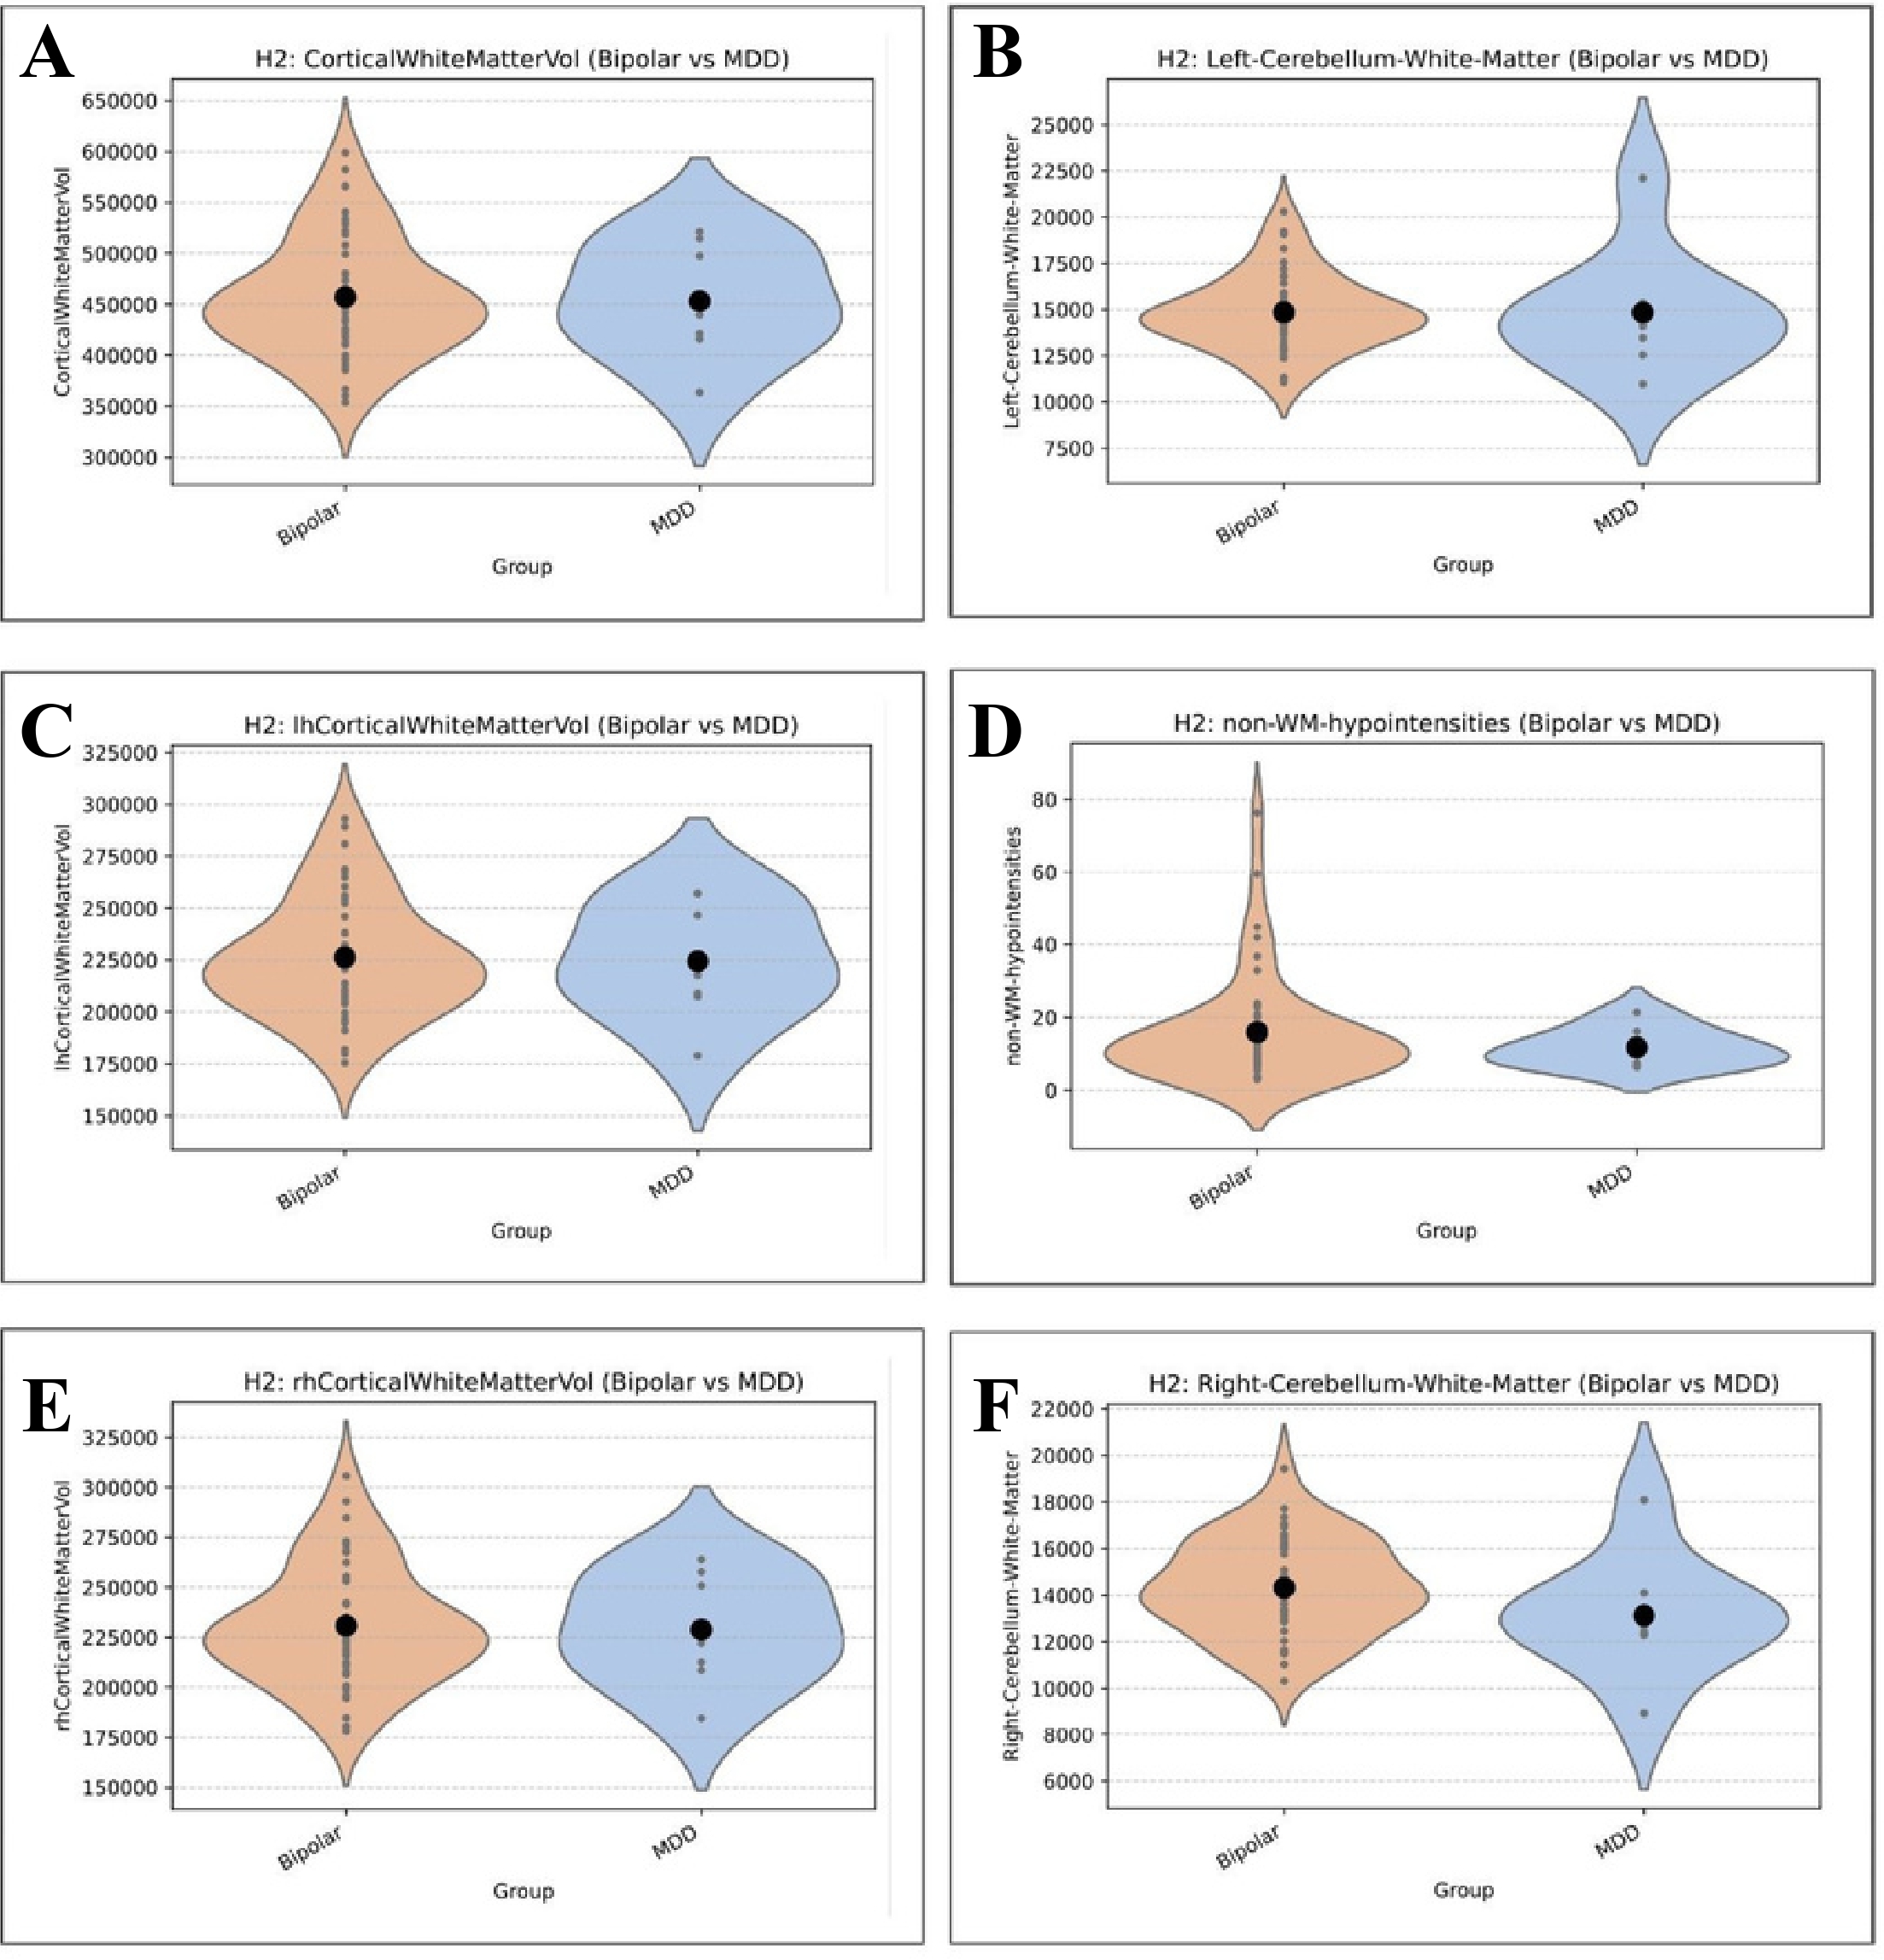
The objective was to compare Bipolar and MDD groups on white matter-volume-like measures. This hypothesis was proposing that individuals with Bipolar would show better white matter integrity than those with MDD within control groups19. For the analysis, two-sample t-tests (Welch’s t-test) were conducted for all white matter volume-like measures. No statistically significant differences were found between Bipolar and MDD groups for any of the white matter volume-like measures (all t-test p-values > 0.05), however the 5 regions with the largest differences are displayed in Figure 3A-E. Also, non-WM-hypointensities showed the lowest p-value at `0.153132` with a `Cohen’s d` of `0.302909`, indicating a small to medium effect but was not statistically significant (Figure 3F). Therefore no significant differences in white matter volume-like or integrity-like measures were observed between Bipolar and MDD groups after FDR correction. The closest was Right Cerebellar White Matter with an p-value of `0.239` (Table 6). Even when including a `Control` group, the white matter volume-like measures did not show significant differences across `Control`, `Bipolar`, and `MDD` groups after FDR correction.
| Measurement | number of Bipolar patients | number of MDD patients | t value | p value | cohen d value (Bipolar-MDD) |
| Right Cerebellar White Matter Volume | 45 | 8 | 1.266 | 0.239 | 0.567224468 (0.567) |
| White Matter Hypointensities | 45 | 8 | 0.641 | 0.527 | 0.14632169 (0.146) |
| Right Hemisphere Cortical White Matter Volume | 45 | 8 | 0.185 | 0.857 | 0.067305728 (0.067) |
| Total Cortical White Matter Volume | 45 | 8 | 0.176 | 0.864 | 0.065119313 (0.065) |
| Left Hemisphere Cortical White Matter Volume | 45 | 8 | 0.167 | 0.871 | 0.062659668 (0.063) |
| Left Cerebellar White Matter Volume | 45 | 8 | 0.007 | 0.995 | 0.003473329 (0.003) |
Hypointensities but not cerebellar white matter may correlate with illness duration
| Measurement | n | pearson r coefficient | p value |
| White Matter Hypointensities | 170 | 0.174 | 0.023 |
| Non-White Matter Hypointensities | 170 | 0.215 | 0.005 |
| Left Hemisphere Cortical White Matter Volume | 170 | 0.012 | 0.876 |
| Total Cortical White Matter Volume | 170 | 0.012 | 0.878 |
| Right Hemisphere Cortical White Matter Volume | 170 | 0.012 | 0.881 |
| Left Cerebellar White Matter Volume | 170 | 0.006 | 0.942 |
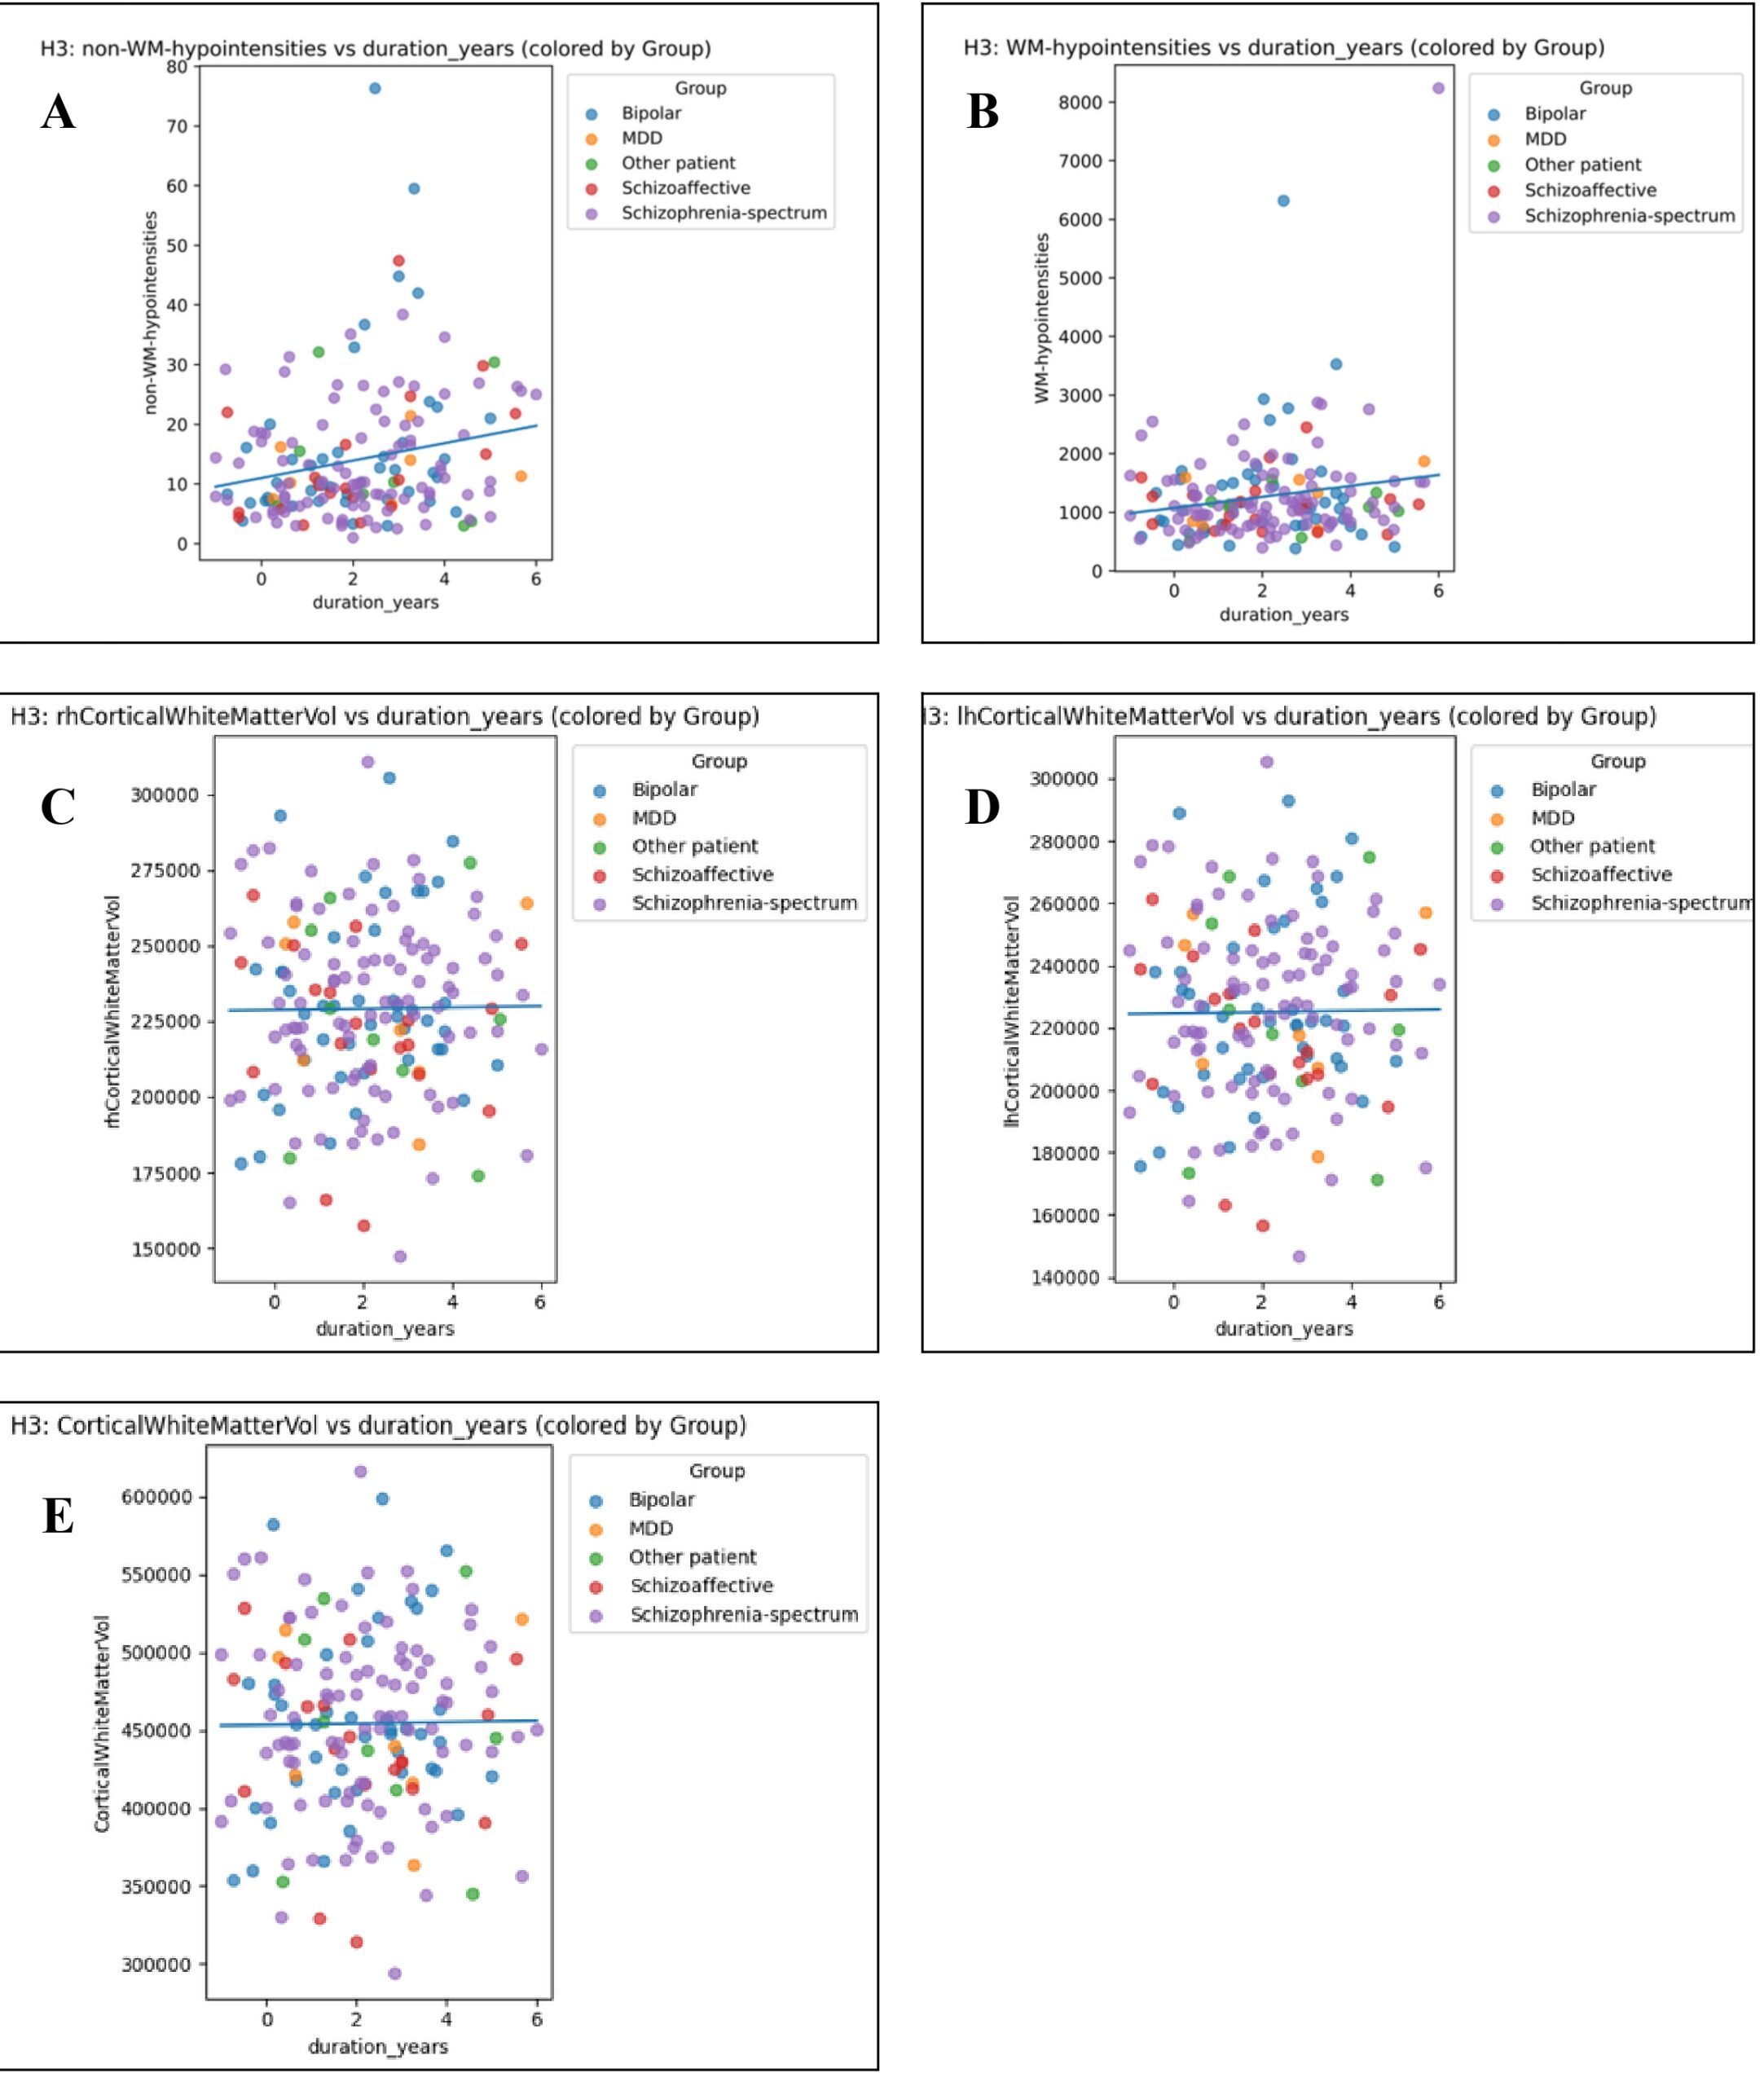
The objective of this subhypothesis was to investigate the association between the duration of illness and white matter integrity (operationalized as white matter volume-like measures) independent of subtype. Pearson correlations were computed between the length of time since diagnosis and cortical white matter volumes and hypointensities for all patient groups (Figure 4A-E). This correlation analysis, showed “non-WM hypointensities” (Figure 4A) and “WM-hypointensities” (Figure 4B) were the only metrics to correlate with duration of illness. The Pearson correlation coefficients were r = 0.215 and r = 0.174, respectively (Table 7). These correlations were found to be significant with p values of p = 0.0049 and 0.023, respectively (Table 7). Alternatively, neither the right side, left side or general cortical white matter volume does not change with duration of illness (Figure 4C-E).
In conclusion, longer illness duration was significantly associated with increased `WM-hypointensities` and `non-WM-hypointensities` in both simple correlation and controlled multivariate regression analyses. This suggests that the accumulation of white matter and non-white matter hypointensities could be associated with illness duration, even after controlling for demographic and diagnostic group factors20.
Discussion
This study evaluated regional cortical morphology, white matter volumes and tissue hypointensities across psychotic disorder subtypes, as well as cross-sectional associations with illness duration. Three primary findings emerged: diagnostic group alterations were localized in cortical thickness rather than subcortical white matter volumes, displaying a distinct pattern of temporal thinning and frontal thickening in patient groups relative to controls, structural metrics did not significantly distinguish schizophrenia-spectrum from SZA, nor Bipolar disorder from MDD, and cross-sectional associations between illness duration and brain hypointensities were weak and largely accounted by age.
The findings demonstrate an anatomical divergence in cortical thickness alterations among individuals with psychotic disorders21. Reductions in cortical thickness were limited to temporal regions, including the inferior and transverse temporal gyri* in schizophrenia-spectrum patients and the superior temporal gyrus in schizoaffective patients. The superior and transverse temporal gyri comprise primary and secondary auditory cortices localized structural thinning in these areas aligns with established models implicating fronto-temporal connectivity deficits in auditory hallucinations and language processing disturbances22.
In contrast, frontal regions including the rostral middle frontal, superior frontal and medial orbitofrontal cortices exhibited increased cortical thickness in patient groups relative to healthy controls. While cortical thinning is frequently emphasized in chronic schizophrenia literature, regional frontal thickening or preserved thickness has been documented in early-course psychosis cohorts and non-affective psychosis subtypes. Distinguishing temporal thinning from frontal thickening highlights the importance of evaluating regionally specific cortical dynamics rather than assuming uniform cortical loss23.
Cortical thickness and white matter measures failed to demonstrate statistically significant differences between schizophrenia-spectrum and schizoaffective disorders. Furthermore, no significant structural differences stayed after FDR correction when comparing Bipolar disorder to MDD. These findings support biological models that conceptualize affective and non-affective psychosis along a continuous neurobiological spectrum. However, the null finding between Bipolar and MDD must be interpreted with caution given the small size of the MDD sample (N = 8) compared to the sample size of Bipolar is (N = 45).
Importantly, macrostructural white matter volume variables, cerebellar and cortical white matter volumes, showed no group differences across diagnostic categories after FDR correction. This indicates that standard structural T1-weighted volumetric measures lack the sensitivity required to detect white matter microstructural disorganization in psychosis.
Although unadjusted bivariate correlations suggested weak positive associations between illness duration and hypointensity volumes (r = 0.174 – 0.215), covariate-adjusted regression models demonstrated that these associations were weakened once chronological age was included. Age and illness duration are collinear in cross-sectional early-psychosis samples, hypointensity signal alterations primarily reflect normal age-related vascular or microstructural processes rather than accelerated.
* raised ridges or folds on the surface of the cerebrum
On the other hand as this data was cross-sectional, associations with illness duration must not be interpreted as longitudinal evidence of progressive structural deterioration within individuals24. Several methodological limitations should be considered when interpreting these findings. Firstly, the cross-sectional nature of the HCP-EP dataset limits the ability to establish causal relationships or find a pattern of intraindividual trajectories of structural brain changes over time. Furthermore, the MDD cohort was small (N = 8) compared to the Bipolar (N = 45) and Schizophrenia-spectrum (N = 92) cohorts, resulting in low statistical power for mood disorder subgroup comparisons. The lack of significant differences between bipolar disorder and major depressive disorder was consistent with prior research suggesting substantial structural overlap between mood disorders, making them difficult to distinguish using cortical thickness alone25.
Furthermore, although statistical models controlled for age, sex, scan site and total volume, potential confounding effects from psychotropic medication exposure like antipsychotic dosage, mood stabilizers, lifetime substance use and socioeconomic factors were not available or controlled for in these models26.
References
- D. H. Mathalon, R. E. Hoffman, T. D. Watson, R. M. Miller, B. J. Roach, J. M. Ford. Neurophysiological distinction between schizophrenia and schizoaffective disorder. Frontiers in Human Neuroscience. Vol. 3, 2010 https://doi.org/10.3389/neuro.09.070.2009 [↩]
- K. Mahon, K. E. Burdick, P. R. Szeszko. A role for white matter abnormalities in the pathophysiology of bipolar disorder. Neuroscience and Biobehavioral Reviews. Vol. 34, pg. 533–554, 2010, https://doi.org/10.1016/j.neubiorev.2009.10.012 [↩]
- L. Y. Goga, B. S. Marais. Schizophrenia and schizoaffective disorder: length of stay and associated factors. South African Journal of Psychiatry. Vol. 30, pg. 2237, 2024, https://doi.org/10.4102/sajpsychiatry.v30i0.2237 [↩]
- M. Maes, G. Anderson. False dogmas in schizophrenia research: toward the reification of pathway phenotypes and pathway classes. Frontiers in Psychiatry. Vol. 12, 2021 https://doi.org/10.3389/fpsyt.2021.663985 [↩]
- C. Lake, N. Hurwitz. Schizoaffective disorder merges schizophrenia and bipolar disorders as one disease – there is no schizoaffective disorder. Current Opinion in Psychiatry. Vol. 20, pg. 365–379, 2007 https://doi.org/10.1097/YCO.0b013e3281a305ab [↩]
- A. M. Winkler, P. Kochunov, J. Blangero, L. Almasy, K. Zilles, P. T. Fox, R. Duggirala, D. C. Glahn. Cortical thickness or grey matter volume? the importance of selecting the phenotype for imaging genetics studies. NeuroImage. Vol. 53, pg. 1135–1146, 2010 https://doi.org/10.1016/j.neuroimage.2009.12.028 [↩]
- N. Zdanovskis, A. Platkājis, A. Kostiks, O. Grigorjeva, G. Karelis. Cerebellar cortex and cerebellar white matter volume in normal cognition, mild cognitive impairment, and dementia. Brain Sciences. Vol. 11, pg. 1134, 2021 https://doi.org/10.3390/brainsci11091134 [↩]
- J. M. Wardlaw, M. C. Valdés Hernández, S. Muñoz-Maniega. What are white matter hyperintensities made of? Relevance to vascular cognitive impairment. Journal of the American Heart Association. Vol. 4, pg. e001140, 2015, https://doi.org/10.1161/JAHA.114.001140 [↩]
- C. M. Filley, R. D. Fields. White matter and cognition: making the connection. Journal of Neurophysiology. Vol. 116, pg. 2093–2104, 2016 https://doi.org/10.1152/jn.00221.2016 [↩]
- A. Kaur, D. M. Basavanagowda, B. Rathod, N. Mishra, S. Fuad, S. Nosher, Z. A. Alrashid, D. Mohan, S. E. Heindl. Structural and functional alterations of the temporal lobe in schizophrenia: a literature review. Cureus. Vol. 12, pg. e11177, 2020, https://doi.org/10.7759/cureus.11177 [↩]
- S. Seuffert, R. R. Mülfarth, L. Teutenberg, F. Thomas-Odenthal, P. Usemann, N. Alexander, H. Jamalabadi, I. Nenadić, B. Straube, T. Hahn, U. Dannlowski, T. Kircher, [check], F. Stein. Linking speech patterns to brain structure in affective and psychotic disorders: an integrative natural language processing approach. Molecular Psychiatry. Vol. 31, pg. 2057–2068, 2026, https://doi.org/10.1038/s41380-025-03347-9 [↩]
- U. S. Torres, F. L. S. Duran, M. S. Schaufelberger, J. A. S. Crippa, M. R. Louzã, P. C. Sallet, C. Y. O. Kanegusuku, H. Elkis, W. F. Gattaz, D. P. Bassitt, A. W. Zuardi, J. E. C. Hallak, C. C. Leite, C. C. Castro, A. C. Santos, R. M. Murray, G. F. Busatto. Patterns of regional gray matter loss at different stages of schizophrenia: a multisite, cross-sectional VBM study in first-episode and chronic illness. NeuroImage: Clinical. Vol. 12, pg. 1–15, 2016, https://doi.org/10.1016/j.nicl.2016.06.002 [↩]
- I. Spoletini, A. Cherubini, M. Di Paola, G. Banfi, N. Rüsch, G. Martinotti, P. Bria, I. A. Rubino, A. Siracusano, C. Caltagirone, G. Spalletta. Reduced fronto-temporal connectivity is associated with frontal gray matter density reduction and neuropsychological deficit in schizophrenia. Schizophrenia Research. Vol. 108, pg. 57–68, 2009 https://doi.org/10.1016/j.schres.2008.11.011 [↩]
- J. Groh, M. Simons. White matter aging and its impact on brain function. Neuron. Vol. 113, pg. 127–139, 2025 https://doi.org/10.1016/j.neuron.2024.10.019 [↩]
- T. G. M. van Erp, [full author list]. Cortical brain abnormalities in 4474 individuals with schizophrenia and 5098 control subjects via the Enhancing Neuro Imaging Genetics Through Meta Analysis (ENIGMA) Consortium. Biological Psychiatry. Vol. 84, pg. 644–654, 2018, https://doi.org/10.1016/j.biopsych.2018.04.023 [↩]
- K. Wei, T. Tran, K. Chu, M. T. Borzage, M. N. Braskie, M. G. Harrington, K. S. King. White matter hypointensities and hyperintensities have equivalent correlations with age and CSF β-amyloid in the nondemented elderly. Brain and Behavior. Vol. 9, pg. e01457, 2019, https://doi.org/10.1002/brb3.1457 [↩]
- Connectome Coordination Facility. Human Connectome Project. https://www.humanconnectome.org/ [↩]
- G. R. Jacobs, M. J. Coleman, K. E. Lewandowski, O. Pasternak, S. Cetin-Karayumak, R. I. Mesholam-Gately, J. Wojcik, L. Kennedy, E. Knyazhanskaya, B. Reid, S. Swago, M. G. Lyons, E. Rizzoni, O. John, H. Carrington, N. Kim, E. Kotler, S. Veale, A. Haidar, N. Prunier, M. Haaf, J. J. Levitt, J. Seitz-Holland, Y. Rathi, M. Kubicki, M. S. Keshavan, D. J. Holt, L. J. Seidman, D. Öngür, A. Breier, S. Bouix, M. E. Shenton. An introduction to the human connectome project for early psychosis. Schizophrenia Bulletin. Vol. 51, pg. 658–671, 2025 https://doi.org/10.1093/schbul/sbae123 [↩]
- H. Sun, R. Yan, L. Hua, Y. Xia, Y. Huang, X. Wang, Z. Yao, Q. Lu. Based on white matter microstructure to early identify bipolar disorder from patients with depressive episode. Journal of Affective Disorders. Vol. 350, pg. 428–434, 2024, https://doi.org/10.1016/j.jad.2024.01.147 [↩]
- L. B. Pearcy, A. P. Costa, M. A. Butters, R. Krafty, B. D. Boyd, L. Banihashemi, S. M. Szymkowicz, B. A. Landman, O. Ajilore, W. D. Taylor, C. Andreescu, H. T. Karim. Longitudinal changes in white matter hypointensities in recurrent late-life depression. The American Journal of Geriatric Psychiatry. Vol. 34, pg. 844–856, 2026, https://doi.org/10.1016/j.jagp.2026.02.004 [↩]
- Nature Index. Neuroimaging and clinical phenotypes of psychotic disorders. https://www.nature.com/nature-index/topics/l4/neuroimaging-and-clinical-phenotypes-of-psychotic-disorders [↩]
- N. A. Crossley, A. Mechelli, P. Fusar-Poli, M. R. Broome, P. Matthiasson, L. C. Johns, E. Bramon, L. Valmaggia, S. C. R. Williams, P. K. McGuire. Superior temporal lobe dysfunction and frontotemporal dysconnectivity in subjects at risk of psychosis and in first-episode psychosis. Human Brain Mapping. Vol. 30, pg. 4129–4137, 2009, https://doi.org/10.1002/hbm.20834 [↩]
- K. Wen, Y. Zhao, Q. Gong, Z. Zhu, Q. Li, N. Pan, S. Fu, J. Radua, E. Vieta, P. Kumar, G. J. Kemp, B. B. Biswal. Cortical thickness abnormalities in patients with first episode psychosis: a meta-analysis of psychoradiologic studies and replication in an independent sample. Psychoradiology. Vol. 1, pg. 185–198, 2021, https://doi.org/10.1093/psyrad/kkab015 [↩]
- B. Olabi, I. Ellison-Wright, A. M. McIntosh, S. J. Wood, E. Bullmore, S. M. Lawrie. Are there progressive brain changes in schizophrenia? A meta-analysis of structural magnetic resonance imaging studies. Biological Psychiatry. Vol. 70, pg. 88–96, 2011, https://doi.org/10.1016/j.biopsych.2011.01.032 [↩]
- M. J. Lan, B. T. Chhetry, M. A. Oquendo, M. E. Sublette, G. Sullivan, J. J. Mann, R. V. Parsey. Cortical thickness differences between bipolar depression and major depressive disorder. Bipolar Disorders. Vol. 16, pg. 378–388, 2014 https://doi.org/10.1111/bdi.12175 [↩]
- M. Corvaisier, A. Brangier, C. Annweiler, L. Spiesser-Robelet. Preventable or potentially inappropriate psychotropics and adverse health outcomes in older adults: systematic review and meta-analysis. The Journal of Nutrition, Health & Aging. Vol. 28, pg. 100187, 2024, https://doi.org/10.1016/j.jnha.2024.100187 [↩]