
Abstract
Bottom trawling is one of the most widely used but most criticized fishing methods due to its negative ecological impact. This study seeks to assess the ecological and economic impacts of bottom trawling and other fishing gear types by creating a multi-criteria scoring framework using quantitative fisheries production and subsidy data from FAO and OECD databases combined with qualitative policy and governance assessments. The results indicate bottom trawling has the most negative ecological effect and the lowest profitability, requiring high fuel subsidies. Linear regression analysis revealed a negative link between the level of national fossil fuel subsidy and profitability (β = –0.68, p < 0.001, R² = 0.58) indicating economic inefficiencies in heavily subsidized fisheries. This study found that bottom trawling is becoming less compatible with future-oriented fisheries and that a shift towards low-impact gear offers a path to align marine preservation with long-term sustainability.
Keywords: Fisheries governance, fuel subsidy, gear selectivity, ecological trade-offs, small-scale livelihoods, certification pathways.
Introduction
Marine fisheries play an important role in global food security, economics, and coastal livelihoods, with over a billion people depending on them for food and employment1. However, marine ecosystems face increased pressure from unsustainable fishing methods. One of the most ecologically damaging methods is bottom trawling, which results in habitat destruction and bycatch2,3.
Although industrial fisheries considered it as successful method, studies indicate that bottom trawling’s profitability depends on fuel subsidies that artificially reduce operational costs4. As fish stocks reduce, fleets have to travel further offshore, which leads to increase in fuel usage, while catch rates decline raising concerns about long-term sustainability.
Despite mounting proof of ecological and economic disadvantages, bottom trawling continues due to subsidies and regulatory gaps5. This inhibits sustainability progress and affect small-scale fishers employing less damaging methods1. While various gear innovations and certification programs are proposed, application is limited due to financial restrictions, technical challenges, and inadequate institutional capacity.
This paper considers sustainability through an ecological and economic evaluation of bottom trawling and other gear types. This research utilizes a scoring framework to capture their interconnections. It offers evidence-based recommendations for reforms and technological solutions and highlight how ecological protection and economic flexibility can be achieved.
Limitations of Global Datasets and Regional Variability
Global datasets offer insight into ecological and economic shifts but have limitations. Data sources differ resulting in ecological indicators being incomparable as fisheries operate under different environmental and regulatory circumstances and economic indicators may be affected by national policies.
Research Gap and Problem Statement
Despite research into ecological and economic aspects of bottom trawling, a gap remains in combining these into a framework that allows comparison with other gear types. Existing studies discuss ecological effects, fuel dependency, or governance issues separately resulting in limited insight into how environmental and economic elements shape long-term sustainability. A scoring framework addresses this by assessing bottom trawling and its alternatives.
Limitations Related to Cross-Country Governance Differences
Although this study uses global datasets to consider equipment’s ecological and economic performance, governance frameworks vary regionally. Differences in regulatory execution, subsidy structures, monitoring systems and institutional capacity impact equipment choice and the adoption of other methods. These differences limit the applicability of the results, suggesting that transition must be designed to meet local political, economic and organizational realities.
Literature Review
Global sustainability discussions consider the significance of gear type in determining ecological and economic performance. Bottom trawling, despite accounting for about 30% of global marine fish landings, is criticized for its disproportionate environmental impact3,6.
Sustainable fisheries feature on theoretical agendas with the factor market distortion theory, which considers how policy involvement modifies production costs and leads to unsustainable resource distribution. Moreover, lower input price, such as subsidies, promote enviornmentally unfriendly practices by sustaining fuel-intensive production even when the catch rates are low7.
Another applicable framework is the power imbalance theory, which stresses that uneven power between industrial fleets and small-scale fishers affects sustainability. Many large industrial fisheries influence policy regulations, resulting in governance structures that disadvantage small-scale fishers using less damaging equipment8.
A third theoretical pillar originates from safety and sustainability literature, links vessel characteristics and operational performance to safety and sustainability concerns. H. Kim and coworkers highlight that vessel design, operational performance and equipment type influence environmental effects and professional safety equipment, suggesting sustainability cannot be evaluated exclusively through environmental or economic criteria9. This strengthens the need for assessments that evaluate ecological, economic and human safety dimensions.
These theoretical frameworks provide the foundation for this study by explaining the economic drivers of trawling, governance influences, and the multidimensional nature of equipment selection.
Environmental Impact of Bottom Trawling
Bottom trawling is one the most environmentally degrading fishing practice. It involves dragging nets along the seafloor resulting damages to benthic habitat and high bycatch rates which destroys habitat important to marine biodiversity6.
Furthermore, bycatch frequently consists of juvenile fish, endangered species, and non-target organisms creating disequilibrium within ecosystems10. Slow biological recovery rates add to the problem. For deep crustacean fisheries, trawling is productive at the expense of elasmobranchs because it causes high mortality11. Similarly, coral bycatch and habitat degradation remain a constant risk on the Mediterranean shelf, particularly in poorly regulated areas12.
Bottom trawling also has a significant climate footprint13 with estimates of 1.46 gigatons of CO₂ equivalent emissions annually due to high fuel consumption and the release of carbon stored in seabed sediments14.
Energy Use and Fuel Inefficiency
Bottom trawling is an equipment-intensive activity and inefficient means of food production, with an energy return on investment much lower than agriculture or aquaculture15. As fleets venture further offshore due to decreasing stocks, fuel costs escalate further shrinking profitability which is obscured by subsidies leading to misconceptions of sustainable economics4.
World Bank statistics show that one-third of the world’s fisheries suffer economically due to fuel-intensive activities such as trawling. As pressure on the climate and development increases, bottom trawling remains incompatible with carbon emission reduction efforts and food system sustainability improvements16.
Subsidies, Governance, and Global Inequities
Fuel prices influence ongoing use of bottom trawling. In countries with industrial fleets, state subsidies reduce fuel costs and offset falling catch rates. For example, China provided US$1.6 billion in fuel subsidies to its marine fishing sector in 2018, while the European Union allocated EUR 136 million in 20194. Political stance regarding subsidies has developed a self-reinforcing mechanism whereby non-sustainable fishing methods are rewarded but low-impact gear types remain under-subsidized and underutilized17. According to OECD these subsidies hamper the competitiveness of small-scale fishers and result in overfishing which has an increasing ecological impact18.
International regulatory systems cannot deal with these issues, allowing distant-water fishing fleets take advantage of unregulated areas19, and impact the livelihoods of local fishers20.
Gear Innovation and Transition Pathways
Scientists investigating alternative gear types found traps, pots, midwater gear and longlines cause minimum disturbance on the sea floor, and low bycatch rates and are more fuel efficient and compatible with certification systems21.However, certification remains concentrated in high-income regions due to cost and institutional barriers22.
Small-Scale Fisheries and Socioeconomic Trade-offs
While much focus in sustainability discourse remains on environmental and economic indicators, the social dimension is important. Bottom trawling often displaces small-scale fishers who rely on nearshore ecosystems and provide equitable employment per unit of catch but remain vulnerable to competition from subsidized trawl fleets1. The loss of access to fishing grounds, declining stock availability, and fluctuating market prices contribute to erosion of small-scale fishery viability.
Gaps in Literature and Study Contribution
Although the environmental impacts of bottom trawling are well-documented, few studies integrate ecological metrics with economic indicators into a unified gear-comparison framework. This study addresses this by applying a scoring framework to assess gear types based on bycatch, emissions, profitability, and fuel use utilizing global data and policy literature to support a transition toward selective, low-impact fishing systems.
Methods and Materials
Hypotheses
H1: Gear types with lower ecological impact exhibit higher sustainability compared to bottom trawling when calculated across standardized ecological indicators.
H2: Bottom trawling may show higher use of fuel subsidies and lower economic contribution than other gear types reflecting the financial disparities elaborated in the factor market distortion theory.
H3: Fisheries dependent on selective and low-impact gear types align more closely with evolving sustainability regulations and governance frameworks.
Methodology Rationale
An assorted methods scoring methodology allows comparison that quantitative indicators alone cannot capture. Ecological effects are recognized through quantitative datasets but require qualitative explanation due to regional variation and inconsistent reporting. Similarly, economic indicators rely on data sources differing in format and coverage, while governance variables are qualitative and must be coded for comparison.
The scoring framework integrates ecological, economic, and governance indicators into a unified structure, consistent with multi-criteria sustainability assessments that combine quantitative and qualitative measures to address data gaps. Thus combining quantitative and qualitative indicators provides better consideration of fishing practices, particularly in global analyses with data gaps.
By adapting recognized approaches, ecological and economic contrasts become systematic and replicable while incorporating theoretical insights into real-world fisheries challenges.
Research Design
The mixed-methods design discusses the ecological and economic trade-offs of bottom trawling and its alternatives. Bycatch, carbon emissions, gear performance, fuel subsidies, and profitability were gathered as quantitative data based on institutional data and peer-reviewed literature. Qualitative sources provided information on regulatory frameworks, policy developments, and technological innovations. The mixed-method approach allowed comparison and triangulation.
Normalization Procedure
To compare heterogeneous data and measurement scales, a standardized normalization strategy was applied. Continuous variables were re-scaled using minimum to maximum normalization. Ordinal and categorical variables extracted from qualitative assessments were converted into numerical values using a predefined scoring rubric. When datasets differed by area or time period, values were rounded up over comparable time windows to minimize temporal bias and ensure indicators of differing units and magnitudes could be combined.
Pre-Processing Techniques
Raw ecological and economic data was pre-processed. Identical records were ignored, and variables were separated for missing values. Where minor data gaps were detected, linear interpolation was used for continuous indicators while qualitative indicators were cross validated using peer-reviewed sources. Outliers were studied using interquartile range methods and used only when supported by independent datasets. Economic indicators were adjusted for inflation and converted into constant price units to ensure comparability over years. Ecological indicators were considered by results (for example, per vessel day) to avoid bias being introduced by fishing fleet scale differences.
Data Sources
A range of secondary data sources was used, selected based on credibility, availability, and global coverage.
| Qualitative Description | Numeric Value | Criteria Used in Analysis |
|---|---|---|
| Very low effect | 1 | Least ecological disruption, minor bycatch, very low carbon potency, strong economic stability or unexpectedly high compliance with governance standards. Results in being consistently reported as minor across sources. |
| Low effect | 2 | Represents little ecological disruption, low bycatch and low fuel consumption. Economic pointers show steady production with little exposure. Governance indicators show normally strong compliance with average variability. |
| Moderate effect | 3 | Shows blend of ecological or economic results such as moderate habitat contact, moderate bycatch variability or restricted dependency on subsidies. Governance laws may be not consistent across regions. |
| High effect | 4 | Relates to major ecological destruction, for example, high bycatch and substantial habitat disruption, clear economic vulnerabilities, for example, decreasing catch rate, or strong reliance on subsidy structures. Governance adherence is often weak. |
| Very high effect | 5 | Represents intense ecological harm, for example, large sea floor damage, intensively high bycatch, high carbon emissions, strong reliance on subsidy for economic survival or systematic non-compliance with governance framework. Broadly identified as unviable. |
Quantitative Data Sources
This paper was guided by secondary quantitative data sources to maintain viability. Data extracted from the FAO, FishStatJ6 included overall catch volumes, gear use, and CO2 emissions. WB Fisheries Economics Reports provided economic indicators23,4,16.
The OECD Review of Fisheries provided subsidy-related information and its role in market distortion and ecological sustainability18. The peer-reviewed literature provided empirical norms on the outcome of gear performance, transition cost, and environmental trade-offs3,24.
Qualitative Data Sources
Qualitative sources were used for policy, governance, and contextual information. Field-based evidence on bycatch, habitat damage, and enforcement gaps was drawn from intergovernmental and peer-reviewed sources, including FAO reports and academic assessments3,6. Subsidy-related policy distortions were informed by D. J. Skerritt and U. R. Sumaila4.Fisheries certification and governance literature defined how institutional processes such as MSC programs affect gear adoption and regulatory compliance21. NOAA and MSC manuals provided details of gear development in terms of technical practicality and application6.
Data Validation and Triangulation
Cross-referencing of sources ensured integrity and reliability. In case of overlapping or conflicting values for same variable, priority was given to the most recent. Triangulation confirmed accuracy, filled gaps in missing data, and corrected inconsistencies.
Such mixed-source methodology allowed a multidimensional interpretation of sustainable bottom trawling issues. It also upheld that the paper is evidence-based numerically and qualitatively, confirming robustness.
Scoring Matrix and Analytical Framework
The matrix utilized a multi-criteria scoring method structured around three sustainability pillars: ecological, economic, and governance performance. While each indicator within a pillar was weighted equally, the pillars themselves were assigned differentiated weights to reflect sustainability theory. Scores were standardized on a 1–5-point scale to enable comparison.
To maintain reliability of sources, data was gathered from internationally recognized institutional reports and peer-reviewed literature. Inclusion criteria was: (1) published in the last 15 years, unless serving as historical baselines, (2) in line with transparent methodology and (3) relevant to the gear type and metric applied. NGO reports and intergovernmental reports were only included when supported by independent reports or government statistics.
Weight Justification and Sensitivity Analysis
Weight Justification
The weighing system intended to align with multi-criteria sustainability frameworks used in fisheries assessments. The reference weights were informed by methodologies used in FAO sustainability indicators, MSC principles and Sea Food Watch assessments which rank ecological reliability as the foundational aspect of sustainability while acknowledging economic viability and governance effectiveness.
Ecological indicators were allocated a weight of 0.40, economic indicators 0.35 and governance indicators 0.25 following the view that ecological aspects represent unchanging system constraints while economic and governance frame sustainable practices’ feasibility.
Hierarchical weighting structures are used in multi-criteria fisheries assessments where environmental influences are treated as primary constraints and socio-economic results as allowing or preventing conditions. The weighting therefore represents theoretical reasoning from sustainability science and a practical approach using fisheries assessment standards.
Sensitivity Analysis
To check the scoring framework’s strength, a sensitivity analysis used three weighting situations:
- Situation A (Ecology Heavy): Ecological = 0.50, Economic = 0.30, Governance = 0.20
- Situation B (Balanced): Ecological = 0.33, Economic = 0.33, Governance = 0.34
- Situation C (Economy Heavy): Ecological = 0.30, Economic = 0.45, Governance = 0.25
Each gear type was re-scored under each situation with results then matched with the baseline model to evaluate stability and ranking reliability.
Across all situations, bottom trawling ranked as lowest while traps and long lines ranked highest. Fishnets showed moderate variability but did not outperform traps or longlines, indicating that gear performance rankings are resistant to rational weighting changes, confirming the scoring framework’s stability.
Construction of Figures and Visualizations
To illustrate ecological and economic trade-off findings among gear types, the study formulated six original figures informed by synthesized data from previously mentioned sources and built with transparent replicable procedure.
The heat map in figure 1 was created using datasets from FAO global fisheries assessments which estimated seabed disturbance in proportion to total ocean area6,23. Darker shades represent higher trawling intensity following the approach of T. Mazor and coworkers25.
In figure 2 bycatch rates were compiled from FAO assessments and peer-reviewed studies on gear selectivity and discard patterns and standardized as the percentage of total catch composed of non-target species6,3. Data was organized by gear type and visualized in vertical bar charts.
Figure 3 was constructed by recalculating gear sustainability scores under three alternative weighting scenarios describe in Section 3.5.2 and graphically comparing ranking positions to assess the robustness of the scoring framework.
Ecological and economic performance scores for six gear types are presented in Tables 5-14. Scores were derived using benchmarks from the FishStatJ6,16. Indicators included habitat destruction, bycatch ratio, carbon footprint, revenue per tonnage, operational cost, and profit margin. Each gear type was assigned a score from 1 (favorable) to 5 (unfavorable).
Figure 4 represents revenue by catch method and Figure 5 represents tonnes of fish caught by method ( Current vs Sustainable Practices) and were constructed using FAO FishStatJ6. Price assumptions were based on published findings24.
In figure 6, adoption and certification rates of sustainable gear were compiled from FAO assessments, MSC database, and peer-reviewed literature21,26. Data was represented in a pie chart.
Evaluation Framework and Analytical Methodology
A multi-criteria evaluation model assigned ecological and economic performance scores to each gear type. The scoring matrix included three ecological metrics (habitat damage, bycatch rate, and CO₂ emissions per kilo of catch) and three economic metrics (profit margin, operational cost, and revenue per ton) selected for relevance in global sustainability assessments and availability.
Scores were derived from peer-reviewed literature and official datasets, with values taken directly or averaged where appropriate to summarize gear performance and identify opportunities. Gear types with low profitability but minimal ecological harm could be targeted for investment or policy support. The matrix therefore functioned as an analytical tool to inform sustainable fisheries reform and subsidy realignment.
Ethical Considerations
The study did not include primary data collection from humans or private entities. No ethical approval was required as all information was obtained through the publicly available and academically plausible sources. Efforts were made to establish transparency, accuracy, and accountability throughout the research. All data and assertions are referenced and precaution were taken to avoid misrepresentation of any institutional or scientific discoveries.
The study complies with the principles of academic integrity. There was no manipulation of the data and the selective presentation of the findings. Estimates were explicitly recorded and relied on logical, open assumptions and were founded on literature.
Methodological Limitations
The study relies solely on the secondary data; reliability is dependent on the quality of primary sources of information. The uneven reporting standards across countries and organizations led to normalization or estimation of measures, which can lead to some deviations. The data time frame (2017-2023), might not be able to reflect the long-term trends or new policies and practices developments. Nevertheless, the mixed methodology, source triangulation, and the clear documentation offer a solid argument on the consistency of findings and policy advice.
Results
Bottom trawl fisheries scored poorest across ecological and economic metrics with high bycatch rates, severe habitat disturbance, and the largest carbon footprint per kilogram of catch. Economic performance showed low profit margins once high fuel consumption and maintenance costs were considered, often masked by state subsidies. In contrast, passive gears achieved low ecological scores and competitive or superior economic returns, particularly when certification or market premiums were applied. Countries with lower fuel subsidies showed healthier profit margins, underscoring the link between subsidy reform and ecological and economic resilience.
Comparative Sustainability Performance of Gear Types
Table 2 demonstrates gear type sustainability scores. A pattern appears with bottom trawling displaying the lowest performance followed by gillnets while long lines and traps score highest. The difference between bottom trawling and alternative gear types is significant rather than borderline.
The spread of scores indicates that bottom trawling has the highest variability reflecting inconsistent performance depending on fuel price, stock health and management conditions whereas the relatively low variability of traps and long lines shows more consistent results.
| Gear Type | Mean Ecological Impact | Std. Dev. | Variance | Mean Profitability Index | Std. Dev. Profitability |
|---|---|---|---|---|---|
| Bottom trawl | 4.63 | 0.41 | 0.17 | 2.11 | 0.52 |
| Gillnet | 3.21 | 0.48 | 0.23 | 3.04 | 0.44 |
| Long line | 2.18 | 0.39 | 0.15 | 3.42 | 0.37 |
| Traps | 1.74 | 0.33 | 0.11 | 3.68 | 0.29 |
Global Distribution of Bottom Trawl Effort
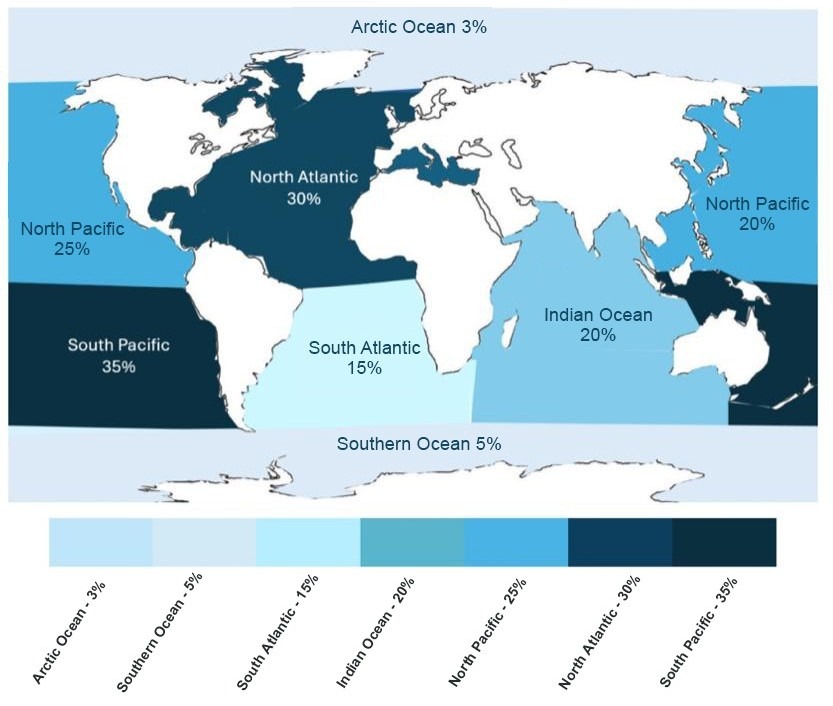
Figure 1 shows the distribution of bottom trawl activity using a heat map, where darker shading represents higher trawling intensity concentrated along continental shelves such as Southeast Asia, the North Atlantic and West Africa. The visual captures trawl effort as swept-area ratios and estimated haul frequencies to provide an overview of seabed disturbance. Relatively under-exploited regions remain along parts of the western African coast and polar zones.
Bycatch Rate by Gear Type
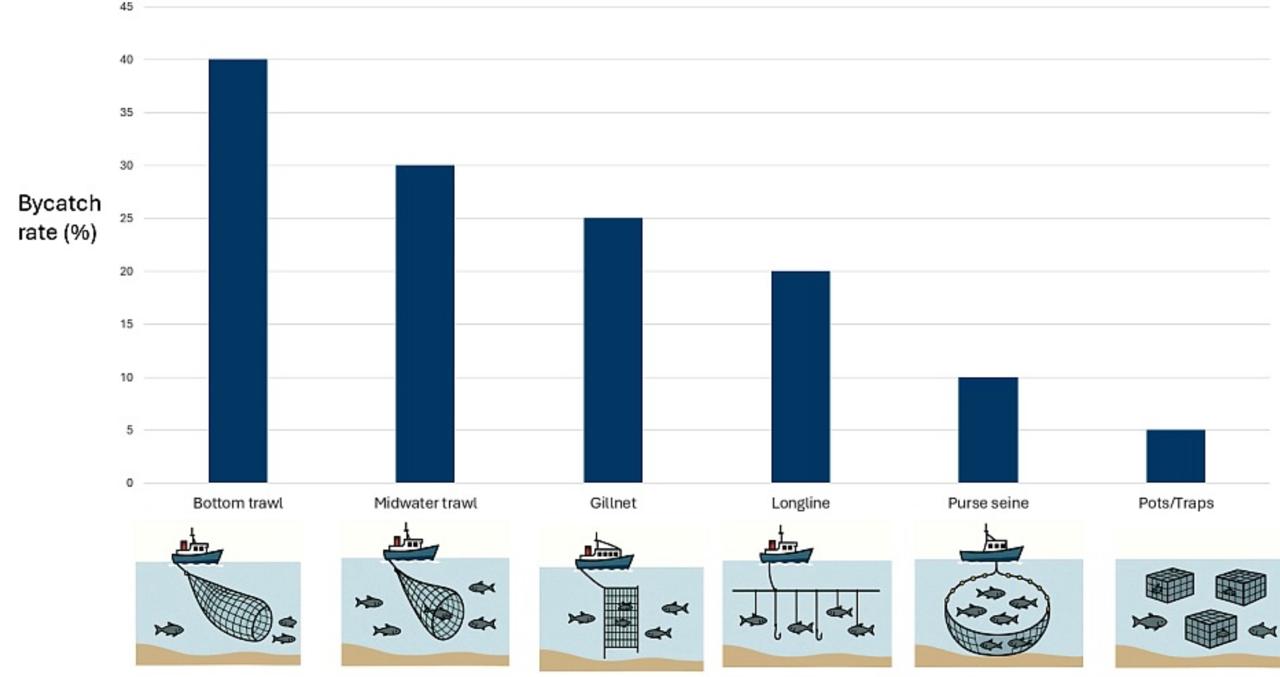
Figure 2 compares bycatch rates across six gears. The data indicates that bottom trawls consistently exhibit the highest bycatch rate, averaging above 40%, while midwater trawls and gillnets also show elevated rates, ranging from 25% to 35%. In contrast, longlines and purse seines show moderate rates of 10–20%. Pots and traps are the most selective gear, with bycatch rates below 10%. Results confirm gear design plays a significant role in incidental capture levels.
Ecological Impact Patterns across Gear Types
One-way ANOVA showed statistically significant differences among gear types (F (3, 20) = 24.73, p < 0.001), and Tukey contrasts confirmed that bottom trawling differs considerably from gillnets, long lines and traps (p < 0.01), indicating its ecological disadvantages are structurally systematic.
Robustness of Sustainability Rankings across Weighting Scenarios
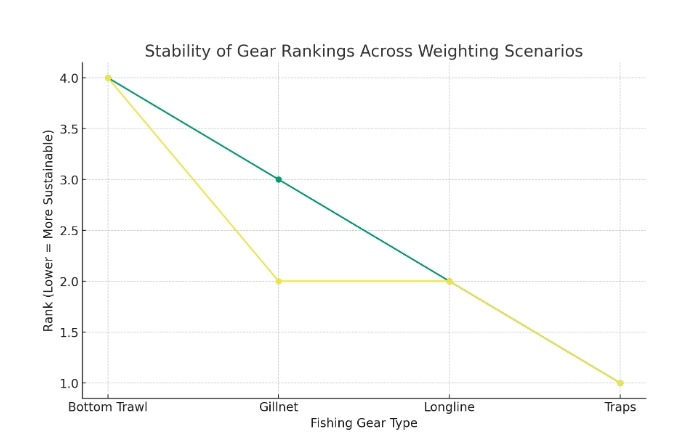
Figure 3 shows an investigation of ranking stability among weighting situations. Bottom trawling consistently ranks lowest, while traps and long lines remain the highest performers under all situations.
Minor rank shifts were observed between fishnets and long lines but were not significant statistically (p > 0.10). This illustrates the scoring framework is resilient and the sustainability hierarchy is not a result of subjective weighting selections.
archy is not a result of subjective weighting selections.
Validation with External Sustainability Benchmarks
Scoring to MSC certification and Seafood Watch ratings with a strong positive correlation observed between sustainability scores and external certification representing convergent validity. Gear types ranking high were consistent with MSC certified fisheries and were more regularly related to favorable Seafood Watch categories. Bottom trawling was strongly associated with lower sustainability. Correlation analysis between scores and Seafood Watch rankings established a statistically significant association (Spearman’s ρ = 0.71, p < 0.01), supporting the external validity of the framework.
Economic Performance, Fuel Subsidies and Profit Margins
This study utilizes national level fossil fuel subsidies – government interventions that reduce the market price of petroleum products in multiple sectors. Within fisheries, subsidies have an indirect but substantial effect by minimizing fuel prices especially for fuel-intensive gear types. Reduced fuel prices also minimize the cost of effort meaning vessels run longer trips, travel further offshore and fish at more depth than would be economically sustainable without subsidies. This means fishing practices that would otherwise be non-profitable contribute to overloading, higher emissions and increased ecological pressure without reflecting true market prices4. The subsidy effects discussed should be regarded as economy wide energy price adjustments that indirectly shape fishing behavior.
| Source of Variation | Sum of Squares | Degree of Freedom | Mean Square | F Value | P Value |
|---|---|---|---|---|---|
| Between groups | 18.42 | 3 | 6.14 | 24.73 | <0.001 |
| Within groups | 4.97 | 20 | 0.25 | ||
| Total | 23.39 | 23 |
| Predictor | Unstandardized β | Standard Error | T Value | P Value |
|---|---|---|---|---|
| Constant | 4.12 | 0.31 | 13.29 | <0.001 |
| Subsidy intensity | -0.68 | 0.14 | -4.86 | <0.001 |
The regression analysis shows a negative link between fossil fuel subsidy intensity and profitability (β = –0.68, p < 0.001) indicating higher subsidy requirement is linked with lower profitability with approximately 58% of the variance in profitability (R² = 0.58).
Comparative Scoring of Ecological and Economic Impacts
Tables 5-14 compares six gear types in ecological and economical terms. All were ranked on a 1-5 scale where 1 represents very low, 5 represents very high using mixed-methods involving peer-reviewed data, expert opinion, and normalized quantitative indicators.
Bottom trawling received the highest impact scores due to increased emissions, habitat disturbance, and bycatch levels. Economically, it scored moderately on revenue but poorly on operational cost-efficiency. In contrast, pots and traps ranked favorably on nearly all indicators, especially in terms of environmental impact and operating cost. Midwater trawls and gillnets showed intermediate scores across most criteria, while longlines performed well ecologically but had variable economic scores.
| Metric | Quantitative Value | Impact Level | Explanation | Score (out of 5) | Source (APA) |
|---|---|---|---|---|---|
| Revenue per ton | €700–€1,000 | Low | High-volume but low value catch limits revenue potential | 2 | 3,16 |
| Operating cost/ton | $350–$600 | High | High costs due to fuel, gear damage, and maintenance | 4 | 18,4 |
| Profitability margin | — | Low | Narrow margins due to high input costs and declining stock quality | 2 | 16,4 |
| Metric | Quantitative Value | Impact Level | Explanation | Score (out of 5) | Source (APA) |
|---|---|---|---|---|---|
| Habitat damage | — | High | Heavy gear dragged across seabed destroys benthic habitats and coral systems | 5 | 3 |
| Bycatch rate | 40–60% | High | Captures non-target species, contributes to unsustainable harvesting | 5 | 27 |
| CO2 emissions | ~4.65 kg CO2 per kg of fish | High | High resistance on seabed increases fuel use and emissions | 5 | 4 |
| Impact Category | Quantitative Data | Impact Level | Explanation | Score (out of 5) | Source |
|---|---|---|---|---|---|
| Bycatch rate | ~20% bycatch (mainly pelagic species) | Medium | Less than bottom trawls but still affects non-target species | 3 | 3 |
| Habitat disruption | Minimal contact with seabed | Low | Midwater nets operate above benthic zone | 1 | 6. |
| Carbon emissions | ~1.3 L/km fuel use per trawl vessel | Medium | Better efficiency than bottom trawling but still carbon-relevant | 3 | 4 |
| Impact Category | Quantitative Data | Impact Level | Explanation | Score (out of 5) | Source |
|---|---|---|---|---|---|
| Operational cost | ~$450–$600 per vessel per day | Medium | Fuel-efficient, but nets still require high-tech gear | 3 | 16,6. |
| Revenue generation | ~$1,800–$2,300 per fishing trip | High | Midwater trawlers target commercially high-value species | 4 | 3,4 |
| Market access | High global demand for clean midwater catch | High | Accepted in EU and developed markets due to lower bycatch | 4 | 18 |
| Impact Category | Quantitative Data | Impact Level | Explanation | Score (out of 5) | Source |
|---|---|---|---|---|---|
| Bycatch rate | Up to 40% bycatch (turtles, seabirds, sharks) | High | Hooks unintentionally catch endangered non-target species | 4 | 3 |
| Habitat disruption | No contact with seabed | Low | Gear is suspended in water column, posing no direct habitat disruption | 1 | 3 |
| Carbon emissions | ~0.9–1.1 L/km fuel use per longline vessel | Low | Lower emissions due to slow trawling speeds and simpler operations | 2 | 4 |
| Impact Category | Quantitative Data | Impact Level | Explanation | Score (out of 5) | Source |
|---|---|---|---|---|---|
| Operational cost | ~$350–$500 per vessel per day | Medium | Labor-intensive setup but lower fuel usage offsets cost | 3 | 16,6. |
| Revenue generation | ~$1,500–$2,100 per trip | High | Tuna and swordfish targeted; highly valuable exports | 4 | 3,18 |
| Market access | Accepted in most export markets | High | Especially when using circle hooks and turtle deterrents | 4 | 23 |
| Impact Category | Quantitative Data | Impact Level | Explanation | Score (out of 5) | Source |
|---|---|---|---|---|---|
| Bycatch rate | 20–30% bycatch (seabirds, turtles, dolphins) | High | Non-selective gear often entangles non-target marine species | 4 | 3 |
| Habitat disruption | Minimal, nets float or are lightly anchored | Low | Limited physical contact with seabed, reducing direct habitat damage | 1 | 6 |
| Carbon emissions | ~1.0–1.3 L/km fuel use per vessel | Low | Static gear with low engine usage, especially in nearshore areas | 2 | 4 |
| Impact Category | Quantitative Data | Impact Level | Explanation | Score (out of 5) | Source |
|---|---|---|---|---|---|
| Operational cost | ~$200–$300 per day per vessel | Low | Gear is cheap and easy to deploy with minimal crew | 2 | 6 |
| Revenue generation | ~$1,000–$1,500 per trip | Medium | Catch includes commercially viable species like cod, mackerel, mullet | 3 | 18 |
| Market access | Moderate, often restricted if bycatch is high | Medium | Market demand drops if gear is not compliant with sustainability regulations | 3 | 6 |
| Impact Category | Quantitative Data | Impact Level | Explanation | Score (out of 5) | Source |
|---|---|---|---|---|---|
| Bycatch rate | <10% bycatch; mostly species-specific | Low | Selective design and baited traps reduce unintended species capture | 1 | 6 |
| Habitat disruption | Minimal — limited seabed contact | Low | Traps are stationary and avoid trawling or dragging that harms habitats | 1 | 3 |
| Carbon emissions | ~0.8–1.1 L/km fuel use | Low | Used in coastal zones, with low engine dependency | 1 | 4 |
| Impact Category | Quantitative Data | Impact Level | Explanation | Score (out of 5) | Source |
|---|---|---|---|---|---|
| Operational cost | $150–$250 per day per vessel | Low | Inexpensive gear, low crew needs, minimal maintenance | 1 | 18,6 |
| Revenue generation | $1,500–$2,000 per trip | High | High-value catch (lobster, crab) sold in premium markets | 4 | 18 |
| Market access | High | High | Aligned with sustainable certifications (MSC) referred by eco-markets | 5 | 6 |
Projected Revenue under Current and Sustainable Practices
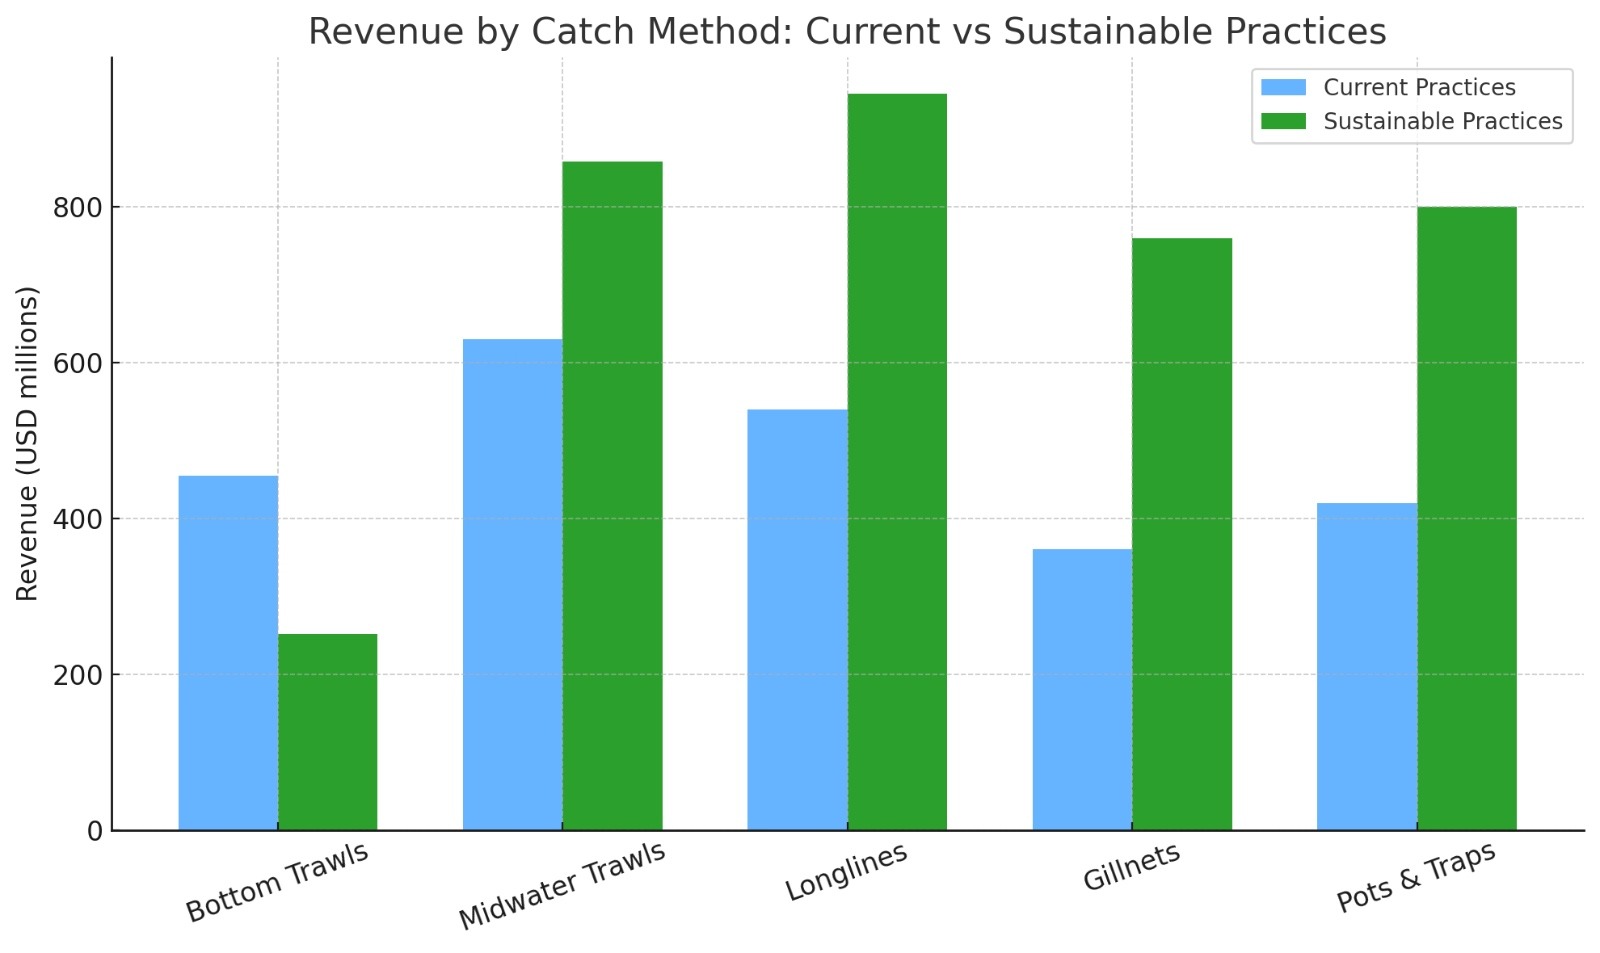
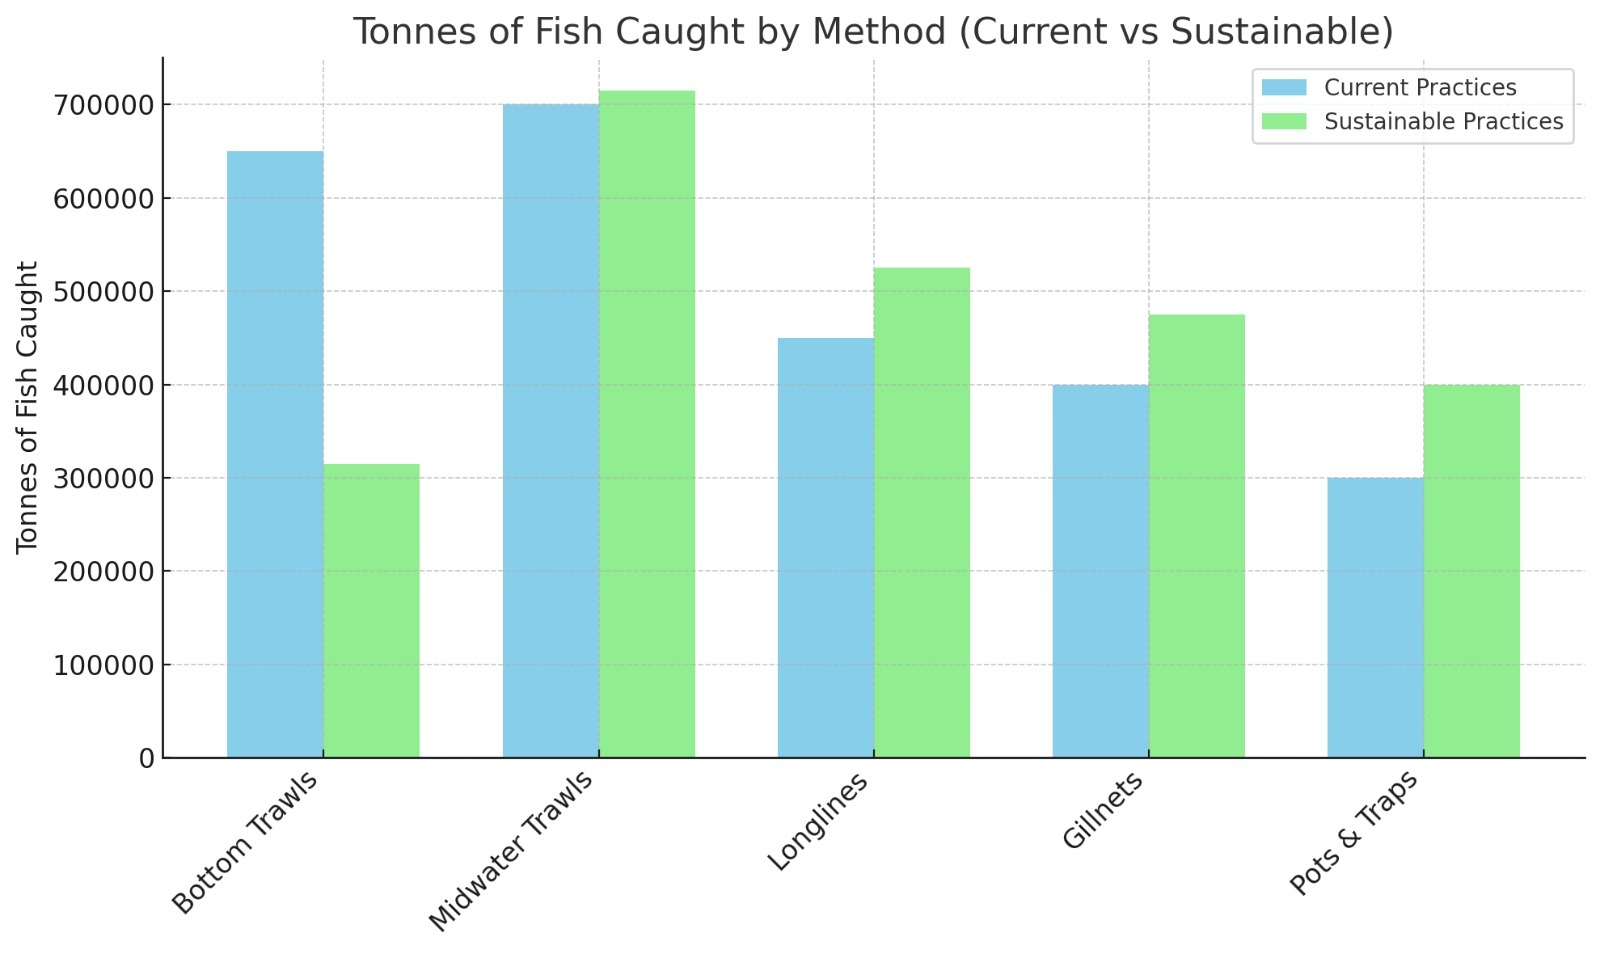
Figure 4 compares projected revenue under current and sustainable practices, while Figure 5 presents projected catch volumes under current and sustainable practices. Revenue projections were modelled using FAO catch data6 and modified by incorporating sustainability-linked price premiums for certified products.
| Catch Method | Revenue (USD millions) | Tons of Fish Caught | Revenue per Ton (USD/ton) | % of Total Catch |
|---|---|---|---|---|
| Bottom trawls | $455 | 650,000 | $700 | 26.0% |
| Midwater trawls | $630 | 700,000 | $900 | 28.0% |
| Longlines | $540 | 450,000 | $1,200 | 18.0% |
| Gillnets | $360 | 400,000 | $900 | 16.0% |
| Pots & Traps | $420 | 300,000 | $1,400 | 12.0% |
| TOTAL | $2,405 | 2,500,000 | — | 100% |
| Catch Method | Estimated Catch (Tonnes) | Share of Total Catch (%) | Revenue per Ton (USD) | Estimated Revenue (USD millions) | Change in Catch Volume (%) |
|---|---|---|---|---|---|
| Bottom trawls | 315,000 | 12.6% | 800 | 252 | ↓30% |
| Midwater trawls | 715,000 | 28.6% | 1,200 | 858 | ↑10% |
| Longlines | 525,000 | 21.0% | 1,800 | 945 | ↑25% |
| Gillnets | 475,000 | 19.0% | 1,600 | 760 | ↑20% |
| Pots & Traps | 400,000 | 16.0% | 2,000 | 800 | ↑33.3% |
| Total | 2,500,000 | 100% | — | 3,615 | — |
| Gear Type | Total Adoption Rate (%) | Innovation Type (Dark Shade) | % of Total Adoption | Other Innovations (Light Shade) | % of Total Adoption |
|---|---|---|---|---|---|
| Bottom trawls | 12.6% | Turtle Excluder Devices | 5% | Other Modifications | 7.6% |
| Midwater trawls | 30.1% | Net Size/Depth Modifications | 10% | Other Modifications | 20.1% |
| Longlines | 16.8% | Circle Hooks | 6% | Other Innovations | 10.8% |
| Gillnets | 11.4% | Acoustic Deterrents | 4% | Other Innovations | 7.4% |
| Pots & Traps | 21.5% | Escape Gaps | 10% | Other Innovations | 11.5% |
| Other Gears | 7.6% | Gear-Specific Modifications | 3% | Other Innovations | 4.6% |
| Total | 100% | — | — | — | — |
As shown in Table 15, Bottom trawling dominates in terms of absolute revenue due to high catch volumes and global prevalence. However, Tables 16 and 17 indicate that when introducing sustainability factors, gear types like pots and modified trawls demonstrate greater resilience and revenue potential. The estimated revenue effects indicate that some low-impact gears can sustain or even increase profitability given that the pricing is based on sustainability. This means that a shift of gears does not always lead to an economic loss.
Validation against Existing Sustainability Standards
The external validity of the scoring framework is verified by comparing results with recognized sustainability certification and rating systems used to assess ecological sustainability, management efficiency and the effects of fishing practices on ecosystems.
Traps and long lines have the minimum ecological and operational risk and are consistent with MSC standards and the highest category in Seafood Watch assessments whereas bottom trawling has the lowest sustainability scores.
This indicates the scoring framework captures key sustainability dimensions’ observable in established global standards. However, the framework extends beyond certification systems by quantitatively integrating aspects of economic resilience and subsidy requirements.
Adoption of Gear Innovation and Certification
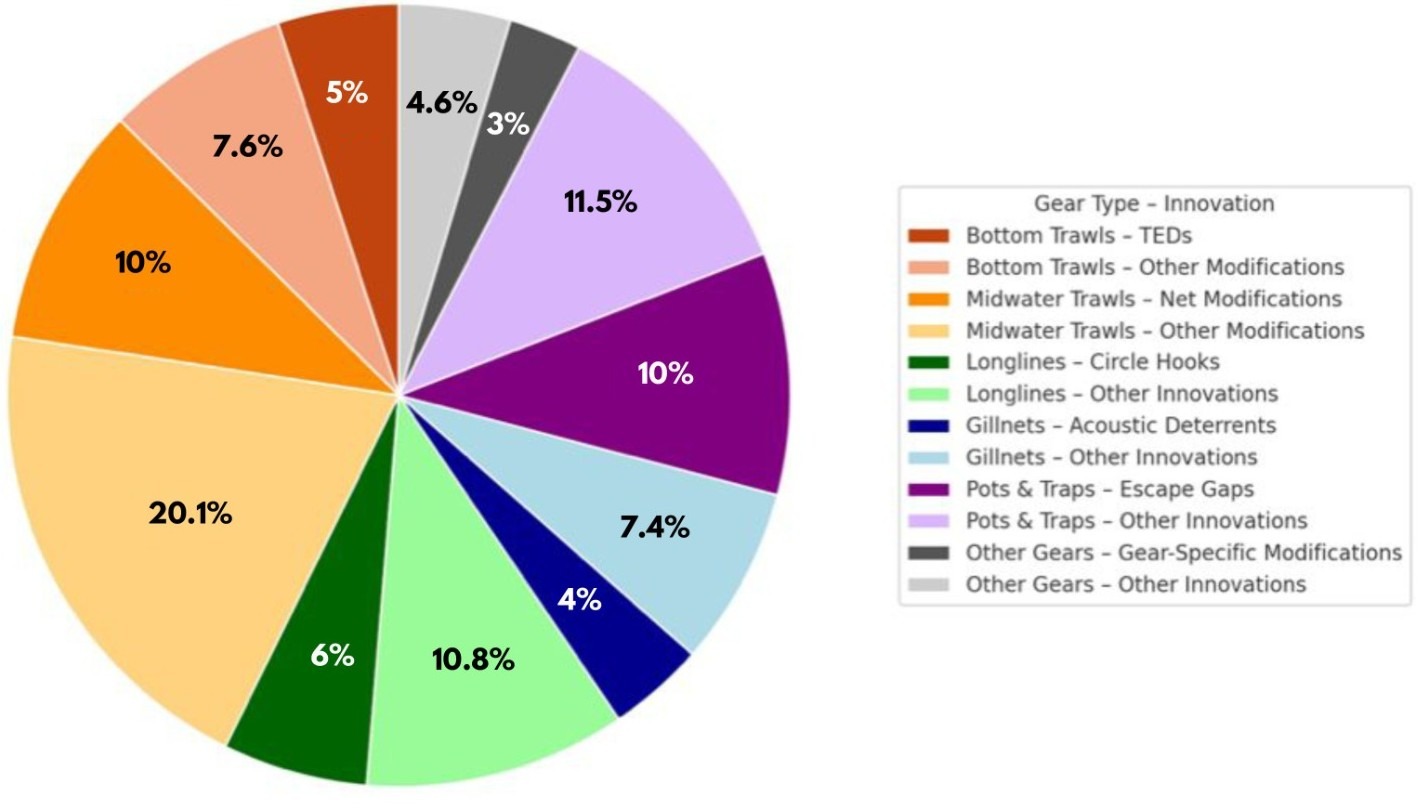
Figure 6 illustrates adoption rates of gear improvements. Pots and traps lead in certification uptake and gear innovation, followed by longlines and midwater trawls. Bottom trawls are the least represented in innovation and certification reflecting structural and institutional issues in scaling modifications.
Discussion
Interpretation of Findings
The study findings indicate that bottom trawling is one of the most ecologically and economically unstable practices. Its high ecological effect scores align with previous research confirming that bottom trawling causes habitat devastation, elevated bycatch, and carbon release from seabed disturbance, contributes to ecosystem decline25,11.
Empirical results further indicate that bottom trawling bycatch rates frequently exceed 40%, while gillnets show elevated but lower rates (20–30%) with threats to juveniles and vulnerable species10. This directly impacts species recovery cycles and undermines marine ecosystem productivity17.
In contrast, findings from Figure 4–5 show that passive gear types such as traps and pots consistently outperformed bottom trawls across ecological and economic dimensions. These gears demonstrated better selectivity, with some fisheries achieving discard rates under 10%, reflecting better alignment with ecosystem-based management28. The sustainability scores for traps and longlines suggest that their performance is robust across geographic and regulatory contexts. Fish nets occupy an intermediate position, aligning with literature related to ecological selectivity and bycatch risks27. These findings show that gear types characterized by lower ecological impact exhibit higher sustainability performance than bottom trawling when assessed through standardized ecological indicators and therefore confirm the study’s first hypothesis.
The findings confirm second hypothesis that bottom trawling may show higher use of fuel subsidies and lower economic contribution than other gear types. Economically, bottom trawling appears less efficient when complete operational costs are considered. While high-volume landings give the illusion of profitability, the cost of fuel and maintenance amid declining catch rates reveals a fragile financial model15.
The negative link between subsidy intensity and profitability demonstrates that the financial stability of trawl fisheries is fragile and policy dependent. Countries with high subsidy intensity tend to show lower per-unit profitability, suggesting structural inefficiencies masked by financial support. These results reflect factor market distortion theory that skewed fuel prices decrease operational risk and maintain fishing activity beyond ecological boundaries7. These findings are consistent with existing literature. The economic investigation indicates that profitability is reliant on fuel subsidies and distortive4.
Smil’s analysis of energy costs further notes that food systems relying on high fuel input—such as trawling—are unsustainable unless subsidized, aligning with findings that the sector survives through subsidies and political insulation rather than efficiency15. Wang and coworkers also show that fuel buyback and transition grants are more effective than blanket support29. These findings demonstrate that bottom trawling exhibits high subsidy dependence and structurally weak economic performance relative to non-distorted market conditions.
The findings confirm third hypothesis that fisheries dependent on selective and low-impact gear types align more closely with evolving sustainability regulations and governance frameworks. Figure 6 shows that passive gears lead in innovation and certification. Certification premiums and technological uptake further reinforce the competitive advantage of low-impact gears21.
These results are supported by existing literature that gear innovation and certification uptake is higher in small-scale fleets when supported by training and financial incentives30. The findings also resonate with power imbalance theory, which suggests that industrial fleets benefit from economies of scale, political influence, and integrated market access, reinforcing structural disparities in sustainability adoption8.
These findings are further supported by governance literature. Social and governance critiques are supported by the findings of Y. Yan and A. Graycar, who frame weak enforcement, corruption, and regulatory fragmentation as key enablers of unsustainable fishing31. This study validates these critiques with examples connecting such governance weaknesses to economic inefficiency and policy capture.
Together, these results indicate that fisheries dependent on low-impact gear types align more closely with evolving sustainability regulations and governance frameworks. The alignment between the results and external sustainability standards further supports the reliability of the framework. The combination of MSC certification and Seafood Watch ratings confirms that the scoring captures ecological principles present in international standards, while extending prior approaches by quantitatively incorporating economic vulnerability and subsidy dependence that are frequently omitted from certification-based calculations.
Main Insights and Policy Implications
The results suggest that bottom trawling is a structurally unjustifiable practice, damaging the environment while depending on policy-driven financial support, whereas selective and low-impact gear types maintain economic flexibility while reducing ecological harm. These findings support targeted policy reforms, including subsidy restructuring, investment in alternative gear technologies, and strengthened international governance mechanisms, with incentive-based transitions offering a more realistic pathway than immediate elimination.
Broader Implications for Sustainability and Policy
The findings have significant implications for governance, economic policy, and sustainability planning. They challenge the perceived trade-off between economic performance and ecological responsibility by demonstrating that profitability can align with sustainability when appropriate gear choices and regulatory incentives are present. Fuel subsidies remain a central concern, as prior research shows that such supports distort market behavior and reinforce unsustainable fishing practices4. Reforming subsidy structures, investing in alternative gear technologies, and strengthening governance mechanisms are therefore critical to facilitating gradual and realistic gear transitions across diverse regulatory contexts.
The study also underscores the need for gear-specific regulation and improved certification access. Certification schemes offer tools to incentivize responsible fishing; however, financial and institutional barriers prevent small-scale fishers from qualifying21. These findings further reflect governance weaknesses identified in the literature, including enforcement gaps and regulatory fragmentation31.
Study Limitations
While this study discusses gear sustainability, several limitations should be acknowledged. Firstly, the scoring framework relies partially on qualitative judgment when converting ecological and economic assessments into numeric criteria. While standardized rubrics reduce bias, some subjectivity remains and may affect precision, even if overall ranking patterns stay consistent.
Secondly, the scoring framework used a single rating method which limits reliability testing. Future research should allocate score independently and calculate inter-rater reliability statistics and include expert panels to strengthen validity.
Additionally, the study omits primary perspectives from fishers, government officials, and NGOs, which could enrich the analysis with lived experience. Future research should combine large scale datasets with local field observations and stakeholder interviews. Lastly, aquaculture systems were not assessed, future research could explore how it may complement gear reform and reduce pressure on wild stocks.
Conclusion
This study confirms that bottom trawling is ecologically damaging and economically unsustainable. The sustainable scenario modelled here – based on replacing high-impact gear with alternatives – demonstrated gains in profitability when sustainability premiums and lower fuel costs were considered. Under this scenario, revenues for low-impact gears matched or exceeded current trawl-based earnings, while achieving substantial reductions in bycatch, habitat damage, and carbon emissions. These findings show that sustainable fishing is achievable through gear transitions, targeted subsidy reform, and wider access to certification schemes and demonstrate that ecological and economic goals can converge when governance prioritizes efficiency, transparency, and equity.
The implications for fisheries policy are significant. Reforming subsidy structures, restricting destructive gear, supporting innovation, and protecting artisanal livelihoods are vital. Certification must become more accessible, and regional cooperation strengthened to close enforcement gaps. If governments and industry fail to act, fish stocks may collapse, putting millions of livelihoods at risk. As the world population grows, the pressure to feed people also increases, and if companies’ goals are economic gain alone then their continuing operations will not be sustainable.
Ultimately, the economics of fishing must be viewed through the lens of energy, labor, and long-term ecosystem health. When fuel input outweighs food value, the system is neither sustainable nor rational. Rebuilding that rationality will require courage, cooperation, and commitment.
| Domain | Indicator | Variable name | Measurement type | Data source | Operational definition |
|---|---|---|---|---|---|
| Ecology | Which level of habitat is disrupted due to gear type? | Habitat effect | Ordinal 1 to 5 | FAO, Peer reviewed | Rate of physical disruption to sea floor and benthic ecosystem due to gear operation |
| Ecology | Average bycatch rate of stray species | Bycatch rate | Continuous | FAO, academic studies | Percentage of total catch made up of non-target species |
| Ecology | Estimated carbon release intensity per unit catch | Carbon intensity | Continuous | OECD, Literature | Carbon footprint of fisheries |
| Ecology | Rate of endangered species | Species risk | Ordinal 1 to 5 | Peer reviewed | Frequency of interactions between safe and vulnerable marine species |
| Economic | Average fuel usage per fishing trip | Fuel usage | Continuous | OECD datasets | Liters of fuel used each fishing trip |
| Economic | How does fuel subsidy affect gear type? | Dependence on subsidy | Ordinal 1 to 5 | OECD | Rate of dependency on subsidized fuel to achieve economic viability |
| Economic | Average rate of profitability per unit effort | Profit | Continuous | OECD, FAO | Net profit rate per unit of fishing effort |
| Governance | Level of regulatory compliance | Compliance level | Ordinal 1 to 5 | Policy documents | Rate of dependency on national and international fisheries regulations |
| Governance | Which technology resulted in selective or bycatch reduction? | Selectivity tech | Binary 0 or 1 | Literature | Presence or absence of bycatch reduction devices |
| Governance | Strength of enforcement and monitoring | Governance strength | Ordinal 1 to 5 | FAO, OECD | Usefulness of inspection and enforcement system |
References
- V. S. Balakrishnan. The true cost of bottom trawling in Europe. The Lancet Planetary Health (2025). [↩] [↩] [↩]
- D. F. Willer, J. I. Brian, C. J. Derrick, M. Hicks, A. Pacay, A. H. McCarthy, S. Benbow, H. Brooks, C. Hazin, N. Mukherjee, C. J. McOwen. Destructive fishing—a ubiquitously used but vague term? Usage and impacts across academic research, media and policy. Fish and Fisheries 23, 1039–1054 (2022). [↩]
- R. Hilborn, R. Amoroso, J. Collie, J. G. Hiddink, M. J. Kaiser, T. Mazor, R. A. McConnaughey, A. M. Parma, C. R. Pitcher, M. Sciberras, P. Suuronen. Evaluating the sustainability and environmental impacts of trawling compared to other food production systems. ICES Journal of Marine Science 80, 1567–1579 (2023). [↩] [↩] [↩] [↩] [↩] [↩] [↩] [↩] [↩] [↩] [↩] [↩] [↩] [↩]
- D. J. Skerritt, U. R. Sumaila. Assessing the spatial burden of harmful fisheries subsidies: final report. (2021). [↩] [↩] [↩] [↩] [↩] [↩] [↩] [↩] [↩] [↩] [↩] [↩] [↩] [↩] [↩] [↩]
- A. H. McCarthy, D. Steadman, H. Richardson, J. Murphy, S. Benbow, J. I. Brian, H. Brooks, G. Costa-Domingo, C. Hazin, C. McOwen, J. Walker. Destructive fishing: an expert-driven definition and exploration of this quasi-concept. Conservation Letters 17, e13015 (2024). [↩]
- Food and Agriculture Organization of the United Nations (FAO). The state of world fisheries and aquaculture 2024. (2024). [↩] [↩] [↩] [↩] [↩] [↩] [↩] [↩] [↩] [↩] [↩] [↩] [↩] [↩] [↩] [↩] [↩] [↩] [↩]
- S. Yang, J. Wu. The sustainability of the fishery industry and environmental development: a study on factor market distortions. International Journal of Environmental Research and Public Health 20, 3017 (2023). [↩] [↩]
- S. Rivera-Valle, M. E. Silva. The effects of power imbalance on supply chain sustainability adoption: evidence from the artisanal fishing industry. The International Journal of Logistics Management 35, 29–55 (2024). [↩] [↩]
- H. Kim, K. Koo, H. Lim, S. Kwon, Y. Lee. Analysis of fishing vessel accidents and suggestions for safety policy in South Korea from 2018 to 2022. Sustainability 16, 3537 (2024). [↩]
- U. I. Peixoto, M. Sporcic, A. J. Hobday, B. Bentes, R. Passarone, F. L. Fredou, V. J. Isaac. Ecological risk assessment of marine resources caught as bycatch in industrial bottom trawl shrimp fishery in the Amazon Continental Shelf. Frontiers in Marine Science 12, 1490894 (2025). [↩] [↩]
- S. Graça Aranha, A. Teodósio, T. Marsili, P. P. da Rocha, T. Modesto, P. M. Guerreiro, A. Tambutte, A. Alves, P. Relvas, E. Dias. Under pressure: deep-sea elasmobranchs experience high mortality and stress in a crustacean trawling fishery. Frontiers in Fish Science 3, 1473376 (2025). [↩] [↩]
- M. Montseny, C. Linares, N. Viladrich, J. L. L. Riera, M. Biel-Cabanelas, P. Baena, E. Quintanilla, S. Ambroso, J. Grinyó, A. Santín, J. Salazar. Quantifying bycatch of cold-water gorgonians to propose a dynamic management strategy for sustainable artisanal fishing on the Mediterranean continental shelf. Ocean & Coastal Management 262, 107592 (2025). [↩]
- R. L. Lewison, L. B. Crowder, B. P. Wallace, J. E. Moore, T. Cox, R. Zydelis, S. McDonald, A. DiMatteo, D. C. Dunn, C. Y. Kot, R. Bjorkland. Global patterns of marine mammal, seabird, and sea turtle bycatch reveal taxa-specific and cumulative megafauna hotspots. Proceedings of the National Academy of Sciences 111, 5271–5276 (2014). [↩]
- D. Steadman, J. B. Thomas, V. R. Villanueva, F. Lewis, D. Pauly, M. L. Palomares, N. Bailly, M. Levine, J. Virdin, S. Rocliffe, T. Collinson. New perspectives on an old fishing practice: scale, context and impacts of bottom trawling. Our Shared Seas Report 44 (2021). [↩]
- V. Smil. How the world really works: The science behind how we got here and where we’re going. Penguin Group (2025). [↩] [↩] [↩]
- World Bank. The sunken billions revisited: progress and challenges in global marine fisheries. World Bank (2017). [↩] [↩] [↩] [↩] [↩] [↩] [↩]
- A. Grace. Sustainable fisheries: balancing conservation and economic needs. Journal of Fisheries & Livestock Production 11, 432 (2023). [↩] [↩]
- OECD. OECD review of fisheries 2025: policies and summary statistics. OECD Publishing (2025). [↩] [↩] [↩] [↩] [↩] [↩] [↩] [↩]
- C. Overfield, J. Yllemo. Options for sustainable high seas fisheries management in the Southwest Atlantic. International Law Studies 106, (2025). [↩]
- K. Zhang, L. Su, Z. Chen, Y. Qiu. An extensive assessment of exploitation indicators for multispecies fisheries in the South China Sea to inform more practical and precise management in China. Ecological Indicators 173, 113363 (2025). [↩]
- F. Grati, J. N. Druon, D. Gascuel, C. Absil, F. Bastardie, S. Bonanomi, G. Fabi, G. Glemarec, J. Guitton, S. Hornborg, A. Iriondo. Fisheries performance indicators for assessing the ecological sustainability of wild-caught seafood products in Europe. Environmental and Sustainability Indicators 26, 100632 (2025). [↩] [↩] [↩] [↩] [↩]
- A. H. Prayogo, B.O. Sutrisno, D. Husin, F. Hermawan, I. Maulana. Development of fishing areas to improve the economy and ecology of the Sayung Village community, Demak Regencies. IOP Conference Series: Earth and Environmental Science 1496, 012017 (2025). [↩]
- M. González. Advances in sustainable fisheries management: a global perspective. Journal of Fisheries Research 8, 226 (2024). [↩] [↩] [↩]
- A. D. Rijnsdorp, P. G. Boute, J. C. Tiano. Electrotrawling can improve the sustainability of the bottom trawl fishery for sole: a review of the evidence. Reviews in Fish Biology and Fisheries 34, 959–993 (2024). [↩] [↩]
- T. Mazor, C. R. Pitcher, W. Rochester, M. J. Kaiser, J. G. Hiddink, S. Jennings, R. Amoroso, R. A. McConnaughey, A. D. Rijnsdorp, A. M. Parma, P. Suuronen. Trawl fishing impacts on the status of seabed fauna in diverse regions of the globe. Fish and Fisheries 22, 72–86 (2021). [↩] [↩]
- S. Løkkeborg, S. I. Siikavuopio, O.-B Humborstad, A. C. Utne-Palm, K. Ferter. Towards more efficient longline fisheries: fish feeding behaviour, bait characteristics and development of alternative baits. Reviews in Fish Biology and Fisheries 24, 985–1003 (2014). [↩]
- R. W. D. Davies, S. J. Cripps, A. Nickson and G. Porter. Defining and estimating global marine fisheries bycatch. Marine Policy 33, 661–672 (2009). [↩] [↩]
- V. Havas, J. Cantillo, P. C. Deshpande. Comparing the end-of-life circularity potential of commercial fishing gear deployed in Norway by applying multi-criteria decision analysis (MCDA). Marine Pollution Bulletin 209, 117066 (2024). [↩]
- K. Wang, M. N. Reimer, J. E. Wilen. Fisheries subsidies reform in China. Proceedings of the National Academy of Sciences 120, e2300688120 (2023). [↩]
- F. T. Cañete, R. Oyanedel, S. Gelcich. Adoption and impacts of fishing gear innovations: insights from a small-scale fishery in Chile. Fisheries Research 248, 106200 (2021). [↩]
- Y. Yan, A. Graycar. Exploring corruption in fisheries. Natural Resources Forum, 44, 176–190. (2020). [↩] [↩]


