
Abstract
The gut microbiome is integral to metabolic regulation, particularly in modulating glucose homeostasis. In type 2 diabetes, this community becomes dysbiotic—less diverse and imbalanced. This study confirms a strong link between dysbiosis and diabetes, showing decreased levels of the beneficial Roseburia inulinivorans and increased levels of Clostridium hathewayi and Clostridium bolteae. These shifts are associated with metabolic homeostasis and correlate with insulin resistance. Systemic inflammation, particularly marked by Tumor Necrosis Factor-alpha (TNF-alpha), further aggravates the condition. Statistical analyses of metagenomic data confirmed significant differences in bacterial abundance based on diabetes status. Predictive modeling identified age, microbiome composition, and gender as critical factors. An optimized artificial neural network (ANN) model demonstrated good potential for predicting disease outcomes, achieving enhanced accuracy with minimal overfitting. These findings reveal a multifactorial relationship among age, gut microbiota, and inflammation that contributes to the advancement of diabetes. This highlights the promise of microbiome-targeted therapeutic strategies. Furthermore, with continued refinement, machine learning models like ANN could become powerful tools for predicting diabetes and personalizing treatment plans. These findings should be interpreted as exploratory, given dataset constraints and modest model performance, and highlight the need for validation in larger, more detailed cohorts.
Keywords: MetaPhlAn; Clostridium hathewayi; Clostridium bolteae; Roseburia inulinivorans; Tumor necrosis factor‑alpha (TNF‑α); Multivariate analysis of variance (MANOVA); Artificial neural network (ANN)
Introduction
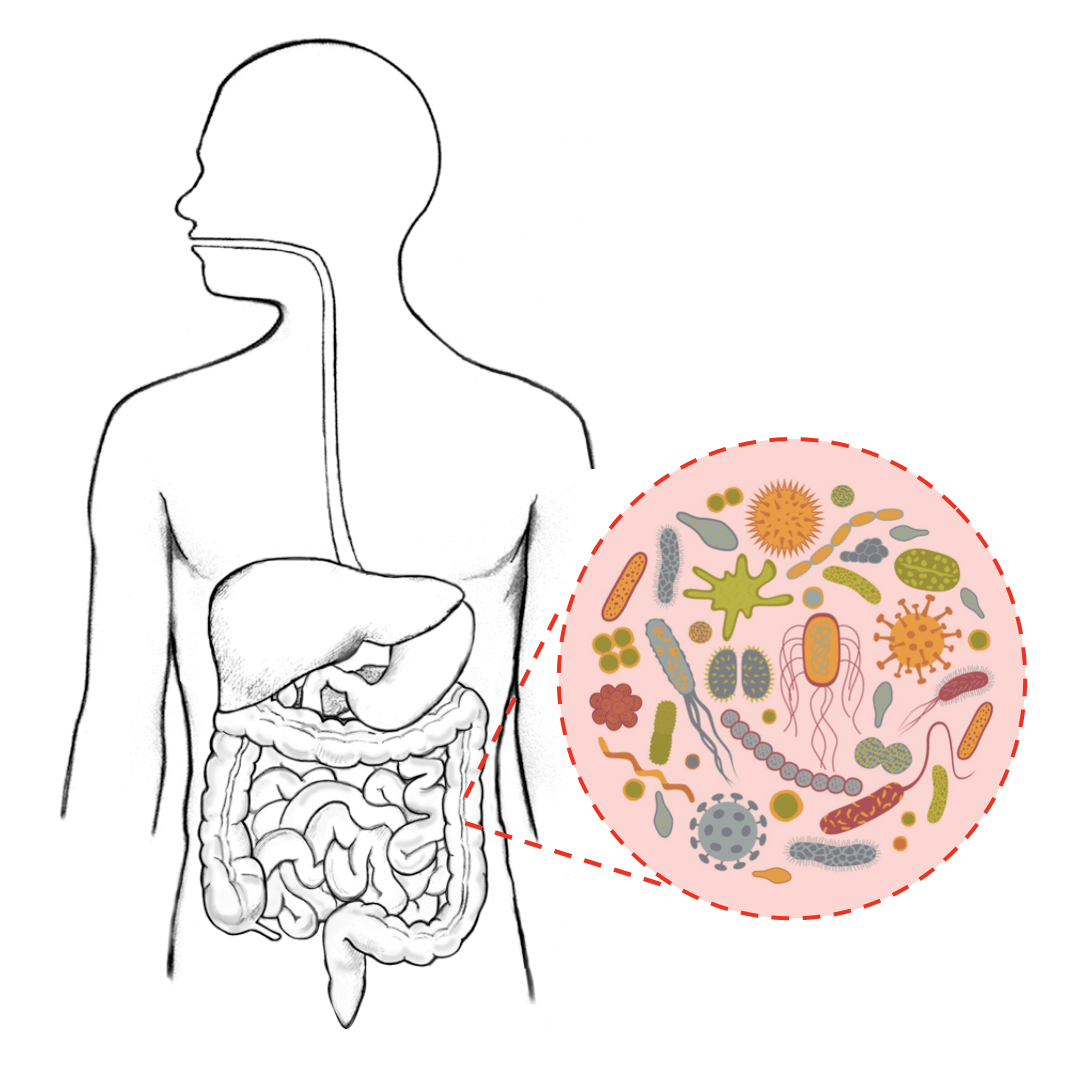
As of 2025, approximately 589 million adults aged 20 to 79 are living with diabetes globally, with type 2 diabetes comprising more than 90% of these cases1 and contributing to complications such as neuropathy, cardiovascular dysfunction, and gastrointestinal disorders. Recent studies have begun to uncover mechanistic links between gut microbial imbalance and metabolic dysfunction, including insulin resistance and inflammation2. Uncontrolled blood glucose levels can impair nerves that regulate digestion, leading to conditions like gastroparesis and diabetic enteropathy, which are associated with food transit and microbial balance. A schematic overview of the gut microbiome as shown in Figure 1 illustrates its complexity and diversity3. Digestion itself begins in the mouth and involves a complex series of biochemical steps that are tightly linked to metabolic health4. Microbial populations within the gut—including bacteria, fungi, and viruses—play an integral role in orchestrating host metabolic and immune functions, particularly those linked to glucose regulation and inflammation5‘3. Understanding this connection could open new pathways for non-invasive diagnostics and therapeutic interventions.
The term “microbiome” refers to the entire genetic material of microbial communities inhabiting specific regions of the body, such as the gut, skin, and oral cavities5. These microbes play essential roles in nutrient absorption, energy production, and immune defense. Beneficial gut bacteria help produce short-chain fatty acids and key amino acids, including arginine and glutamine, and vitamins such as folic acid and vitamin K6. They also support anti-inflammatory processes and protect against pathogenic overgrowth. The structural composition of a fatty acid chain is illustrated in Figure 2, highlighting the hydrocarbon tail and carboxyl group that define its amphipathic nature. However, environmental factors such as poor diet, stress, and antibiotic use are associated with microbial balance, promoting the proliferation of harmful species7‘8. This dysbiosis, an imbalance in the composition and function of microbial communities, often characterized by a loss of beneficial microbes, an expansion of potentially harmful ones, or reduced diversity, and metabolic deregulation can impair gut function and may be biomarkers of systemic inflammation and insulin resistance9. Stool analysis is a widely used non-invasive method to assess gut health and microbial composition10‘11. Recent studies have identified microbial signatures in type 2 diabetes, highlighting specific taxa and functional pathways that may be biomarker of disease progression12.

Emerging studies have linked gut microbiota in the pathophysiology of metabolic conditions, with type 2 diabetes being among the most prominently affected. Disruptions in microbial balance may be biomarkers of complications like gastroparesis, which disproportionately affects women, and diabetic enteropathy, which often presents as constipation. These conditions allow harmful bacteria to multiply rapidly, further compromising gut health13. Large-scale initiatives such as the MiBioGen collaboration have begun mapping microbial signatures associated with diabetes, while biotech companies are developing microbiome-based therapies and tools for sequencing and data analysis14. Recent reviews have deepened our understanding of how gut microbial dynamics intersect with diabetes pathophysiology, underscoring the promise of microbiome-guided diagnostics and therapies15. Additionally, mechanistic insights into microbial contributions to glucose metabolism and insulin sensitivity continue to shape therapeutic strategies for type 2 diabetes16. These efforts underscore the growing interest in leveraging microbiome data to understand and potentially treat metabolic diseases.
This study examines how variations in gut microbial composition correlate with type 2 diabetes, using statistical tests and machine learning algorithms to analyze microbial abundance data. Using multivariate linear models and predictive classifiers, the analysis identifies bacterial species associated with diabetic status and evaluates the influence of demographic factors such as sex, age, and Body Mass Index (BMI). The results provide insight into how specific microbes may be biomarkers of metabolic dysfunction and lay the groundwork for future non-invasive diagnostic tools.
The subsequent sections are structured as follows: the Methods section outlines the data acquisition process, preprocessing steps, and exploratory data analysis. The Results section presents findings from statistical tests and machine learning models. The Discussion section interprets these results in the context of existing literature, while the Future Research section outlines plans for Phase 2, including microbial Deoxyribonucleic acid17 analysis from stool samples18, collaboration with the MiBioGen initiative19, and potential partnerships with biotech firms specializing in microbiome therapeutics.
Methods
Data Source and Ethical Approval
The datasets analyzed in this study were originally generated by the Human Microbiome Project Consortium20 and subsequently compiled and processed into shotgun metagenomic profiles by Pasolli21et al. These processed data are publicly accessible via the Segata Lab GitHub repository (https://github.com/SegataLab/metaml/tree/master/data). For the present study, we performed a secondary analysis by filtering the publicly available dataset to include 489 samples annotated as healthy (n = 217), impaired glucose tolerance (n = 166), or type 2 diabetes (n = 106). This subset was then used for all subsequent analyses focused on metabolic health outcomes and underwent standardized preprocessing to ensure comparability across cohorts.
Specifically, variable names were harmonized, missing values were replaced with equivalent measures (e.g., substituting fasting glucose with FBG, triglycerides with TG, fasting insulin with FINS where available), and redundant columns were removed by Pasolli22 et al during dataset compilation. Building on this processed data, we converted all continuous variables to a numeric format, and categorical disease status was encoded as healthy (0), impaired glucose tolerance (1), or type 2 diabetes (2). These steps ensured consistency and reproducibility for downstream statistical and machine learning analyses.
Description of the Data
The dataset used for this study uses machine learning techniques to facilitate meta-analysis across large-scale metagenomic datasets21. It contains various medical and microbiome-related variables. The overview of the key features of the dataset is described below:
Medical and demographic variables:
- Disease: This is the output variable, likely indicating the presence or type of a disease.
Age, gender: Basic demographic variables. - Body Mass Index (BMI): A measure of body fat based on an individual’s weight in relation to their height.
- Blood pressure: Includes Systolic Blood Pressure (SBP) and Diastolic Blood Pressure (DBP).
Diabetes-related variables: Includes Fasting Blood Glucose (FBG), Hemoglobin A1c(HbA1c), and insulin levels.
Lipid profile: Includes Triglycerides (TG), Total Cholesterol (TCHO), High-Density Lipoprotein (HDL), and Low-Density Lipoprotein (LDL).
Inflammation Markers: Includes Tumor Necrosis Factor-alpha (TNFα), Interleukin-1 (IL-1family cytokines), and high-sensitivity C-reactive protein (hsCRP), which are commonly used to assess systemic inflammation and disease risk23.
Microbiome Data: Variables related to specific bacterial taxa, with hierarchical taxonomic information from kingdom to strain or unclassified taxa
Other Laboratory and Medication variables:
– Statins, insulin, and oral anti-diabetic medication indicate medication usage
– Various peptides and biomarkers: Adiponectin, Leptin, and Glucagon-Like Peptide-1 (GLP-1).
The intricate relationships linked to type 2 diabetes (T2D) and the human microbiome are examined in this dataset22, with a particular emphasis on the function of gut bacteria that can form communities that resist pharmaceutical interventions24 and systemic inflammation on insulin sensitivity. Important questions include determining which gut bacteria affect insulin sensitivity in diabetics, comparing the microbial composition and inflammatory profiles of diabetics and healthy individuals, and identifying bacterial species that may serve as biomarkers for better disease prediction. A comparative analysis of inflammatory markers and microbiome profiles in T2D patients will shed light on the mechanisms behind the connection between gut health and metabolic dysfunction. Furthermore, this study investigates the effects of insulin and oral diabetic medications on an individual’s bacterial species, attempting to classify these species based on features of abundance. Table 1 summarizes the demographic and health characteristics of study participants in our filtered dataset, derived from Pasolli21 et al processed data and limited to T2D records.

Data Collection Process
Human guts are one of the most densely populated habitats on Earth, home to trillions of microorganisms. The dataset utilized for this project was compiled from publicly accessible metagenomic datasets and includes information on the relative abundance of other taxonomic or microbial species within metagenomic samples22. Conclusions may be skewed by the inconsistencies and mistakes present in raw data. For example, batch effects occur when distinct sample groups are processed in different ways or at separate times. Technical restrictions may also result in insufficient microbiome data25, since certain microorganisms may not be fully recorded due to constraints in sequencing coverage and analytical sensitivity.
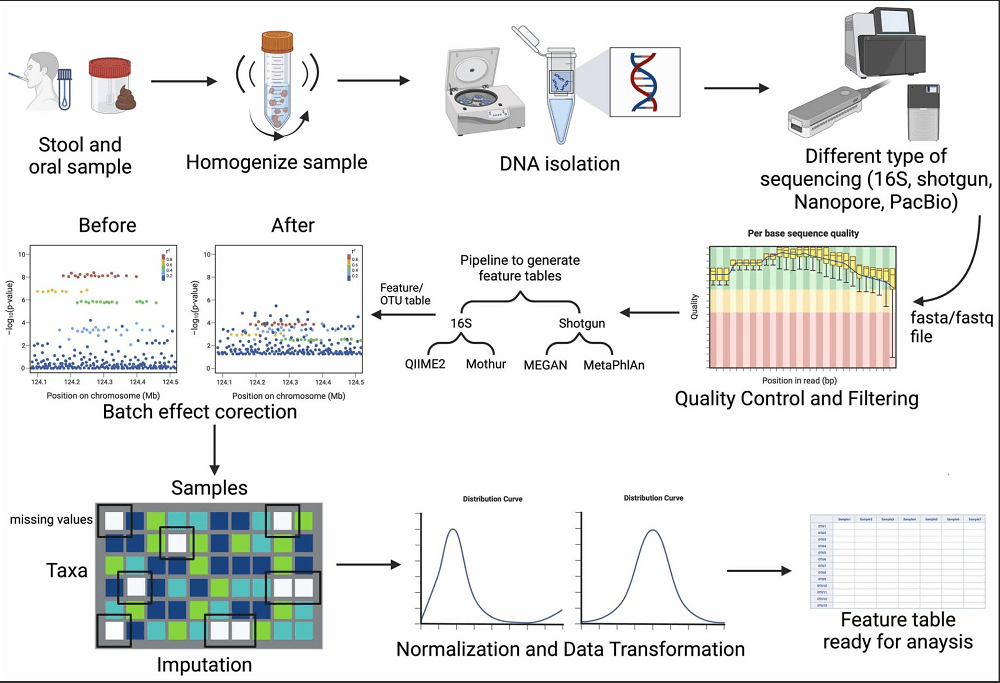
Data preparation is used to enhance data quality before analysis to lessen these problems. Preprocessing aids in filling in the gaps in data, minimizing biases and technical noise, and removing features that are not informative. Standard procedures for data preparation for microbiome sequencing data25 preparation, illustrated in Figure 3, depict the overall data provenance and preprocessing workflow. While the figure outlines common procedures such as imputation of missing values, batch effect correction, quality filtering, data standardization, and transformation, in this study, we relied on the harmonization and imputation performed by Pasolli et al. (2016) and implemented filtering and encoding as described in Sections 2.1 and 2.4. These procedures are essential for ensuring accurate and reproducible downstream analyses. Table 2 summarizes these preprocessing steps, which are essential for ensuring comparability and reproducibility in downstream analyses.
MetaPhlAn226, a computer tool that allocates metagenomic readings to specific taxonomic groups based on a database of clade-specific marker genes, was used to create the data for this study. The relative abundance is ascertained by mapping the sequencing reads to these flag genes, normalizing by their length and quantity, and averaging the outcomes to obtain the fraction of each species in the whole microbial community. Numerous methods, including read alignment, taxonomic profiling, and standardization, marking unique to a clan were utilized in generating the microbiome data25. To further reduce non‑biological variation introduced by differences in sequencing runs, cohorts, or laboratories, batch effect correction was performed using the ComBat27 empirical Bayes framework.

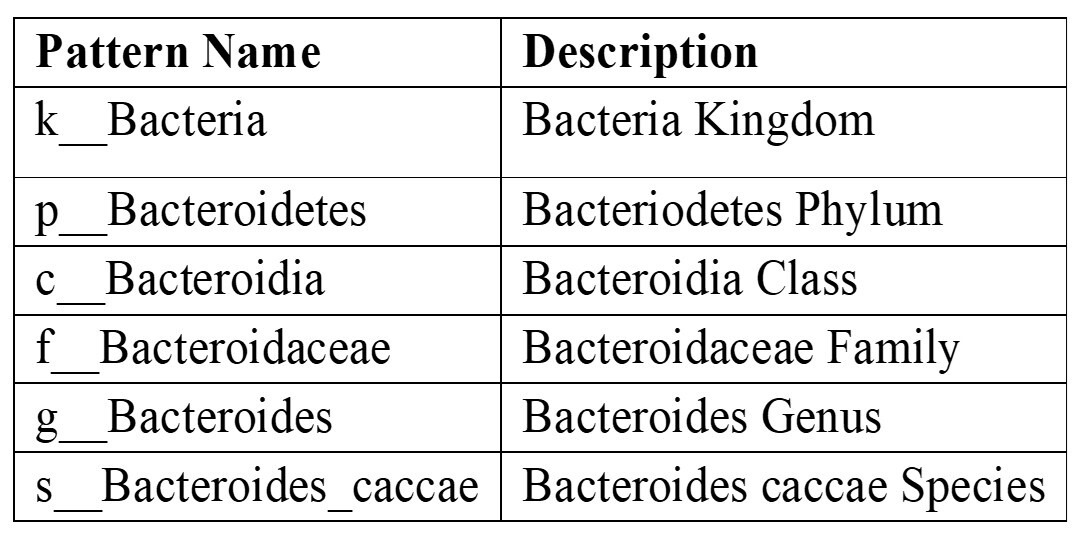
The Species abundance data provides insight into the associations between human health and the composition of the gut microbiota19 by utilizing a range of methods that combine more complex microbiome data with traditional clinical parameters. A pattern number of reads for the bacteroides caccae species for each sample, for instance, in the species abundance data is noted in the variable names of the species data. An example is provided below: “k__Bacteria|p__Bacteroidetes|c__Bacteroidia|o__Bacteroidales|f__Bacteroidaceae|g__Bacteroides|s__Bacteroides_caccae”.
The data described in this pattern is summarized in Table 3.
The paper examines how inflammatory markers in the blood, the structure of the gut microbiota, and insulin responsiveness interact in the context of type 2 diabetes. The relationship between gut flora and inflammation and insulin sensitivity, as well as the differences in the patterns of these two variables in diabetics and healthy people, are important research concerns. Furthermore, the study uses microbial abundance data to classify bacterial species and identify those associated with type 2 diabetes, employing predictive and optimization models through machine learning to determine the impact of insulin and oral antidiabetic drugs on microbial composition.
Exploratory Data Analysis
The gut microbiome includes species such as Clostridium bolteae and Clostridium hathewayi, both of which have been linked to metabolic conditions such as type 2 diabetes. While these anaerobic, Gram-positive bacteria may be biomarkers of systemic immune activation and resistance to insulin action when overgrown, Roseburia — a beneficial butyrate-producing genus — supports gut health and glucose regulation through anti-inflammatory mechanisms.
Imbalances in microbial composition are associated with metabolic homeostasis, highlighting the importance of species-level analysis. In this study, normalized and transformed microbiome data were interpreted using the Python Data Analysis Library, pandas28, followed by graphical summaries discussed in this section. The dataset22 comprises microbiome profiles from 489 stool samples analyzed via MetaPhlAn226, with 51 features spanning clinical, microbial, laboratory, and medication variables. The primary aim is to compare inflammatory markers and species abundance between healthy and diabetic individuals.
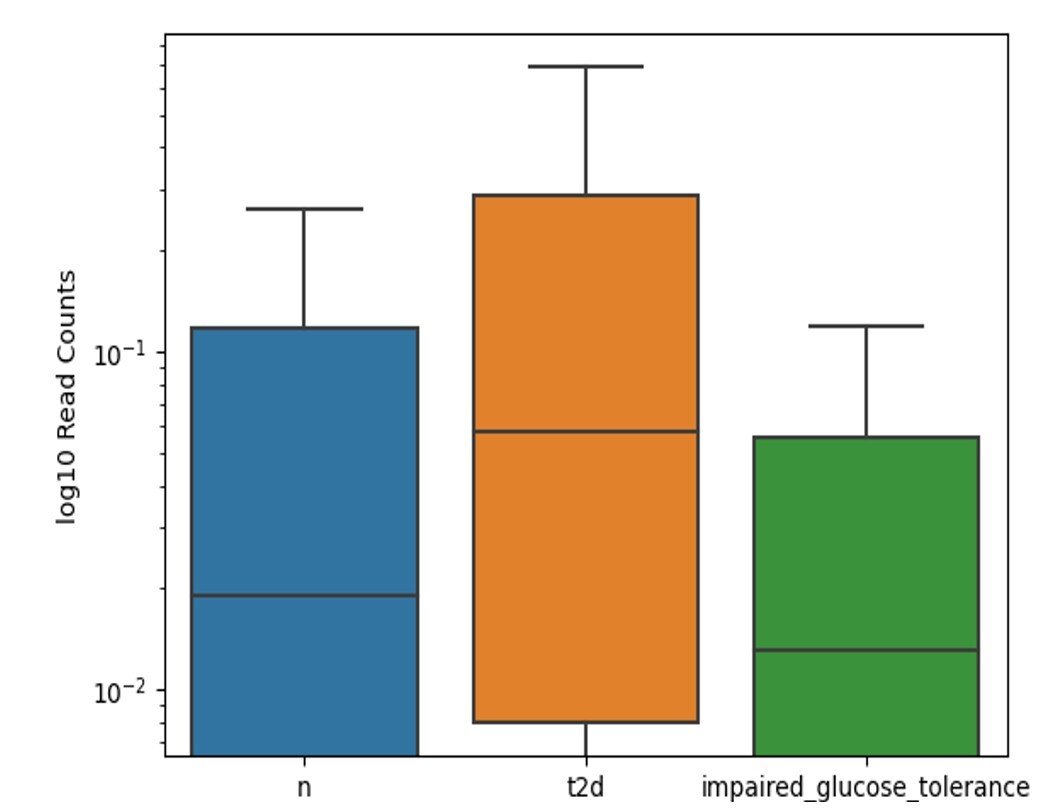
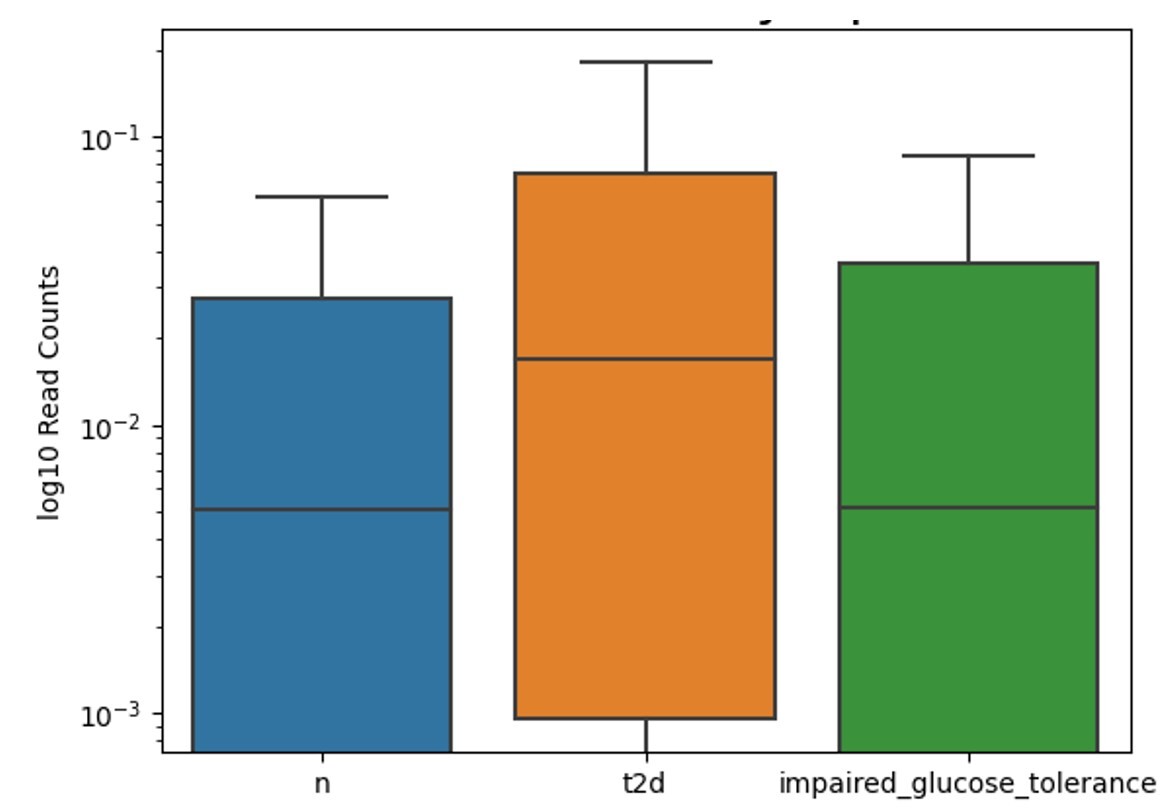
Figure 4 presents a boxplot of log₁₀-transformed read counts for the Gram-positive Clostridium bolteae across three cohorts: individuals without diabetes (“n”), those diagnosed with type 2 diabetes (“t2d”), and participants with impaired glucose tolerance. The median read count is highest in the “t2d” group, intermediate in the healthy cohort, and lowest among those with impaired glucose tolerance. The distribution in all groups exhibits a wide range of variation, suggesting a greater abundance of Clostridium bolteae in individuals with type 2 diabetes.
The boxplot of Gram-negative Clostridium hathewayi bacterium in Figure 5 across three groups shows the highest median read count in the “t2d” group, followed by the impaired glucose tolerance group, with the lowest median in the healthy group. Like Clostridium bolteae, Clostridium hathewayi levels are elevated in individuals with type 2 diabetes. The “t2d” group exhibits the greatest variation in read counts, while both the impaired glucose tolerance and healthy groups show less variability, with the impaired glucose tolerance group displaying higher median levels than the healthy group but lower than those with type 2 diabetes.
Taxonomic Clarification: Although members of the genus Clostridium are typically Gram‑positive, Clostridium (Hungatella) hathewayi has been reported to stain Gram‑negative in clinical isolates29. This discrepancy reflects staining behavior rather than phylogenetic classification. In contrast, Roseburia inulinivorans is consistently described as Gram‑positive rods30.
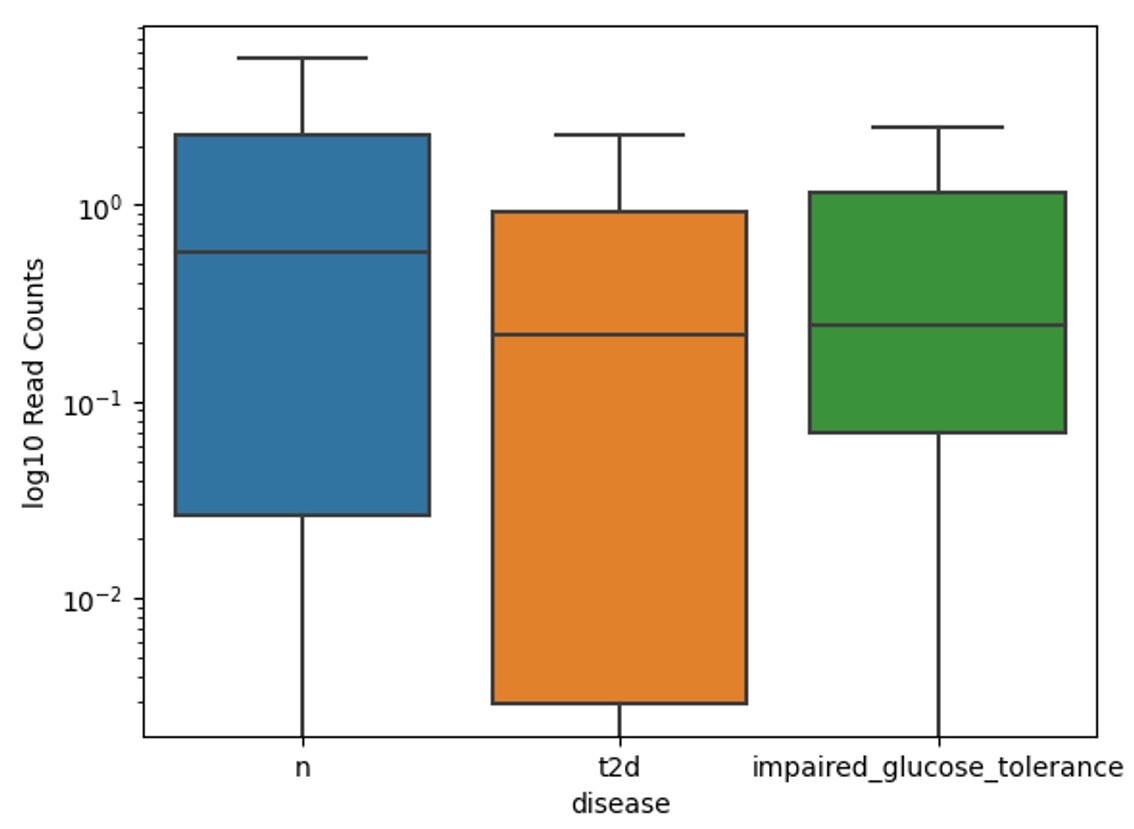
The boxplot of Gram-positive Roseburia inulinivorans bacterium species distribution in Figure 6 across three groups with “t2d” shows the highest median read counts in the healthy group, followed by impaired glucose tolerance, with the lowest in the type 2 diabetes group. This indicates a decline in Roseburia abundance from healthy individuals to those with diabetes. The healthy group exhibits the widest range of variabilities, while the “t2d” group has lower median levels and less variation. The impaired glucose tolerance group shows intermediate levels of Roseburia Inulinivorans, with moderate variability between the other two groups.
Results
Guided by principles from Mind on Statistics, this study employed a range of analytical methods to investigate the relationships between microbiome, clinical, and demographic data. Multivariate Analysis of Variance (MANOVA)31 and Analysis of Variance (ANOVA)32 were used to assess group-level differences, followed by decision trees33 and Linear Discriminant Analysis (LDA) for pattern discovery and class separation. Predictive modeling was performed using an Artificial Neural Network (ANN) to capture non-linear relationships and improve classification accuracy. Modern artificial neural networks have evolved to mimic biological intelligence34.
Machine Learning Models
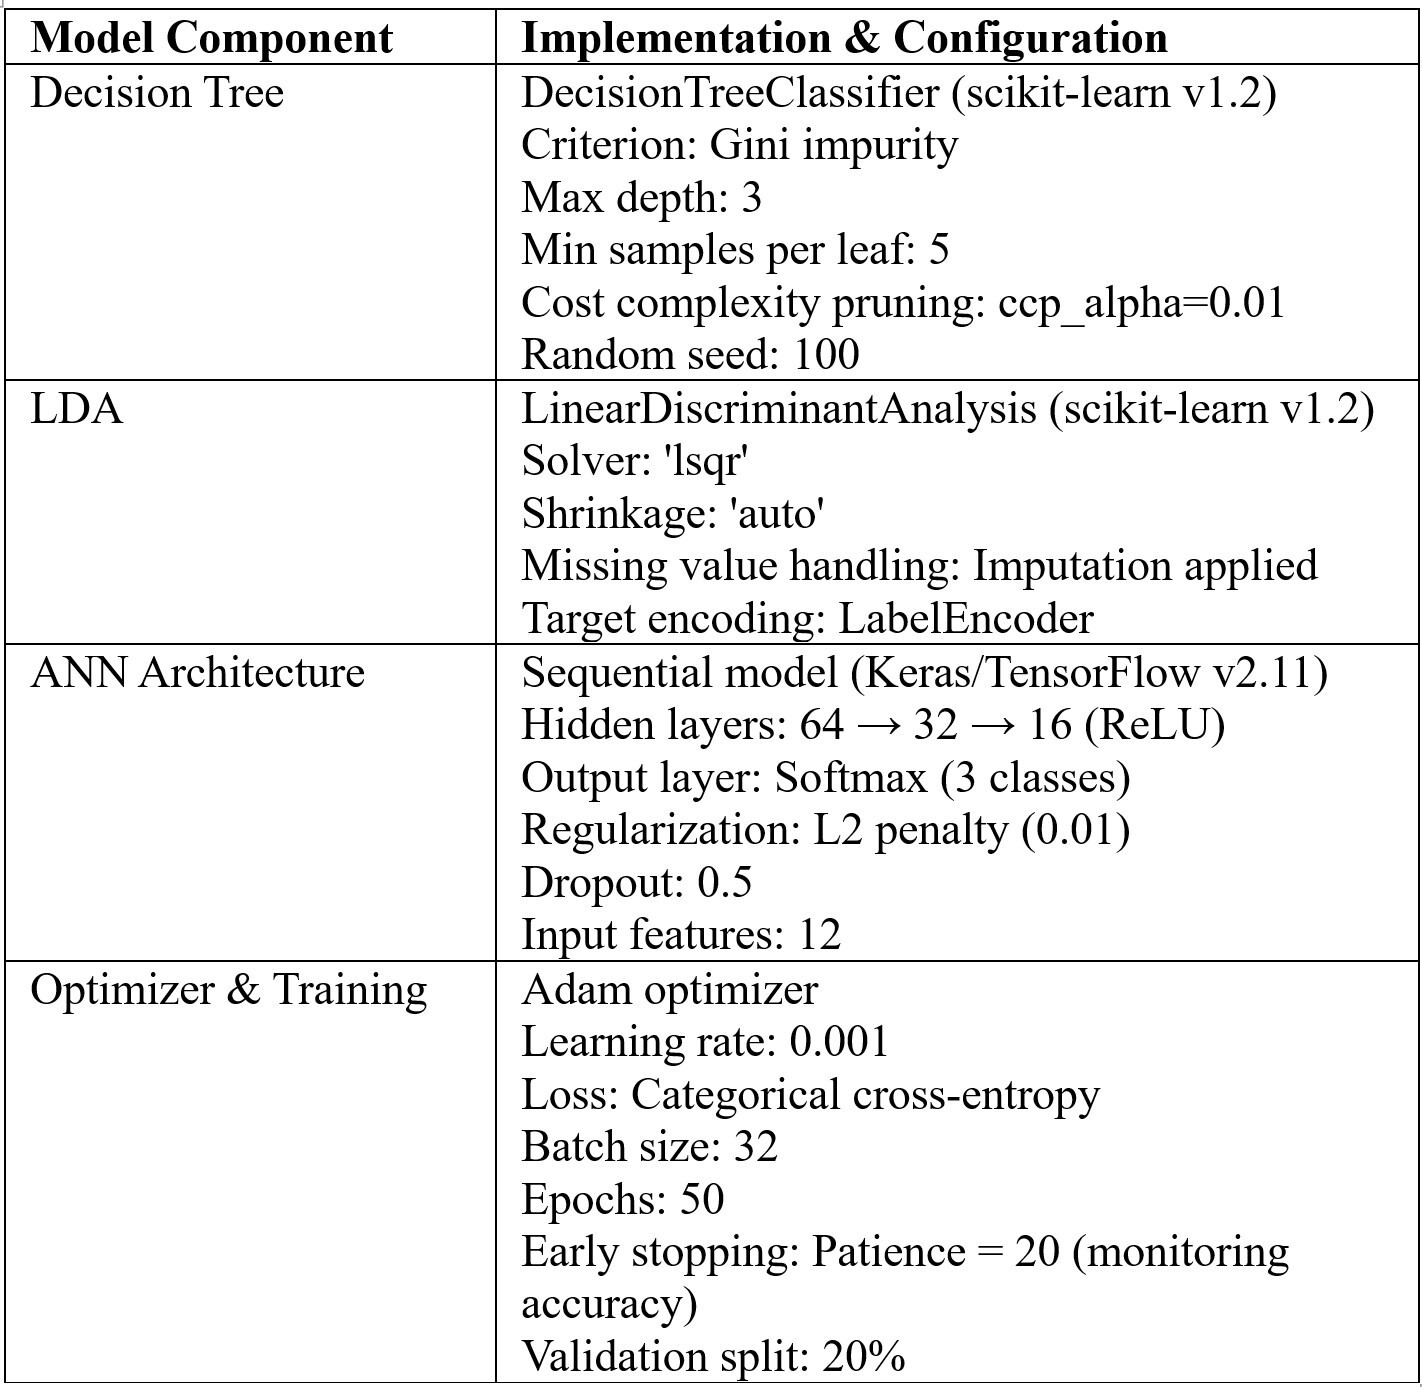
We employed supervised learning approaches to evaluate classification performance across diagnostic categories (healthy, impaired glucose tolerance, and type 2 diabetes). Decision trees provided transparent, rule-based classification and allowed visualization of feature contributions. LDA offered a linear boundary-based approach with shrinkage regularization to stabilize covariance estimation in moderate-dimensional settings. ANNs enabled nonlinear modeling of complex relationships, with regularization and early stopping applied to enhance generalization. Model performance was assessed using accuracy, precision, recall, and F1-score (defined as the harmonic mean of precision and recall) provide a single measure of a classifier’s accuracy that balances false positives and false negatives, with evaluation on held-out test sets to ensure robustness. Table 4 summarizes the full configuration of supervised learning models used in the study, ensuring reproducibility.
MANOVA (Multivariate Analysis of Variance)
MANOVA evaluates whether the continuous dependent variables (bacterial species in this case) vary as a function of the independent variables (disease and covariates). The disease outcomes (‘disease’ = impaired_glucose_tolerance, t2d, n) were analyzed for bacterial species (‘s_Clostridium_hathewayi’, ‘s_Clostridium_bolteae’, ‘s_Roseburia_inulinivorans’) while controlling for covariates like age, BMI to correct for potential confounding. Prior to conducting MANOVA, we evaluated the standard assumptions. Univariate normality was assessed using Shapiro–Wilk tests, which indicated significant departures from normality for all bacterial abundances across disease groups (p < 0.05). Multivariate normality was tested with Henze–Zirkler’s procedure and rejected (p < 0.001). Homogeneity of covariance matrices was examined using Box’s M test, which revealed heterogeneity across groups (p < 0.001). Homogeneity of variances was assessed with Levene’s test: equal variances were met for Clostridium hathewayi (p = 0.055), but violated for Clostridium bolteae (p = 0.025) and Roseburia inulinivorans (p = 0.015).
Multicollinearity was checked via correlation analysis, with all |r| < 0.2, indicating no problematic correlations. Linearity was supported by scatterplot inspection, and outlier detection using Mahalanobis distance flagged 18 multivariate outliers (3.7% of the dataset), which were retained to preserve biological variability. Given these violations, we relied on Pillai’s Trace, which is robust to departures from normality and covariance homogeneity, and we emphasized effect sizes (η²) rather than p‑values alone when interpreting results.
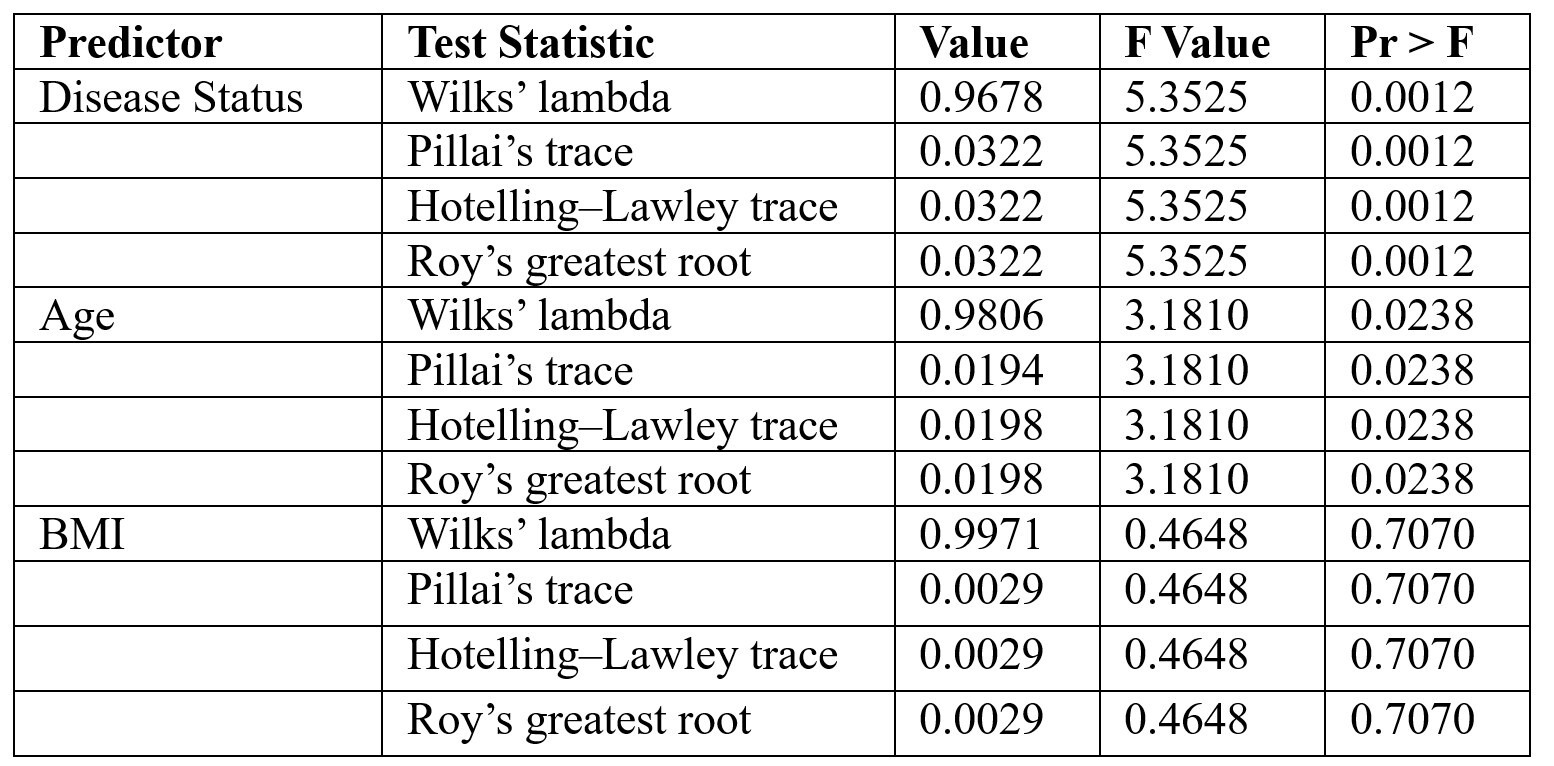
The MANOVA results—based on four standard multivariate statistics: Wilks’ lambda, Pillai’s trace, Hotelling-Lawley trace, and Roy’s greatest root31—are used to assess whether independent variables (such as sex, age, and BMI) have a statistically significant effect on the combined dependent variables (e.g., microbial species), as modeled in Table 5. The fitted regression equation for the model is: -0.1004 + 0.1376(s_Clostridium_hathewayi) + 0.0395(s_Clostridium_bolteae) – 0.0201(s_Roseburia_inulinivorans) + 0.0171(age) – 0.0072(bmi)
The results indicate that the quantity of the bacterial species is highly influenced by an individual’s medical condition, including whether they are healthy, pre-diabetic, or diabetic. While BMI does not seem to have a statistically discernible effect on the number of bacterial species, age does have a small but substantial effect. The linear regression coefficients suggest that various bacterial species may have distinct effects on diabetes status.
The standardized coefficients from the MANCOVA model indicated that Clostridium hathewayi (β = 0.138) and Clostridium bolteae (β = 0.040) were positively associated with disease status, while Roseburia inulinivorans (β = –0.021) showed a negative association. Among covariates, age (β = 0.017) and BMI (β = 0.007) contributed only modestly to the model. These values suggest that bacterial taxa contributed more strongly to variation in disease status than demographic covariates.
Further analysis of the effect of different bacterial species on diabetes status (C(disease))—healthy, pre-diabetic, or diabetic was performed to check the effect sizes. Table 6 summary lists the sum of squares, F-values, p-values (PR(>F) denotes the probability of observing a test statistic greater than the calculated F value under the null hypothesis), and effect sizes like eta squared (η²) and omega squared (ω²)35.
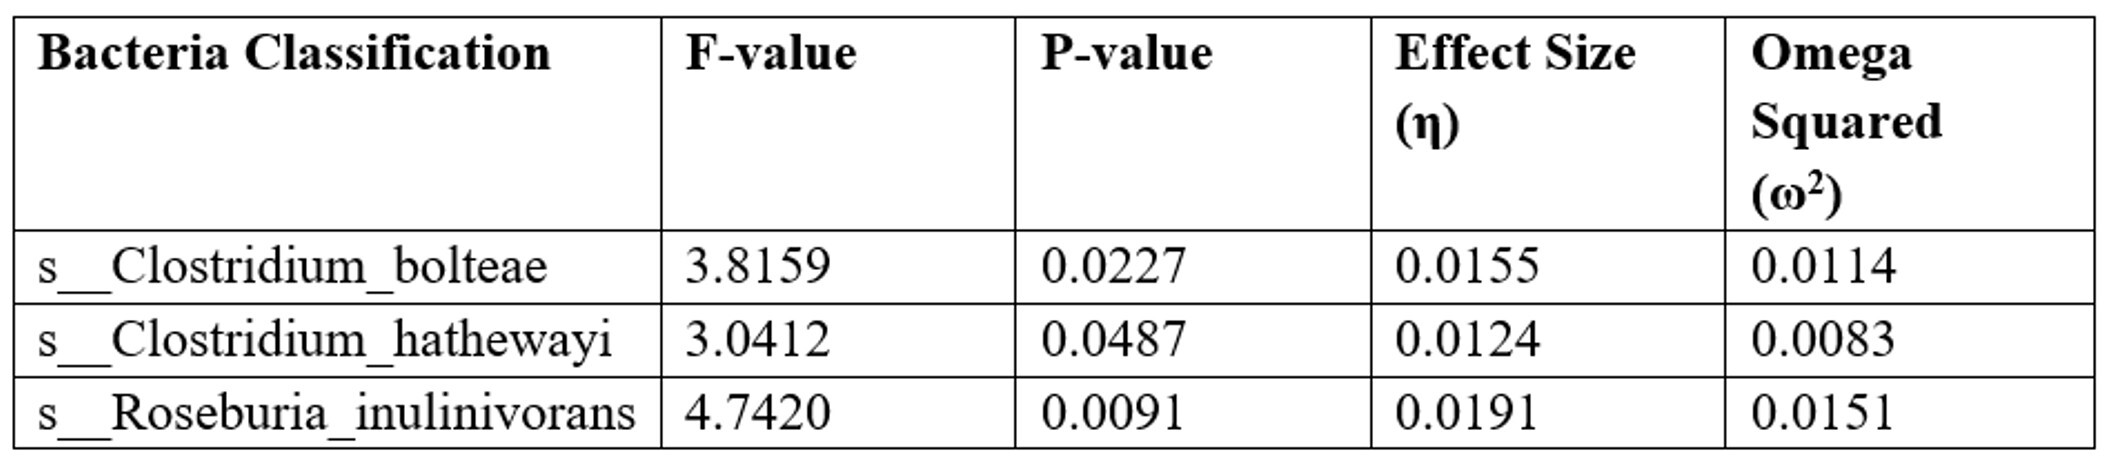
There is a statistically significant correlation (p-values all below 0.05) between the three bacterial species and the presence of diabetes. Each species has tiny effect sizes, but s_Roseburia_inulinivorans has the largest correlation with diabetes status, with s_Clostridium_bolteae and s_Clostridium_hathewayi following closely behind. These data imply that the quantity of these bacteria varies according to whether a person is healthy, pre-diabetic, or diabetic, with s__Roseburia_inulinivorans having the most noteworthy difference.
Similar MANOVA tests were conducted for inflammation markers, including TNF-alpha, hsCRP, and IL-1 family cytokines23. Among all the markers, only TNF-alpha (F(2,142) = 4.821, p = 0.0094) showed a significant effect on disease levels with an eta-squared (η2) value of 0.0636, suggesting that about 6.36% of the variance in TNF-alpha levels is explained by the disease category (healthy, pre-diabetic, diabetic). This suggests that TNF-alpha levels are likely higher in individuals with diabetes, consistent with the inflammatory response commonly associated with the condition.
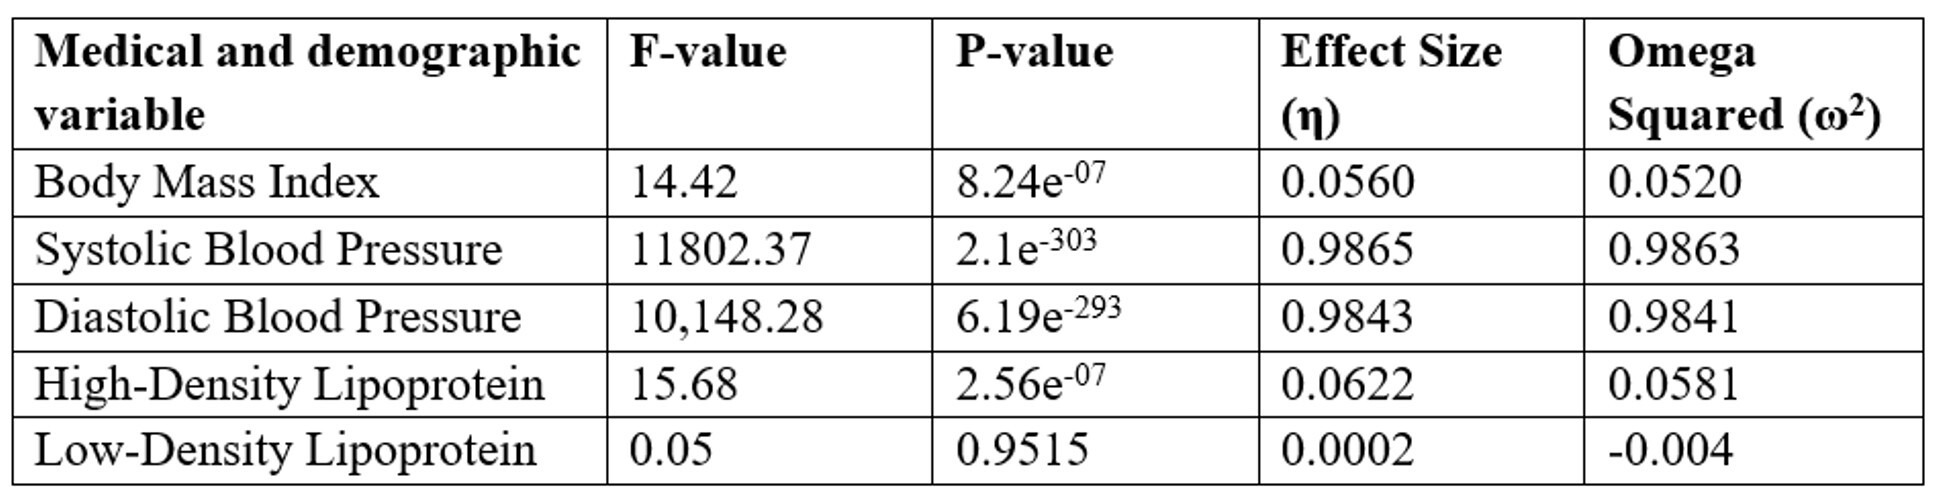
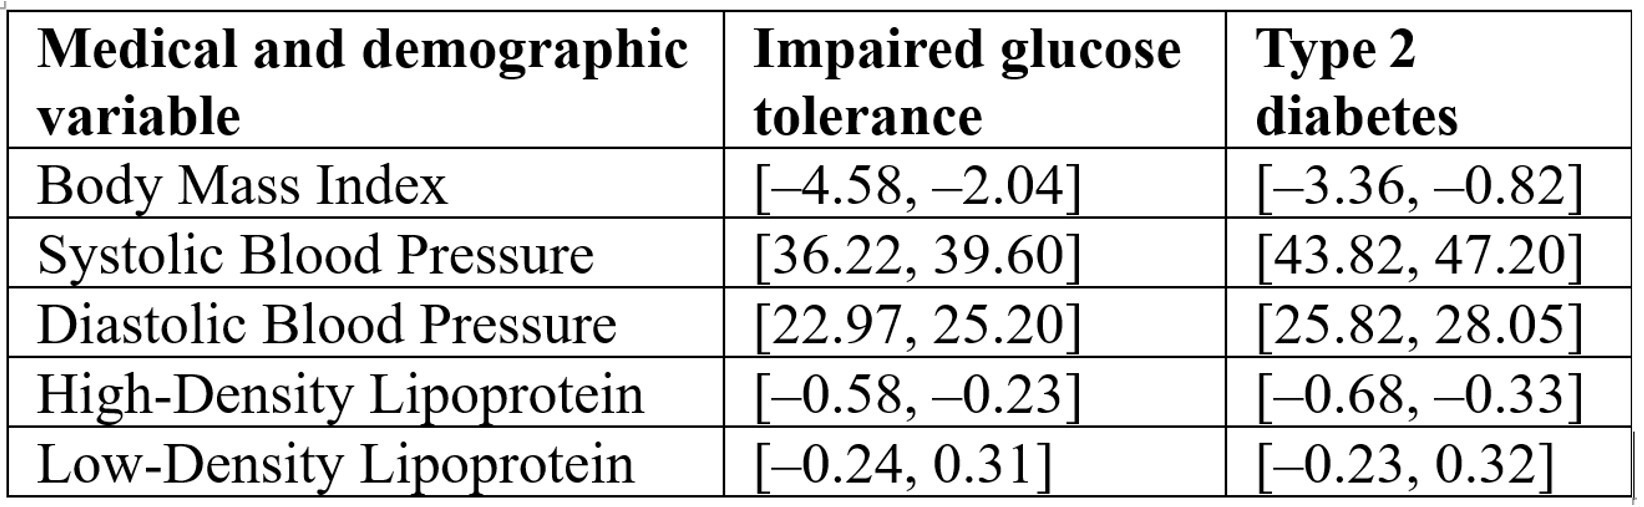
The ANOVA framework was applied to compare group means, following the methodology outlined by Utts and Heckard from Mind on Statistics31. ANOVA results of the individual medical and demographic variables and their impact on the disease status in Table 7 reveal that Blood pressure appears to be the most strongly linked to disease, while BMI and HDL have moderate associations, and Table 8 Confidence intervals [95% CI] for five clinical variables comparing impaired glucose tolerance and type 2 diabetes groups to the healthy reference group. Intervals are expressed in bracket notation [lower bound, upper bound]. Blood pressure (SBP, DBP) shows the strongest associations with disease status, BMI and HDL show moderate associations, and LDL shows no significant association (intervals include zero):
Confounding Variables: We acknowledge that several important confounders—particularly diabetes medications (metformin, sulfonylureas, insulin), diet, physical activity, statin use, and comorbidities—were not systematically available for all participants. In our main MANOVA analysis, we controlled for age and BMI, which were consistently recorded, but medication and lifestyle data were incomplete. To explore potential medication effects, we conducted a small LDA analysis restricted to individuals with available oral anti‑diabetic medication data (metformin or sulfonylureas). Due to missing records, this analysis did not yield robust predictive performance. Nevertheless, we report on the LDA framework and coefficients to enable replication and extension by other groups with more complete medication data. In the Discussion section, we emphasize that medication and lifestyle factors may partly drive observed microbiome differences, and that future studies should prioritize medication‑naïve cohorts or multivariable models with comprehensive confounder data.
Decision Tree Analysis
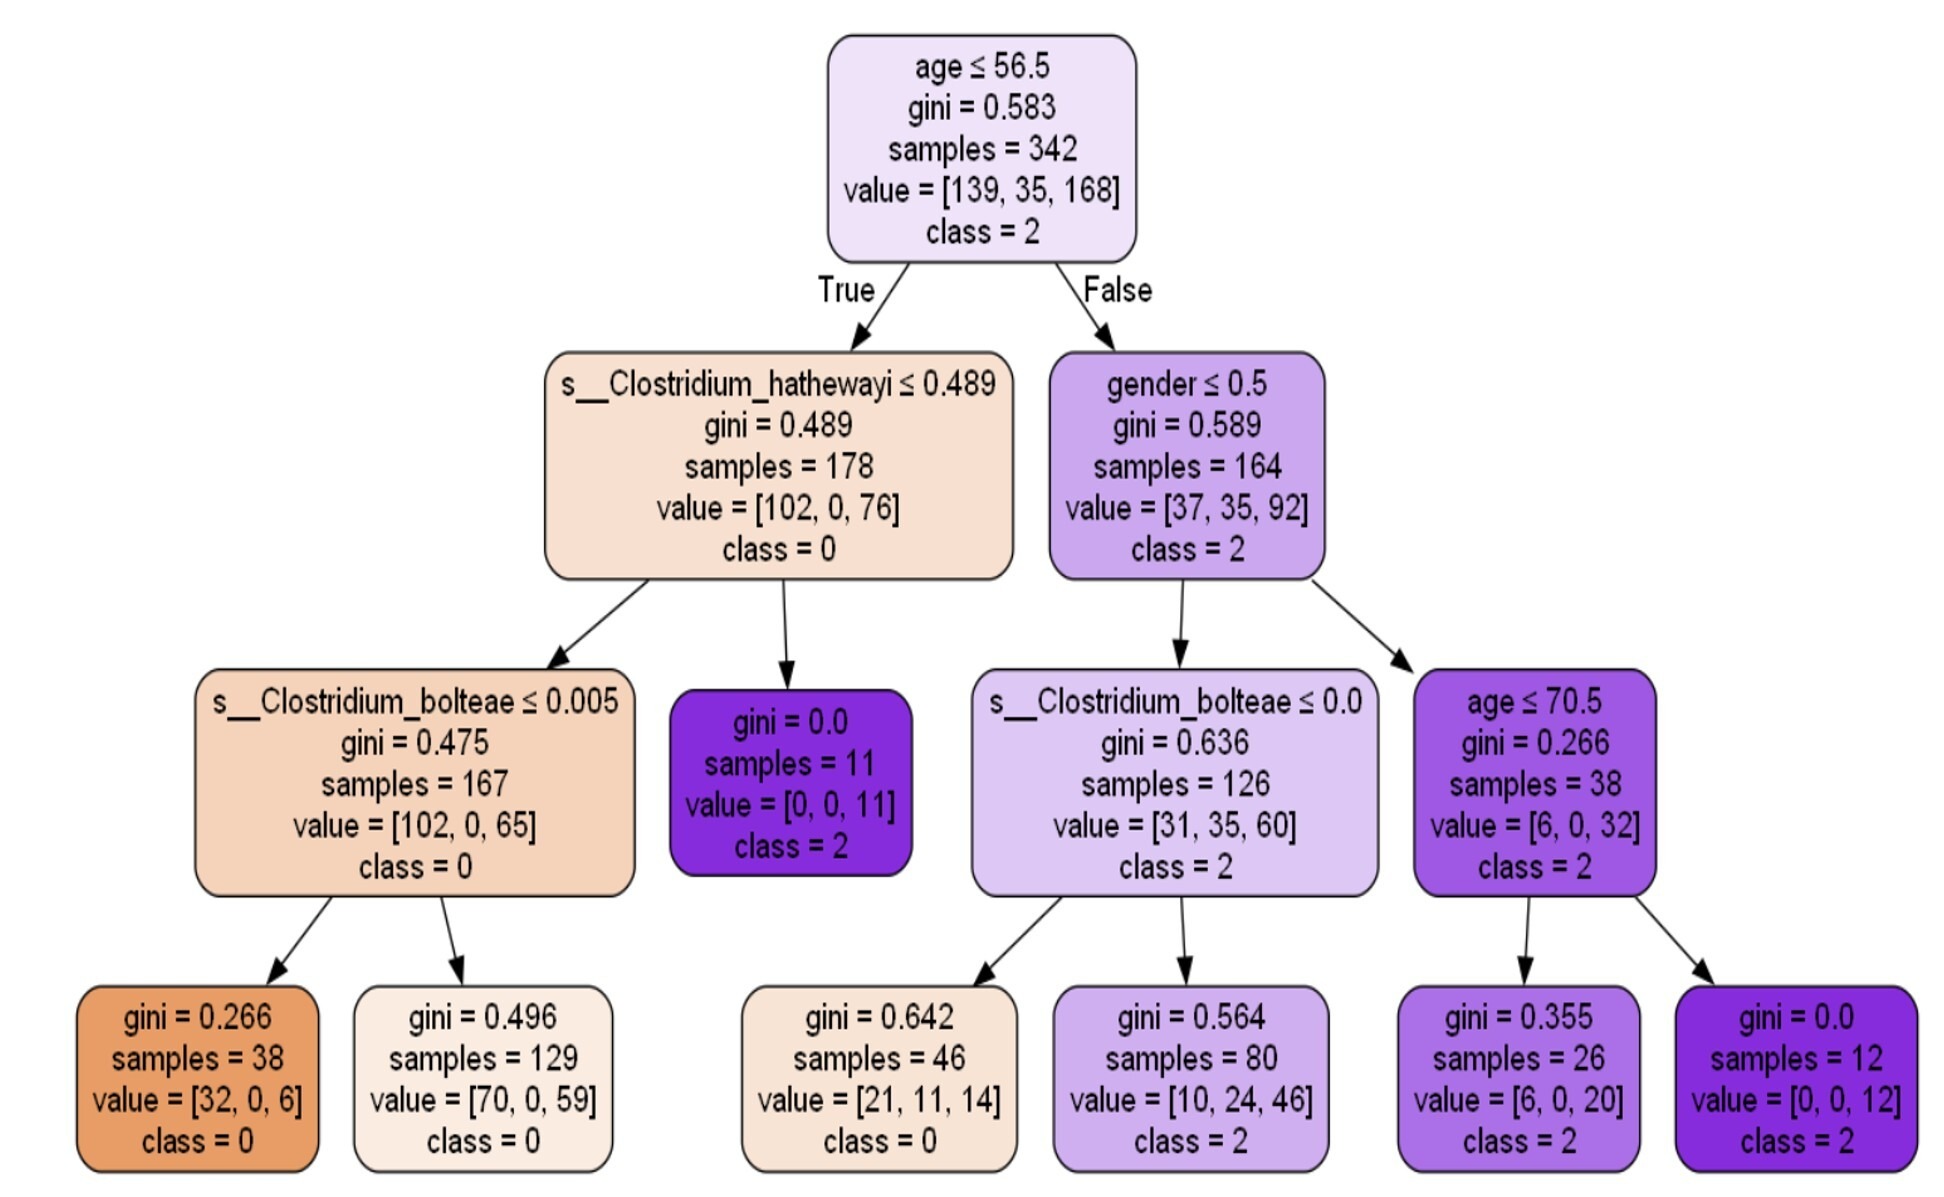
Decision tree33 analysis was conducted using the principles described by Quinlan (1986), which allow for recursive partitioning of data based on predictor variables. The decision tree33 output gives several insights into how various factors, such as age, gender, and microbiome species (particularly s_Clostridium_hathewayi and s_Clostridium_bolteae), impact a person’s health status in terms of being healthy, having impaired glucose tolerance (pre-diabetic), or being diabetic. Figure 7 describes the influence of age, microbiomes, and gender on the health of the patient.
Age Influence:
- The root node starts with age ≤ 56.5 being the primary split. This indicates that age plays a significant role in predicting diabetes, with older individuals (age > 56.5) more likely to be diabetic.
- As the tree branches further, age ≤ 70.5 continues to show a clear impact on the class, suggesting that older age categories tend to be more associated with diabetes (class 2).
Microbiome Influence:
- S_Clostridium_hathewayi appears as an important microbial species in the tree. Subjects exhibiting reduced abundance (≤ 0.489) of this species are more likely to be classified as healthy (class 0).
- S_Clostridium_bolteae shows a similar influence. For instance, those with s_Clostridium_bolteae values ≤ 0.005 are also more likely to be healthy (class 0), indicating that the higher presence of these bacterial species might correlate with less favorable health outcomes.
Gender Influence:
On the right branch, gender plays a role where females (gender ≤ 0.5) appear to be linked to a higher likelihood of being diabetic (class 2), compared to males. The classification report in Figure 8 shows the model’s performance. The overall accuracy of the model is 63.26%, which is moderate. The precision for classifying healthy individuals (class 0) is relatively high (0.70), but the model struggles to correctly classify individuals with impaired glucose tolerance (class 1), as indicated by a precision and recall of 0.0 for this group.

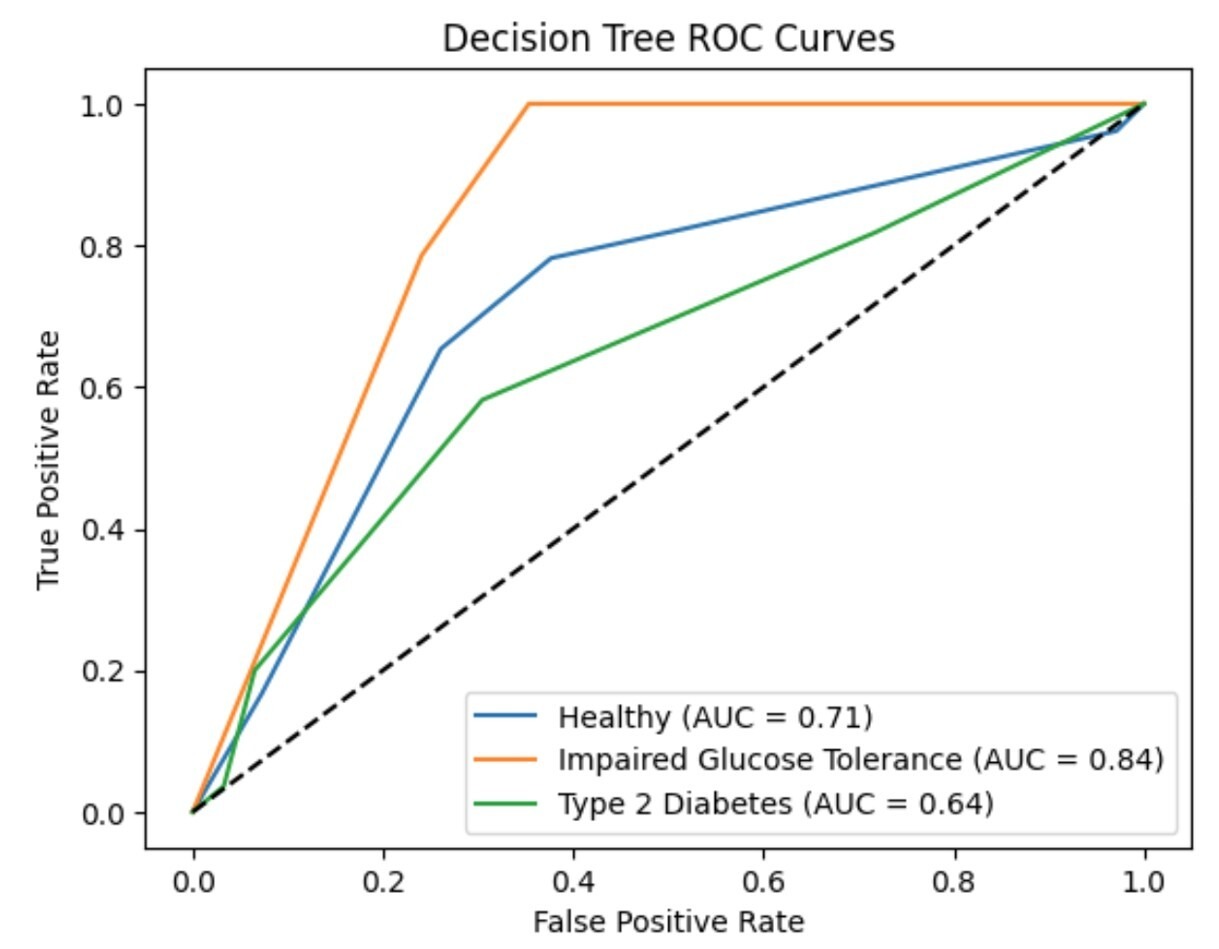
ROC and AUC curves:
To evaluate the performance of the decision tree classifier across the three disease categories (healthy, impaired glucose tolerance, and type 2 diabetes), we computed one-vs-rest ROC curves and corresponding AUC values displayed in Figure 9. The model achieved an AUC of 0.713 for healthy individuals (Class 0), 0.842 for impaired glucose tolerance (Class 1), and 0.644 for type 2 diabetes (Class 2). These curves provide a visual summary of the classifier’s ability to distinguish each class from the others. While the AUC for Class 1 appears high, this reflects the model’s confidence rather than its accuracy, as the precision and recall for this class were both zero. These results highlight the importance of interpreting ROC/AUC alongside confusion matrices and classification metrics.
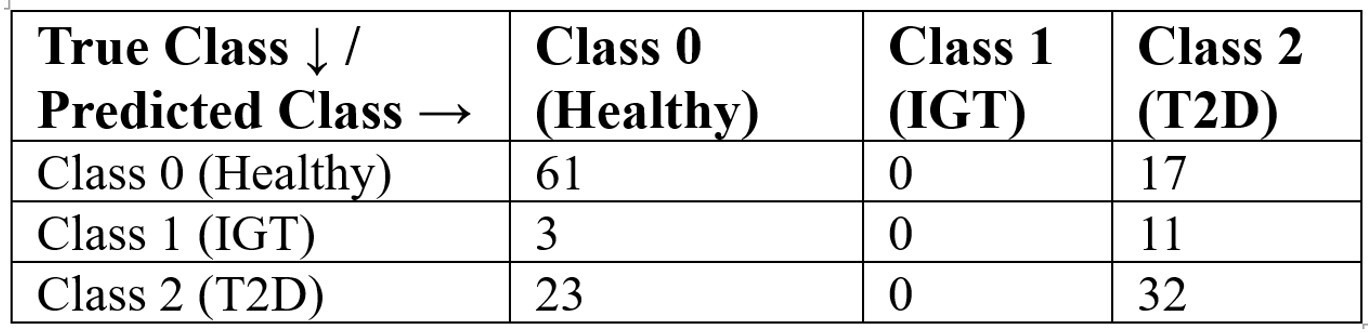
Confusion matrix:
Table 9 presents the confusion matrix for the decision tree classifier using the Gini index. The model correctly classified 61 of 78 healthy individuals (Class 0), but misclassified all 14 impaired glucose tolerance cases (Class 1), assigning them to other categories. For type 2 diabetes (Class 2), 32 of 55 cases were correctly identified. These results are aligned with the classification report: the model performs well for healthy individuals (precision = 0.70, recall = 0.78), moderately for T2D (precision = 0.53, recall = 0.58), and poorly for IGT (precision = 0.00, recall = 0.00). A baseline model that always predicted T2D achieved only 37% accuracy, confirming that the decision tree provides meaningful improvement despite limitations in identifying intermediate disease states.
Linear Discriminant Analysis for Studying the Impact of Medications
Recent findings suggest that the microbial composition in the gut can influence how diabetes medications, such as metformin, are metabolized and how effectively they function. For example, certain bacterial species have been associated with improved responses to metformin. Linear Discriminant Analysis (LDA) is a statistical method used for dimensionality reduction and classification. In the context of classification, LDA36 seeks to model the difference between groups by assuming that the data from each class are drawn from multivariate normal distributions that differ in their means but share an identical covariance structure. It operates by constructing a weighted sum of input features that maximizes class separation, making it well-suited for datasets with clear group distinctions and limited sample sizes. The test was conducted to analyze the impact of two drugs: Metformin and sulfonylurea. The summary of the results is shown in Figure 10

Precision, recall, and F1-score:
For “met” (metformin), precision, recall, and F1-score37 are all 0.75, suggesting that the model correctly identifies 75% of cases where the medication is metformin and does so with relatively high precision. However, for “sulph” (sulfonylurea), the model fails to correctly predict any case (precision, recall, and F1-score38 are all 0.00). The result could stem from insufficient sample representation, as the dataset includes just one instance of the “sulph” category (support = 1). This single data point doesn’t provide enough information for the model to learn and predict effectively.
Accuracy:
The overall accuracy is 0.60, meaning the model correctly predicted 60% of cases. Given the small sample size (5 instances total), this accuracy figure is not very reliable, and the model is likely to be overfitting to the limited data.
Interpretation of bacterial species coefficients:
S_Clostridium_bolteae: The large positive coefficient (12.19) suggests that higher levels of this bacterial species are strongly associated with the likelihood of the medication being “met”. This implies that s_Clostridium_bolteae may play a significant role in the discrimination between metformin and sulfonylurea users.
S_Clostridium_hathewayi: The negative coefficient (-0.50) suggests a slight inverse relationship with “met”. As levels of s_Clostridium_hathewayi increase, the model tends to predict “sulph” rather than “met”, though the effect is small compared to s_Clostridium_bolteae.
S_Roseburia_inulinivorans: Similarly, a negative coefficient (-2.49) indicates that higher levels of this bacterial species are associated with “sulph” rather than “met”, though the effect is still smaller compared to s_Clostridium_bolteae.
The tiny and unbalanced sample size limits the model’s practical application, especially for sulfonylurea. Although there may be some biological validity to the positive correlation between s_Clostridium_bolteae and metformin, a meaningful interpretation is impeded by the absence of information regarding sulfonylureas. The dataset22 should be enlarged, particularly sulfonylurea users, to provide more dependable insights and better capture the associations between bacterial species and diabetes drug types.
Predicting the Outcome of the Disease Using Artificial Neural Network Models
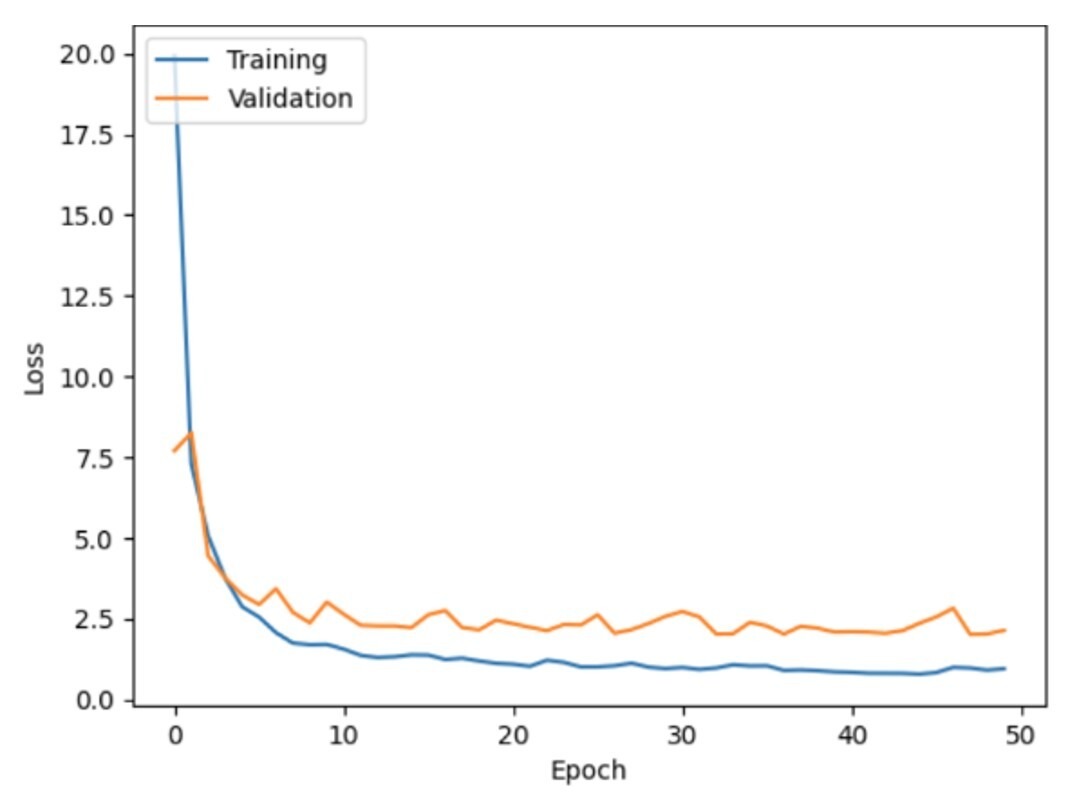
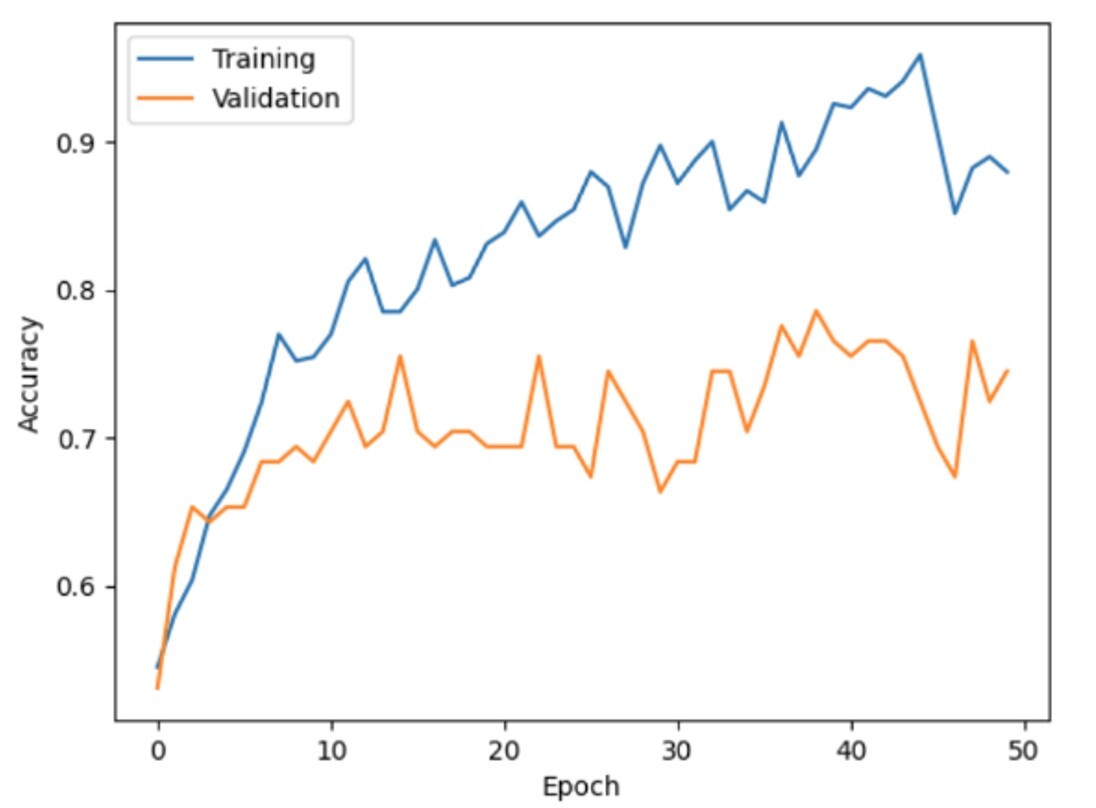
Through the identification of intricate patterns in large datasets22, Artificial Neural Networks (ANNs)—potent machine learning models— are increasingly utilized in clinical research to detect disease-related outcomes. Modern ANN34 architecture has evolved significantly in recent years. ANNs34 comprise structured layers of interconnected nodes—commonly referred to as neurons—that simulate the architecture of the human brain. These networks collaboratively transform and analyze input data, including microbial, clinical, and demographic variables. Compared to traditional statistical methods, ANNs34 are better equipped to model non-linear relationships between features like genetic markers, inflammatory proteins, and microbiome composition, enabling researchers to predict outcomes such as diabetes, cancer, or cardiovascular conditions. By identifying underlying structures in data and extending those insights to unfamiliar inputs, these models offer significant value in personalized diagnostics and predictive healthcare. Figures 11 and 12 display the initial model loss and accuracy trends for the ANN34.
The model was developed with an input layer containing 12 features derived from clinical and microbiome data. The neural network architecture began with a first hidden layer containing 64 neurons, each utilizing the Rectified Linear Unit (ReLU) activation function introduces non-linearity by outputting zero for negative inputs and the input value for positive inputs, enabling efficient training of deep networks. Two subsequent hidden layers—comprising 32 and 16 neurons, respectively—were positioned between the input and output layers. The output layer included 3 neurons with a SoftMax activation function (converts raw output scores into normalized probabilities, facilitating multi-class classification), corresponding to three classification categories: Diabetic, Impaired Glucose Tolerance, and Healthy individuals. Based on the model loss and accuracy graphs, we can draw the following conclusions:
Training vs. Validation Performance:
- A consistent decline in training loss accompanied by rising training accuracy indicates effective model learning from the input data.
- Validation loss does not follow the same trend. It fluctuates significantly after the initial epoch and does not stabilize, implying that the model is not generalizing well to the validation data. This is supported by the validation accuracy, which also fluctuates and does not show consistent improvement.
Overfitting:
- The training accuracy reaches around 95%, while the validation accuracy remains much lower, fluctuating around 70-75%. This large gap between validation and training accuracy indicates that the model has become overly tailored to the training data.
- Overfitting arises when the model memorizes the training data, including noise or non-generalizable features, leading to diminished performance on new inputs.
Possible Remedies:
- Early stopping may mitigate overfitting by halting training once the validation loss ceases to improve, preventing the model from over-adapting to the training set.
- Regularization techniques like dropout and L1/L2 regularization39 could help reduce overfitting by making the model less sensitive to the training data.
- Increasing the dataset size or applying data augmentation can expose the model to more diverse patterns, improving its ability to generalize.
- Adjusting the learning rate may help the model converge more effectively, especially if it struggles to minimize validation loss. Model tuning for this case study incorporated callbacks for early stopping, L2 regularization, and a dropout layer added after the second hidden layer. After applying these modifications, the model was re‑run, and the resulting performance plots are presented in Figures 13 and 14.
In summary, although the model achieves strong predictive performance on the training data, it exhibits signs of overfitting, as indicated by unstable validation loss and accuracy. To rectify this situation, hyperparameter tuning was performed. The tuning steps involved using callbacks for early stopping, L2 regularization, and adding a dropout layer after the second hidden layer. With the above changes, the model was re-run, and the captured plots are summarized in Figure 13 and Figure 14.
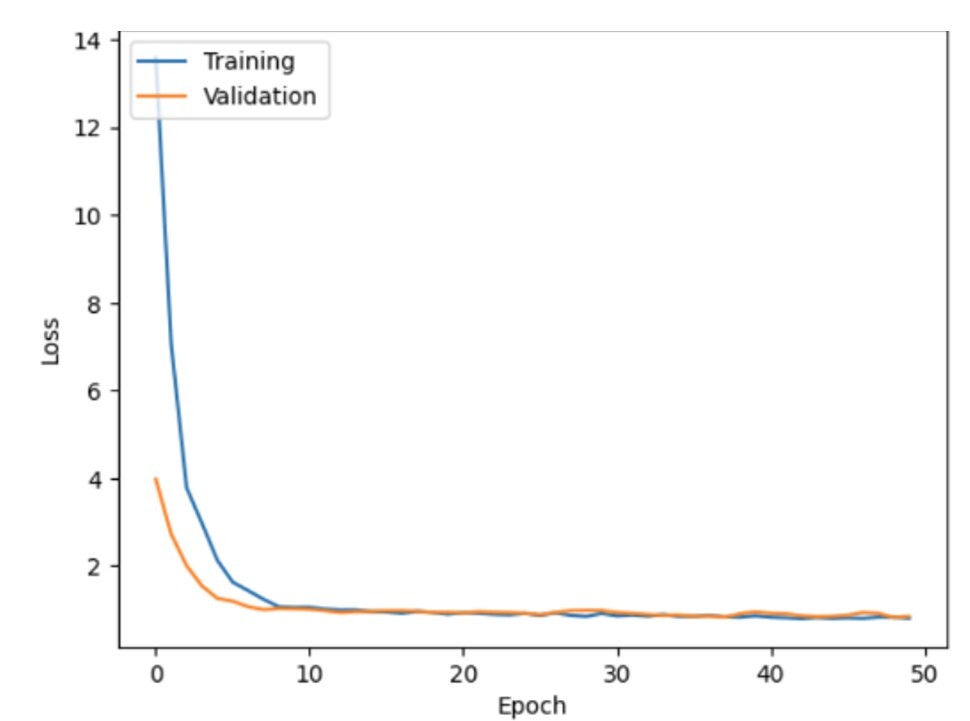

In these updated graphs, it seems that the model’s performance has improved significantly compared to the previous version: Both the training and validation loss have dropped to near zero, with a smooth convergence around 5-10 epochs. These results suggest that the model is effectively learning from the data, with reduced risk of overfitting compared to earlier iterations. Training accuracy varies between 60% and 70%, and validation accuracy closely mirrors this trend. The minimal gap between the two performance curves indicates strong generalization to unseen data. Compared to the previous run, the validation accuracy is now much more stable and closer to the training accuracy, indicating that overfitting is significantly reduced, and the model has become more robust.
The model accuracy is now better for both the validation and training sets, and the validation accuracy is very close to the training, indicating that the tuning (likely through hyperparameter adjustments or regularization) resulted in a much better generalized performing model. The loss curves show that the model converges quickly, and the reduced overfitting indicates effective tuning.
Discussion
Based on the various statistical tests, there exists a significant association between the gut microbiome and diabetes status. Individuals with type 2 diabetes exhibit higher levels of dysbiosis, marked by an imbalance in bacterial species such as Clostridium hathewayi and Clostridium bolteae, which may be biomarkers of increased inflammation and worsened glucose control. The reduction in Roseburia inulinivorans from healthy individuals to individuals exhibiting reduced glucose tolerance and diabetes highlights its protective role40 in metabolic health. Additionally, inflammatory markers like TNF-alpha show a strong correlation with diabetes, while IL-1 family cytokines (interleukin) though not statistically significant, suggests a possible role in the disease’s progression.
The MANOVA results confirm that the abundance of specific bacterial species varies significantly with diabetes status, particularly Roseburia inulinivorans. Moreover, decision tree analysis33 underscores the importance of age, microbiome composition, and gender in predicting diabetes, with older age and higher levels of Clostridium species being linked to poorer health outcomes. The model’s accuracy is moderate (63.26%), and while it performs well in classifying healthy individuals, it struggles with those exhibiting impaired glucose tolerance. These insights suggest that age, gut microbiome composition, and inflammation are crucial factors in diabetes development and progression.
The ReLU activation function-based revised training results of the ANN34 model demonstrate a notable enhancement in the model’s performance. Within 5–10 epochs, the training and validation losses converge gradually to almost zero, suggesting effective learning and less overfitting. The training and validation accuracy graphs show a tight alignment, both varying between 60% and 70%, according to the accuracy graphs. This small gap indicates good generalization to unknown data, which is a distinct improvement over the prior version. Furthermore, after regularization or hyperparameter adjustment, the validation accuracy is consistent and closely matched, indicating a stronger model and verifying the improved performance and dependability of the model.
Because this study is cross‑sectional and exploratory, the observed associations between microbiome composition and metabolic outcomes cannot establish causality. Only longitudinal or interventional studies can determine whether microbiome changes may be biomarkers of the development of T2D or result from it. Our findings should therefore be interpreted as hypothesis‑generating, requiring replication and confirmation in independent cohorts.
Future Research
The role of the gut microbiota in both the development and management of type 2 diabetes (T2D) has gained substantial attention in recent years14. Chronic inflammation and insulin resistance, two important variables in the development of type 2 diabetes, have been connected to dysbiosis, an imbalance in the gut microbiota. According to studies, depending on their variety and abundance, specific bacterial strains in the gut can either improve or correlate with the outcomes of diabetes by producing metabolites such as short-chain fatty acids that can affect immunological responses and glucose metabolism. For example, certain probiotics have demonstrated potential in assisting diabetic patients in managing their blood glucose levels.
A potential link between dysbiosis in the gut microbiota and the development of type 2 diabetes has also been revealed by a recent study that used Mendelian randomization techniques41. Researchers verified links between specific microbial families and the incidence of type 2 diabetes by examining genetic markers in a variety of groups, highlighting the gut microbiota as a changeable element that may be targeted for diabetes prevention and management. In the future, the area is heading towards personalized42 medicine techniques that could allow for the customization of microbiome-based treatments for each patient according to their gut microbiota patterns.
Behavioral traits such as aggression may be modulated by the gut-brain axis, which has been shown to play a critical role in neurobehavioral regulation40. To advance understanding of microbiota-host dynamics and uncover novel therapeutic targets within the gut ecosystem, future studies may investigate the integration of fecal microbiota transplantation, probiotics, and prebiotics into diabetes management approaches. With continued research assisting in a better understanding and utilization of the microbiome’s involvement in metabolic health, these developments point to a bright future for microbiome-based therapies aimed at regulating type 2 diabetes.
Building on the current findings, the second phase of this study will focus on exploring non-invasive approaches to assess gut microbial shifts linked to type 2 diabetes. To examine the relationship between microbial composition and glucose metabolism, microbial DNA analysis from stool samples will serve as a foundational technique43. This phase will also aim to engage with large-scale initiatives such as the MiBioGen collaboration, which aggregates microbiome data and has investigated links between gut microbial profiles and type 2 diabetes14. In addition, partnerships with biotech companies specializing in microbiome therapeutics may provide access to sequencing instruments, data processing software, and other resources that could significantly support the expansion of this research.
Limitations
This study has several limitations that should be considered when interpreting the findings. The dataset was derived from publicly available metagenomic resources, which provided breadth but limited demographic detail (age, sex, BMI only), restricting generalizability. Subgroup analyses were underpowered, particularly for medication effects, with only 22 participants reporting treatment data. The cross-sectional design prevents causal inference, so associations should be interpreted as correlational and hypothesis-generating. Statistical assumption checks revealed departures from normality and covariance homogeneity in MANOVA; we therefore relied on Pillai’s Trace for robustness and emphasized effect sizes rather than p‑values alone. Machine learning performance was modest, with the decision tree failing to classify impaired glucose tolerance cases and the ANN achieving only moderate accuracy, underscoring challenges with imbalanced microbiome datasets. Finally, preprocessing decisions such as harmonizing variable names and imputing missing values may introduce bias, though these steps were necessary for consistency. Taken together, these limitations highlight the exploratory nature of the study and the need for larger, more balanced cohorts with detailed demographic and clinical data to validate and extend these findings.
Data Availability
The datasets analyzed in this study are publicly available from the Segata Lab GitHub repository (https://github.com/SegataLab/metaml/tree/master/data) Pasolli22 et al. The original data were generated by the Human Microbiome Project Consortium20. Analysis code is available from the corresponding author upon reasonable request.
References
- B. B. Duncan, D. J. Magliano, E. J. Boyko. IDF diabetes atlas 11th edition 2025: Global prevalence and projections for 2050. Nephrology Dialysis Transplantation. Advance online publication(2025). [↩]
- A. Barlow, V. Mathur. Type 2 diabetes and the microbiome. Journal of the Endocrine Society, 7, 1–12 (2023). [↩]
- Han Lab. Gut microbiome schematic. https://thehanlab.com/publications (2024). [↩] [↩] [↩]
- X. A. Singh. The science of digestion: Importance of healthy digestion for nutrient absorption and disease prevention. Journal of Hepatology and Gastrointestinal Disorders, Short Communication (2014). [↩]
- X. R. Joos, K. Boucher, A. Lavelle, M. Arumugam, M. J. Blaser, M. J. Claesson, G. Clarke, P. D. Cotter, L. De Sordi, M. G. Dominguez-Bello, B. E. Dutilh, S. D. Ehrlich, T. S. Ghosh, C. Hill, C. Junot, L. Lahti, T. D. Lawley, T. R. Licht, E. Maguin, T. P. Makhalanyane, J. R. Marchesi, J. Matthijnssens, J. Raes, J. Ravel, A. Salonen, P. D. Scanlan, A. Shkoporov, C. Stanton, I. Thiele, I. Tolstoy, J. Walter, B. Yang, N. Yutin, A. Zhernakova, H. Zwart. Examining the healthy human microbiome concept. Nature Reviews Microbiology, 22, 707–720 (2024). [↩] [↩]
- K. Rogers. Fatty acid: Definition, structure, functions, properties, & examples. https://www.britannica.com/science/fatty-acid (2019). [↩] [↩]
- A. B. Shreiner, J. Y. Kao, V. B. Young. The gut microbiome in health and disease. Current Opinion in Gastroenterology. Vol. 31, pg. 69–75, (2015). [↩]
- A. M. Valdes, J. Walter, E. Segal, T. D. Spector. Role of the gut microbiota in nutrition and health. British Medical Journal (BMJ). Vol. 361, pg. k2179, (2018). [↩]
- L. Zhao, F. Zhang, X. Ding, Y. Wang. Dysbiosis and metabolic deregulation: The role of gut microbiota in endocrine disorders. Frontiers in Endocrinology, 13, Article 1001234 (2022). [↩]
- X. Q. Tang, G. Jin, G. Wang, T. Liu, X. Liu, B. Wang, H. Cao. Current sampling methods for gut microbiota: A call for more precise devices. Frontiers in Cellular and Infection Microbiology, 10, Article 151 (2020). [↩]
- J. Qin, Y. Li, Z. Cai, S. Li, J. Zhu, F. Zhang, S. Liang, W. Zhang, Y. Guan, D. Shen, Y. Peng, D. Zhang, Z. Jie, W. Wu, Y. Qin, W. Xue, J. Li, L. Han, J. Lu, P. Wu, Y. Dai, Y. Sun, Z. Li, A. Tang, S. Zhong, X. Li, W. Chen, R. Xu, M. Wang, Q. Feng, M. Gong, J. Yu, Y. Zhang, M. Zhang, T. Hansen, G. Sanchez, J. Raes, G. Falony, S. Okuda, M. Almeida, E. LeChatelier, P. Renault, N. Pons, J. M. Batto, T. Zhang, H. Chen, R. Yang, J. Zheng, S. Li, H. Yang, J. Wang, S. Ehrlich, K. Kristiansen. A metagenome‑wide association study of gut microbiota in type 2 diabetes. Nature, 490, 55–60 (2012). [↩]
- M. Gurung, Z. Li, H. You, R. Rodrigues, Q. Cao. Role of gut microbiota in type 2 diabetes pathophysiology: Insights from microbial signatures. Nature Medicine, 26, 1576–1583 (2020) [↩]
- M. Camilleri. Gastrointestinal complications of diabetes. Gastroenterology, 152, 1679–1693 (2017). [↩]
- O. Okobi. The role of gut microbiota in the development of type 2 diabetes mellitus. Medical Research Archives, 12, Article 5454 (2024). [↩] [↩] [↩]
- M. D’Alessio, J. M. Gonzalez, T. R. Patel. The gut microbiota and diabetes: Clarity on an evolving relationship. Diabetes Care, 47, 1489–1499 (2024). [↩]
- M. N. Sikalidis, J. Maykish. Gut microbiome and type 2 diabetes mellitus: Insights into pathophysiology and therapeutic potential. Biomedicines, 8, 8–22 (2020). [↩]
- J. Qin, R. Li, J. Raes, M. Arumugam, K. S. Burgdorf, C. Manichanh, T. Nielsen, N. Pons, F. Levenez, Y. Yamada, D. Mende, J. Li, J. Xu, S. Li, D. Li, J. Cao, B. Wang, H. Liang, H. Zheng, Y. Xie, J. Tap, M. Lepage, M. Bertalan, J. M. Batto, T. Hansen, D. Le Paslier, A. Linneberg, H. B. Nielsen, E. Pelletier, P. Renault, T. Sicheritz‑Ponten, K. Turner, H. Zhu, C. Yu, S. Li, M. Jian, Y. Zhou, Y. Li, X. Zhang, S. Li, N. Qin, H. Yang, J. Wang, S. Brunak, J. Doré, F. Guarner, K. Kristiansen, O. Pedersen, J. Parkhill, J. Weissenbach, H. Bork, S. D. Ehrlich, J. Wang. A human gut microbial gene catalogue established by metagenomic sequencing. Nature, 464, 59–65 (2010). [↩]
- J. Qin, Y. Li, Z. Cai, S. Li, J. Zhu, F. Zhang, S. Liang, W. Zhang, Y. Guan, D. Shen, Y. Peng, D. Zhang, Z. Jie, W. Wu, Y. Qin, W. Xue, J. Li, L. Han, J. Lu, P. Wu, Y. Dai, Y. Sun, Z. Li, A. Tang, S. Zhong, X. Li, W. Chen, R. Xu, M. Wang, Q. Feng, M. Gong, J. Yu, Y. Zhang, M. Zhang, T. Hansen, G. Sanchez, J. Raes, G. Falony, S. Okuda, M. Almeida, E. LeChatelier, P. Renault, N. Pons, J. M. Batto, T. Zhang, H. Chen, R. Yang, J. Zheng, S. Li, H. Yang, J. Wang, S. Ehrlich, K. Kristiansen. A metagenome‑wide association study of gut microbiota in type 2 diabetes. Nature, 490, 55–60 (2012). [↩]
- O. Okobi. The role of gut microbiota in the development of type 2 diabetes mellitus. Medical Research Archives, 12, Article 5454 (2024). [↩] [↩]
- Human Microbiome Project Consortium. Structure, function and diversity of the healthy human microbiome. Nature. Vol. 486, pg. 207–214 (2012). [↩] [↩]
- E. Pasolli, D. T. Truong, F. Malik, L. Waldron, N. Segata. Machine learning meta-analysis of large metagenomic datasets: Tools and biological insights. PLOS Computational Biology, 12, e1004977 (2016). [↩] [↩] [↩]
- E. Pasolli, D. T. Truong, F. Malik, L. Waldron, N. Segata. Machine learning meta-analysis of large metagenomic datasets: Tools and biological insights. PLOS Computational Biology, 12, e1004977 (2016). [↩] [↩] [↩] [↩] [↩] [↩] [↩]
- C. Wunderle, E. Martin, A. Wittig, P. Tribolet, T. A. Lutz, C. Köster-Hegmann, Z. Stanga, B. Mueller, P. Schuetz. Comparison of the inflammatory biomarkers IL-6, TNF-α, and CRP to predict the effect of nutritional therapy on mortality in medical patients at risk of malnutrition. Journal of Inflammation 22, Article 16 (2025). [↩] [↩]
- H. M. Seidler, A. J. Salinas, J. R. Marchesi, P. D. Cotter. Gut microbial biofilms and their role in health and disease. Nature Reviews Microbiology, 20, 353–368 (2022). [↩]
- R. Zhou, S. K. Ng, J. J. Y. Sung, W. W. B. Goh, S. H. Wong. Data pre-processing for analyzing microbiome data – a mini review. Computational and Structural Biotechnology Journal, 21, 4804–4815 (2023). [↩] [↩] [↩]
- D. T. Truong, E. A. Franzosa, T. L. Tickle, M. Scholz, G. Weingart, E. Pasolli, A. Tett, C. Huttenhower, N. Segata. MetaPhlAn2 for enhanced metagenomic taxonomic profiling. Nature Methods, 12, 902–903 (2015). [↩] [↩]
- Y. Zhang, G. Parmigiani, W. E. Johnson. ComBat-seq: batch effect adjustment for RNA-seq count data. NAR Genomics and Bioinformatics. Vol. 2, pg. lqaa078 (2020). [↩]
- The pandas development team. pandas-dev/pandas: pandas [software]. Zenodo (2020). [↩]
- P. C. Y. Woo, S. K. P. Lau, J. L. L. Teng, H. Tse, K. H. Chan, K. Y. Yuen. Bacteremia due to Clostridium hathewayi and review of the literature. Journal of Clinical Microbiology, 42, 530–534 (2004). [↩]
- S. H. Duncan, G. Holtrop, A. G. Calder, C. S. Stewart, H. J. Flint. Proposal of Roseburia inulinivorans sp. nov., a novel saccharolytic, butyrate‑producing bacterium from human faeces. International Journal of Systematic and Evolutionary Microbiology, 56, 2437–2441 (2006). [↩]
- J. M. Utts, R. F. Heckard. Mind on Statistics (2nd ed.). Brooks/Cole (2006). [↩] [↩] [↩]
- J. M. Utts, R. F. Heckard. Mind on Statistics (2nd ed.). Brooks/Cole (2006). [↩]
- J. R. Quinlan. Induction of decision trees. Machine Learning, 1, 81–106 (1986). [↩] [↩] [↩] [↩]
- A. Bahmer, D. Gupta, F. Effenberger. Modern artificial neural networks: Is evolution cleverer? Neural Computation, 35, 765–780 (2023). [↩] [↩] [↩] [↩] [↩] [↩]
- A. P. Field. Discovering Statistics Using IBM SPSS Statistics (5th ed.). Sage Publications (2017). [↩]
- L. Qu, Y. Pei. A comprehensive review on discriminant analysis for addressing challenges of class-level limitations, small sample size, and robustness. Processes, 12(7), 1382 (2024). [↩]
- D. J. James, D. Witten, T. Hastie, R. Tibshirani. An Introduction to Statistical Learning: With Applications in R (2nd ed.). Springer (2021). [↩]
- D. J. James, D. Witten, T. Hastie, R. Tibshirani. An Introduction to Statistical Learning: With Applications in R (2nd ed.). Springer (2021). [↩]
- O. Demir-Kavuk, M. Kamada, T. Akutsu, E.-W. Knapp. Prediction using step-wise L1, L2 regularization and feature selection for small data sets with large number of features. BMC Bioinformatics, 12, Article 412 (2011). [↩]
- J. F. Cryan, K. J. O’Riordan, C. S. Cowan, T. F. Sandhu, G. Bastiaanssen, M. Boehme, M. Codagnone, A. Cussotto, M. Fulling, A. Golubeva, R. Guzzetta, P. M. Jaggar, A. M. Long‑Smith, G. Moloney, R. Moya‑Pérez, E. O’Leary, J. V. Sherwin, T. D. Moloney, G. Clarke, T. G. Dinan. The microbiota–gut–brain axis. Physiological Reviews, 99, 1877–2013 (2019). [↩] [↩]
- K. Sun, G. Yan, H. Wu, X. Huang. The causal relationship between gut microbiota and type 2 diabetes: A two-sample Mendelian randomized study. Frontiers in Public Health, 11, Article 1255059 (2023). [↩]
- J. Wang, Y. Li, J. Qin, J. Li, Y. Zhang, J. Yu, J. Parkhill, J. Weissenbach, H. Bork, S. D. Ehrlich, K. Kristiansen. Gut microbiome and type 2 diabetes: Integrating genetic markers and personalized nutrition strategies. Nature Medicine, 27, 155–164 (2021). [↩]
- J. Qin, Y. Li, Z. Cai, S. Li, J. Zhu, F. Zhang, S. Liang, W. Zhang, Y. Guan, D. Shen, Y. Peng, D. Zhang, Z. Jie, W. Wu, Y. Qin, W. Xue, J. Li, L. Han, J. Lu, P. Wu, Y. Dai, Y. Sun, Z. Li, A. Tang, S. Zhong, X. Li, W. Chen, R. Xu, M. Wang, Q. Feng, M. Gong, J. Yu, Y. Zhang, M. Zhang, T. Hansen, G. Sanchez, J. Raes, G. Falony, S. Okuda, M. Almeida, E. LeChatelier, P. Renault, N. Pons, J. M. Batto, T. Zhang, H. Chen, R. Yang, J. Zheng, S. Li, H. Yang, J. Wang, S. Ehrlich, K. Kristiansen. A metagenome‑wide association study of gut microbiota in type 2 diabetes. Nature, 490, 55–60 (2012). [↩]


