
Abstract
Reliance on traditional energy sources, such as fossil fuels, has recently become less viable as concerns of climate change and energy security rise. This has led to the creation of new energy sources such as solar, wind, and battery technologies. To support these technologies, many governments worldwide have begun utilizing subsidy mechanisms to expedite the growth of these technologies and promote widespread adoption. Current literature shows that government subsidies are not necessarily essential for similar new technologies. This paper examines qualitative and quantitative data from the European Union to assess the impact of government subsidies on the development of clean energy technologies. The findings of this paper reveal that subsidies in the European Union have a stronger relative association with renewable energy production than with renewable energy consumption. As a result, subsidies could potentially help narrow existing shortages in the renewable energy market in the EU. Conversely, many newer technologies would benefit from international policy support to encourage development and adoption, similar to what is outlined in the technological innovation systems theory. This paper also discusses patterns of policy diffusion that exist in subsidies supporting clean energy technologies, and by coordinating policy efforts, governments can expedite the development of new energy technologies.
Keywords: Government Policies, Subsidies, Energy, Sustainability, Renewable Energy
Introduction
The transition from fossil fuels to clean energy technologies has recently become a central focus of international policy due to decreasing clean energy costs, concerns about climate change, and long-term energy security. Governments around the world have implemented subsidies and policy incentives to accelerate the adoption of renewable energy technologies such as solar, wind, and battery storage. However, as renewable technologies develop and production costs decline, an important question emerges regarding whether continued government support is necessary for long-term product viability.
Existing literature has explored the effectiveness of renewable energy subsidies and the role of government intervention in promoting technological adoption. Papers such as Grossman and Sykes (2025)1 examine the role of industrial policy and the evolving international framework controlling government subsidies, while Ang et al. (2022)2 discuss the development, benefits, and remaining technical challenges of renewable energy technologies. This literature generally finds that early-stage subsidies can accelerate technological learning and cost declines, but there remains debate regarding the long-term dependence of clean energy sectors on government support. While prior research has often focused on individual technologies or single policy instruments, fewer studies combine multiple technology-specific policy histories with cross-country quantitative analysis to examine broader renewable energy outcomes.
This paper contributes to the literature by examining how government subsidies are associated with the development of solar, wind, and battery technologies across the European Union over the past 15 years. The analysis combines qualitative policy timelines with quantitative panel data on renewable energy production, renewable energy consumption, and environmental subsidy levels. Using data from Eurostat, the International Energy Agency (IEA), and the Organisation for Economic Co-operation and Development (OECD) climate policy database, this study constructs measures of renewable energy usage and government support across countries and time. This empirical approach applies a panel regression model with fixed effects and robust standard errors to estimate the relationship between subsidies and renewable energy outcomes, while controlling for macroeconomic and climate-related factors such as gross domestic product (GDP) per capita, energy prices, and heating and cooling degree days.
The analysis shows that EU government subsidies have a stronger positive association on the share of renewable energy production than the share of renewable energy consumption.
The findings have several policy implications. As renewable technologies advance, policymakers may consider transitioning from broad financial subsidies toward more targeted support for emerging technologies and infrastructure development. Later figures in this paper will show how solar and wind technologies, for example, are more heavily invested in and have been supported by subsidies for much longer than newer technologies such as battery technologies. These results also suggest that coordinated policy design across countries may enhance innovation spillovers, strengthen supply chains, and accelerate the development of and investment in clean energy technologies.
Literature Review
This paper sits within two distinct branches of literature. The first branch shows how subsidies operate in the context of evolving technologies and politics, while the second examines recent developments in clean energy markets and the economic conditions shaping industry growth. This paper thus provides a comparison by linking research on government subsidy design and renewable energy production and consumption behavior to evaluate if subsidy structures are associated with measurable changes in renewable energy outcomes.
Government Subsidies
Many researchers have discussed how government subsidies are decided and have reported multiple different relevant factors. First, Schwartz et al. (1995)3 explained that subsidies are commonly used to correct market imperfections and to exploit economies of scale to bolster financial growth. The research by Schwartz et al. also mentions that subsidies can be used to meet quotas and stabilize the economy in times of uncertainty or during a recession. This goal is not often achieved through subsidies as they can frequently provide uneven support due to class disparities. Although the paper was published over 30 years ago, the themes of government subsidies remain relevant in a modified form despite evolving markets. Policy can also be motivated when markets misallocate resources due to externalities, distortions, or coordination problems4. Lashkaripour and Wu (2025)4 explains one of the more general uses of subsidies and shows how private decisions often fail to maximize social benefits. This idea is echoed by Meckling et al. (2015)5 which investigates how subsidies create beneficiaries that can lobby for policy continuation. It also analyzes how domestic decisions are made in relation to international affairs. While international climate commitments help motivate domestic policy, domestic political coalitions largely determine policy adoption. These three papers provide a fundamental foundation of how subsidies function and why subsidies are implemented along with the results they are intended to accomplish.
Government subsidies take many forms and, although typically established by governments, are administered through a variety of firms and institutions. This idea is explained by Cantner et al. (2009)6 who analyzes startup datasets to try to identify which startup firms receive Research and Development (R&D) subsidies and which don’t. Cantner et al. shows that evidence for strong targeting is limited, as some subsidies go to firms that may have succeeded anyway, while other subsidies help firms that might not have been able to innovate without support. The study finds weaker-than-expected selection effects, suggesting that subsidies are not consistently directed toward the highest-potential firms. This helps explain the growing use of R&D subsidies, particularly tax incentives and direct grants, which are very different from less selective subsidies such as output-based subsidies. Along with this, OECD (2023)7 indicates that governments increasingly combine direct funding with tax relief and that R&D tax incentives have become a more prominent instrument for supporting business innovation.
The final piece of the government subsidies branch that is important to examine is how subsidies have changed and developed over time, as technology has been rapidly evolving over the past few decades. Grossman and Sykes (2025)1 examine how policy and subsidies have recently changed, and what could possibly improve in the future. The paper argues that subsidies with negative international spillovers should be limited to avoid generating externalities. It also encourages thinking about subsidies as part of a global strategy and explains how they can be disputed internationally. It is shown how over time, countries choose to pursue different agendas, and this strongly influences the areas that policy is directed towards. It can be concluded that politics has a strong impact on subsidies, and Slattery (2024)8 further emphasizes this point in a paper showing how politicians target subsidies toward electorally valuable locations. Using a case study, Slattery explains how there are many instances in which subsidies are given to secure more support for politicians and this limitation is important to keep in mind when examining this branch of literature.
Renewable Energy
While the previous branch of literature explains why governments introduce subsidies and how subsidy programs evolve, this branch explains the mechanisms through which those policies influence technological development, cost reductions, and market competitiveness. Existing literature demonstrates importance and purpose of clean energy along with the goals it is trying to accomplish. Ang et al. (2022)2 detail how new types of energy each have strengths and weaknesses that come along with their implementation. Renewable energy deployment has expanded rapidly for a wide variety of reasons, including the environmentally friendly benefits that it offers to the consumer. However, Ang et al.2 show how technical challenges like energy conversion efficiency remain a significant barrier to the development of technologies. Similarly, Sharma et al. (2024)9 emphasize the importance of clean energy in the pursuit of a more sustainable population. The authors describe these technologies as low-carbon alternatives that are necessary to meet global climate goals. Despite this, it is acknowledged that high upfront costs can pose issues, especially for developing countries. Both papers argue similar things, showing how researchers typically agree that the purpose of clean energy is to create a more sustainable world, although there are limitations pertaining to high costs.
Despite these high costs, there are multiple benefits that can be seen from clean energy development. As shown by the International Renewable Energy Agency or IRENA, utility-scale battery storage costs dropped by almost 93% over the last 14 years, showing a great increase in the affordability of battery technology10. Solar and wind technology also had sharp decreases in price over the same period, indicating that these technologies have experienced significant cost reductions associated with large-scale commercial deployment. Renewables also helped save almost 470 billion US dollars in fossil fuel costs in 2024, demonstrating both economic and environmental benefits. Similarly, Fankhauser et al. (2025)11 discusses how renewable energy has had more benefits than just environmental and cost efficiency. While this source also notes that these benefits are apparent, it also details how renewable energy projects generate local economic benefits through jobs, supply-chain activity, and interaction with regional economies. Finally, Farah and Andresen (2023)12 show that as solar and wind shares rise, the marginal value of storage increases sharply, demonstrating the increasing economic value of energy storage as renewable energy shares rise. However, this source also reports that not all improvements are equal, and some technical improvements can hurt the affordability of these technologies.
Overall, the literature suggests a common mechanism through which government intervention influences renewable energy development. Schwartz et al. (1995)3 and Lashkaripour & Wu (2025)4 demonstrate how market failures, externalities, and coordination problems typically cause subsidies that encourage innovation, investment, and early deployment of renewable technologies. As deployment increases, IRENA (2025)10 shows how learning effects and economies of scale reduce production costs, contributing to technology growth and improved market competitiveness. At the same time both Meckling et al. (2015)5 and Slattery (2024)8 show that political incentives and institutional factors influence both the adoption and persistence of subsidy programs. With this literature, the rest of the paper examines whether this progression is reflected in renewable energy outcomes across European Union (EU) countries and how renewable technologies have interacted in the past with EU subsidies.
Context
To contextualize the analysis, it is important to examine the global investment in different types of energy. It is also critical to understand the average investments in different types of energy across different countries and economies to show how this technology has grown over time. To do this, we turn to the IEA data displayed in Figure 1, which shows recent investment in power generation.
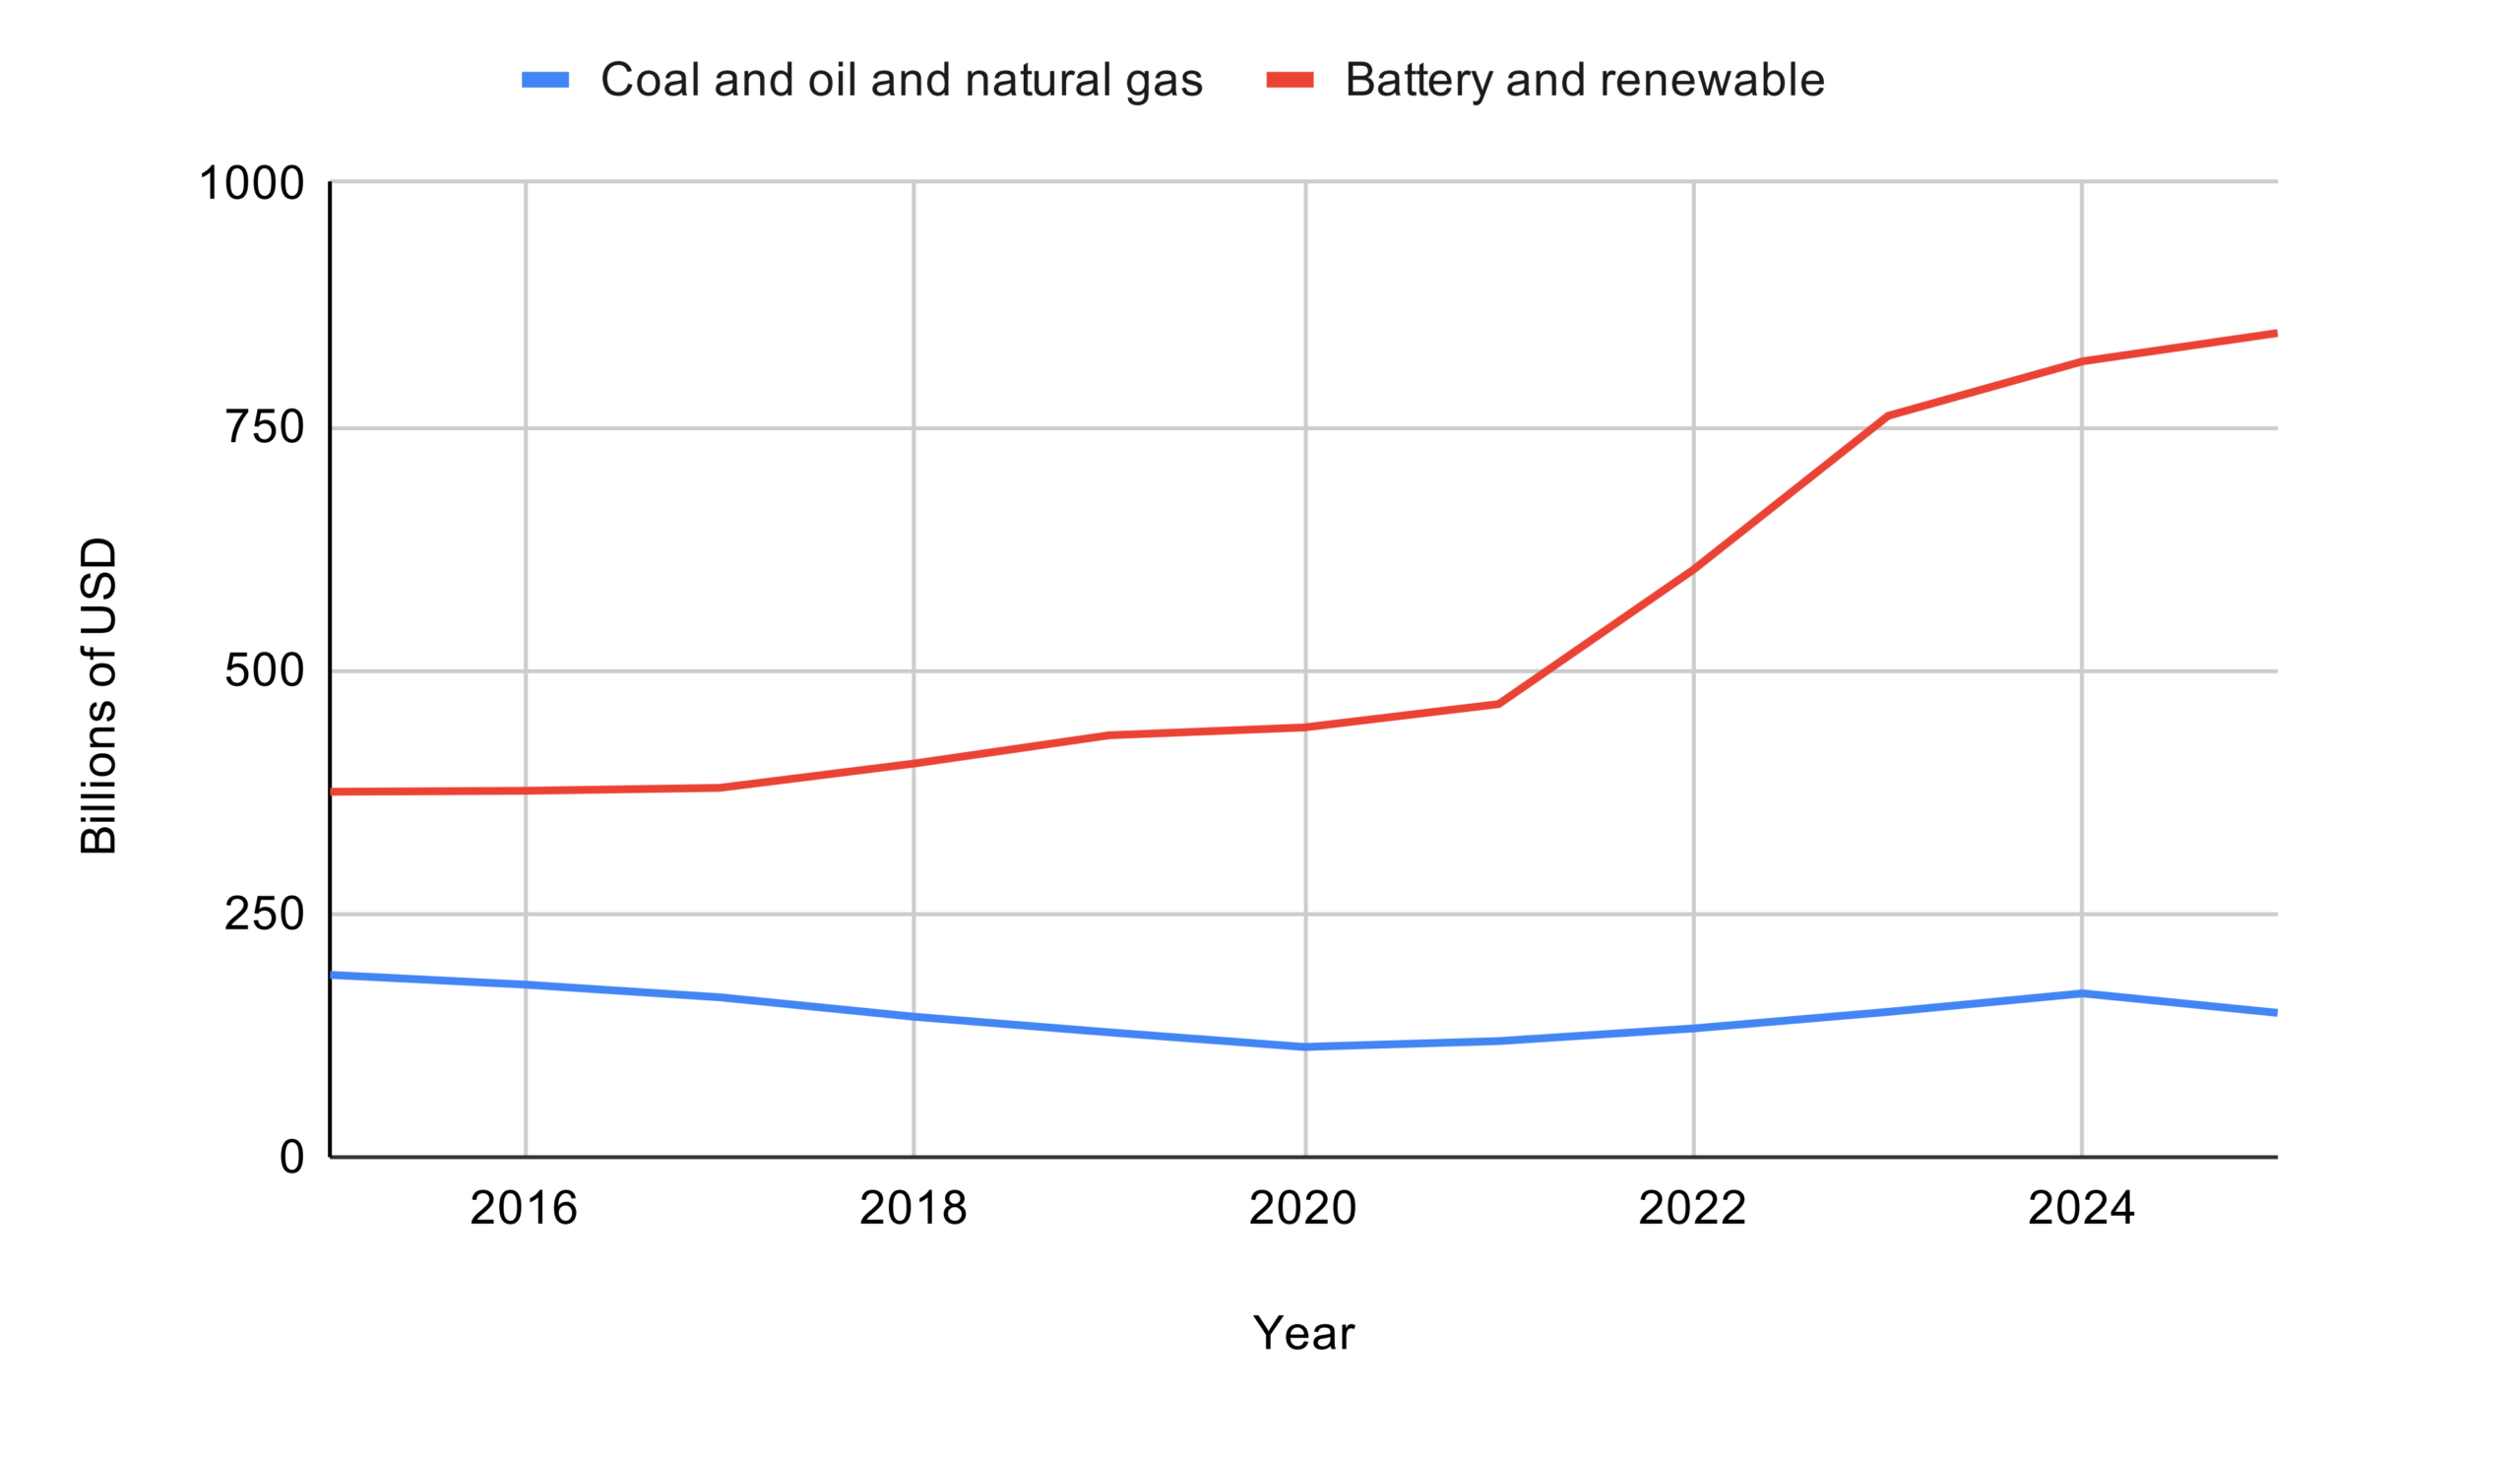
Figure 1 compares global investment in renewable energy and battery storage with investment in fossil fuel-based power generation such as coal, oil, and natural gas. Renewables here include solar power, wind power, and “others”, which is defined as bioenergy, geothermal, hydropower, marine energy, and renewable waste14. Investment levels across these categories remained relatively similar until around 2021, when spending on renewable power and battery storage increased substantially, rising by approximately 77% over the following two years. This shift may reflect both the IEA’s Net Zero by 2050 report and the 2021 global energy crisis, which showed governments that they could not solely rely on volatile fossil fuel markets, for the sake of national security15. Figure 2 shows how different groups of countries across the world have been utilizing different forms of renewable energy as a percentage of the total energy they consume. The IEA defines advanced economies as the OECD regional grouping along with Bulgaria, Croatia, Cyprus, Malta, and Romania, while emerging markets are defined as every country that the agency covers not included in the advanced economies and excluding China as well14.
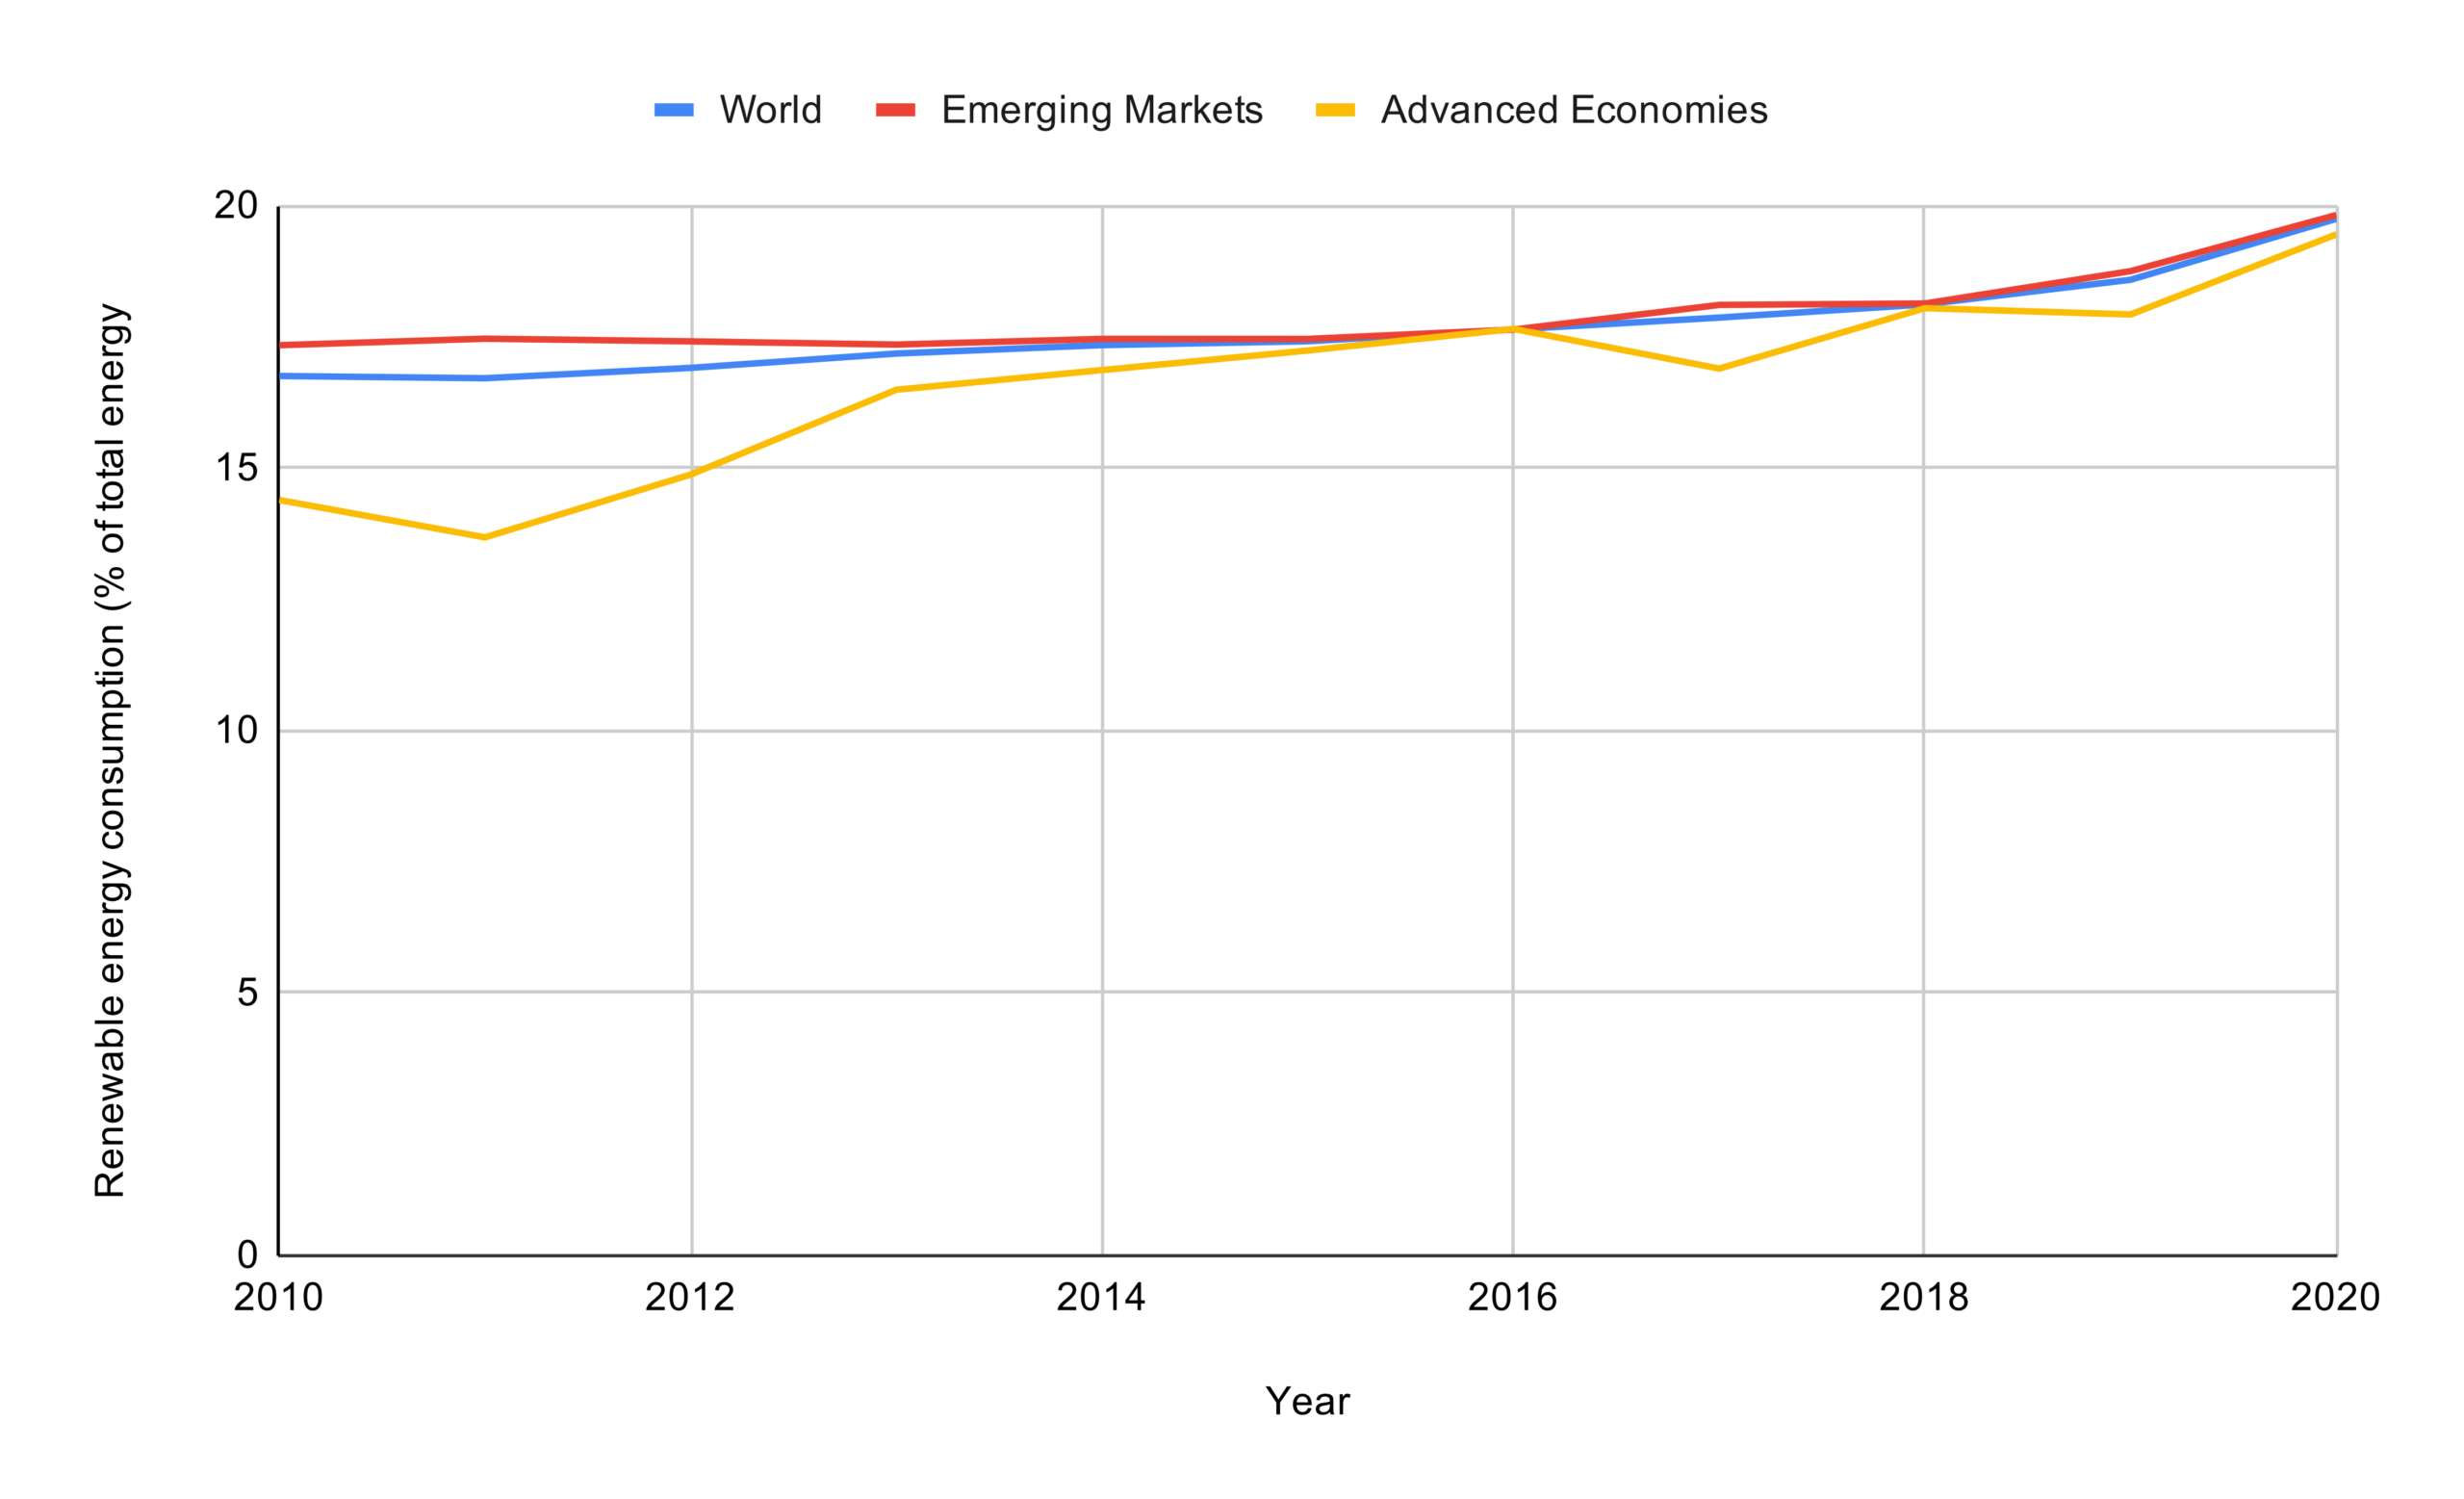
Figure 2 details how the advanced economies were slower to begin largely utilizing clean energy as a main energy source. Despite this, as of 2020, both advanced economies and developing market economies have been using a similar percentage of renewable energy. This leads to Figure 3, which shows how the production of renewable energy has increased from 2010 to 2021.
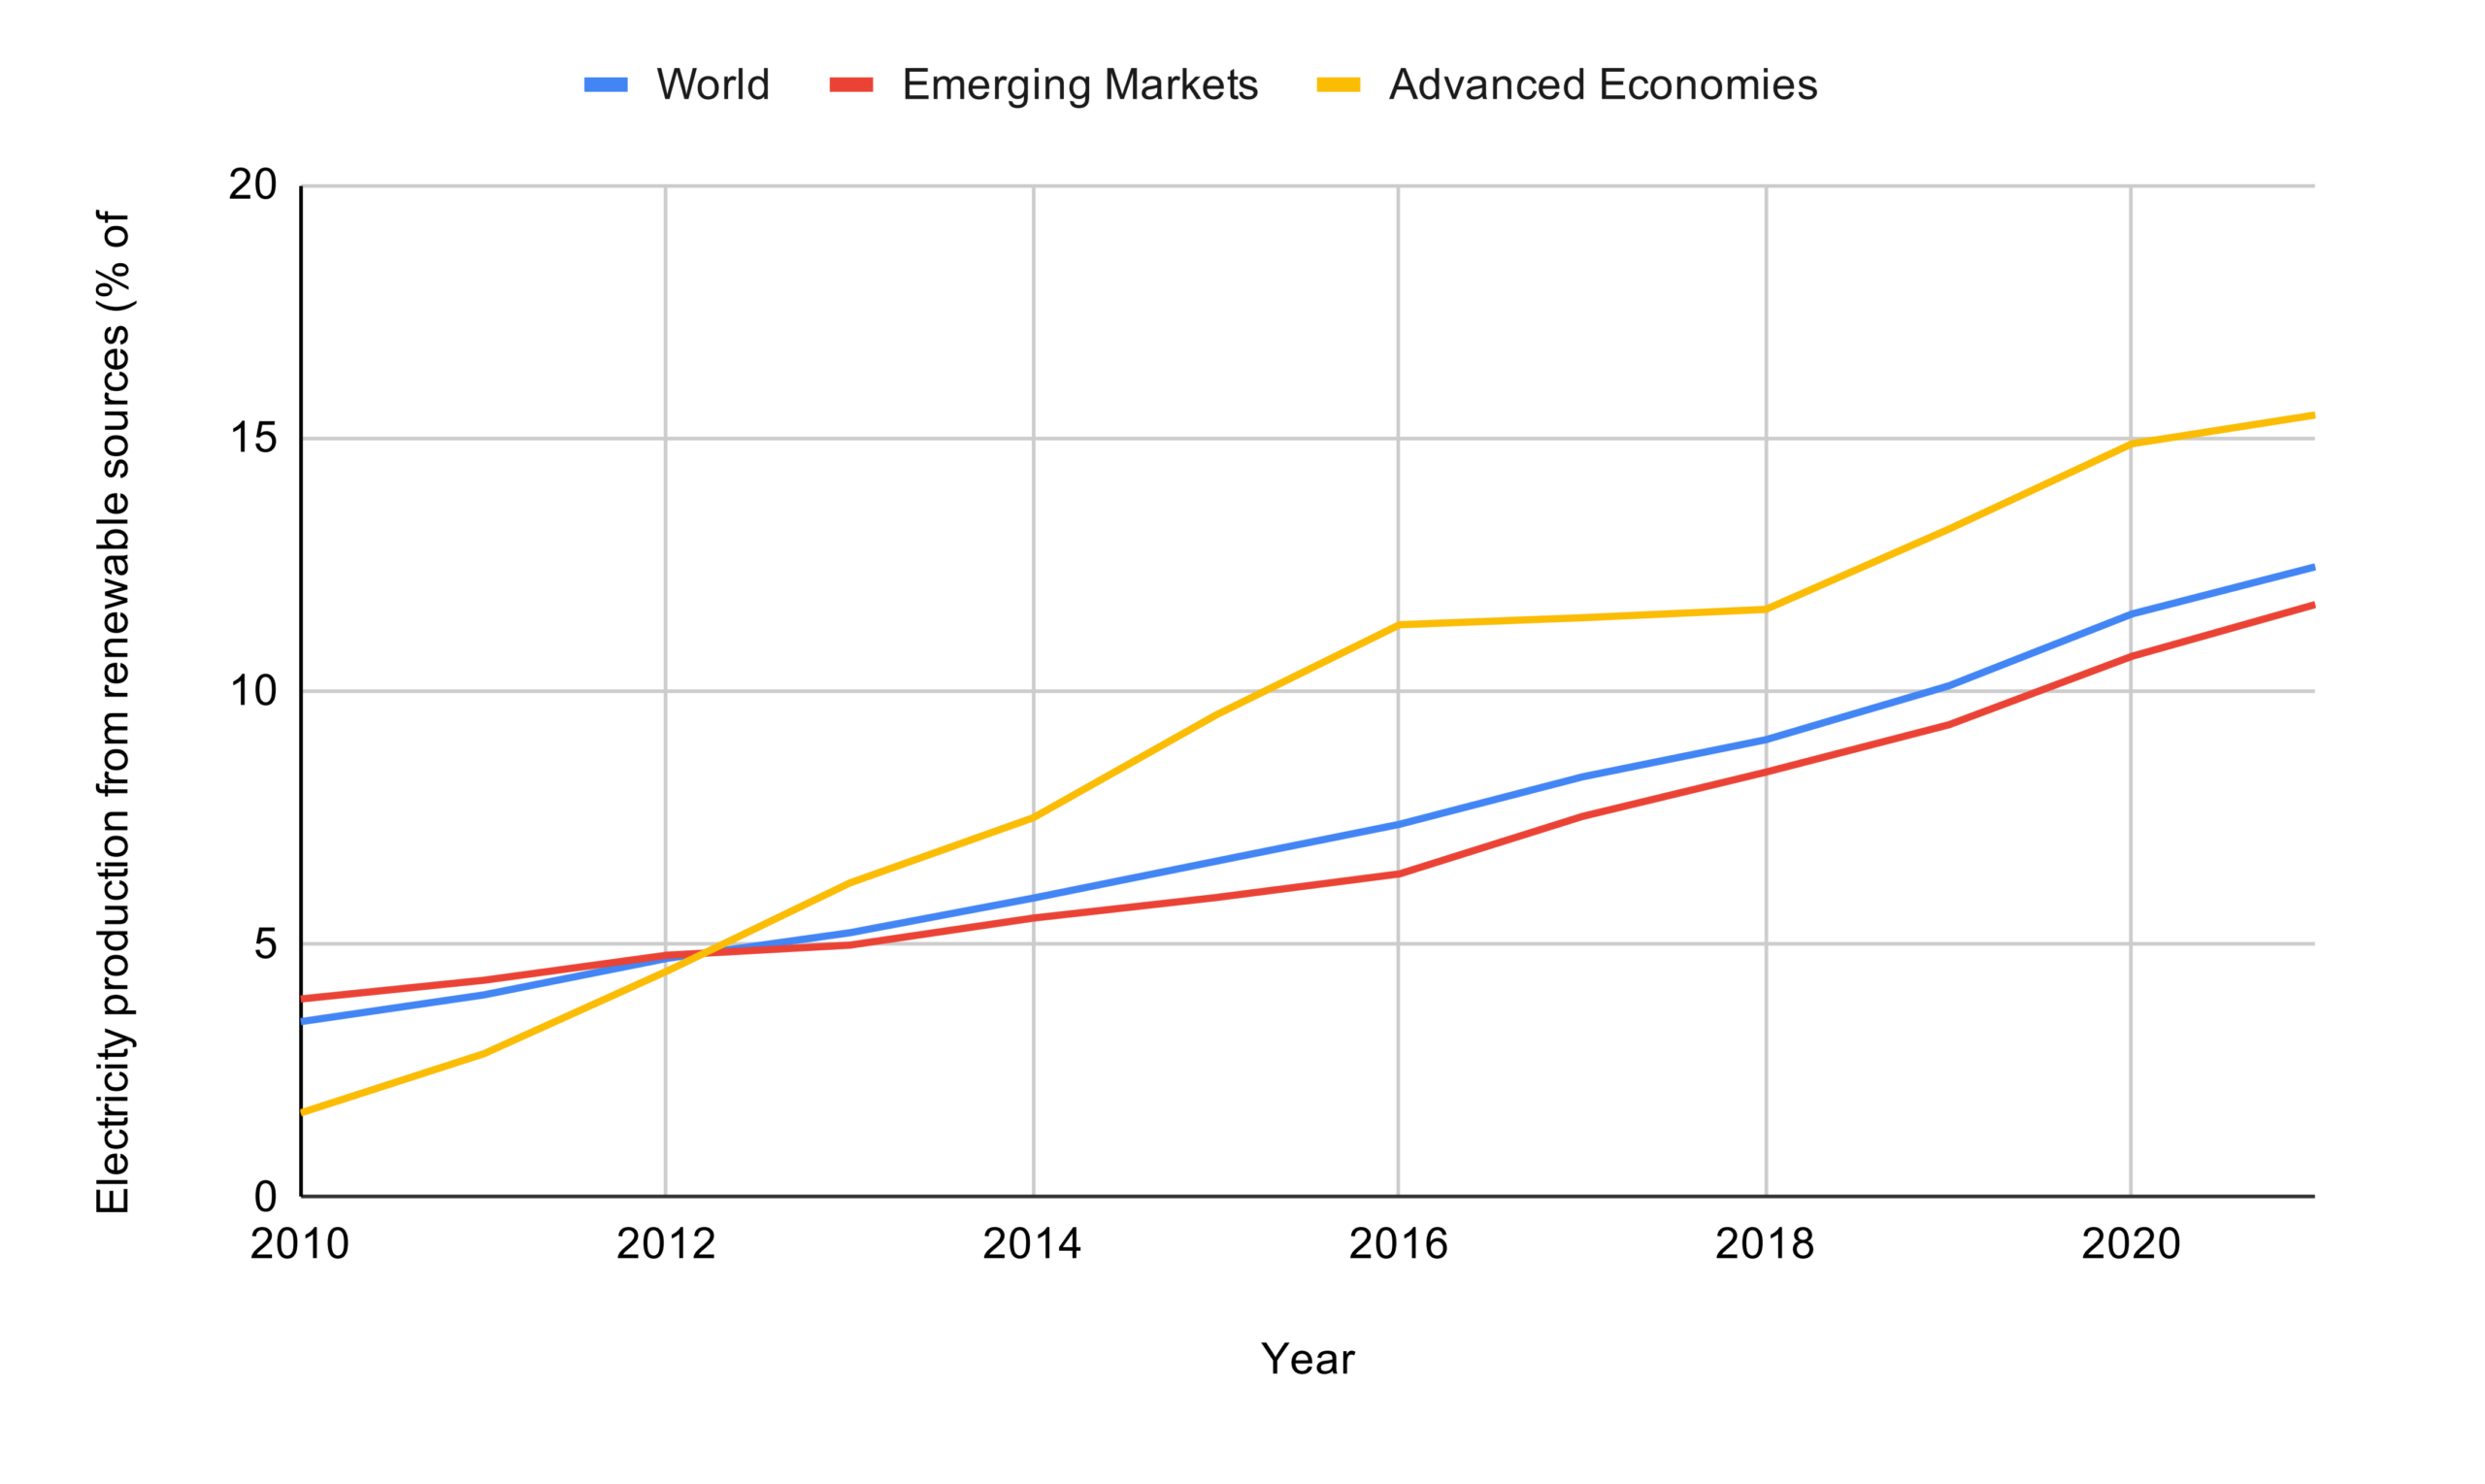
In Figure 3, the production across both emerging market economies and advanced economies has increased. Similar to Figure 2, production in the emerging market economies started slower compared to the rest of the world. However, clean energy production has now greatly increased, and it is higher in advanced economies than in the rest of the world.
Analysis
Variables
This paper’s data set covers 18 European countries and contains annual data from 2010 to 2024. This section contains the analysis of this paper and quantifies the effects of government environmental subsidies on renewable energy consumption and production. The section begins by introducing the variables that are used in the analysis and what they mean for environmental technologies and policy.
| Abbreviation | Variable | Description |
| energy_consumption | Renewable Energy consumption (% of total final energy consumption) | The percentage of all domestically consumed energy in a country that originates from renewable sources16. |
| energy_production | Renewable Electricity Output (% of total electricity output) | The percentage of all domestically produced energy in a country that originates from renewable sources17. |
| subsidies | Environmental subsidies and transfers from general government | Domestic public funds provided by national or regional governments to support environmental and renewable-energy activities18. |
| H&C_days | Heating and Cooling Degree Days | A measure of total number of days where temperatures deviate from comfort levels, indicating either climate-driven heating or cooling demand19. |
| GDP | GDP Per Capita | A country’s gross domestic product divided by its population, reflecting average income and development level20. |
| price_taxed | Taxed Price of electricity and gas for consumers | The ratio between prices that households pay for electricity and natural gas, including all taxes and levies21. |
| price_untaxed | Untaxed price of electricity and gas for consumers | The ratio between prices that households pay for electricity and natural gas, excluding all taxes and levies22. |
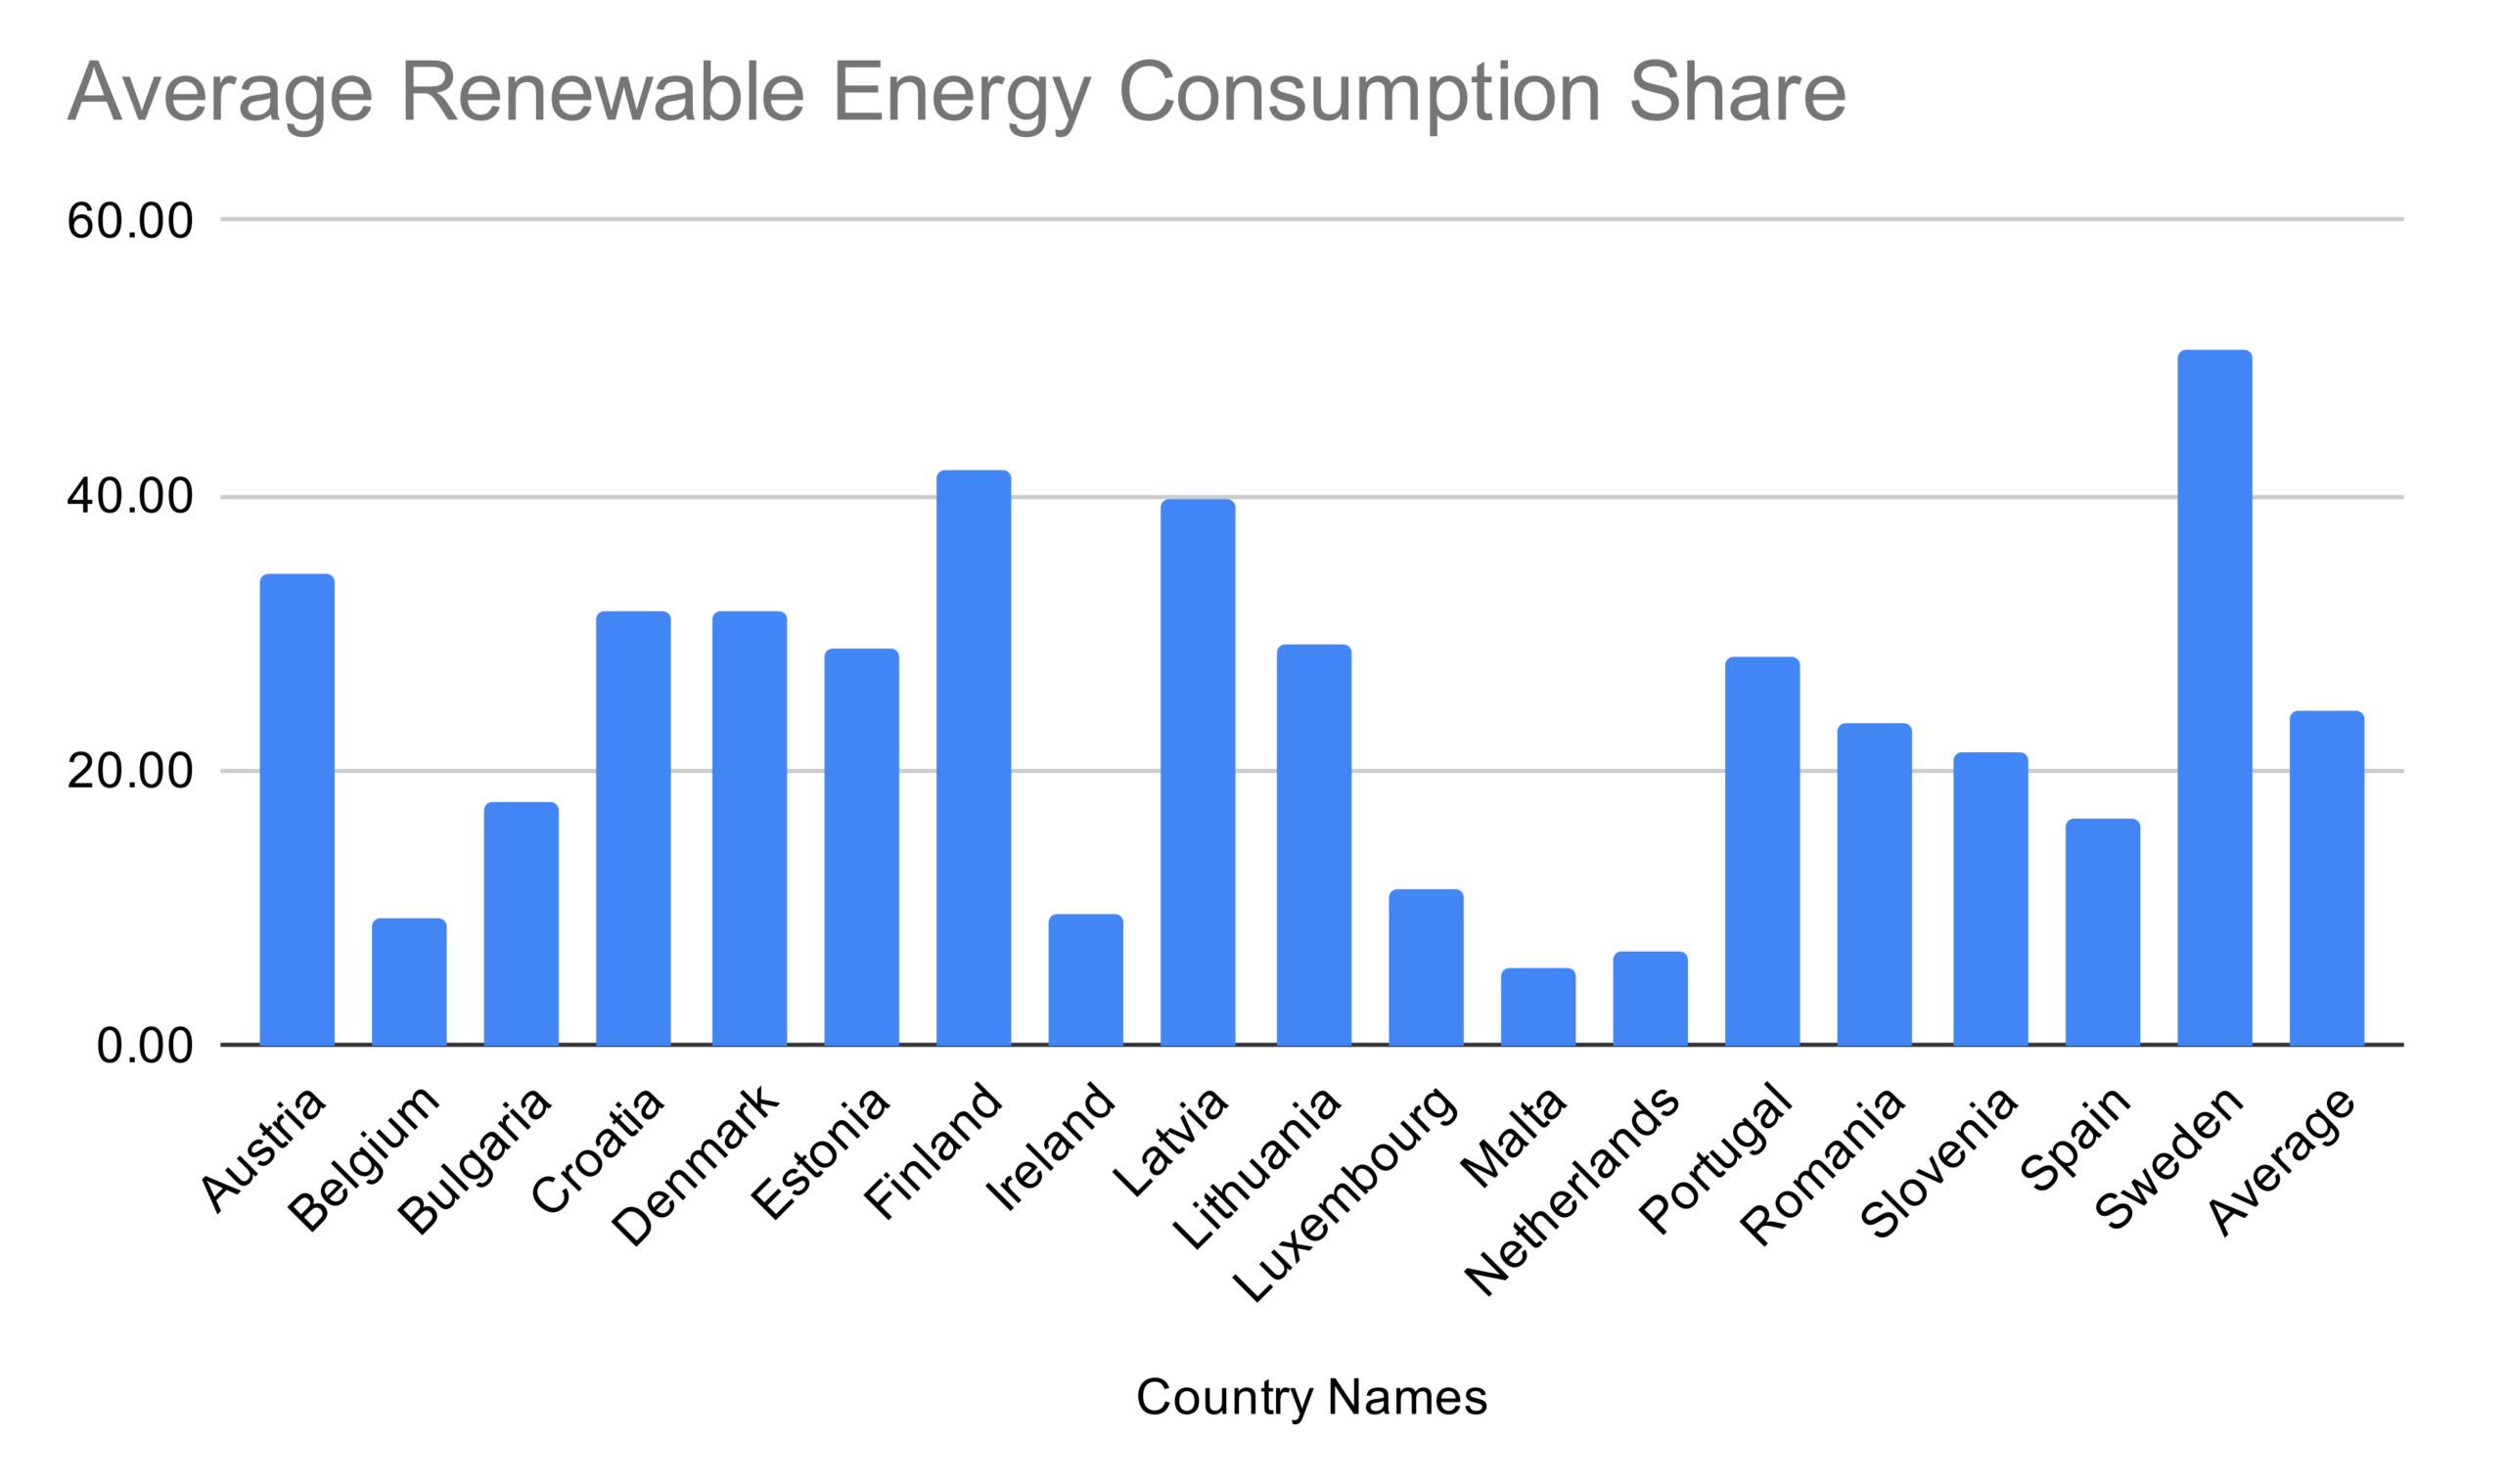
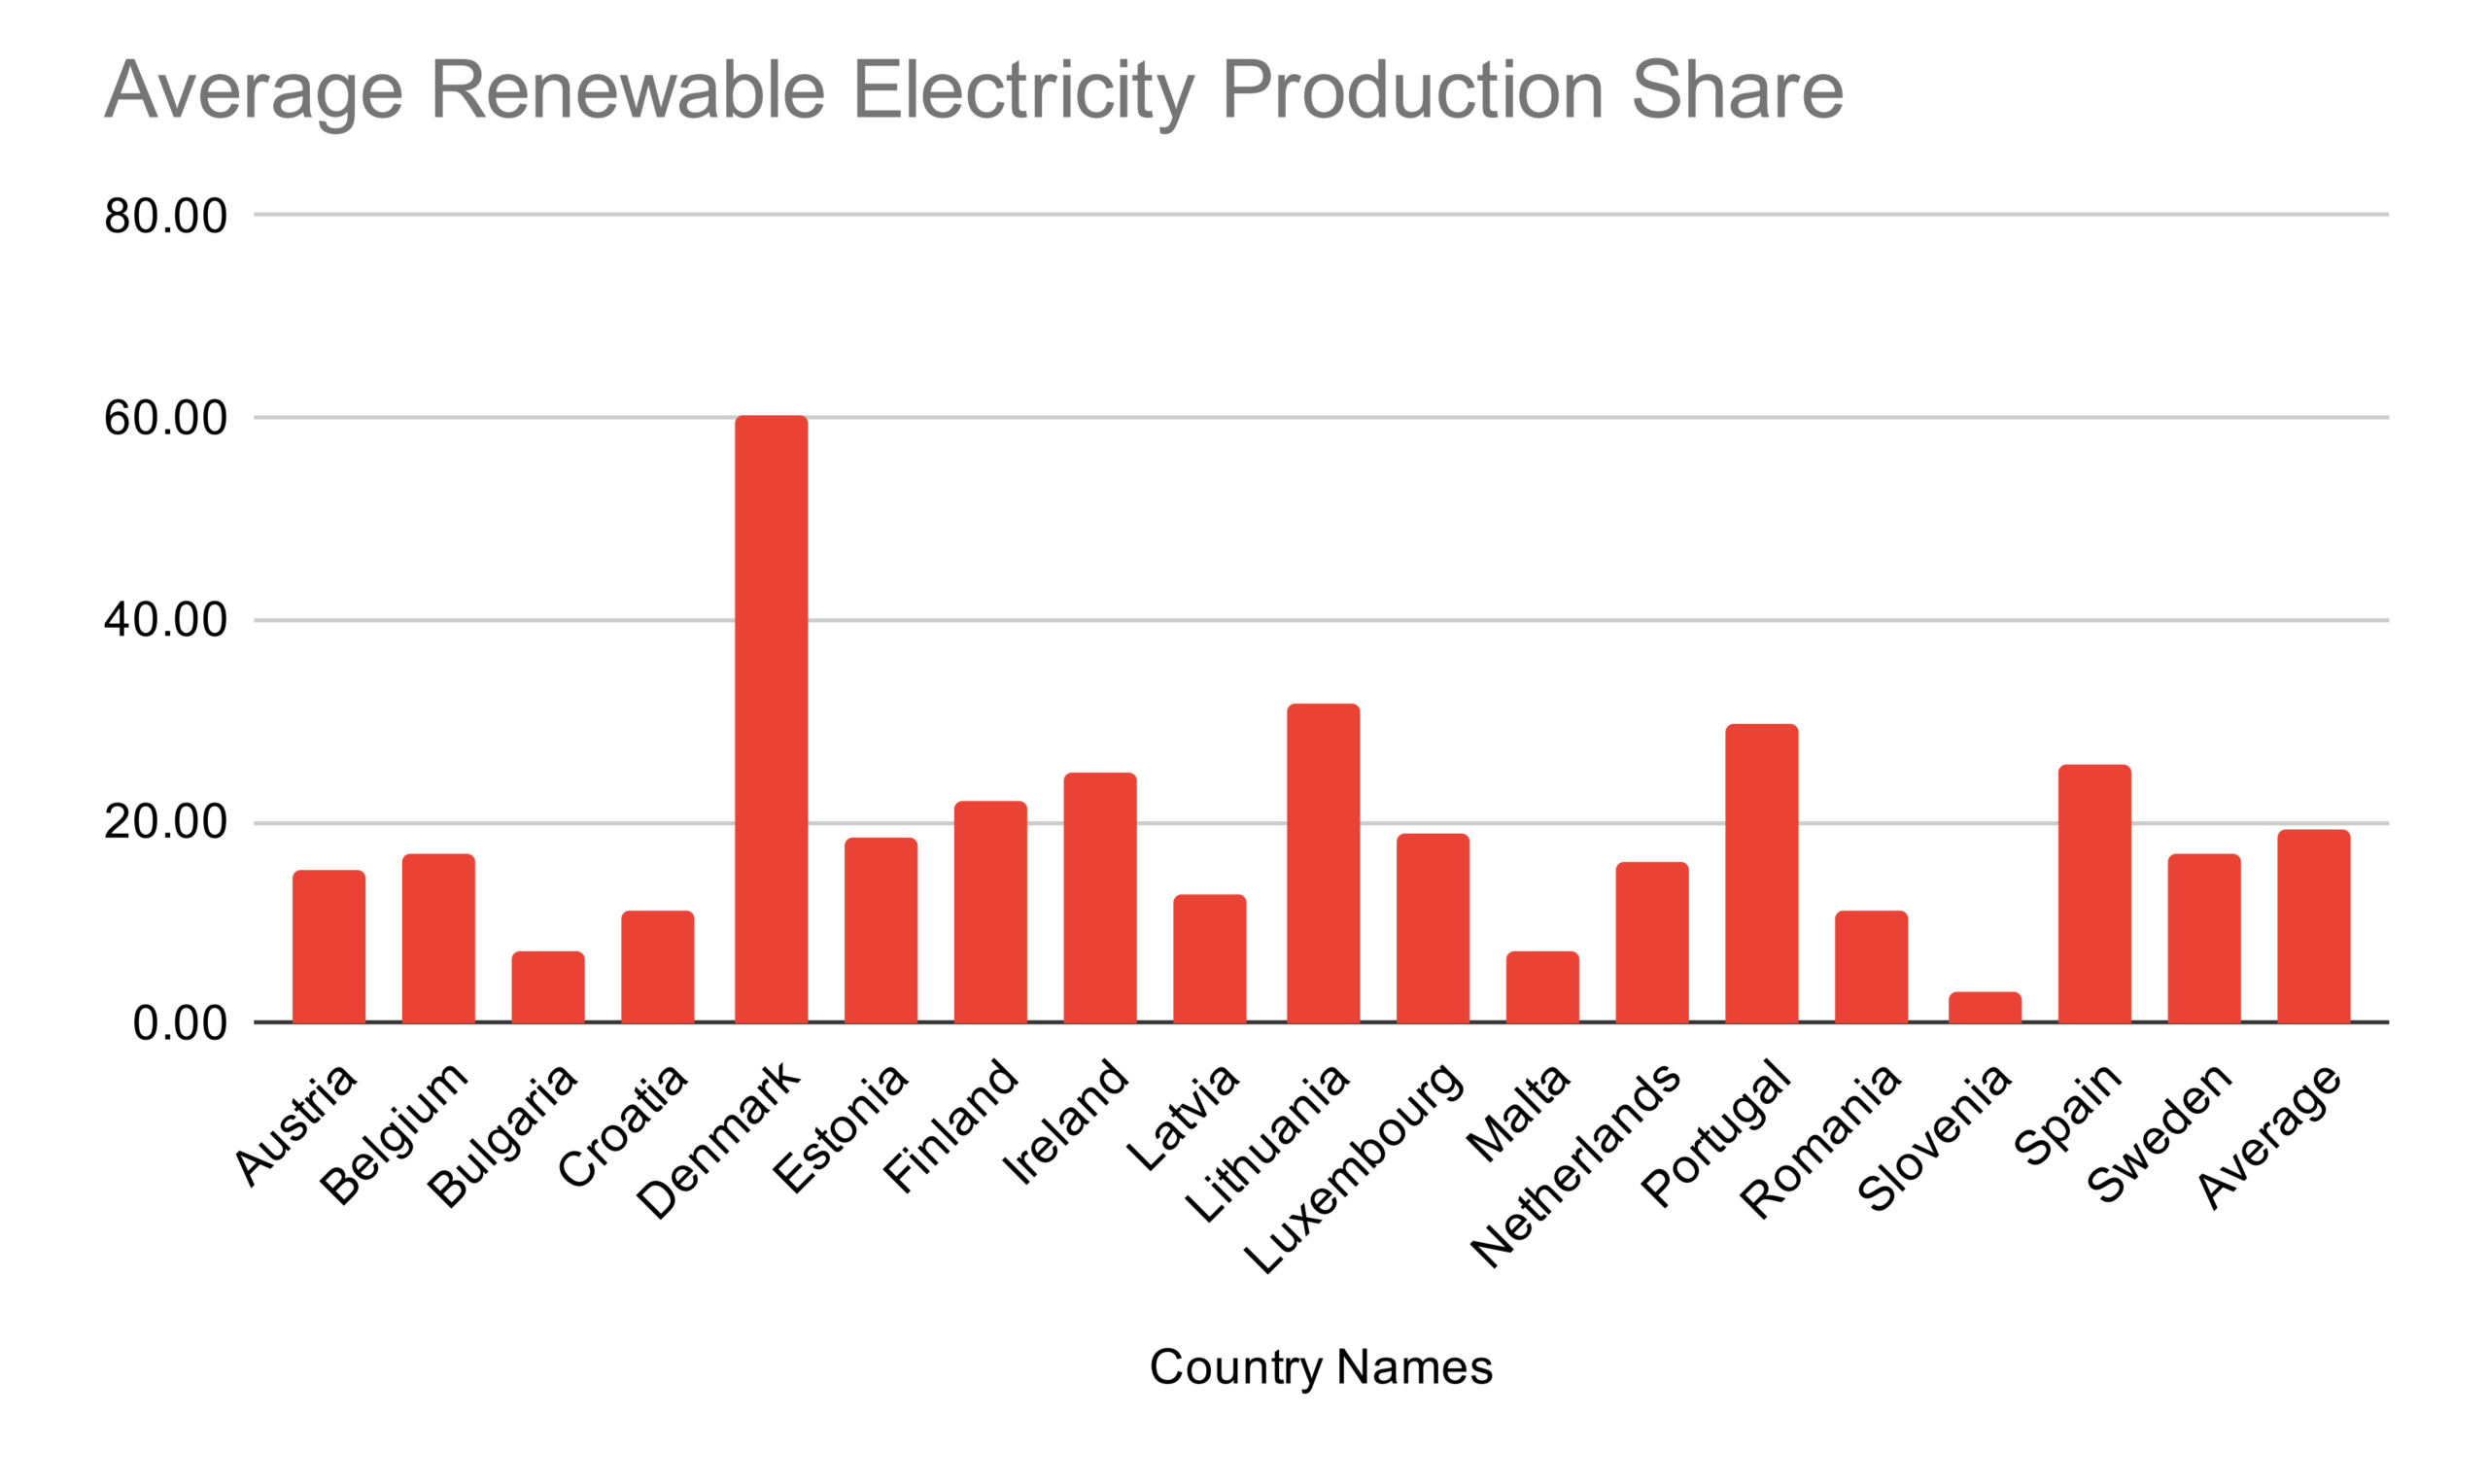
Figure 4 (i) aims to demonstrate how different countries are currently utilizing renewable energy over gas or fossil fuels. It also helps demonstrate which countries are most committed to producing renewable energy, as they will have a larger share of renewable electricity production and must therefore be using less gas or fossil fuels for electricity generation. Although Sweden is the country with the highest share of renewable energy consumption at 50.76 percent, there are many countries that have a similarly high consumption share with the mean of the dataset being 24.31 percent. The range is 40.02, and although there are a few countries with low shares of renewable energy consumption, the mean is greater when compared to renewable energy production in Figure 4 (ii).
Figure 4 (ii) is not directly analogous to the energy consumption mentioned in Figure 4 (i), but this data serves as a reliable metric to measure the current share of energy production from renewable sources from these countries. Similarly to energy consumption, this variable helps demonstrate which countries value the production of renewable energy. Here, it can be seen that Denmark stands out heavily from the rest of the countries with a share of 60.40 percent compared to Slovenia with a share of 3.15 percent. This gives a range is 57.25, showing a greater difference in countries’ renewable energy production share than their consumption share. Similarly, the mean is also lower at 19.35 percent.
The second crucial part of this paper is the government subsidies implemented for clean technologies. Figure 5 shows the average value of subsidies that were given by all countries in the model.
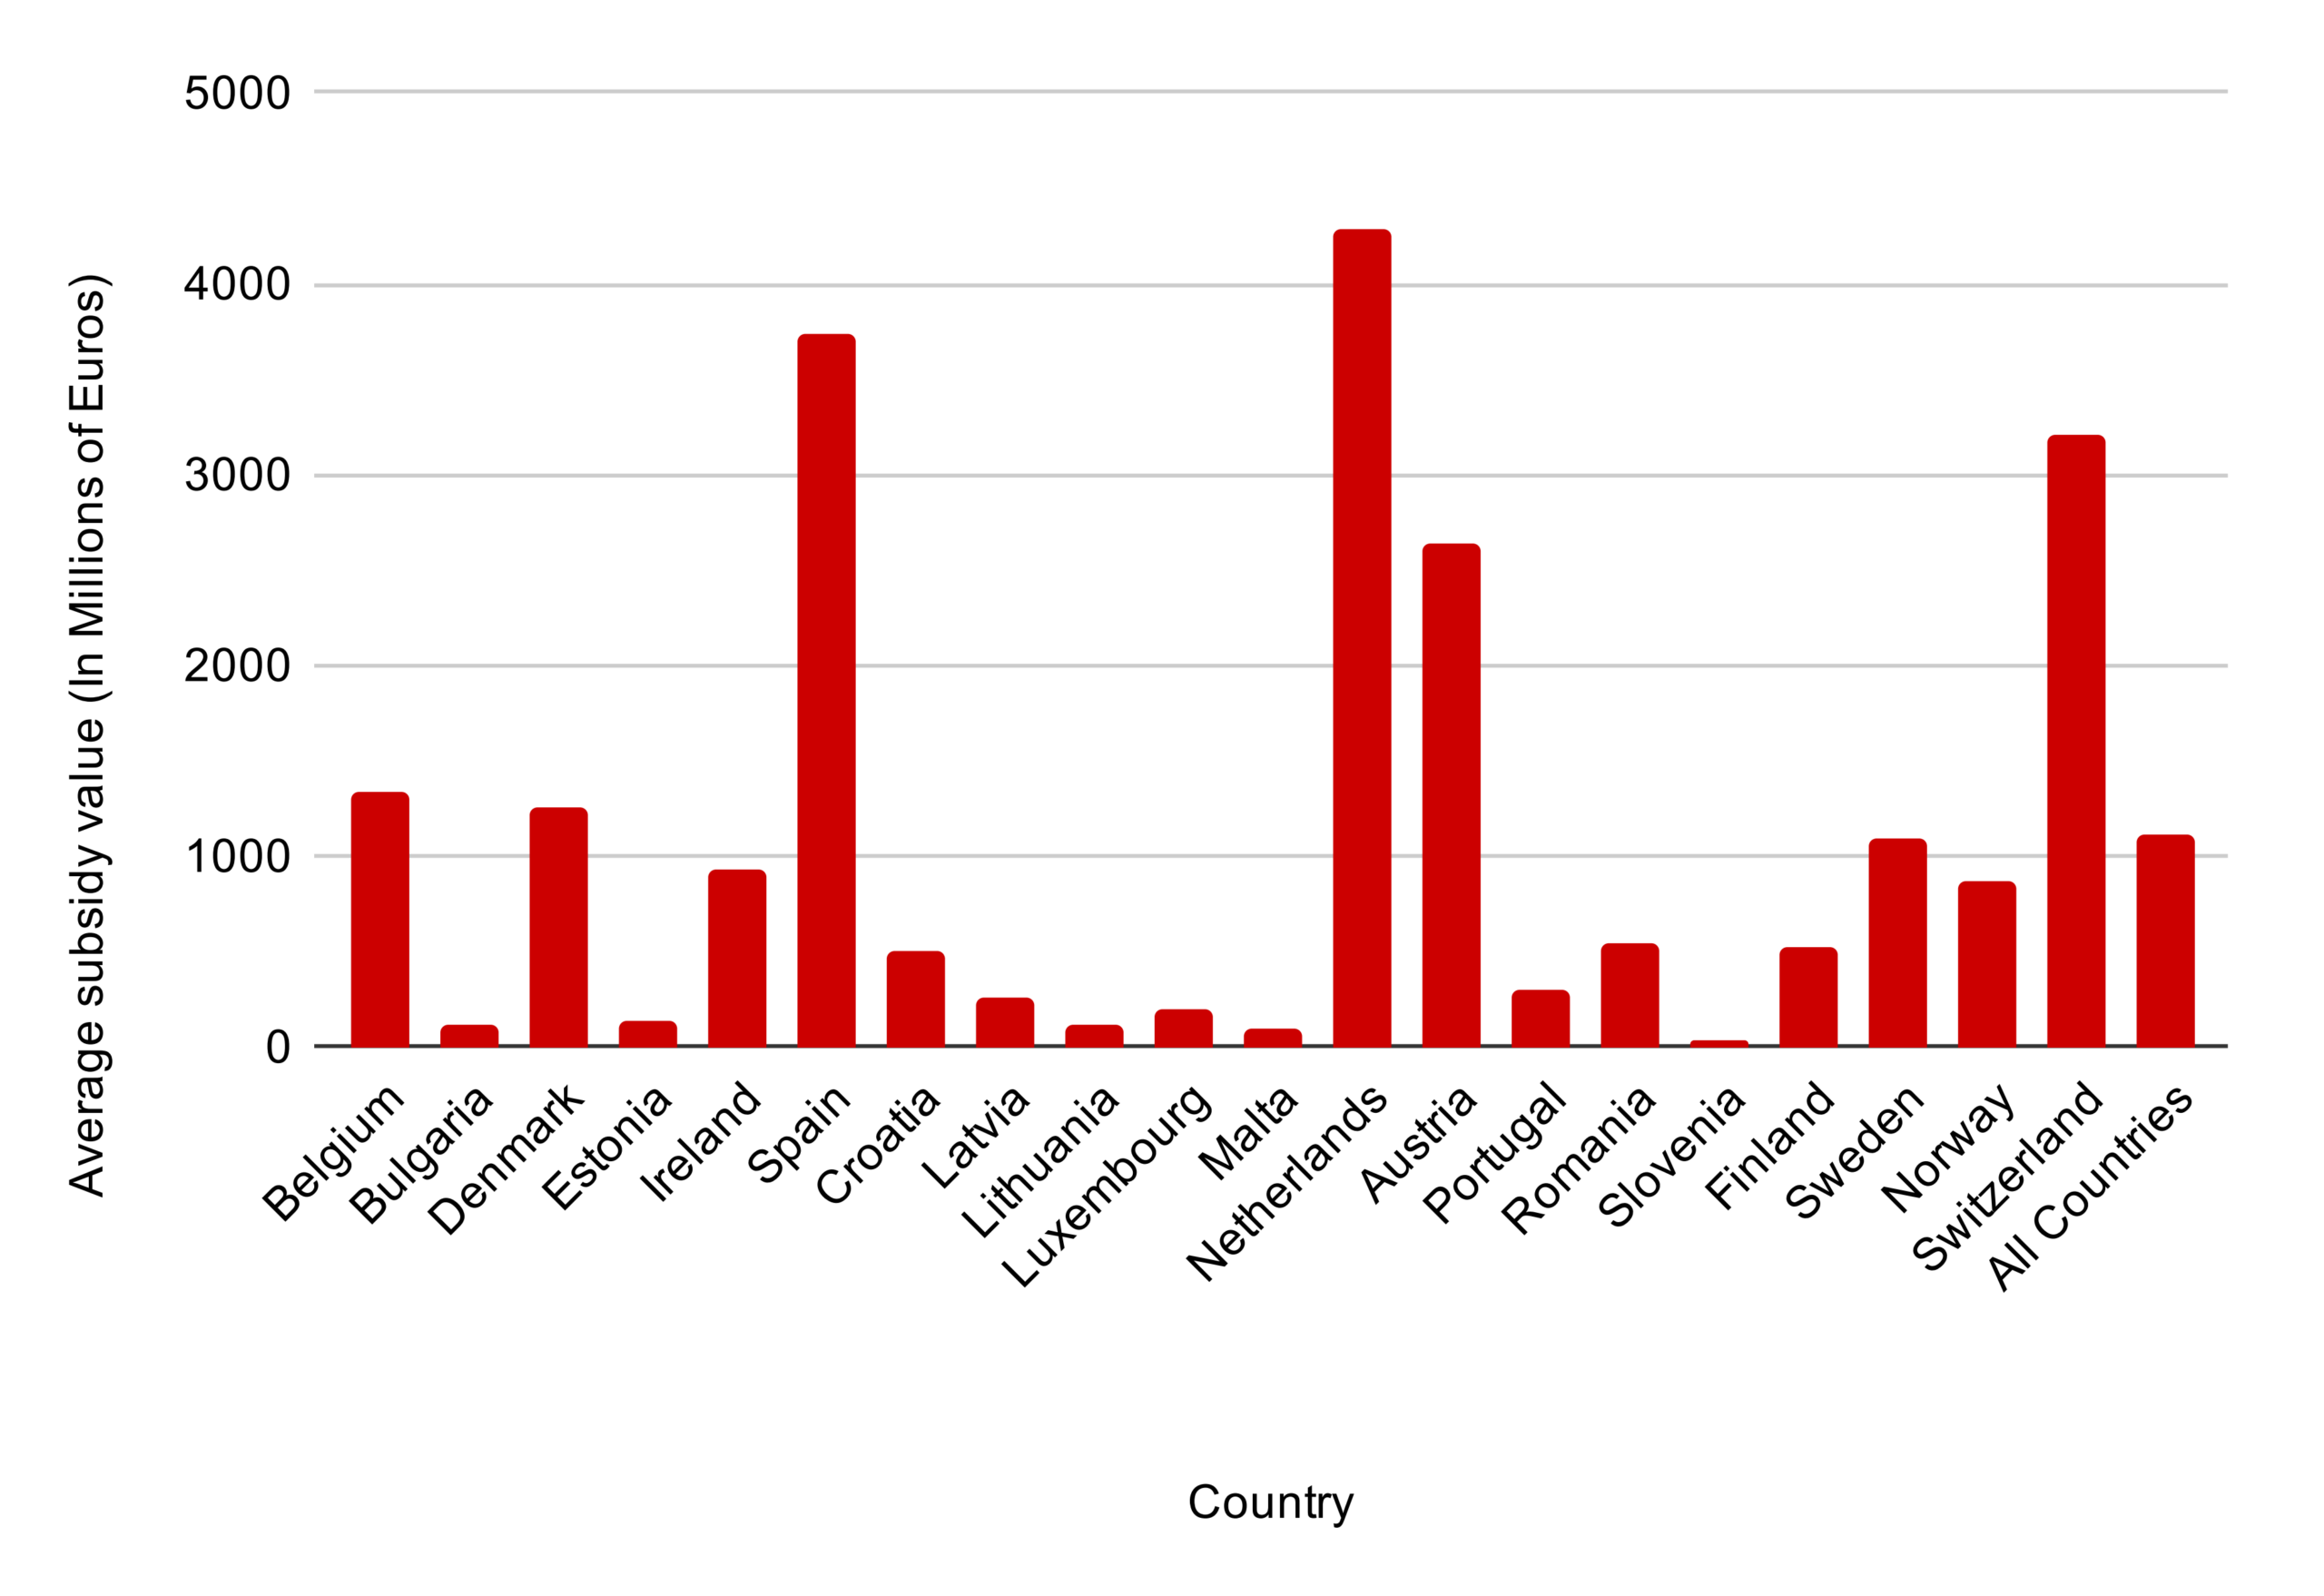
There is a large range of values in the figure, showing that some countries place higher priority on the development of renewable energy, while others invest less in it. The case studies later in the paper show how these large investments by individual countries could eventually lead to more widespread adoption of these policies. While this quantitative data is aggregated and not broken down into individual subsidies, non-aggregated data is much sparser and would be difficult to model.
Methodology
The model was estimated using a fixed effects panel regression to account for unobserved country-specific differences that may influence renewable energy outcomes but remain relatively constant over time, such as geography, historic policy preferences, or energy infrastructure. Robust standard errors were used to correct for non-constant error variance in the panel, ensuring that statistical inference remains valid across countries and years.
For each country i, and time t, we estimate the following equation:
(1) 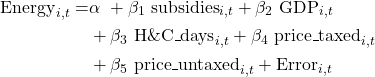
where Energyi,t denotes either energy production or energy consumption, α denotes the constant term, while β denotes the coefficient of control variables, and Errori,t captures any noise from the equation.
Results
Table 2 displays two models, both with energy production as the dependent variable. These models test for a relation between general subsidies and energy production in the selected countries.
| Variable | Model 1 | Model 2 |
| subsidies | 0.003 ** (0.002) | 0.004 ** (0.015) |
| ln(GDP) | 22.3*** (9.103) | 20.5** (7.567) |
| H&C_days | -0.005** (0.002) | -0.004* (0.002) |
| price_taxed | -1.14 (0.279) | — |
| Within R-squared | 0.327 | 0.308 |
*** p-value < 0.01, ** p-value < 0.05, * p-value < 0.1
As expected, the coefficient for subsidies is positive and significant, which implies that as national or regional governments increase domestic public funds, these EU countries’ renewable energy production increases as well. So, as environmental subsidies given by the government increase by 100 million Euros, the production of energy share increases by 0.4 percentage points. Furthermore, as GDP increases by 10%, the share increases by 2 percentage points, roughly 10% of the average of the production share. As the countries become richer, the use of clean energy production increases. This potentially shows a movement towards clean energy but only when there is enough money to spend on these new technologies.
Heating and cooling degree days having a negative coefficient imply that as these countries have a more urgent demand for energy, they choose to produce a higher quantity of non-sustainable energy. This shows that renewable energy may not yet be at a stage where it is readily accessible for public use during times of non-livable temperatures.
The R-sq shows that around 30% of the variation in the energy production share can be explained by variations in the independent variables. From Table 2, it is also clear that even though the electricity-to-gas price ratio is insignificant, by including it, the explanatory power of the independent variables increases. This leads into the next models, which use the same control and independent variables, but measure energy consumption, rather than energy production.
| Variable | Model 3 | Model 4 |
| subsidies | 0.001*** (0.0018) | 0.001*** (0.001) |
| ln(GDP) | 8.57*** (2.680) | 8.92** (3.188) |
| H&C_days | -0.001 (0.001) | -0.0009 (0.001) |
| price_untaxed | 0.983 (0.755) | — |
| Within R-squared | 0.347 | 0.2997 |
*** p-value < 0.01, ** p-value < 0.05, * p-value < 0.1
Similar to models 1 and 2, the coefficient for subsidies is positive and significant, which again implies that as national or regional governments increase domestic public funds, the consumption of energy in these EU countries increases as well. So, as environmental subsidies given by the government increase by 100 million Euros, the production of energy increases by around 0.1 percentage points.
However, as GDP increases by 10%, the share only increases by 0.8 percentage points, or around 5% of the average of the consumption share. Despite the notable decrease compared to energy production, this correlation still shows that as these countries become richer, clean energy consumption increases. This confirms the previously mentioned movement towards clean energy when there is enough money to spend on these new technologies.
Heating and cooling degree days again having a negative coefficient implies that as these countries have a more urgent demand for energy, they revert back to using non-sustainable energy instead. This reaffirms the idea that renewable energy may not yet be at a stage where it is readily accessible for public use during times of non-livable temperatures.
Having done the regression analysis on both energy production and consumption, it would be interesting to see the relative effects of the two. However, the coefficients from the models, 0.004 from production vs 0.001 from consumption, are not directly comparable. This is because the denominators for energy production and energy consumption in this model are not the same, with the metric for energy production being renewable electricity output and the metric for energy consumption being renewable energy consumption. Even though both serve as good measures for a country’s supply and demand for renewable energy, they are not identical and cannot be examined side by side.
To facilitate comparison, the coefficients can be normalized by the average renewable energy shares from the dataset: the average share of renewable energy production is 19.35 percent, while the average share of renewable energy consumption is 24.31 percent. Dividing each subsidy coefficient by its corresponding average share provides a relative measure of subsidy responsiveness. After this adjustment, the normalized coefficients are 0.02067 for production, and 0.004114 for consumption. Thus, the normalized production effect is approximately 5 times larger than the normalized consumption effect, indicating that government subsidies in the EU typically have a larger effect on the supply side of renewable energy than on the demand side.
Case Studies
This section supports the quantitative analysis by providing context on how government subsidy policies for solar, wind, and battery technologies have developed over time. To better understand the breakdown of global battery and renewable energy investments over the last decade, Figure 6 shows the share of international investment into different renewable technologies in advanced economies. Over the last decade, solar energy has attracted more investment than wind energy, and the investment gap has recently widened, solidifying solar as the leading renewable technology. Battery technology has only recently received heavy investment, and in 2025, it attracted more investment than the “other” renewable technologies category.
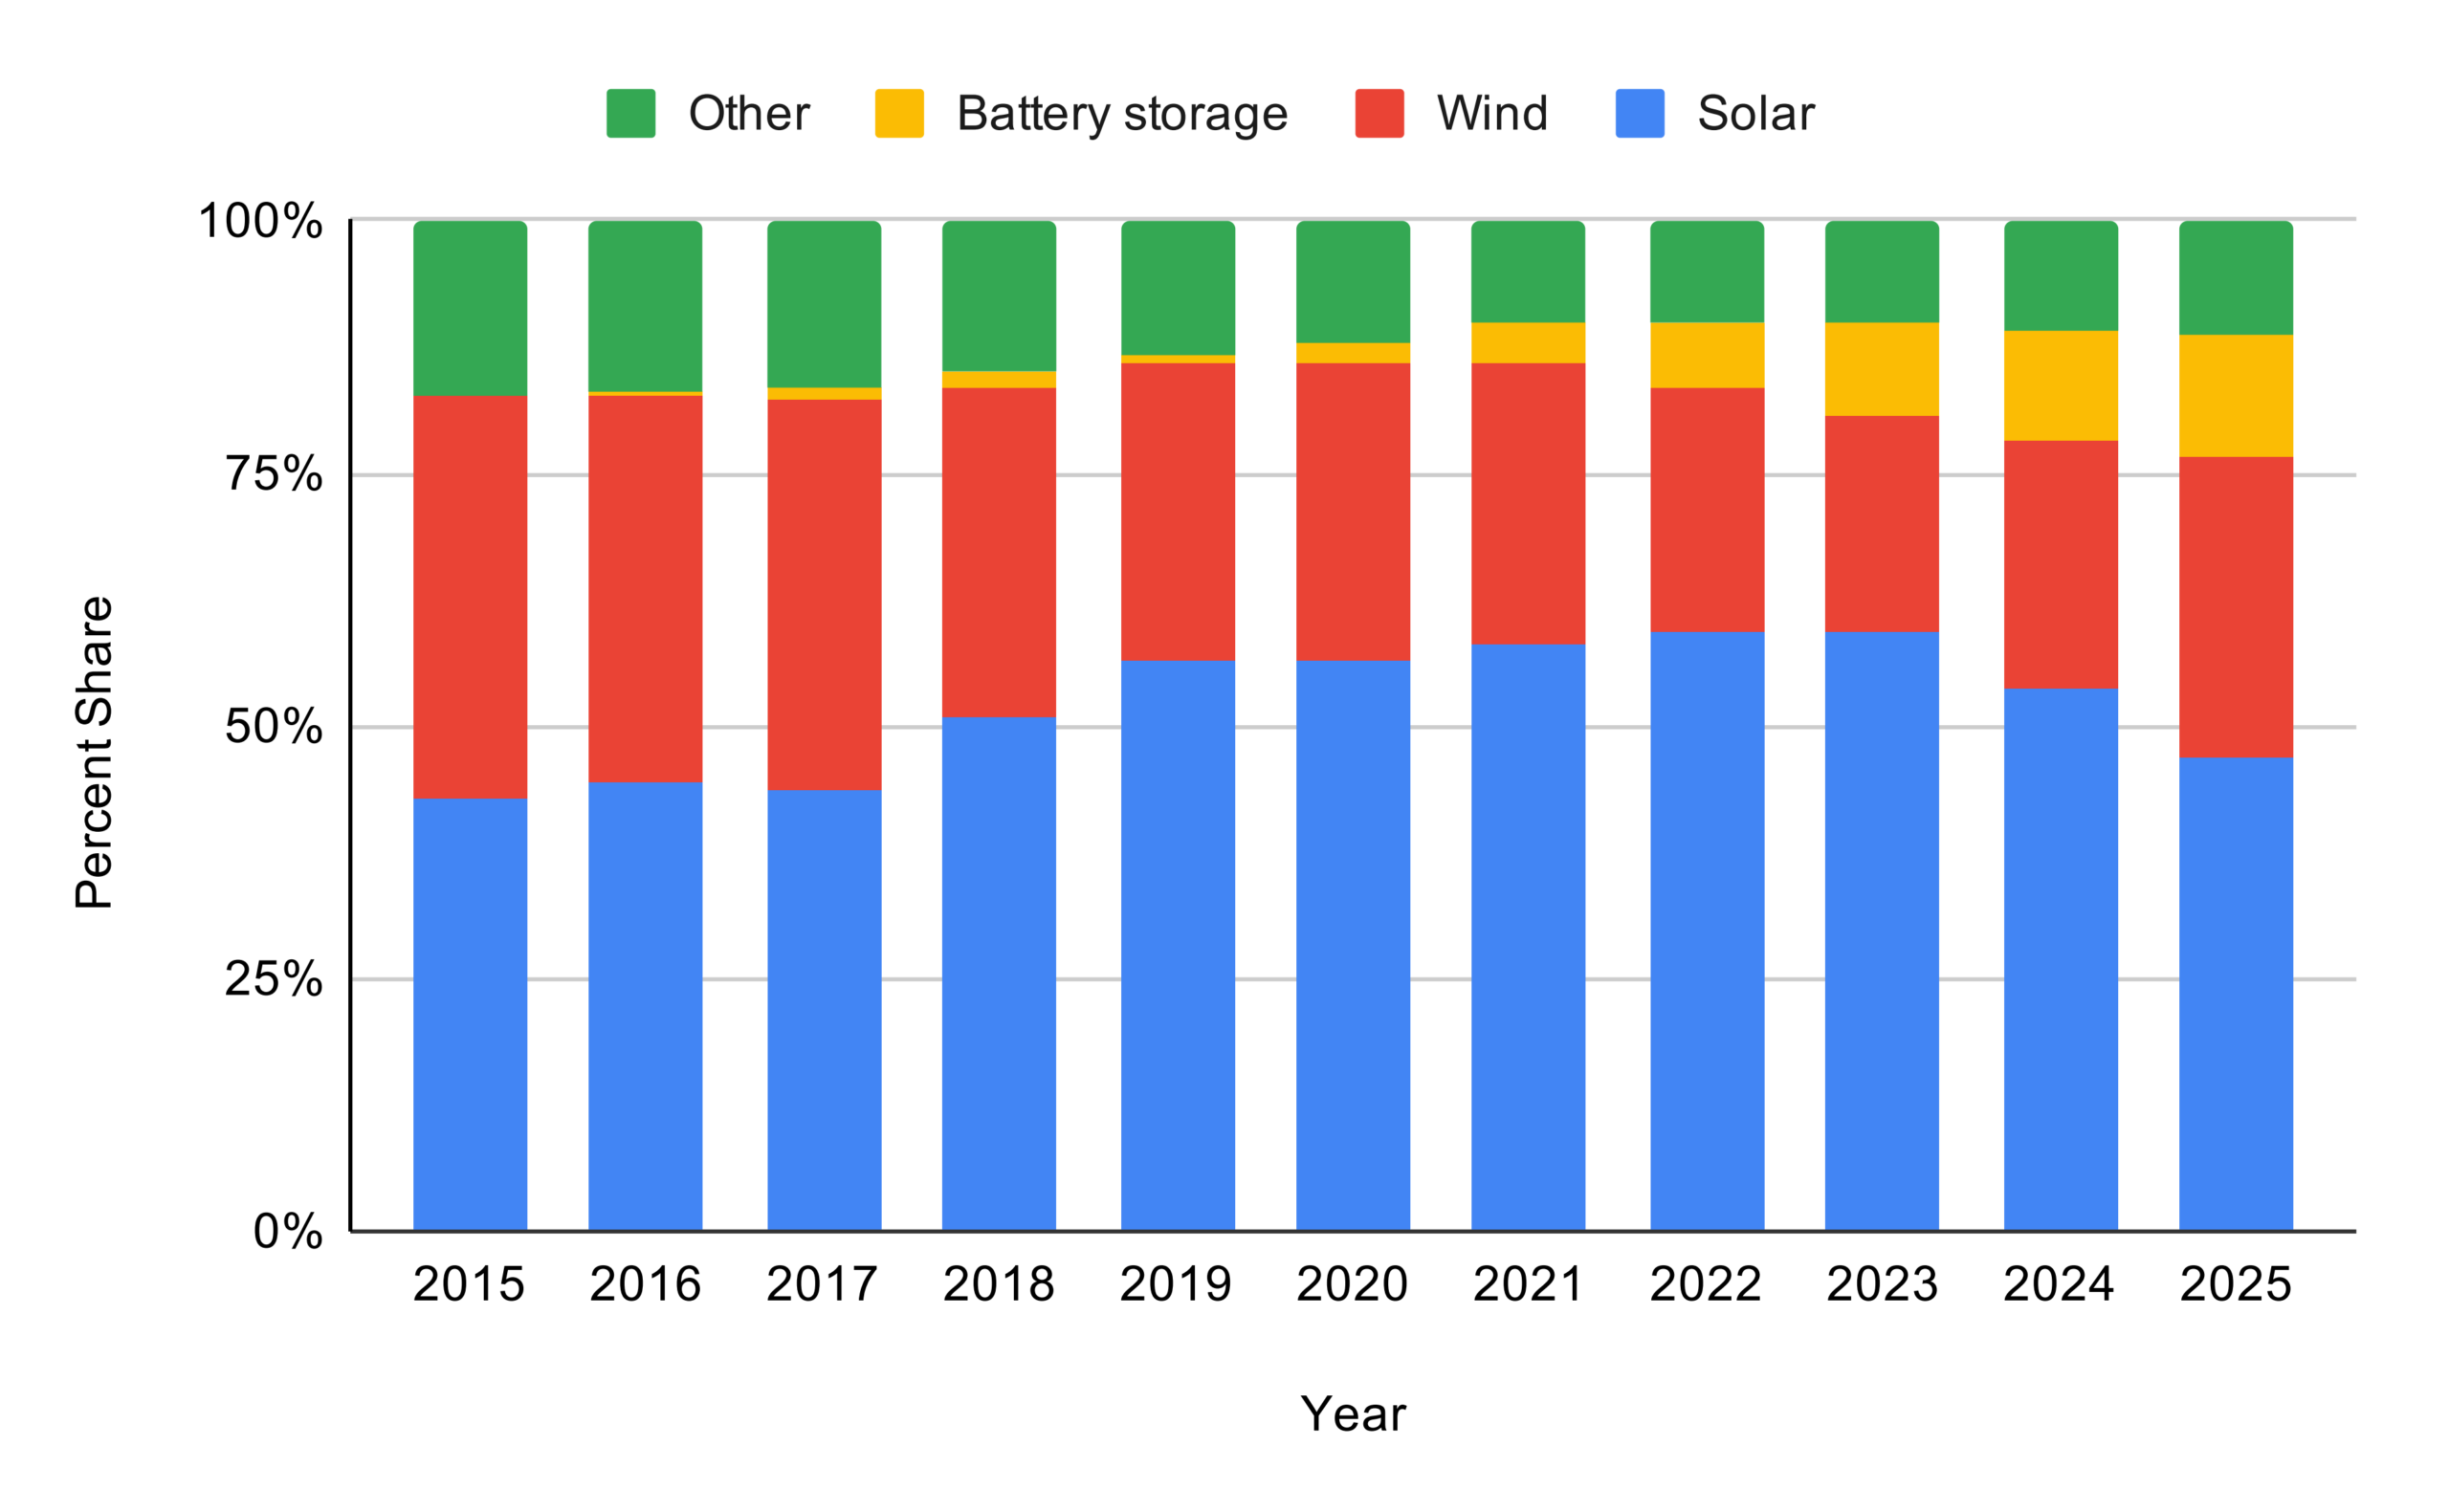
To see if this trend remains consistent between advanced economies and emerging markets, we move to Figure 7, which shows the breakdown of renewable technology investment in emerging market economies.
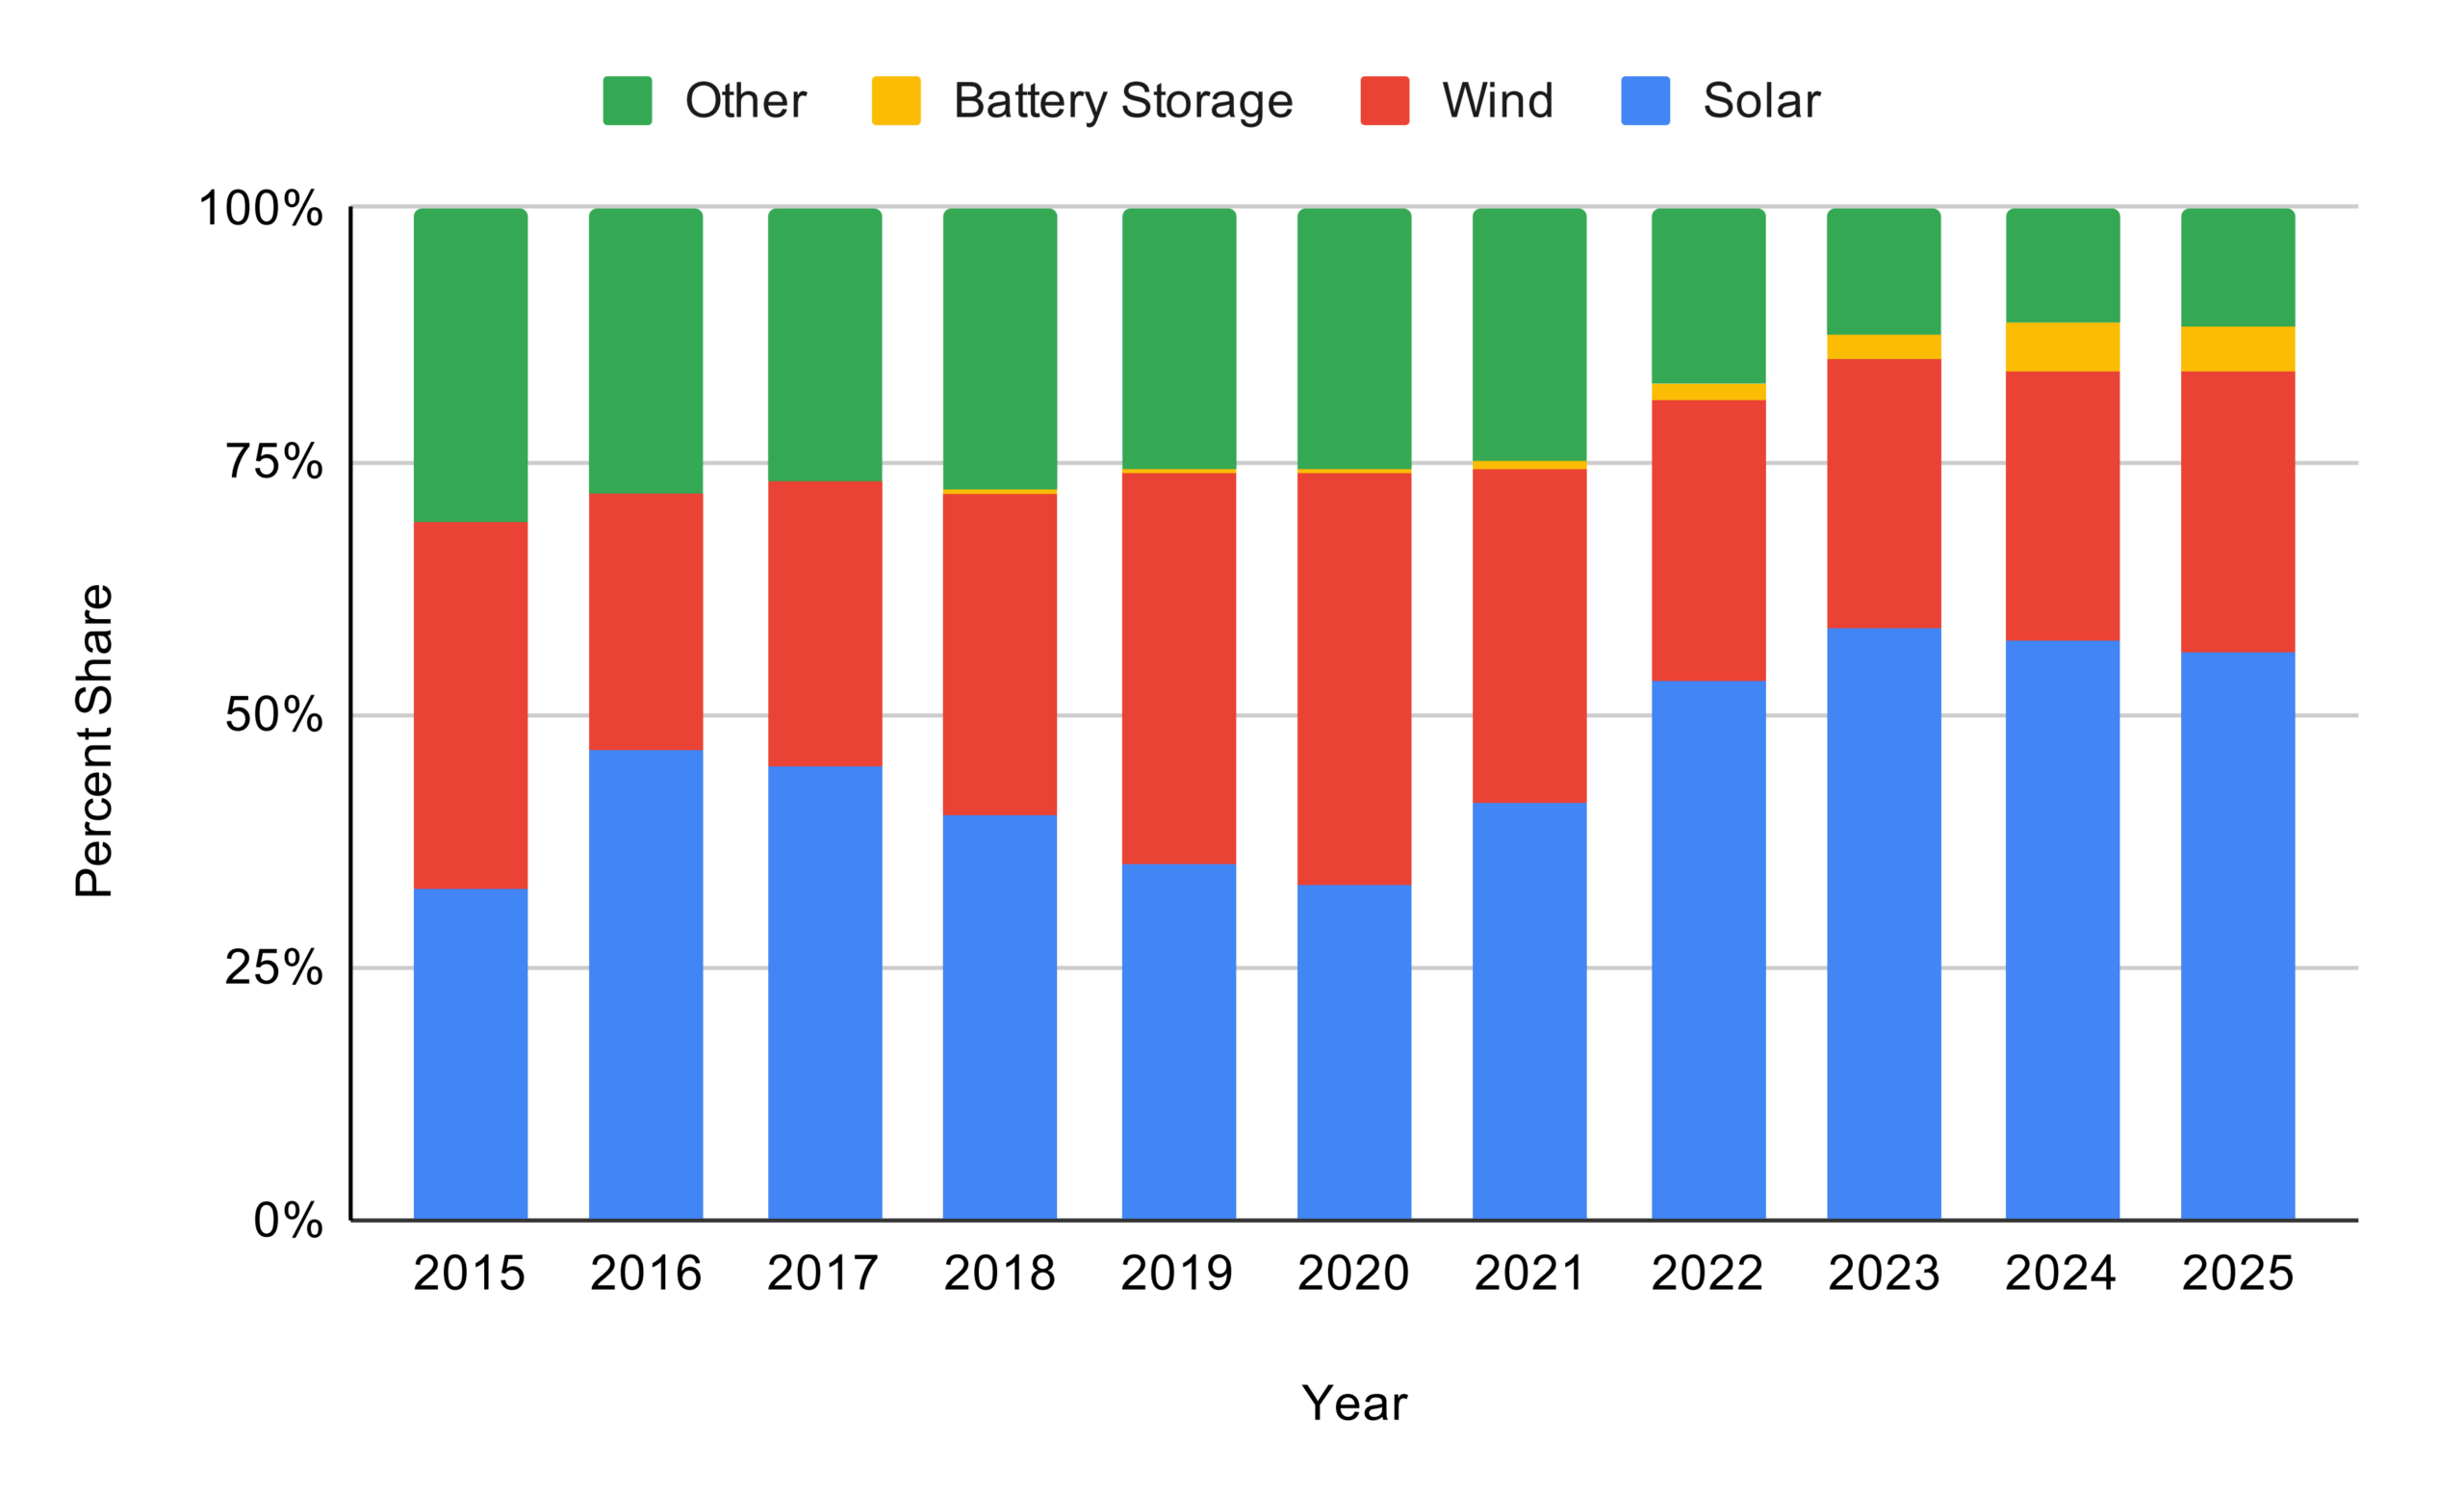
Over the last decade, the investment in solar and wind technology has fluctuated, with solar only recently becoming the most invested in technology in these economies. The adoption of battery technology was also much slower in emerging market economies. Despite these factors, it is critical to mention that the total monetary amount invested in renewable energy in emerging markets is greater than that of advanced economies. IEA data showed that in 2025, emerging markets have invested 460 billion US dollars while advanced economies have invested 320 billion US dollars.
The rest of this section pivots from international data to EU specific policies to identify patterns such as policy diffusion, changes in subsidy structure, and differences in technology maturity. It uses the following timelines to help explain the different ways clean energy technologies respond to government support. This analysis is not meant to represent causal interpretation, rather it is meant to explore the potential effects of EU policies on clean energy technologies.
Table 4 shows how early feed-in tariffs reduced investment risk and enabled rapid expansion of solar capacity. The later shift toward competitive auctions reflects declining costs and increasing market maturity, helping explain observed growth in renewable energy production and consumption shares.
| Year | Country | Policy | Type of Subsidy |
| 2000 | Germany | Renewable Energy Act solar tariffs | Feed-in tariff |
| 2004 | Spain | Renewable electricity support regime | Feed-in tariff |
| 2006 | France | Solar photovoltaic feed-in tariff program | Feed-in tariff |
| 2007 | Spain | Royal Decree 661/2007 | Feed-in tariff |
| 2008 | Italy | Conto Energia solar incentive program | Feed-in tariff |
| 2009 | EU | Renewable Energy Directive | Regulatory framework/subsidy targets |
| 2011 | France | Revised solar support scheme | Feed-in tariff + auction |
| 2015 | EU | Renewable energy auctions introduced | Auction subsidy |
| 2018 | EU | Clean Energy Package | Investment subsidy framework |
| 2020 | EU | Green Recovery renewable subsidies | Investment grant |
| 2020 | Netherlands | SDE++ program | Operating subsidy |
| 2021 | EU | Fit for 55 climate package | Climate subsidy framework |
| 2022 | EU | REPowerEU plan | Investment subsidy |
| 2024 | EU | Innovation Fund clean tech grants | Investment grant |
The solar subsidy timeline shows a clear pattern of policy diffusion across Europe, where early national policies are later reinforced by broader EU policies, and where individual country actions can spur similar policy adoption elsewhere. Germany’s 2000 Renewable Energy Act introduced large feed-in tariffs, which the IEA defines as subsidies that guarantee producers a fixed price for electricity over long-term contracts, reducing investment risk and enabling both households and firms to finance solar panel installation through set revenue streams13. Similar programs soon appeared in Spain, France, and Italy, showing the deployment of policy learning, before the EU increased renewable support through directives and climate packages, supporting more widespread growth across the Union through supranational pressures. From a consumer perspective, these policies effectively subsidized rooftop solar by ensuring that households could recover installation costs through electricity sales to the grid, contributing to widespread adoption during the 2000s and early 2010s. This is possible through the EU electricity-market rules which facilitate the integration of distributed renewable generation into the grid at a fixed per-kWh rate23.
Over the last decade, solar technology became significantly cheaper, with the IRENA that estimating utility-scale solar photovoltaic levelized cost of energy (LCOE) fell 85% between 2010 and 202024. Solar photovoltaic LCOE is the average, net present cost of electricity generation for a solar system over its entire lifetime. Because of this, policy design moved toward competitive auctions and investment grants, particularly for large-scale producers. Competitive auctions function as market-based mechanisms in which renewable energy developers bid to supply electricity at the lowest price, allowing governments to reduce subsidy costs while maintaining deployment incentives. These policy changes reflect the declining cost of solar photovoltaic installation, which fell substantially over the 2010s, allowing solar energy to become more economically viable without feed-in tariffs establishing fixed prices.
These policies have the potential to increase both renewable energy production and renewable energy consumption shares. Feed-in tariffs and investment subsidies primarily increase installed solar capacity, influencing renewable energy production, while consumption increases gradually as electricity markets and households adopt more solar energy. Because solar policies strongly incentivize producers and increase generation capacity, renewable energy production will likely increase rapidly, while the impact on renewable energy consumption may occur more gradually as households begin adopting more renewable energy. This qualitative evidence aligns strongly with the quantitative analysis, as with every 100 units that environmental subsidies increase, the share of renewable energy production increases by 0.4 percentage points, while the share of renewable energy consumption only increases by 0.1 percentage points. Once again, although these two variables are not directly comparable, they serve to represent the supply and demand of the EU countries in the dataset.
Table 5 shows how early producer-focused subsidies supported wind energy through price guarantees and later market-based mechanisms. This stable policy environment helps explain how wind technology has grown with the aid of subsidies.
| Year | Country | Policy | Type of Subsidy |
| 1991 | Denmark | Wind power guaranteed price system | Feed-in tariff |
| 2000 | Germany | Renewable Energy Act wind tariffs | Feed-in tariff |
| 2004 | Spain | Renewable electricity support regime | Feed-in tariff |
| 2009 | EU | Renewable Energy Directive | Regulatory framework/subsidy targets |
| 2011 | Netherlands | SDE+ renewable support scheme | Operating subsidy |
| 2014 | UK | Contracts for Difference | Price guarantee subsidy |
| 2015 | EU | Renewable energy auctions | Auction subsidy |
| 2018 | EU | Clean Energy Package | Investment subsidy framework |
| 2020 | EU | Green Recovery renewable funding | Investment grant |
| 2020 | Netherlands | SDE++ program | Operating subsidy |
| 2021 | EU | Fit for 55 climate package | Climate subsidy framework |
| 2022 | EU | REPowerEU plan | Investment subsidy |
| 2024 | EU | Innovation Fund grants | Investment grant |
The wind subsidy timeline reflects a technology that was more mature and commercially viable earlier than solar, which influenced how governments supported policies. This study defines mature technologies as a technology that has significant market share and the policy environment around it has existed for more than 20 years. As seen in Figure 6 and Figure 7, wind and solar energy are both significantly invested in within emerging and advanced economies, supporting their maturity. Similarly to solar energy, wind energy subsidies began with feed-in tariffs in countries like Denmark in the early 1990s and Germany in 2000, providing producers with a guaranteed minimum price for electricity and reducing investment risk. These policies spread across Europe as other countries adopted similar support mechanisms, demonstrating a pattern of policy diffusion from early adopters using policy learning, to broader EU frameworks such as the Renewable Energy Directive and later EU climate packages both fueled by supranational pressures. For context, the Renewable Energy Directive is the EU’s main legal framework for raising renewable-energy use, and later climate packages such as the 2018 package and Fit for 55 strengthened targets and implementation rules23
Unlike solar, wind energy production is typically performed using large-scale and capital-intensive operations, meaning subsidies were primarily designed for energy producers rather than households, since individual households rarely build wind farms. Over time, as wind technology became cost-competitive, onshore wind LCOE fell 56% between 2010 and 202024. By 2020, several renewable technologies had moved into the cost range of new fossil-fuel capacity without financial support10. This made policies evolve from fixed feed-in tariffs to auction systems and contracts-for-difference, long-term contracts that protect low-carbon generators from wholesale-price volatility by topping up revenues when market prices fall below a strike price and paying back when prices exceed it25. These policies provide price stability but rely more on market competition. Overall, wind subsidy policy shows a consistent focus on supporting large producers through mechanisms that ensure predictable revenue streams, reflecting the industrial scale and earlier technological maturity of wind energy compared to other commonly used renewable technologies.
Finally, Table 6 highlights the more recent emergence of subsidies driven by electric vehicle (EV) adoption and energy storage needs. These policies help explain why battery-related technologies show stronger dependence on policy support compared to more established renewable sectors.
| Year | Country | Policy | Type of Subsidy |
| 2008 | France | Bonus-malus low-emission vehicle incentive | Purchase subsidy |
| 2010 | UK | Plug-in Car Grant | Purchase subsidy |
| 2018 | EU | Clean Energy Package | Investment subsidy framework |
| 2019 | EU | Battery IPCEI program | Industrial subsidy |
| 2020 | EU | Green Recovery EV subsidies | Purchase subsidy |
| 2021 | EU | Fit for 55 climate package | Climate subsidy framework |
| 2021 | EU | Battery IPCEI II | Industrial subsidy |
| 2022 | EU | Expanded EV purchase incentives | Purchase subsidy |
| 2022 | EU | REPowerEU plan | Industrial subsidy |
| 2023 | Germany | EV subsidy reduction | Policy reform |
| 2024 | EU | Innovation Fund battery grants | Investment grant |
The battery and EV subsidy timeline shows a much later policy wave than wind or solar, with most major subsidies appearing after 2010 and especially after 2018, reflecting the fact that battery technology is newer, which aligns with the investment data shown in Figure 2. Early policy adoption again shows a pattern of policy diffusion through policy learning, with France and the UK playing a leading role by introducing strong EV incentives such as bonus-malus low-emission vehicle incentives and plug-in car grants in the late 2000s and early 2010s, which significantly increased EV adoption over high emission vehicles and demonstrated the effectiveness of consumer-focused subsidies. Unlike wind and solar, battery adoption is largely driven indirectly through EV consumer-centric incentives, since EVs already include lithium-ion batteries as an integrated component, and consumers typically do not need to separately purchase or manage the battery itself. As a result, EV purchase subsidies automatically increase demand for battery technology, encouraging investment in battery production, research, and supply chains.
Over time, governments began complementing consumer subsidies with producer-side subsidies, such as EU battery Important Projects of Common European Interest (IPCEI) programs and Innovation Fund grants, which support battery manufacturing, R&D, and industrial scale-up. IPCEI programs are state-aid frameworks that support strategic battery projects across the value chain, from raw materials and cell production to recycling, while Innovation Fund grants provide EU-level financing for the commercial deployment of innovative low-carbon technologies, including batteries and energy storage. These policies of consumer EV subsidies stimulate immediate market demand and encourage battery adoption by reducing costs through scale. Investment in battery production also has spillover effects across related sectors, including mining, chemical processing, and advanced manufacturing, meaning that battery subsidies can contribute to broader industrial growth beyond the transport sector. Overall, producer subsidies support long-term technological development and domestic supply chains, particularly for strategic inputs such as lithium, cobalt, and battery cell manufacturing. The battery policy timeline shows that governments rapidly implemented policy due to institutional pressures and used a combination of consumer incentives and industrial subsidies to accelerate the adoption of EV technology. This aligns with existing ideas such as Bergek et al. (2008)27 which examines the technological innovation systems theory that shows how government policy, firms, research institutions, and markets collectively shape technological innovation and commercialization.
Discussion and Conclusion
Government subsidies play a central role in accelerating the development and adoption of clean energy technologies, but the long-term necessity of these subsidies remains debated, as seen in this paper’s literature review. Existing research has examined individual policy mechanisms such as feed-in tariffs, tax incentives, and investment grants, but fewer studies directly compare how different clean technologies respond to subsidy structures over time. This paper found that as subsidies for clean energy technologies increase, the production and consumption will increase as well. While this result was expected, the increase in energy production is three to four times larger than the increase in energy consumption with the same change in government subsidies, showing that subsidies function as a tool to increase production rather than to incentivize consumers to use clean energy.
The qualitative results show meaningful differences in the development paths of the three technologies. Wind energy, being a more mature technology, shows evidence of becoming cost effective earlier, while solar energy experienced rapid cost declines that allowed subsidy structures to shift from feed-in tariffs toward competitive auctions and investment incentives. Battery technologies, driven largely by EV adoption, have experienced a more recent increase in policy support reflecting their recent technological developments. Given the normalized subsidy effect calculated in the model, subsidies have a stronger relative association with renewable energy production than with renewable energy consumption. As a result, these findings suggest that subsidies could help narrow existing shortages in the renewable energy market in the EU.
These results suggest several policy implications. When dealing with newly founded clean energy technologies, policymakers should consider slowly transitioning from broad subsidy programs toward more targeted support mechanisms, such as battery storage and next-generation grid infrastructure for example. Mature technologies like solar and wind energy, which have demonstrated strong cost reductions and widespread adoption, may require less direct governmental support over time, though continued investment remains important. The results show a clear pattern of policy diffusion through policy learning and supranational pressure for clean technology legislation, so governments may benefit from coordinating policy efforts across countries to induce international policy.
This study has a few limitations related to scope and methodology. Additionally, the paper does not fully capture potential spillover effects between technologies, such as the interaction between battery storage and renewable electricity generation. Finally, because the dataset focuses heavily on European Union countries, results may differ in other regions or countries such as the United States or emerging markets, where subsidy structures and energy markets vary. There is a lack of data from the IEA for comparable renewable energy production and consumption. Due to this, the analysis for demand and supply of renewable energy needs to be done separately and cannot be directly compared at this time. If this data were present, it would be possible to close this gap and determine the viability of clean energy technologies without subsidization. Falling costs and growing competitiveness suggest that some mature technologies may require less direct support than in earlier stages, though this study does not directly test post-subsidy viability.
Ultimately, this paper serves as a first step toward understanding how clean energy technologies are benefited by government subsidies, highlighting the importance of policy design in emerging technologies, while also showing it is possible for clean energy to succeed while policy makers decrease the amount of subsidies to make way for different priorities.
References
- G. M. Grossman, A. O. Sykes. Industrial policy and subsidies: assessment of current rules and possible reforms. 2025 [↩] [↩]
- T.-Z. Ang, M. Salem, M. Kamarol, H. S. Das, M. A. Nazari, N. Prabaharan. A comprehensive study of renewable energy sources: classifications, challenges and suggestions. Energy Strategy Reviews. Vol. 43, pg. 100939, 2022 https://doi.org/10.1016/j.esr.2022.100939 [↩] [↩] [↩]
- M. G. Schwartz, R. Hugounenq, M. B. J. Clements. Government subsidies: concepts, international trends, and reform options. IMF Working Papers. 1995 [↩] [↩]
- A. Lashkaripour, P.-S. Wu. New industrial policy. Oxford Research Encyclopedia of Economics and Finance. 2025 [↩] [↩] [↩]
- J. Meckling, N. Kelsey, E. Biber, J. Zysman. Winning coalitions for climate policy. 2015 https://www.science.org/doi/10.1126/science.aab1336 [↩] [↩]
- U. Cantner, S. Kösters. Picking the winner? empirical evidence on the targeting of r&d subsidies to start-ups. Small Business Economics. Vol. 39, pg. 921–936, 2012 https://doi.org/10.1007/s11187-011-9340-9 [↩]
- OECD. Corporate tax statistics 2023. Corporate Tax Statistics. Vol. 2023, 2023 https://doi.org/10.1787/f1f07219-en [↩] [↩] [↩] [↩]
- C. Slattery. The political economy of subsidy giving. Social Science Research Network. 2024 https://doi.org/10.2139/ssrn.4185083 [↩] [↩]
- V. K. Sharma, G. Monteleone, G. Braccio, C. N. Anyanwu, N. N. Aneke. A comprehensive review of green energy technologies: towards sustainable clean energy transition and global net-zero carbon emissions. Processes. Vol. 13, pg. 69, 2025 https://doi.org/10.3390/pr13010069 [↩]
- Renewable Power Generation Costs in 2024. IRENA https://www.irena.org/Publications/2025/Jun/Renewable-Power-Generation-Costs-in-2024 [↩] [↩] [↩]
- S. Fankhauser, L. Agnelli, M. Collins Tobin, F. Khushnud, H. Luscombe, J. Omukuti, E. Ravigné, S. Srivastav, M. Weidinger. The economic benefits of renewable energy and how to share them. https://netzeroclimate.org/publications/the-economic-benefits-of-renewable-energy-and-how-to-share-them/ 2025 [↩]
- S. Farah, G. B. Andresen. Investment-based optimisation of energy storage design parameters in a grid-connected hybrid renewable energy system. Applied Energy. Vol. 355, pg. 122384, 2023 https://doi.org/10.1016/j.apenergy.2023.122384 [↩]
- Renewables. IEA https://www.iea.org/energy-system/renewables [↩] [↩] [↩] [↩] [↩] [↩] [↩] [↩] [↩]
- Glossary. IEA https://www.iea.org/glossary [↩] [↩]
- Support schemes for renewable energy. European Commission https://energy.ec.europa.eu/topics/renewable-energy/financing/support-schemes-renewable-energy_en [↩]
- Renewable energy consumption (% of final energy consumption). World Bank, https://data.worldbank.org/indicator/EG.FEC.RNEW.ZS [↩] [↩]
- Electricity production from renewable sources, excluding hydroelectric (% of total). World Bank https://data.worldbank.org/indicator/EG.ELC.RNWX.ZS [↩] [↩]
- Environmental subsidies and similar transfers. Eurostat https://ec.europa.eu/eurostat/databrowser/view/env_esst_cepgg/default/table [↩] [↩]
- Cooling and heating degree days by country. Eurostat https://ec.europa.eu/eurostat/databrowser/view/nrg_chdd_a/default/table [↩]
- Real gdp per capita. Eurostat https://ec.europa.eu/eurostat/databrowser/view/sdg_08_10/default/table [↩]
- Electricity prices for household consumers. Eurostat https://ec.europa.eu/eurostat/databrowser/view/nrg_pc_204/default/table [↩]
- Gas prices for household consumers. Eurostat https://ec.europa.eu/eurostat/databrowser/view/nrg_pc_202/default/table [↩]
- Electricity market design. European Commission https://energy.ec.europa.eu/topics/markets-and-consumers/electricity-market-design_en [↩] [↩]
- Renewable Power Generation Costs in 2020. IRENA https://www.irena.org/publications/2021/Jun/Renewable-Power-Costs-in-2020 2021 [↩] [↩]
- Contracts for difference. GOV.UK https://www.gov.uk/government/collections/contracts-for-difference 2025 [↩]
- European alternative fuels observatory. European Commission https://alternative-fuels-observatory.ec.europa.eu/transport-mode/road/european-union-eu27 [↩]
- A. Bergek, S. Jacobsson, B. Carlsson, S. Lindmark, A. Rickne. Analyzing the functional dynamics of technological innovation systems: a scheme of analysis. Research Policy. Vol. 37, pg. 407–429, 2008 https://doi.org/10.1016/j.respol.2007.12.003 [↩]