
Abstract
In the wake of the COVID-19 pandemic, adolescents have reported increased difficulties with focus. These challenges coincide with heightened screen time and irregular sleep patterns. Prior research has explored the relationships between music, personality, and focus separately. However, no study has examined how personality type may moderate the impact of background music on attention. This is an issue worth examining because understanding the relationship between personality, music, and focus could help students or working adults improve task efficiency with a simple fix. This study investigates whether a correlation exists between music type (preferred or piped-in) and focus in high school students with Type A and Type B personalities. A quasi-experimental design was used to measure focus using the Digit Vigilance Test (DVT). Twenty-nine students aged 14–18 from a private high school were classified as either Type A or Type B through a modified MBTI survey. A modified version was used as a result of a lack of funds for the study. The survey derived similar questions to ensure they prompted participants to reveal certain traits that classify them as Type A or Type B. The modified survey was compared to the official MBTI test and tested on a few sample participants and yielded exact matches. The 16 personalities were able to fit into the A,B,C, D system: Type A ( ENTJ, ESTJ, ENTP, ESTP) and Type B ( ENFP, ESFP, ENFJ, ESFJ). Participants were divided into six groups based on personality type and music condition (no music, piped-in, or preferred). Focus was evaluated based on completion time and omission errors, and results were analyzed using t-tests and Chi-Square Tests of Independence. There was no statistically significant relationship between average DVT completion time and music type across personality groups. However, a significant positive correlation was found between omission errors and personality type when piped-in music was introduced, with Type B individuals showing improved focus and reduced errors. Type A participants exhibited greater variability and sensitivity to music stimuli. This study suggests that background music impacts focus differently based on personality. Type B individuals benefit from piped-in music, while Type A individuals may be more distractible. These findings support personalized auditory strategies for improving focus in educational settings.
Keywords: focus, adolescents, background music, personality types, Digit Vigilance Test, Type A, Type B, attention
Introduction
Personality shapes how individuals approach situations. According to the International Journal of Progressive Sciences and Technologie, it “refers to a person’s characteristic patterns of thought, emotion, and behavior, together with the psychological mechanisms—hidden or not—behind these patterns”1. While characteristics vary widely, people draw on certain cognitive behaviors and strategies in daily life2. These sets of behaviors are called personality types.
Personality Types
Type A
A University of California, Berkley, and University of Madison, Wisconsin study utilized a taxometric approach derived from Meehl and Golden to conclude that “most people tend to have either Type A or Type B personality, with relatively few people in between”3. Although most people tend to fall into one of those two personality types, the categories behave quite differently from one another. Type A individuals are described as “[…] intense striving for achievement, competitiveness, aggressiveness, pressures for vocational activity, excessive sense of time urgency, impatience and restlessness”. While Type A personalities are more driven towards accomplishment, they are prone to coronary heart disease as a result of a default higher level of stress4. Another study’s conclusions agree with the load of stress in Type A individuals. It proves that most medical students are individuals with Type A personality5. Additionally, the stigma that medical students tend to be workaholics directly aligns with the fact that in Sharma and Jain’s study, workaholic was found to be a leading behavioral trait in individuals classified as Type A personality6.
Type B
Type B personality is very polar to Type A. A study done by the American College of Greece Athens studied the characteristics of individuals with Type B personality. They found that “Type B individuals are characterized by a stress-free way of operating. They are patient, relaxed, easy going, and usually do not have conflict with co-workers. They maintain a stable personality and are almost always even tempered. Finally, they are able to adjust easily to new environments7. With the findings of these several studies, it can be concluded that Type A and Type B behave very differently from one another and utilize different approaches to situations. However, all teens of all personality types experienced a shift in focus when the COVID-19 pandemic shut down many social interactions and activities in 2020, leading to excess boredom and screen time. This raises the central research question: Is there a correlation between preferred music and piped-in music with focus in high schoolers with Type A and Type B personalities? This is a crucial topic to explore, as focus impacts nearly every aspect of people’s lives. For high school students, focus is essential for learning effectively and earning strong grades for college applications. For adults, it is key to maximizing productivity, advancing careers, and providing for themselves and their families. In both cases, sustained focus is critical to success.
Importance of Focus
Impact of Technology and Sleep
A correlational study from the Journal of Coastal Life Medicine indicates that “due to the e-learning method, most students are simultaneously greatly addicted to social media like WhatsApp, Facebook, etc.8. These social media addictions are difficult to break as teenagers are addicted to the dopamine high that comes with doom scrolling on social media platforms such as Instagram or TikTok. The pandemic ultimately aided teenagers in building detrimental addictions. Furthermore, the online learning method seriously affected their concentration. Post-pandemic, there were significant changes in children in terms of their attention span and writing skills, which have both taken a toll.
Music and Focus
Effects of Music Intensity and Tempo
Scientists have recognized the widely prevalent issue and began researching ways to combat the problem. A 2010 quasi-experimental study tested college students’ performance on tasks with different types of music playing. Types of music referring to difference in genre, tempo, and lyrics. It was concluded that “…music with a higher intensity is more distracting and has a greater effect on task performance and concentration”9.
Music Preferences and Personality
Knowing that music can significantly affect one’s focus is extremely important in educating teens, as well as adults, on how to combat their struggle with focus. The current generation of teenagers places a strong emphasis on music dependency. On average, teenagers spend 2.45 hours each day listening to music10. Some of this time, in fact most of this time, including when they sit to do schoolwork. Teens would rather listen to music they like instead of music that may help them focus better when doing homework11. Knowles introduces a new aspect of music, the fact that one’s personality guides preference: “Research has determined that with certain music, there are collective traits the person is more disposed too. Therefore, there is a definite relationship between one’s music preference and personality”11. As teens are more likely to play preferred music in the background while performing focus demanding tasks, it would be in their best interest that focus would increase as a result of listening to preferred music. Kiss and Linell’s study corroborates with Knowles and states: “findings show for the first time that preferred background music can enhance task-focused attentional states on a low-demanding sustained-attention task and are compatible with arousal mediating the relationship between background music and task-performance”12. While preferred music has been confirmed to positively affect focus, slower music tempos have not. Chou’s results also found that “…reading rate and efficiency was significantly reduced in the slow tempo music group as compared to the fast music group”9. A 2009 pilot study conducted by researchers at Fu Jen Catholic University challenged these claims by showing that piped-in music—commonly used in hotel lobbies, elevators, and restaurants to create a calm, slow-tempo atmosphere—actually improved attention. Participants scored significantly higher on Chu’s Attention Test when exposed to piped-in music13.
Addressing the Gap
Knowing that personality directly affects an individual’s preference in music solidifies the fact that people with different personality types will perform differently with different types of music playing in the background. A study from the Bulletin of the Council for Research in Music Education reinforces the ideas from the Kiss and Linell study that preferred music is proven to facilitate focus14. Additionally, Shih and colleagues’ study proves that piped-in music also helps facilitate focus, which strengthens the correlation between music and focus. Continuing, Knowles’ study proves that an individual’s personality influences their preference in music. Even with all these scholarly studies, it has not been researched whether there is a correlation between preferred music and piped-in music on focus in Type A and B personalities. The variable of personality has never been brought into the equation of focus. Raj and Vijayakumar’s study illustrates how this issue of lack of focus has spiked since the COVID-19 pandemic and is difficult to counteract. A quasi-experimental study using analysis to find relationships between variables is most suitable for this topic as there are other factors that influence and facilitate focus. For example, whether the participant had caffeine before the study, mood, or how many hours of sleep they got the night before.
Measuring Focus: The Digit Vigilance Test
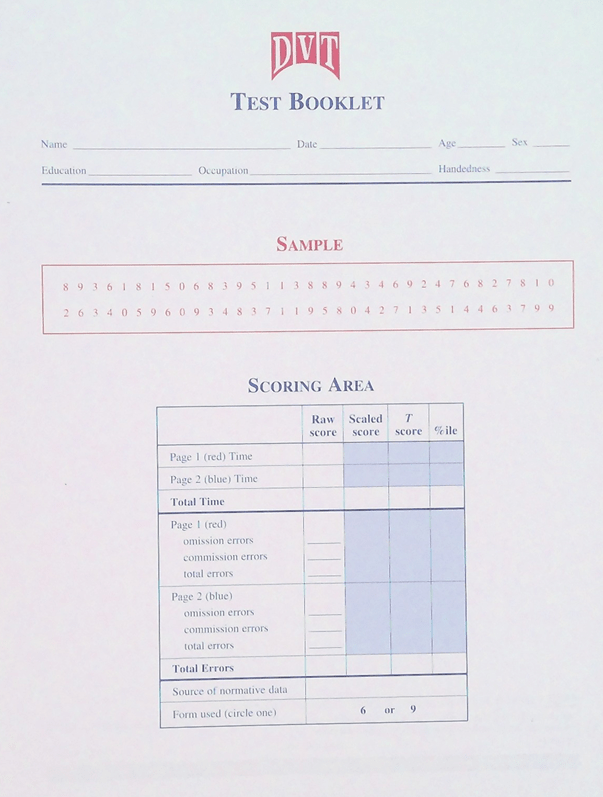
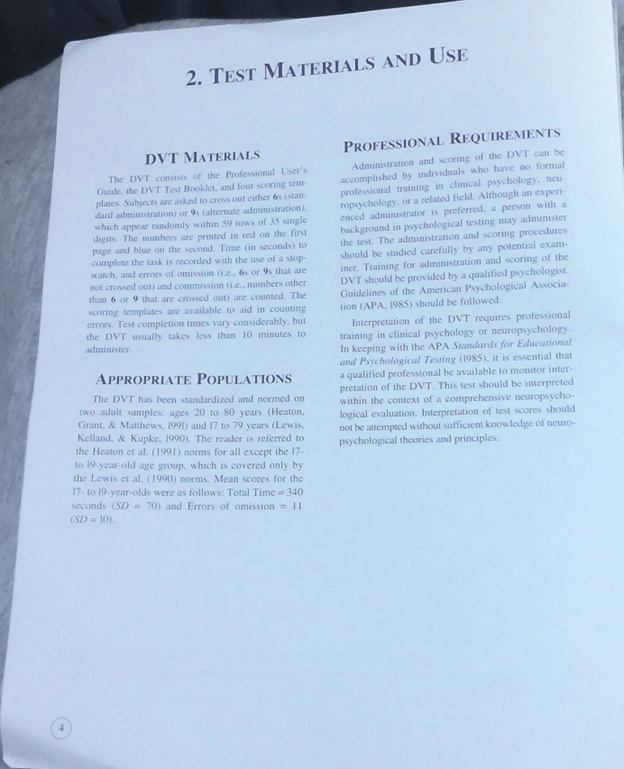
Evidently, focus has been a growing issue which will eventually lead to a regressing society if not combated soon. Ronald Lewis, PhD developed a test composed of cognitive, perceptual, and motor tasks designed to be sensitive to focus, the Digit Vigilance Test. Through his research he categorizes focus into three parts: alertness, selectivity, and processing capacity. In his development of the DVT, alertness was targeted as it involves vigilance during boring, repetitive tasks and the DVT is in fact a boring repetitive task. The DVT places minimal demands on the selectivity and capacity components of focus (PAR Inc. User’s Guide, 1996). Through testing of the DVT Lewis found that the DVT was insensitive to repeated administrations accruing from multiple trials. They also found high test reliability when comparing the one-page version to the two page version (p= .001).
Methods
Study Goal and Justification
This study aimed to determine whether a correlation exists between focus, music genres, and personality types among adolescents aged 14-18. To make results as representative as possible, only Type A and Type B personality were examined as justified by Robins et al., 1998 in the literature review. Two types of music were tested: piped-in music and preferred music. Research by Adriano & DiPaola indicated that listening to music while completing school assignments is a common practice among adolescents15. Additional studies11’12’14 further support the prevalence of this behavior, with listening to music becoming a routine for most adolescents. The selection of piped-in music was based on findings from Shih et al., which demonstrated its effectiveness in improving performance on Chu’s Attention Test more than any other music genre. The focused demographic was justified by research from Raj & Vilkamar and Gillick & Magoulias, which highlighted increased difficulties in focus among students in this age range following the COVID-19 pandemic8’16. The study was conducted at a private school as Mingle et al. found that private school students tend to experience higher levels of social media and screen time addiction, which can contribute to focus-related issues17.
Study Design
While prior studies have examined the relationship between personality and music choice 11. and the effects of music on focus9, this study addressed the gap in research on the interaction between personality and music in influencing focus. Given the limited existing research, no existing datasets adequately addressed the research question, necessitating primary data collection, necessitating an experimental design. This approach allowed for the collection of primary data, which was analyzed using a Chi-Square to identify patterns without inferring causality, ultimately providing an aligned answer to the research question. Potential external factors such as rushing through tasks, preoccupied thoughts, lack of sleep, and caffeine consumption were acknowledged and therefore the study cannot prove causation, only correlation. The study employed descriptive and inferential statistics, including Chi-Square of Independence tests and t-tests, to interpret results.
Participant Selection
Because the study involved human participants IRB approval was required and obtained. Participants had to meet the following criteria: enrollment in high school, age between 14-18 years, classification as Type A or Type B personality, enrolled in the specific private school. Recruitment was conducted via email, ensuring broad accessibility since all students at the private school were assigned a school-affiliated email address. 520 students were contacted, 94 responded, and 29 remained through the study . Rather than sending individual emails, the recruitment message was distributed to the entire student body by utilizing the grade-specific email groups, which automatically included all students within each respective high school grade. Emails were sent out multiple times in an effort to gain as many participants as possible.
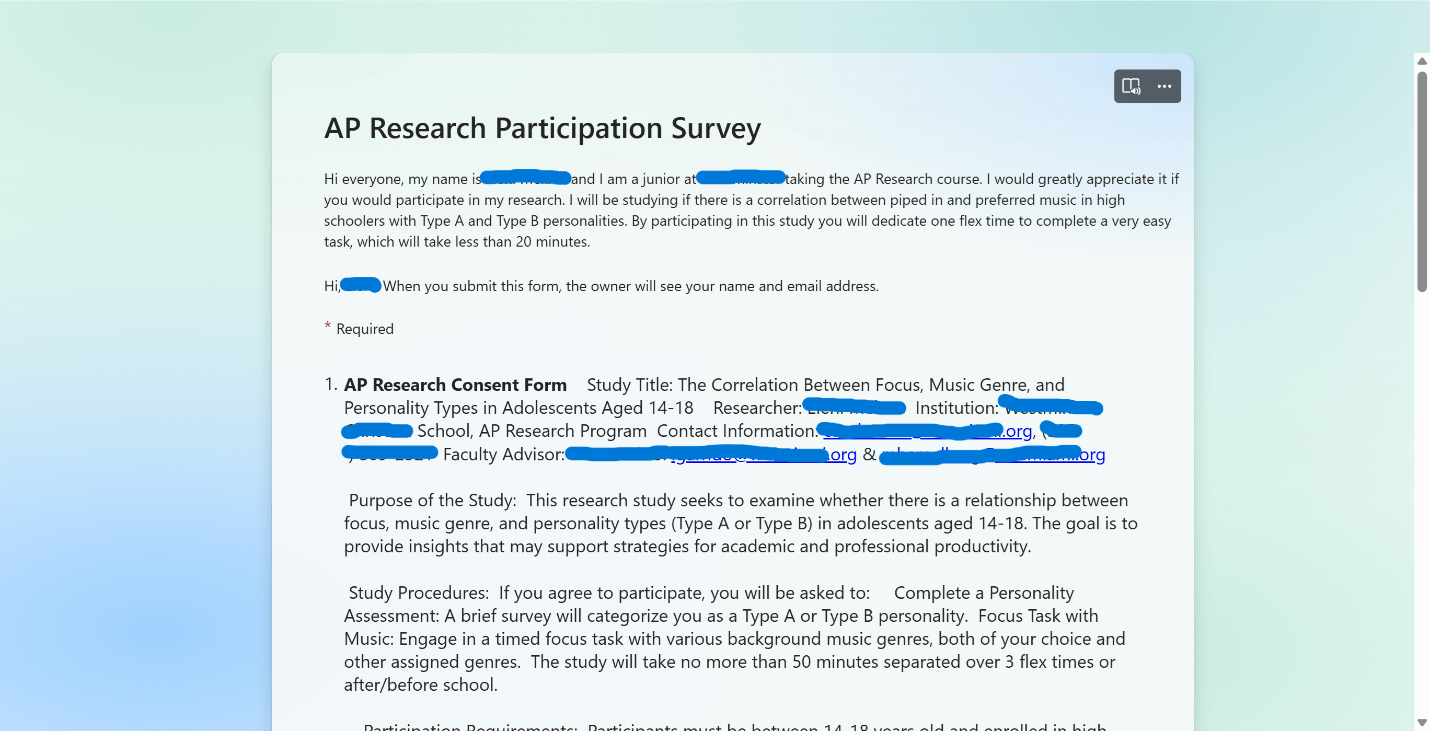
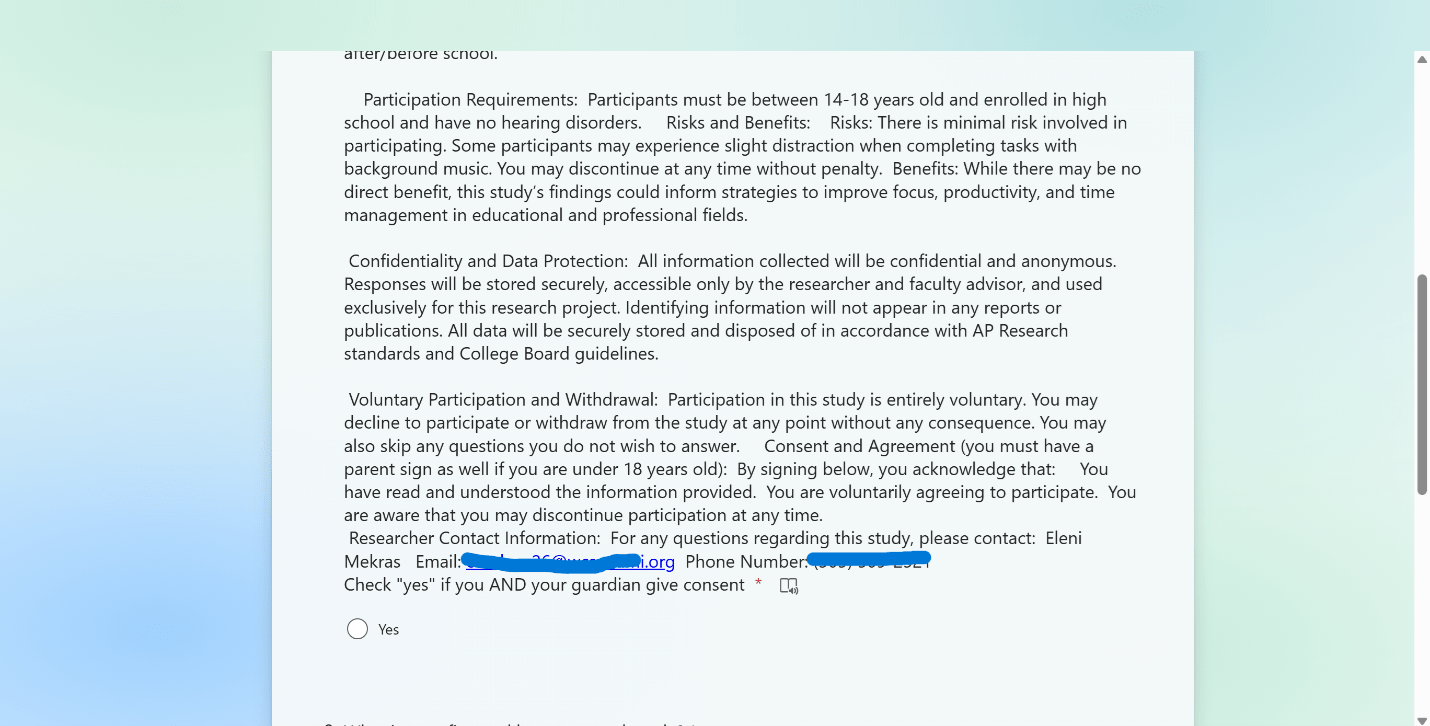
A Microsoft Forms survey, familiar to students due to the school’s requirement for Microsoft Surface Pro devices, was used to collect demographic information, including age and grade level. First and last name were required to keep participants organized and facilitate follow-up communication if they were approved to proceed to the next step, which was taking the personality survey. The survey also obtained informed consent from both participants and their parent/guardian. Potential participants were informed about the goal of this study, what they would be entailed to do, confidentiality of this study, as well as the right to withdraw at any time. Approved participants advanced to the personality assessment phase. See Appendix C for the Microsoft participation form which also includes the consent form. Per confidentiality guidelines all information regarding identifying details, including researcher names, school information, and personal contact information, has been redacted from the consent form.
Personality Assessment
A modified version of the Myers-Briggs Type Indicator (MBTI) was administered via Google Forms to classify participants into five personality types: A, B, C, D, and X; See Appendix D. The MBTI, widely used in professional settings, assesses personality based on responses to situational questions. The Myers–Briggs Type Indicator (MBTI) utilizes a series of self-report questions designed to uncover consistent behavioral tendencies and cognitive preferences. Although the MBTI categorizes individuals into sixteen personality types rather than the binary Type A/Type B framework, the underlying process is similar: responses are analyzed to reveal stable traits that shape how a person approaches tasks, stress, and decision-making. In this way, MBTI results can highlight characteristics—such as competitiveness, urgency, or calmness—that align with qualities traditionally associated with Type A or Type B personalities. The survey derived similar questions to ensure they prompted participants to reveal certain traits that classify them as Type A or Type B. The modified survey was compared to the official MBTI test and tested on a few sample participants and yielded exact matches. The 16 personalities were able to fit into the A,B,C, D system: Type A ( ENTJ, ESTJ, ENTP, ESTP) and Type B ( ENFP, ESFP, ENFJ, ESFJ). The test consisted of 20 multiple-choice questions. Participants were classified based on majority responses, with ties resulting in a Type X designation. Only Type A and Type B participants were approved for the study, as previous research3 and a pilot test at the study site confirmed that the majority of the population falls within these two categories.
Group Formation
Participants were divided into two primary groups based on personality type: Type A and Type B. Within each group, participants were randomly assigned to one of three subgroups to ensure validity: a control group (no music), a piped-in music group, and a preferred music group. The groups were labeled as follows:
- Type A: AC (control), AE1 (piped-in music), AE2 (preferred music)
- Type B: BC (control), BE1 (piped-in music), BE2 (preferred music)
The groups were assigned categorical variables because the independent variables were Type A and B as well as no music, preferential music, or piped in. Since these variables are not quantitative but categorical, a Chi Square Test for Independence was run to account for the multiple variables and the outcome of time in one instance and errors in another. A T test was also performed but only arrived at a significant difference between control compared to preferred music with the preferred music being quicker for the Type B group.
All participants completed the Digit Vigilance Test (DVT), with control groups taking the test in silence, AE1 and BE1 listening to piped-in music, and AE2 and BE2 listening to preferred music.
Administration of the DVT Test
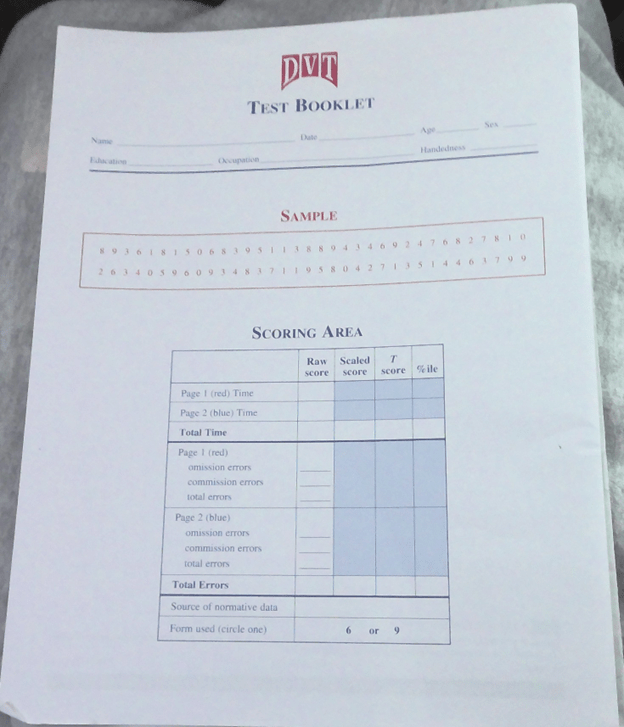
The DVT test was bought from PAR Inc. and included copies of the test, a user’s guide, and scoring keys- See Appendix E. The information in the literature review was derived from PAR Inc.’s user’s guide.
Administration of the DVT can be accomplished by individuals who have no formal training or professional qualifications. However, to purchase the DVT from PAR Inc. one must be a certified member of one of the six psychological associations of America listed in Appendix A. The DVT was purchased for this study by an eligible school counselor.
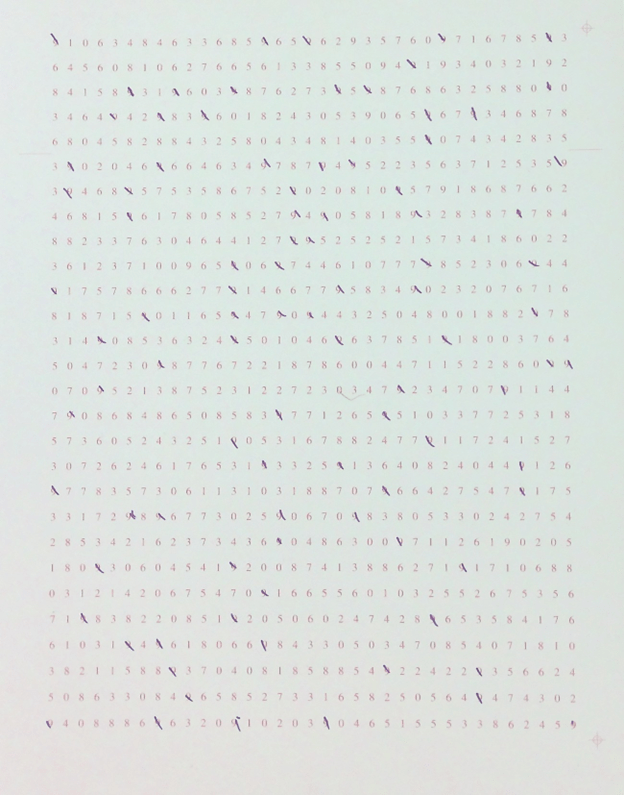
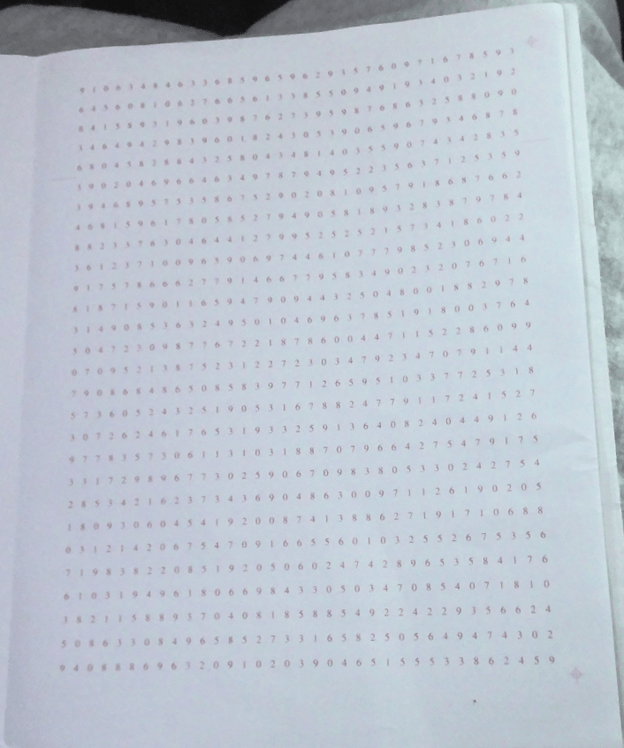
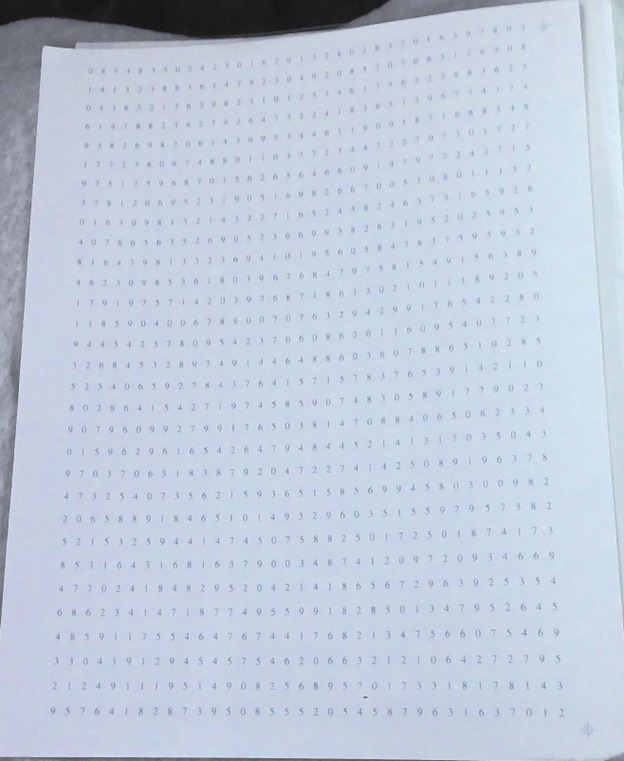
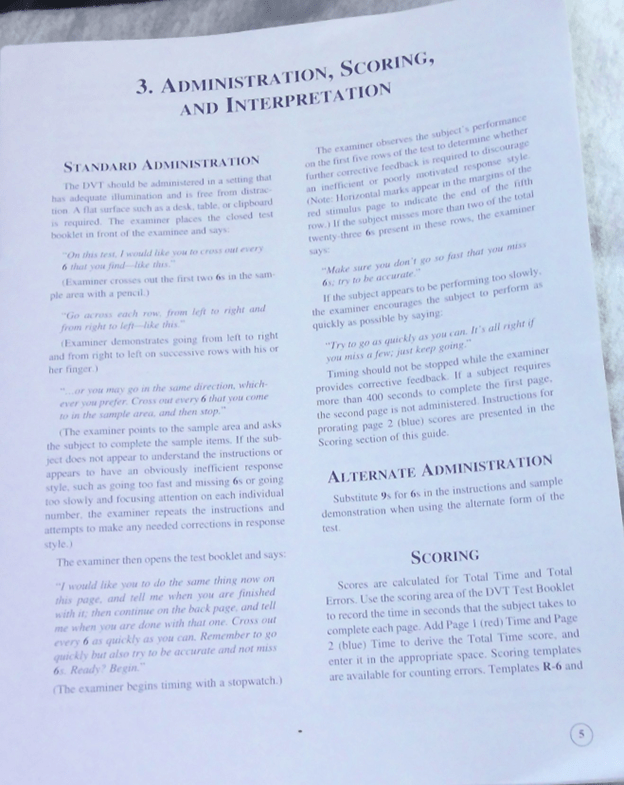
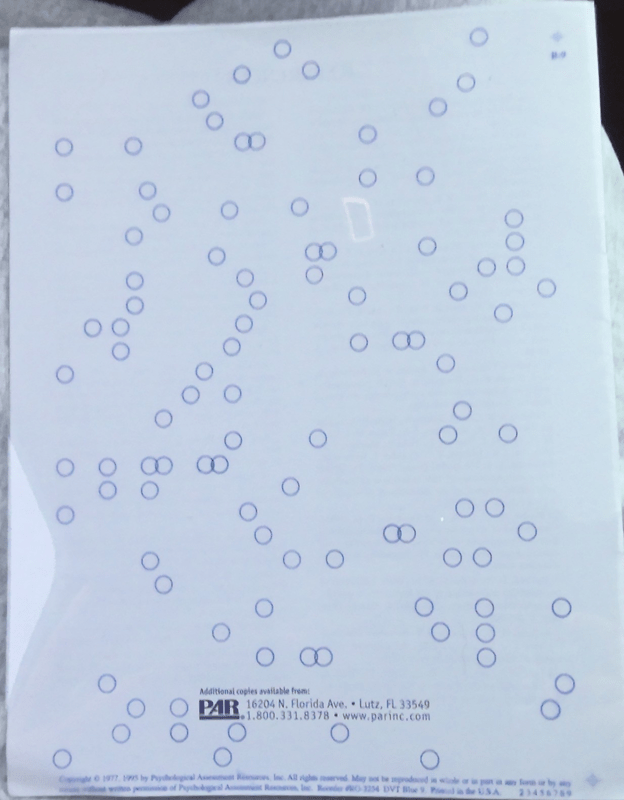
In the DVT a sheet of hundreds of digits 1-9 are scrambled on two sheets of paper. Participants are given specific instructions, found in the user’s guide, to complete the test. They are asked to cross out only the 9s on the sheets. Alternate administration of crossing out 6s is also valid but not used in this study as the administration instructions stated to select only one digit to cross out. See Appendix B for student samples. The DVT is scored with total time (measured in seconds) and errors. If one takes more than 400s to complete page 1 they are asked not to complete page 2. The DVT should take less than 10 minutes. Errors of omission (6s or 9s that are not crossed out) and commission (numbers other than 6 or 9 crossed out) are combined for total errors. The original form of admission (9s) was used for this study. Increased time indicates slow processing speed, but more important to this study, omission indicates a lapse in attention.
To maintain anonymity but stay organized, participants were assigned unique codes. Participants met in a designated classroom during a free period in the school day to complete the test simultaneously, ensuring consistency. Three periods were needed to conduct the DVT tests with all groups. One period for AC and BC, one period for AE1 and BE1, and one period for AE2 and BE2. A fourth period was conducted to give participants who did not show the first time an opportunity to participate and collect as much data as possible. The DVT test was administered in paper format. This is because the participants’ computers were attached to the school organization which prohibited the downloading of the software needed to take the C-DVT (computerized DVT). According to a study done by Newcastle University on cognitive tests, the DVT test yields results just as valid and reliable as results from the C-DVT18. The DVT was administered once per group; multiple trials were not needed as the DVT is “relatively insensitive to the effects of repeated administrations and practice” (PAR Inc.). The test was conducted in a quiet, distraction-free environment. Participants provided their own headphones, following 13Darrow et al.’s protocol, and for those in the preferred music group, a 20-minute playlist they brought with them. A Deci-meter was used to ensure the quality/volume of the music was standardized. Piped-in music was delivered via a standardized YouTube playlist accessed through a QR code created online via Online QR Code Generator.
Participants received standardized instructions and a practice trial before beginning. They were instructed to complete the test as quickly and accurately as possible, marking only the number 9. They were told to raise their hand once finished with page 1 and do the same when finished with page 2. Completion time was recorded as a stopwatch was running for the whole of the experiment, and participants exceeding the seven-minute threshold per page were instructed to stop (as per PAR guidelines). Time was recorded using a stop watch and an additional volunteer to stop the stopwatch accurately. The timer was blinded to the group.
Data Collection and Analysis
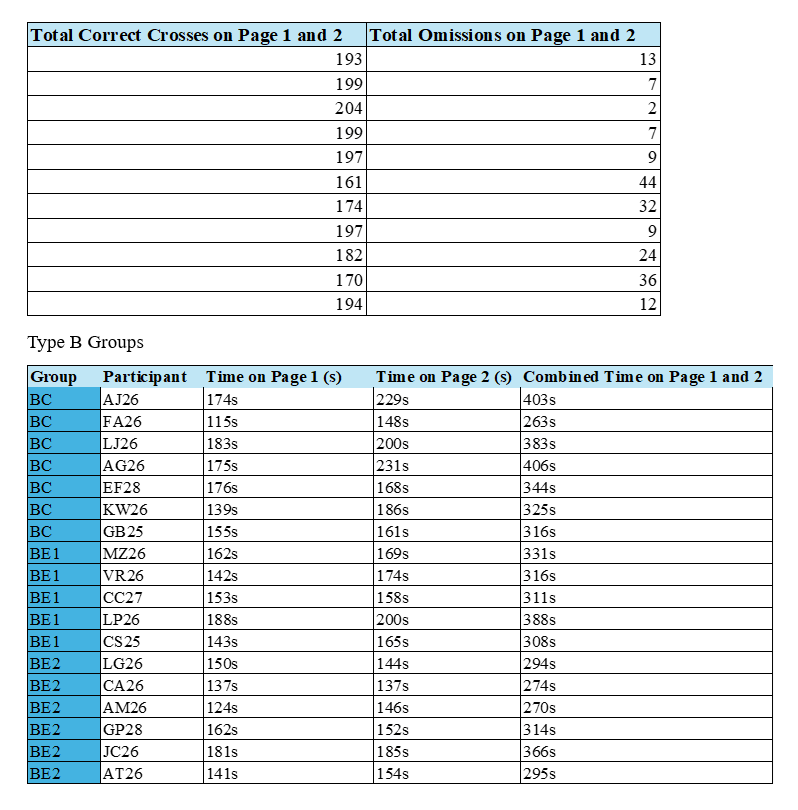
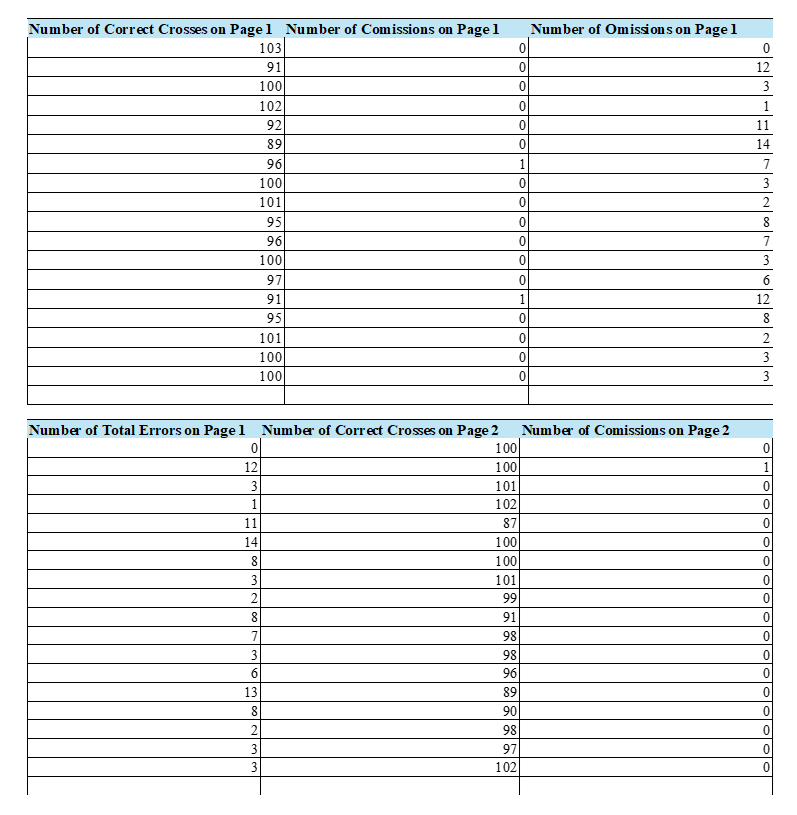
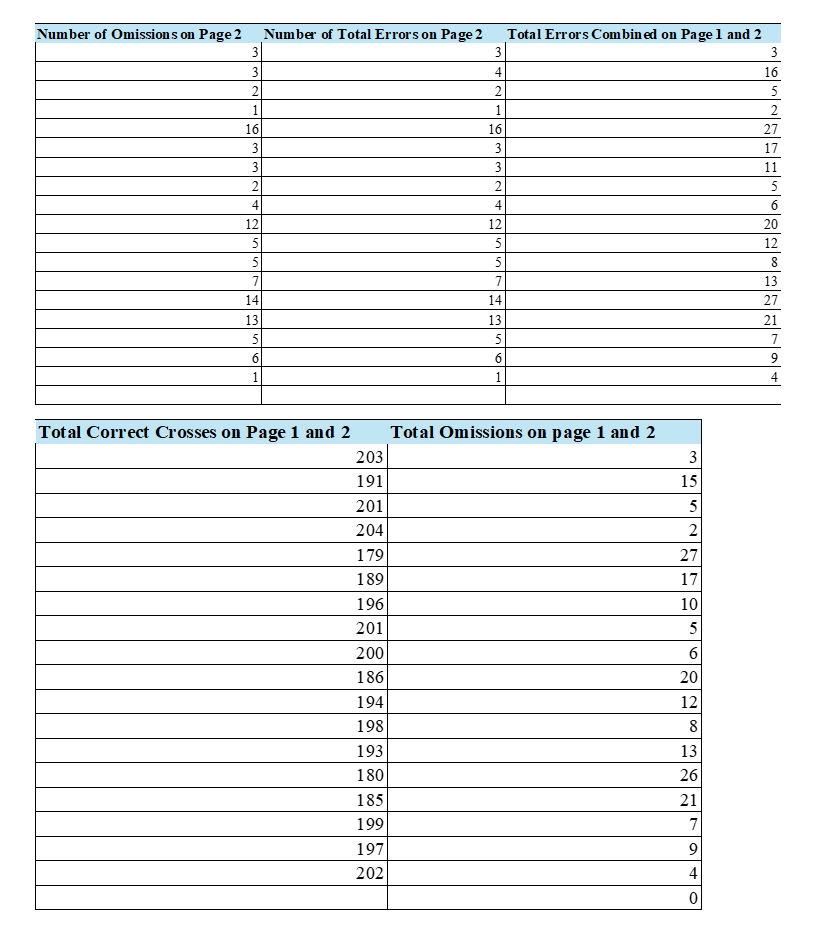
The DVT scoring process followed the PAR guidelines. Recorded metrics included:
- Time taken to complete each page and total time
- Number of correct markings on each page and combined on both pages
- Number of commissions (incorrect markings) on each page and combined on both pages
- Number of omissions (missed targets) on each page and combined on both pages
Results
Descriptive Statistics
Participant Outcomes
In this study a total of 94 participants responded to the initial survey, and 60 completed the personality survey. Of the 60 that completed the personality survey, 39 were classified as Type A or B, and 23 as Type C, D, or X. After accounting for dropouts, 29 participants remained: three in grade 9, two in grade 10, 17 in grade 11, and seven in grade 12 (10 males, 19 females). Participants were distributed across the six groups as follows:
- AC (n = 3)
- AE1 (n = 4)
- AE2 (n = 4)
- BC (n = 7)
- BE1 (n = 5)
- BE2 (n = 6).
For each group, the average time and standard deviation (SD) to complete the DVT were recorded. The raw data from this study can be found in Appendix F. Both average and standard deviation are considered measures of descriptive statistics.
DVT Completion Time (avg)
As displayed in Table C, using each participant’s time in their respective groups, an average time to complete the DVT test was calculated for each of the six groups. As displayed in Chart A, a standard t-test was also conducted to determine the statistical significance of these times.
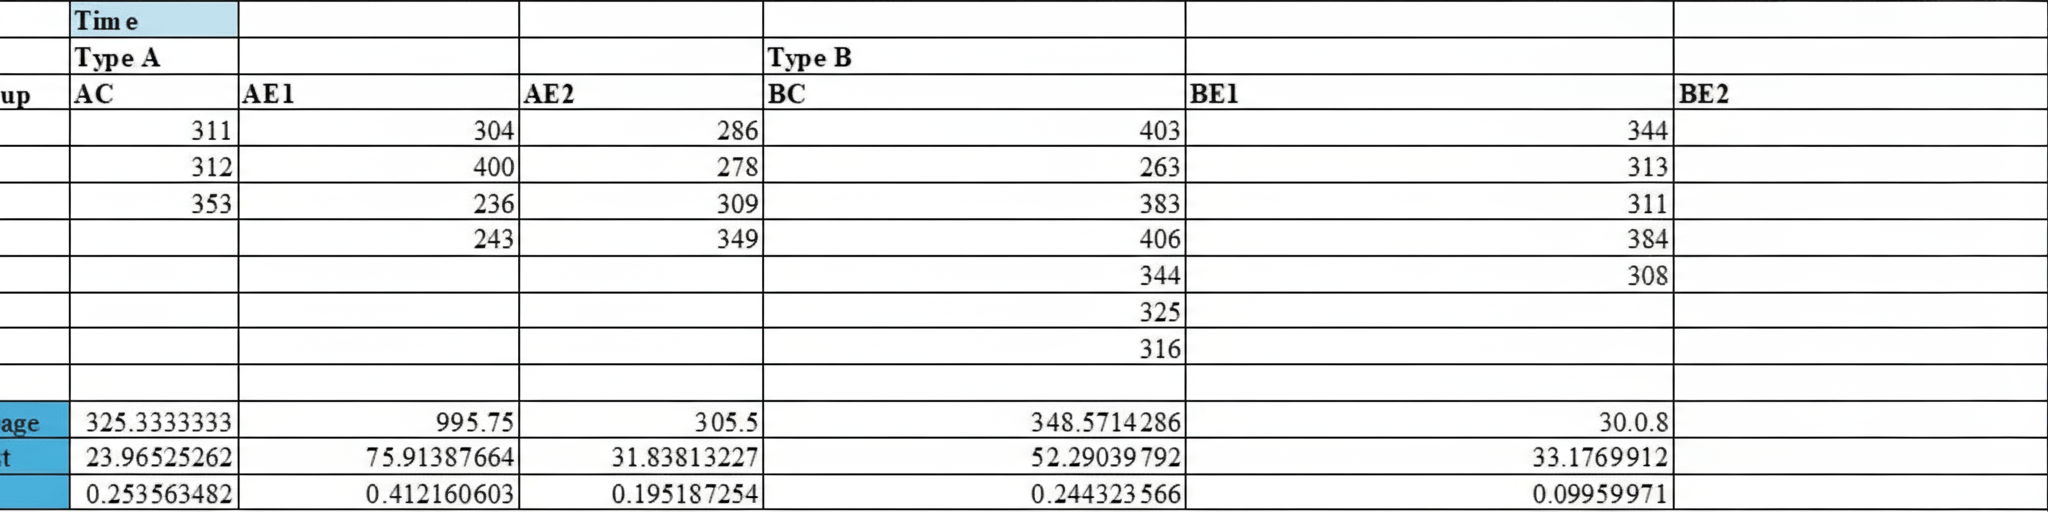

On average, group AC took 325.33 seconds to complete the DVT. This measure had a standard deviation (SD) of 23.97. Group AE1 took 295.75 seconds (SD = 75.91), and group AE2 took 305.50 seconds (SD = 31.84).
Among the B groups, group BC had an average completion time of 338.57 seconds (SD = 52.29), group BE1 took 330.80 seconds (SD = 33.18), and group BE2 took 302.17 seconds (SD = 35.10).
Although the Type A groups showed less average time to complete the DVT on two out of three of the groups, all six groups still fell within the appropriate time range provided by PAR Inc. (340 seconds SD=70), which is a preliminary indicator pointing to appropriate conduction of the DVT tests.
DVT Omissions
Using the same process, an average number of omissions per group was calculated and a t-test was done. See Table D for the average number of omissions per group and Chart B for the t-test on those averages.
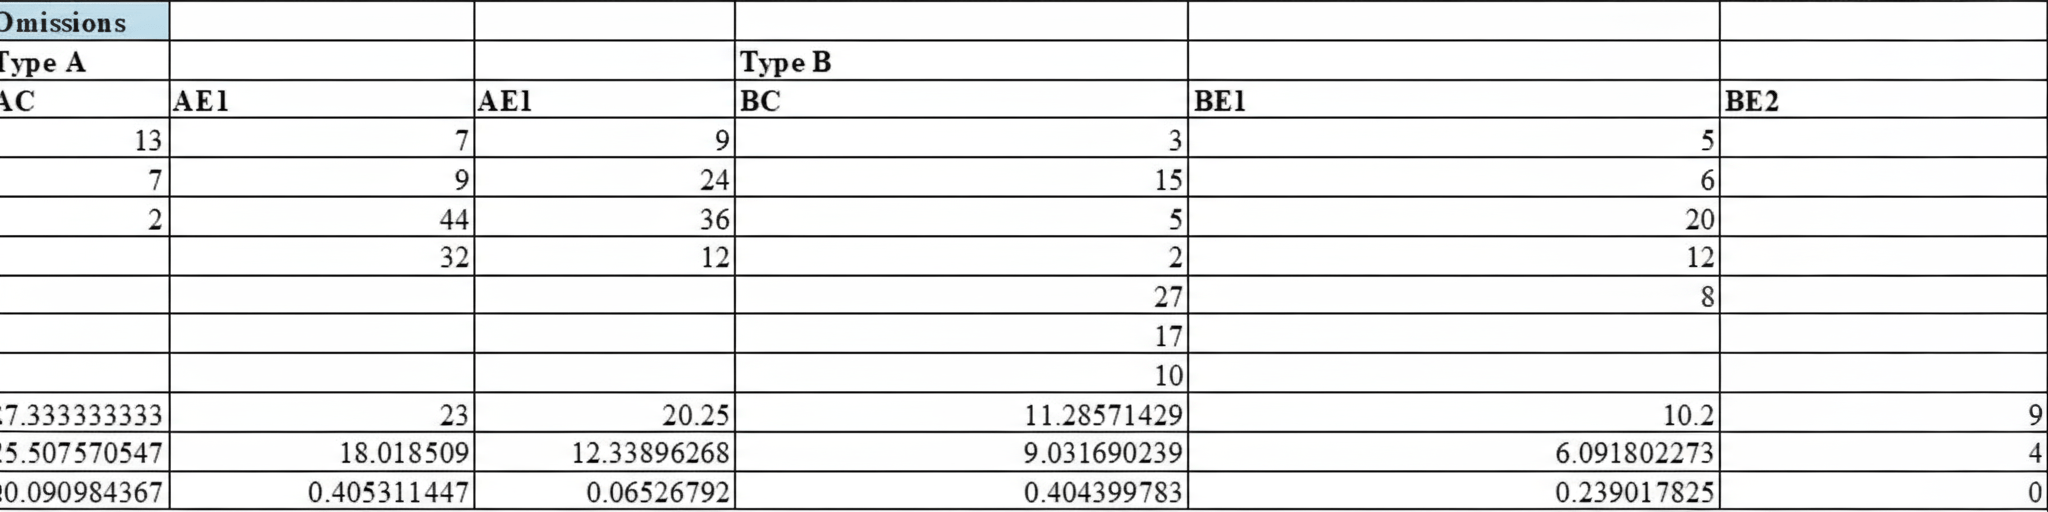

Omission errors also varied across groups. On average, group AC made 7.33 omissions (SD = 5.51), group AE1 made 23.00 omissions (SD = 18.02), and group AE2 made 20.25 omissions (SD = 12.33).
Among the B groups, group BC had 11.23 omissions (SD = 9.03), group BE1 had 10.20 omissions (SD = 6.10), and group BE2 had 7.67 omissions (SD = 4.97).
Results indicate that the Type A groups had a significantly higher number of omissions than the Type B groups. However, this trend is contrasted with the previous data point where Type A groups had a lesser average time. Referring to the literature review, the data referencing the Type A groups’ low completion time indicates good proficiency, but the number of omissions contradicts this observation as a higher number of average omissions indicates a lapse in focus. Descriptive statistics suggest a pattern that requires further testing, a trend of the Type B groups having better focus is displayed.
Inferential Statistics
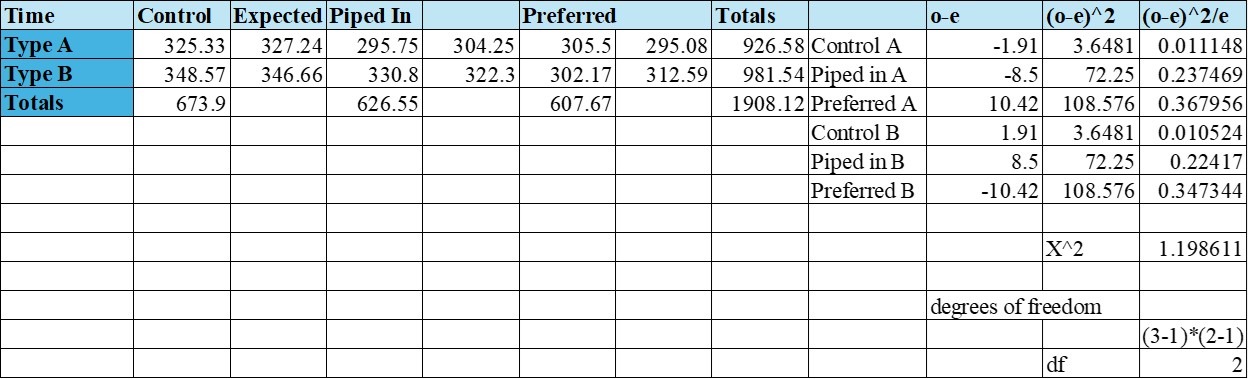
Using the averages of total omissions and time to complete the DVT for each of the 6 groups described above and displayed in Tables C and D, a Chi-Square of Independence test was conducted. This test was used to evaluate the relationship between the variables as Spearman’s or Pearson’s correlation would not be suitable because the independent variable (music type) was qualitative. Standard t-tests were also performed to analyze the 3 central hypotheses: 1. Adolescents exhibit greater focus when listening to their preferred music compared to piped-in music. 2. Type B individuals experience greater focus with piped-in music than compared to Type A. 3. Type B individuals may show less variation in focus across music conditions due to a generally more relaxed disposition.
The Chi Square Test of Independence performed exploring the relationship between average time, personality and music type, showed no statistically significant difference and therefore the null hypothesis (1) failed to be rejected (See Table A).
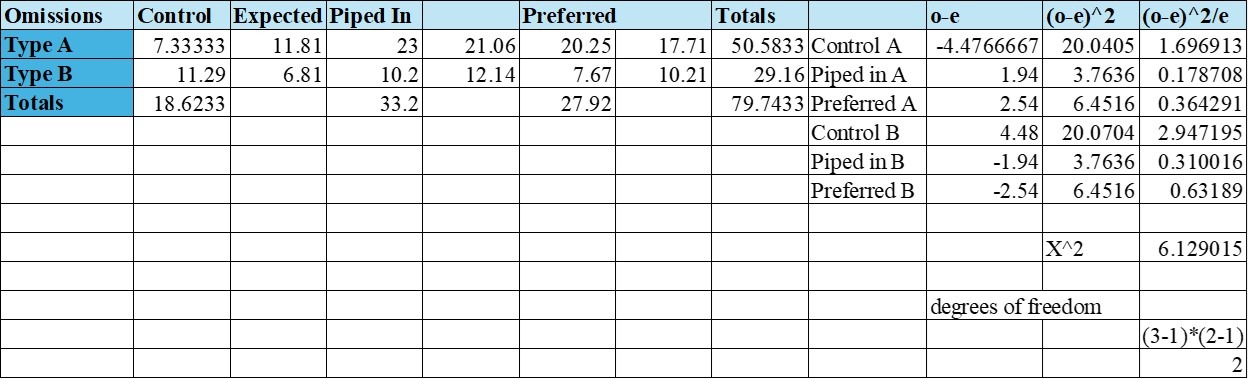
However, the Chi Square Test for Independence performed analyzing the total omissions that resulted between personality type and music listened to did demonstrate statistical significance. Therefore, the null hypothesis (2 and 3) was rejected. There was a correlation between music and personality type with respect to focus (p< 0.05) (See Table B).
Discussion
Hypotheses
Hypothesis 1
Hypothesis 1 proposed that adolescents would exhibit greater focus when listening to preferred music compared to piped-in music, considering both Type A and Type B personality types. A Chi-Square Test of Independence (Table A) was conducted to assess the relationship between music type (preferred vs. piped-in) and focus levels across these personality types using the average times.
The analysis revealed a non-significant association (p > 0.05). There was insufficient evidence to reject the null hypothesis. This indicates that, within the scope of this study, there was no statistically significant relationship between the type of music listened to and focus levels, regardless of whether participants were classified as Type A or Type B. In other words, the findings suggest that neither preferred music nor piped-in music significantly influenced focus in this adolescent sample, irrespective of personality type which contradicts the results from Kiss & Linell’s 2021 study. It is possible that with a larger sample, results would have supported Kiss & Linell’s study. Kiss & Linell’s study could have had a different sample, whether it be with age or culture.
Hypothesis 2
Hypothesis 2 posited that Type B individuals would exhibit greater focus with piped-in music than Type A individuals would experience as Type As are more sensitive to external stimuli. To investigate this, a second Chi-Square Test of Independence was performed, analyzing the average number of omissions between the piped-in groups: AE1 and BE1.
The analysis revealed a statistically significant effect (p < 0.05), indicating that the BE1 group’s focus was positively influenced by piped-in music. Consequently, the null hypothesis was rejected. Corroborating Shih et al.’s study and contradicting Chou’s study, this significant finding suggests that, similarly to the initial prediction, Type B individuals demonstrated improved focus in the presence of piped-in music. This result provides evidence supporting hypothesis 2 indirectly as BE1 having increased focus compared to AE1 suggests that Type A individuals do have an increased sensitivity to piped-in music.
Hypothesis 3
Lastly, hypothesis 3 proposed that Type B individuals would exhibit less variability in focus across different musical conditions, reflecting a generally more relaxed disposition. While statistical significance was observed solely within the BE1 group, partial support for this hypothesis can be inferred. Specifically, none of the Type A groups demonstrated a significant effect of either music genre on focus levels. This absence of significant variation in the Type A groups, juxtaposed with the significant finding in the BE1 group, suggests a potential trend wherein Type B individuals may display a more stable focus response across varying auditory stimuli.
Overall, only one statistically significant result was observed: Type B individuals’ focus is influenced positively by piped-in music indicating a correlation between focus and piped-in music in adolescents with Type B personality. Type B personalities tend to have a more stable focus across all music genres.
Limitations & Delimitations
Limitations
The biggest limitation to this study was the sample size. The population being tested was around 500 students, however only 29 participated until the end. Having a small sample size makes it difficult to find statistically significant results that can be applied to the general population of all teenagers. Because of the small sample size it is probable that more variability and Type II error is present, leading to a study with a lower power. Additionally, the variable sleep introduces a confounding factor that can affect results. “Their sleep patterns have also gone for a toss, leading to irritability.”8. This study introduces another variable that only contributed to the issue of focus: sleep. It is known that sleep and focus are correlated very strongly, and the irregular sleep patterns are only hurting teens more. Raj and Vijayakumar’s study places significance on a huge issue affecting teens around the world in their struggle to focus since the pandemic. Furthermore, another limitation in this study was that the personality tests were self-reported data, which could hold self-reported bias. As personality is not a factor that can be measured as right or wrong, the classification of personalities relies solely on the participant answering the questions honestly. This is a limitation because many people are not accurate in how they describe themselves due to either cognitive dissonance, or fear of judgement. An additional limitation similar to this is the assumption that all participants put their maximum effort into the DVT test. If participants were not exerting their best efforts, it is another factor that could lead to skewed results. The participant drop out that occurred in this study was also a big limitation. There was a significant drop out rate, which as stated earlier in this paragraph makes it difficult for the results to be generalized. While piped-in music was controlled for the AE1 and BE1 groups the preferred music was not controlled for the AE2 and BE2 groups, which introduces the factor of music variability. Because of ethical considerations and lack of participants, those with attention deficit disorders were not excluded from this study possibly skewing results. Lastly, because the study was conducted at one school, results are not significant enough to make conclusions involving the whole population.
Delimitations
While delimitations are controlled, they still place limits on research. In this study only Type A and B personalities were studied excluding a smaller population of Type C,D, and X. The ages of participants in this study were strictly 14-18, as the study wanted to examine the cohort of teenagers that were affected by the pandemic. Only two music types were selected, making the results of this study not applicable to any other genres.
Direction for Future Research
Those in the AE2 and BE2 groups were asked what music genre they were listening to during the experiment. The genres that appeared and the number of times they appeared are displayed in Appendix G. This could be a good area for future research to further develop the relationship between personality and music preference. Including qualitative interviews to deepen understanding of music preferences could be included in a future study. Although 10Knowles’ study examined this relationship, specific genres were not associated with specific personality. This could potentially pave the way to establish a new understanding of this topic. Moreover, participants completed the DVT with many different color pens. It could be investigated whether one’s mood correlates with the color of pen. For example, if they are sad and bring a blue pen. Gender effects were not examined in this study although the topic provides areas for future research. Lastly, the study should be replicated with a validated personality test with built in validity scales, a much larger population, including a larger age range, and the exclusion of attention deficit disorders as this could yield different and more significant results. If this study had a bigger sample, there might have been a significant result with Type A personality. This research is very important in both educational and professional fields. Not only have teenagers seen a decrease in focus but so have adults. Further examining the relationships between personality, music, and focus offers a non-clinical solution that would offer a huge benefit to productivity. Additionally, for children who struggle with attention, this is a relatively easy and harmless intervention for parents to integrate into daily homework routines to avoid mind wandering and frustration. Outside of parenting, this is also an intervention that could be utilized in the classroom setting, or even simpler, high school and college students can use the music found to be the most beneficial for them to study and increase their performance on their exams. Moving on to exploring larger scale implications, if students better understand themselves and are able to develop better study habits, they may feel more confident in pursuing more difficult degrees, such as doctorates, which have been declining in recent years.
Appendix A
- American Board of Professional Psychology (ABPP)
- American Counseling Association (ACA)
- American Mental Health Counselors Association (AMHCA)
- American Occupational Therapy Association (AOTA)
- American Psychological Association (APA)
- American Psychological Society (APS)
- American Speech Language Hearing Association (ASHA)
- International Neuropsychological Society (INS)
- National Academy of Neuropsychology (NAN)
- National Association of School Psychologists (NASP)
- National Register of Health Service Providers in Psychology (NR)
Appendix B

Appendix C

Appendix D


Appendix E


Appendix F

Appendix G
- Country: 1
- Pop: 4
- Rap: 1
- Reggaeton: 3
- Rock: 1
References
- T. Orr. The Constructed Awareness Orientation Theory and Typology: A new model of personality for psychotherapy (2024). [↩]
- Emser et al., 2021 [↩]
- R. W. Robins, O. P. John, & A. Caspi. The typological approach to studying personality. In Methods and Models for Studying the Individual, 135–160 (1998). [↩] [↩]
- A. K. Emser, S. Heintzen, C. Beeser, B. Stoberock, & N. Marquardt. Higher, faster, further: Occupational ethical decision-making under time pressure in Type A versus Type B personalities. Psychology, 12(10), 1678–1710 (2021). [↩]
- A. Hisam, M. U. Rahman, S. F. Mashhadi, & G. Raza. Type A and Type B personality among undergraduate medical students: Need for psychosocial rehabilitation. Pakistan Journal of Medical Sciences, 30(6), 1304 (2014). [↩]
- V. Sharma & S. Jain. Studying the Type A, Type B personality behavioral patterns of working women. Asian Journal of Management, 6(3), 209–214 (2015). [↩]
- A. Samaras & M. Galanakis. Type A and Type B personality types: An evaluation in the modern organizational psychology scope (2023). [↩]
- S. C. Raj, P. CB, & M. Vijayakumar. Impact of COVID-19 on student learning behavior with special reference to adolescent group. Journal of Coastal Life Medicine, 11, 1058–1066 (2023). [↩] [↩] [↩]
- M. T. P. Chou. Attention drainage effect: How background music effects concentration in Taiwanese college students. Journal of the Scholarship of Teaching and Learning, 10(1), 36–46 (2010). [↩] [↩] [↩]
- M. Stewart, D. Tatar, & S. Harrison. Sharing, communication, and music listening: A diary study of technology use by pre-teens and adolescents. In 2016 International Conference on Collaboration Technologies and Systems (CTS), 51–56. IEEE (2016, October). [↩]
- C. L. Knowles. The correlation of music preference and personality (2013). [↩] [↩] [↩] [↩]
- L. Kiss & K. J. Linnell. The effect of preferred background music on task-focus in sustained attention. Psychological Research, 85(6), 2313–2325 (2021). [↩] [↩]
- Y. N. Shih, R. H. Huang, & H. S. Chiang. Correlation between work concentration level and background music: A pilot study. Work, 33(3), 329–333 (2009). [↩]
- A. A. Darrow, C. Johnson, S. Agnew, E. R. Fuller, & M. Uchisaka. Effect of preferred music as a distraction on music majors’ and nonmusic majors’ selective attention. Bulletin of the Council for Research in Music Education, 170, 21–31 (2006). [↩] [↩]
- J. Adriano. Teenagers’ reasons for listening to music and the students’ perception of the effects of listening when completing school assignments. Johnson & Wales University (2010). [↩]
- M. Gillick & C. Magoulias. Competing against outside distractions in online classrooms for grade-school students. Research Gate (2020). [↩]
- J.Mingle, M.Adams, A. E. Adjei. (2016). Comparative Analysis of Social Media Usage and Academic Performance in Public and Private Senior High Schools. Journal of Education and Practice, 7(7), 13-22. [↩]
- Collerton et al., 2007. [↩]


