Abstract
Researchers commonly investigate how data properties influence the internal organization of convolutional neural networks, yet these effects are often inferred indirectly rather than examined through direct analysis of learned feature representations. Although data augmentation is widely used to increase dataset diversity, its influence on internal feature representations remains less clearly characterized. Specifically, how augmentation affects interclass separation and intraclass consistency, and how these effects compare to increased dataset size, remains unclear.Building on this gap in analysis, we examined how dataset size and augmentation influence internal representation structure and how augmentations affect interclass separation and intraclass consistency of the models. We also compared these results to those observed in models trained on larger, unaugmented datasets in order to determine the impact of each property. We hypothesized that augmentations and larger sample sizes would both increase interclass separation with sample size having a more significant effect, while augmentations reduce the intraclass variance more in comparison to larger sample size trained models.Using pre-trained ResNet-18 models, we extracted Global Average Pooling layer activations and analyzed them using silhouette score, accuracy, and an intraclass dispersion metric computed in the full 512-dimensional feature space, with PCA projections used for qualitative visualization. These graphs and metrics indicated that dataset size led to large increases in accuracy and separation while augmentation had a larger influence on decreasing intraclass variance. These findings emphasized the role of representation stability in low data learning and demonstrated the value of internal analysis for understanding the impact of data properties.
Introduction
Purpose
Artificial intelligence (AI) is a growing branch of computer science. A specific type of AI, machine learning (ML), focuses on constructing a system that improves itself through the analysis of data1. Although ML has advanced and created applications in various fields, we aimed to focus on its potential for image recognition, or more specifically, convolutional neural networks (CNNs). Convolutional neural networks have become the dominant approach to image recognition, much of their success coming from their ability to learn layered, abstract representations of visual input rather than relying on hand engineered features2. Ranging from facial IDs to classifiers, CNNs organize visual information by learning hierarchical feature representations. In this process, early layers capture low level patterns such as edges and textures, while deeper layers encode higher level semantic features3.
How these layers actually encode information has been examined extensively over time. Zeiler and Fergus (2014) used deconvolutional visualization to show that early convolutional layers respond to low level patterns such as edges and simple textures, while deeper layers come to represent object parts and class relevant structure4. Mallat (2016) showed how deep convolutional architectures build invariance through successive contraction and separation of the input space5. Bau, Zhu, Strobelt, Lapedriza, Zhou and Torralba (2020) quantified how individual hidden units align with human-interpretable semantic concepts, showing that internal organization of a trained CNN is structured6. One way to study these internal representations is to visualize them. Since feature vectors produced by networks are too high dimensional, they need dimensionality reduction techniques such as principal component analysis (PCA) to project them into two dimensions while keeping as much of their variation as possible7. Plotting the resulting points by class makes it possible to qualitatively observe how well a model separates categories and how tightly it groups examples of the same category. Overall, these studies establish that a CNN’s internal feature space is a meaningful object of analysis, motivating the representational focus of this work.
However, previous works have shown that limited training data can push networks to rely on non-robust features rather than the intended ones8. This vulnerability is increased by model capacity. Higher capacity networks can fit even randomly labeled data, so their ability to generalize depends heavily on the training data and on implicit regularization rather than on architecture alone9. Furthermore, Sun, Shrivastava, Singh and Gupta (2017) examined the relationship between dataset size and model performance at large scale. They reported that performance on image or vision tasks increases approximately logarithmically with the volume of training data, revealing quantity as a large factor in model performance10. Hestness et al. (2017) found a similar result, showing how generalization error decreases as the training set grows11. Larger labeled datasets such as ImageNet have been central to the progress of this problem’s research, supplying the volume of examples needed to learn general purpose visual representations and remedy the lack of training materials12. Overall, the concern is not just lower accuracy, but that the structure and stability of the learned representation itself degrade when data is insufficient.
Augmentation expands the training distribution by applying label preserving transformations such as rotations, flips, crops, and other image altering transformations that increase image diversity without needing to add additional labeled examples. Data augmentation is often used to combat low dataset problems by reinforcing visual features13. These transformations span geometric operations such as rotation, flipping, and cropping, and recent surveys catalog a broad and growing range of such techniques14. The importance of augmentation is underscored by work showing that augmentation strategies can be learned automatically to maximize accuracy15. Importantly, augmentation is not simply a way to “add data”, but a form of regularization. Hernández-García and König (2018) argued that augmentation regularizes networks implicitly and that on its own, it can match explicit regularizers such as weight decay and dropout16. A companion study (Hernández-García & König, ICANN 2018) found that augmented networks learn more effectively from fewer examples17. Augmentation effects can also be uneven, benefiting some classes while harming others, which suggests its influence on internal representations is not uniform18. These distinctions matter for the present work, because it implies that augmentation and increased dataset size aren’t interchangeable but influence the learned representation through different mechanisms, even when they produce similar accuracy.
Despite its widespread use, the effects of augmentation and dataset size on the internal organization of learned representations remain less well explained. Hermann, Chen and Kornblith (2020) demonstrated that augmentation choices directly determine which features a CNN comes to rely on. For example, cropping and color transformations shift the balance between shape and texture based representations. This indicates that augmentation changes internal structure, not only accuracy19. Relatedly, CNNs trained on natural images have been shown to rely heavily on texture rather than shape, a bias that shifts when the training data changes, further evidence that data properties directly shape what a network learns20. This is important, especially when models are trained with little data and are unstable, as the change in dataset size or the use of augmentation can significantly influence the structure of learned feature representations, making the understanding of their effects necessary. Most directly relevant to the present study, Geiping et al. (2023) investigated how much augmentation is “worth” compared to simply adding additional data, concluding that augmentation benefit is only partly equivalent to collecting more examples. The value mainly derives from the invariance it brings21. This finding implies that dataset size and augmentation shape representations in distinct ways and should not be seen as alternatives to one another, directly paralleling the hypothesis of this present work. Yet this comparison has rarely been made through direct analysis of internal feature structure under controlled, low-data conditions, which is the gap the present work addresses.
This Work
Therefore, convolutional neural networks typically require large labeled datasets for stable internal representations. When training datasets are limited, changes in representation structure are often attributed solely to insufficient sample size. Augmentation introduces label preserving transformations that alter the effective training distribution, although its effects are often overshadowed by the assumption of the need to simply increase dataset size, leaving its impact on the internal learning process of the model often poorly understood.
In this work, we investigated differences in model perception between augmenting smaller datasets versus enlarging the dataset’s quantity. Through a representational perspective, we examined the effects of each solution and their potential use cases. Our use of a pretrained network reflects the principle of transfer learning, in which representations learned on a large source dataset are reused for a related target task22. Using ResNet-18, we compared models trained with less data with and without augmentation to models trained on larger datasets, with and without augmentation23. We visualized Global Average Pooling (AvgPool) layer activations using dimensionality reduction and quantified interclass separation and intraclass consistency with the silhouette coefficient, a standard measure that compares within class cohesion to between class separation on a scale from −1 to +124. This approach emphasized the role of representation stability in low data learning and highlighted the importance of internal analysis for understanding how the quality of data can influence the way the model perceives the trends in low data settings. Overall, models trained on larger datasets showed greater interclass separation, while data augmentation had a larger effect on the consistency of internal representations in low data training settings. These results indicate that dataset size and data augmentation shape internal feature representations in distinct ways, highlighting the importance of representation analysis.
Materials and Methods
Setup
All the CIFAR-10 images were resized to 224×224 pixels, converted to tensors, and then normalized using ImageNet statistics of mean = [0.485, 0.456, 0.406] and standard deviation = [0.229, 0.224, 0.225]. The official CIFAR-10 training set was used for training while their official test set was used for evaluation. No validation set was held out. 500-image conditions contained 250 cat and 250 dog images while the 5000-image condition contained 2500 cat and 2500 dog images. Three subsets were sampled using stratified random sampling across 5 seeds.
All models used ImageNet pretrained ResNet-18. Early layers were frozen, while layer3, layer4, and the final fully connected layer were decided to be trained. The final layer was replaced with a two output classifier. Models were trained for 10 epochs using Adam, cross-entropy loss, learning rate of 1e-4, no learning rate scheduler, and no weight decay. Batch size was 40 for 500-image conditions and 160 for the 5000-image condition.
One model trained on 5000 images and one trained on 500 images remained unaugmented, while the remaining six 500-image and six 5000-image models each used one of the following transformations: RandomRotation, RandomHorizontalFlip, RandomResizedCrop, RandomErasing, RandomAffine, and GaussianBlur. The augmentation parameters were kept fixed across runs for each augmentation condition. RandomRotation used a maximum rotation of 30 degrees since larger rotations could create unrealistic images. RandomHorizontalFlip used the default flip probability of 0.5 since animals could face either direction while maintaining identity. RandomResizedCrop produced images of size 224 × 224 using a crop scale range of 0.8 to 1.0 and an aspect ratio range of 0.9 to 1.1. These values were selected to avoid aggressive cropping that might remove important parts of the animal while still testing whether changes in scale and composition improve representation stability. RandomErasing used PyTorch’s default parameters, including an erasing probability of 0.5, scale range of 0.02 to 0.33, and aspect ratio range of 0.3 to 3.3 to help models focus on broader patterns than single defining features25. RandomAffine used a maximum rotation of 10 degrees, translation of up to 5% in both the horizontal and vertical directions, scale range of 0.95 to 1.05, and shear of 5 degrees for distortion that wouldn’t be too altered for the low resolution CIFAR-10 images to be classified. GaussianBlur used a kernel size of 3 with sigma randomly sampled from 0.1 to 0.5 to test whether reducing texture detail affected internal feature organization without completely removing useful visual information. All 500-image conditions used the same number of original images, epochs, batch size, and training steps. In augmented conditions, random transformations could produce different views of the same images across epochs, so these models experienced greater effective training diversity without receiving additional labeled examples.
The comparison was intended to separate sample count from augmentation effects where possible. The 500-base and 5000-base conditions tested the effect of increasing real training examples, while the 500 and 5000 quantity models’ augmented conditions tested the effect of adding label preserving variation while keeping the original sample count fixed. Because augmentation also acts as regularization, the augmented conditions reflect both increased effective diversity and regularization pressure. Independent variables included dataset size (500 vs 5000 samples) and augmentation strategy, while dependent variables included classification accuracy, silhouette score, intraclass dispersion and PCA based representation structure. We treated the unaugmented low image quantity trained model as control for low image model comparisons and unaugmented high image quantity model as control for high image model comparisons.
Fine Tuning
The models were fine tuned to distinguish between dog and cat. To reduce overfitting, early layers of the models were frozen while higher layers, including layer3, layer4, and the final fully connected layer, were fine tuned. This freezing strategy was chosen to reduce overfitting in the low data setting while still allowing relevant higher level representations to adapt to the cat/dog classification task. Because early ResNet-18 layers generally encode lower level visual patterns such as edges, textures, and simple shapes, freezing these layers helped preserve general purpose ImageNet features. Fine tuning layer3, layer4, and the final fully connected layer allowed later, more semantic representations to adjust to the target task while limiting the number of trainable parameters.
Data Extraction
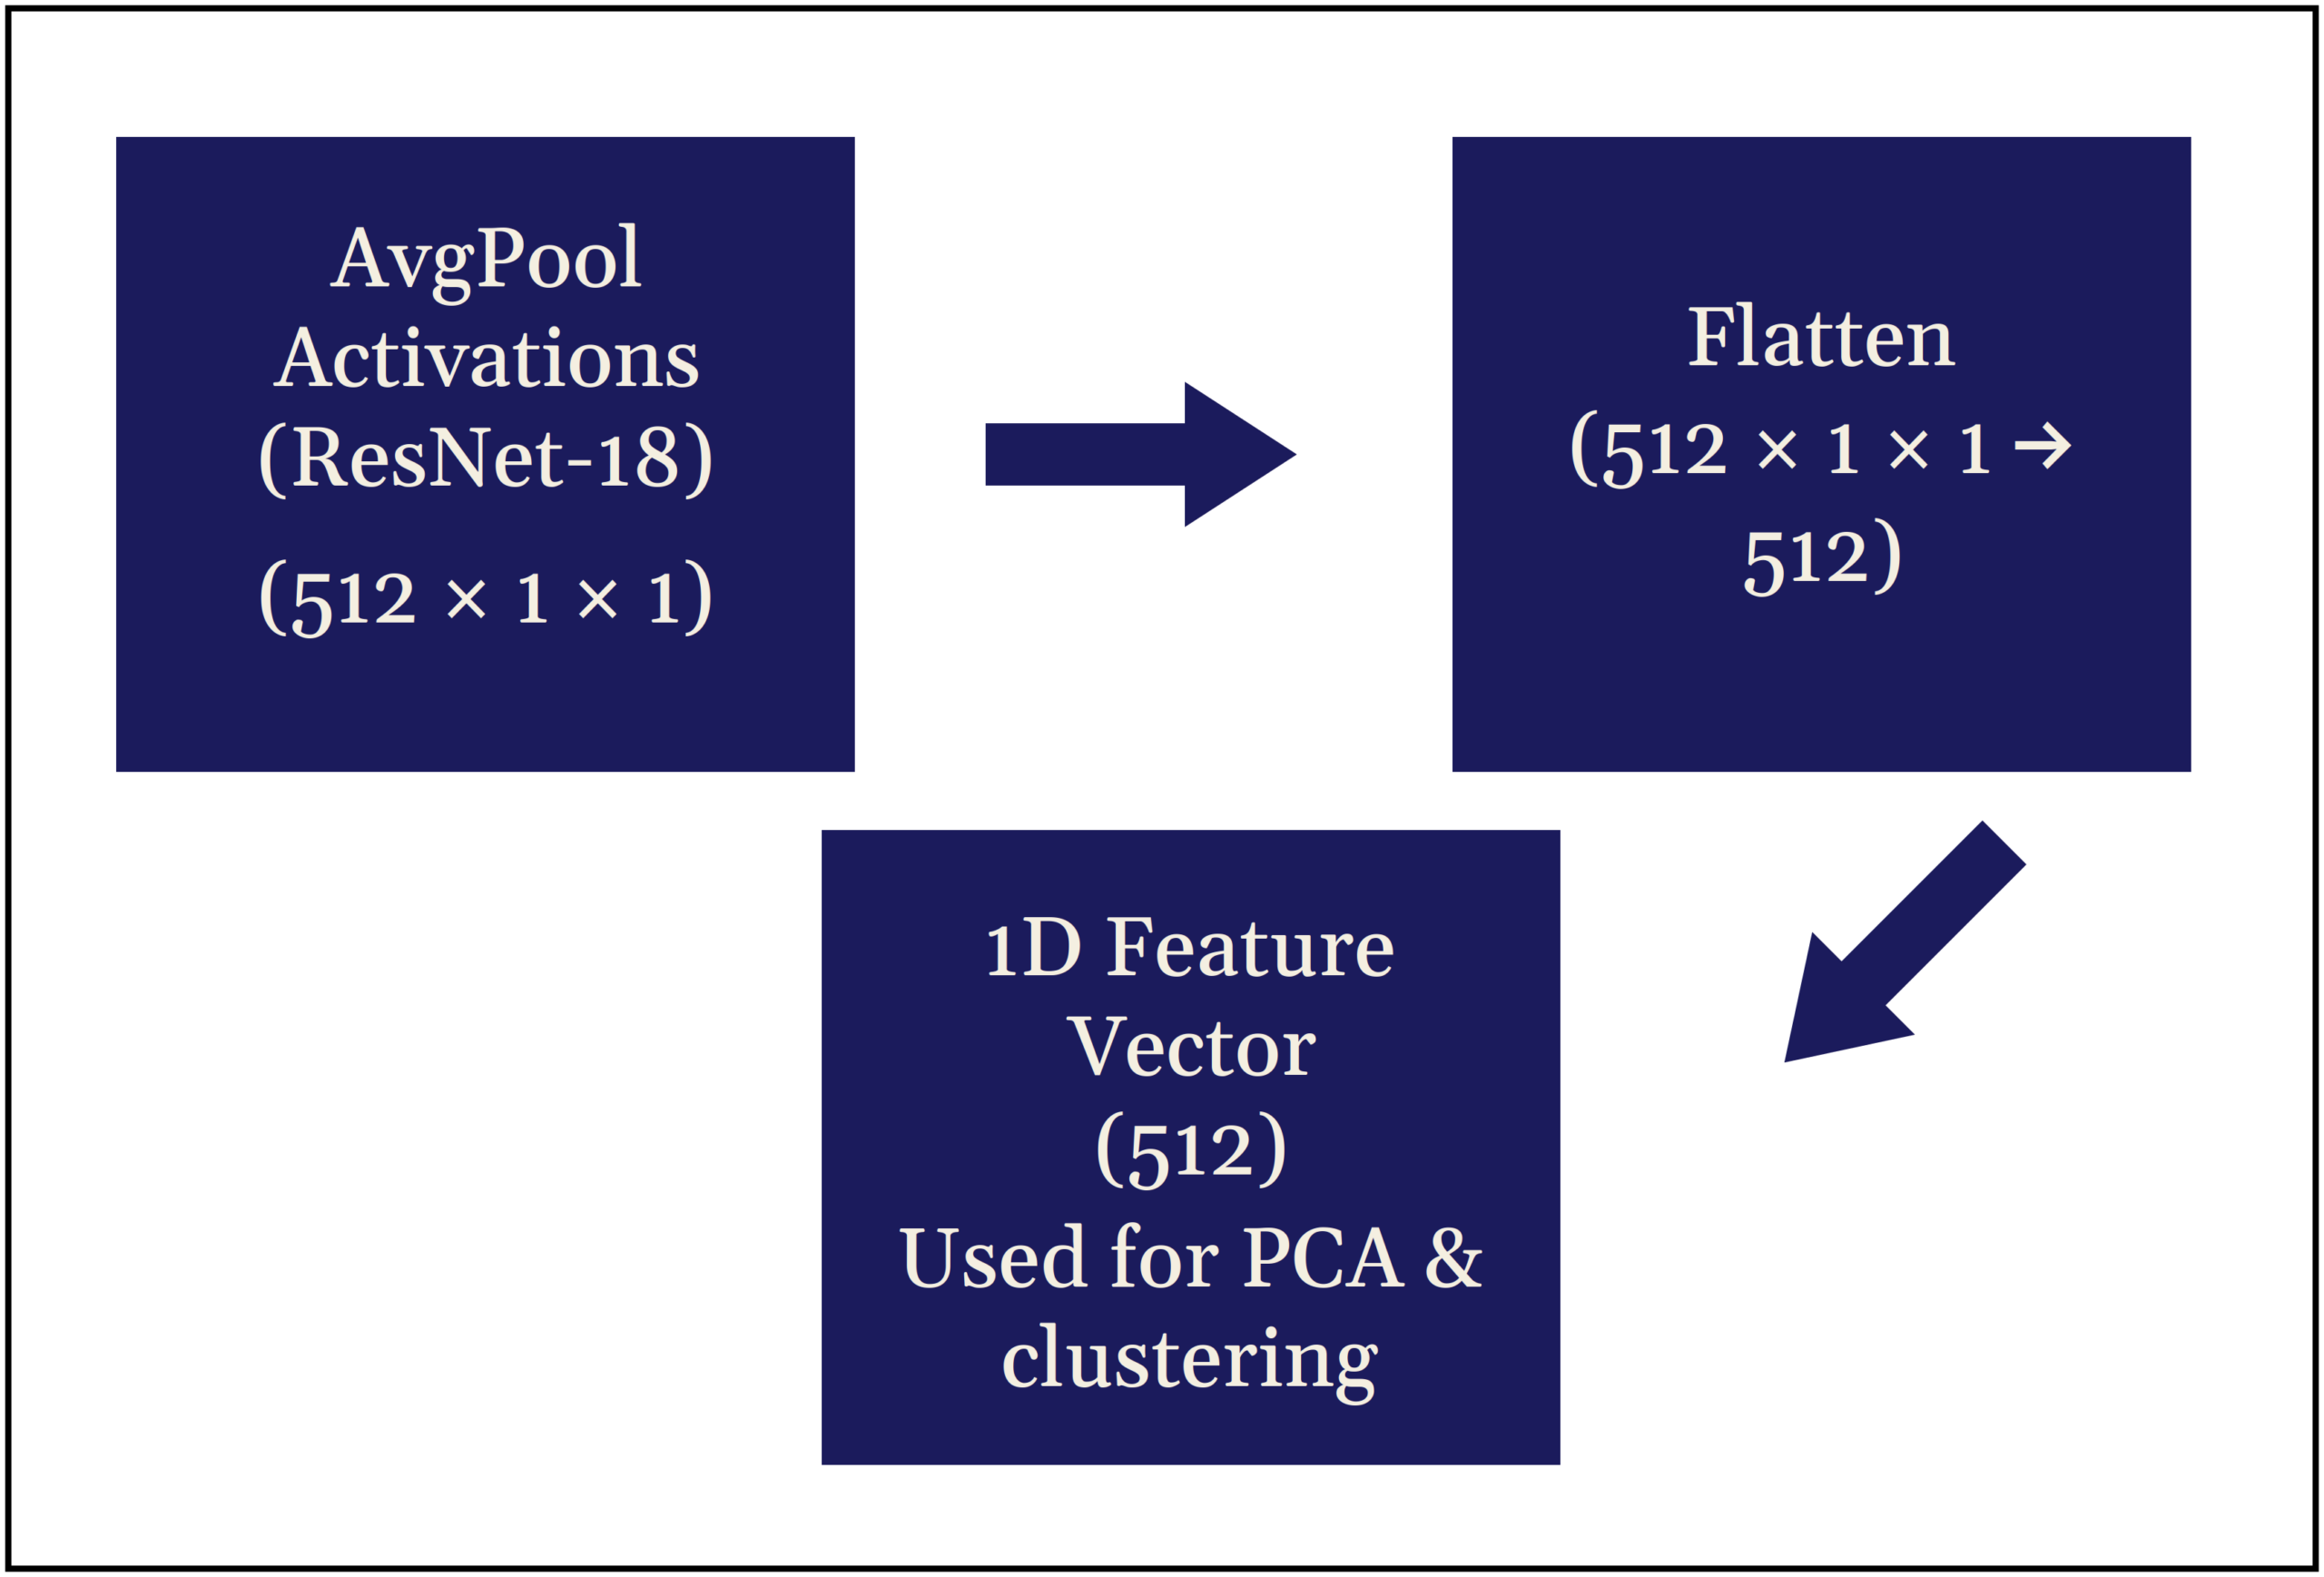
After training, internal representations were extracted from the Global Average Pooling layer of each ResNet-18 model during inference. This produced 512-dimensional feature vectors, which were flattened and projected into two dimensions using principal component analysis (PCA) (Figure 1). A single PCA basis was fit on the activations of the two unaugmented base models (500 and 5000 images), and every condition was then projected into that shared two-dimensional space. PCA plots were interpreted only as qualitative visualizations. Cross model conclusions were based on 512-D quantitative metrics, including silhouette score and intraclass dispersion, rather than absolute PCA coordinates. Therefore, PCA plots were used for qualitative analysis of clustering structure, interclass separation, and intraclass compactness. Quantitative comparisons across training regimes were based on silhouette score, classification accuracy, and intraclass dispersion measurements.
Results
Overview
These experiments were designed to determine whether increasing dataset size or applying data augmentation more strongly influences internal feature representations of convolutional neural networks. We trained all our models under identical optimization settings with different training set sizes (500 or 5000 images) and augmentation strategies. Using ResNet-18 trained on the CIFAR-10 cat and dog classes, we evaluated the effects of dataset size and data augmentation on internal feature space structure. Results were reported using a combination of quantitative metrics, including silhouette score, classification accuracy, and intraclass dispersion, as well as visualizations of intermediate feature representations extracted from the Global Average Pooling layer.
Average Silhouette Scores, Accuracy Percentages, and Intraclass Dispersion Outcomes
| Condition | Accuracy (%) | Silhouette Score | Intraclass Dispersion |
| 500 samples | 82.89 ± 0.42 | 0.0868 ± 0.0058 | 290.22 ± 21.32 |
| 5000 samples | 88.29 ± 0.32 | 0.1960 ± 0.0051 | 288.40 ± 12.90 |
| 500 + Rotate | 81.17 ± 1.95 | 0.0741 ± 0.0108 | 253.24 ± 8.38 |
| 500 + Flip | 83.60 ± 0.94 | 0.0917 ± 0.0100 | 226.64 ± 4.10 |
| 500 + Crop | 83.00 ± 1.23 | 0.0950 ± 0.0077 | 227.33 ± 2.93 |
| 500 + Erase | 83.46 ± 0.72 | 0.0869 ± 0.0065 | 232.93 ± 5.61 |
| 500 + Affine | 83.62 ± 0.68 | 0.0867 ± 0.0068 | 245.69 ± 8.17 |
| 500 + Blur | 83.12 ± 0.99 | 0.0898 ± 0.0055 | 215.48 ± 3.82 |
| 5000 + Rotate | 89.12 ± 0.43 | 0.1345 ± 0.0088 | 259.16 ± 20.32 |
| 5000 + Flip | 89.07 ± 0.38 | 0.1819 ± 0.0048 | 213.85 ± 5.04 |
| 5000 + Crop | 89.14 ± 0.35 | 0.1782 ± 0.0113 | 213.84 ± 5.91 |
| 5000 + Erase | 88.71 ± 0.52 | 0.1682 ± 0.0063 | 238.85 ± 8.22 |
| 5000 + Affine | 88.94 ± 0.92 | 0.1687 ± 0.0096 | 244.64 ± 10.17 |
| 5000 + Blur | 88.35 ± 0.32 | 0.1946 ± 0.0043 | 202.24 ± 1.74 |
The model trained on a larger dataset exhibited a substantially greater interclass separation, as measured by silhouette score, compared to models trained on smaller datasets, even when augmentation was applied. In the 500-image setting, augmentations had very minimal effect on silhouette score, shown by the standard deviation ranges of the augmented models coinciding with that of the 500-base model. In the 5000-image setting, however, augmentation tended to reduce silhouette score relative to the 5000-base model (0.1960), with rotation producing the largest decrease (0.1345) and only blur remaining comparable to the base (0.1946). In neither case did augmentation replicate the increase in silhouette score produced by enlarging the dataset, which more than doubled the score of the base model when moving from 500 to 5000 images (Table 1).
Accuracy followed a similar trend to silhouette score, with models trained on larger datasets generally achieving higher accuracy than models trained on smaller datasets. The 5000-base model achieved an accuracy of 88.29 ± 0.32% and 82.89 ± 0.42% for the 500-base model. Although several augmentation conditions produced small changes in accuracy, these changes were inconsistent and often fell within overlapping standard deviation ranges when compared to their corresponding base models. In the 500-image setting, most augmentations were similar to or slightly higher than the base; only rotation (81.17%) clearly reduced it. While in the 5000-image setting, all six augmentations exceeded the 5000-base (88.29%), with crop, rotate, and flip highest. These results suggest that augmentation can affect classification performance depending on the transformation, but increasing dataset size provided a more reliable improvement in accuracy overall.
Intraclass dispersion showed a consistent pattern in which augmentation reduced within class spread relative to the unaugmented base. Lower intraclass dispersion means feature representations from the same class were grouped more tightly, showing greater within class consistency. In the 500-image setting, the 500-base model produced the highest intraclass dispersion of 290.22 ± 21.32, while every augmentation lowered the intraclass dispersion, with the 500-blur condition showing the lowest average dispersion of 215.48 ± 3.82. A similar pattern appeared in the 5000-image setting, where the 5000-base model had the highest intraclass dispersion among the 5000-image conditions and all augmentations reduced it. These results suggest that augmentation consistently reduced intraclass dispersion across transformations, though the degree of reduction varied. The effect of augmentation on within class consistency depended on the type and strength of the transformation, with milder transformations producing the tightest representations and stronger ones reducing dispersion the least. Milder transformations, such as blur, crop, and horizontal flip, are more likely to preserve the main visual identity of cats and dogs while still introducing useful variation. This may explain why some of these conditions maintained or improved performance relative to other augmented models. In contrast, stronger transformations such as rotation, erasing, and affine may have altered important visual cues or made the already low resolution CIFAR-10 images harder to classify. As a result, these augmentations reduced dispersion less than milder ones and, in the 5000-image setting, also lowered silhouette score instead of improving representation structure. This highlights the importance of augmentation quality: transformations must preserve task relevant features in order to improve internal representation stability.
Average Pooling Layer Activation Graph Analysis
To further examine how these quantitative differences manifest in internal representations as well as illustrate the impact of augmentations, we generated feature space visualizations using PCA graphs with dimensionality reduction techniques applied to Global Average Pooling layer activations. These plots were interpreted as qualitative views of each model’s internal feature organization. The visualizations were used to examine relative clustering patterns within each model.
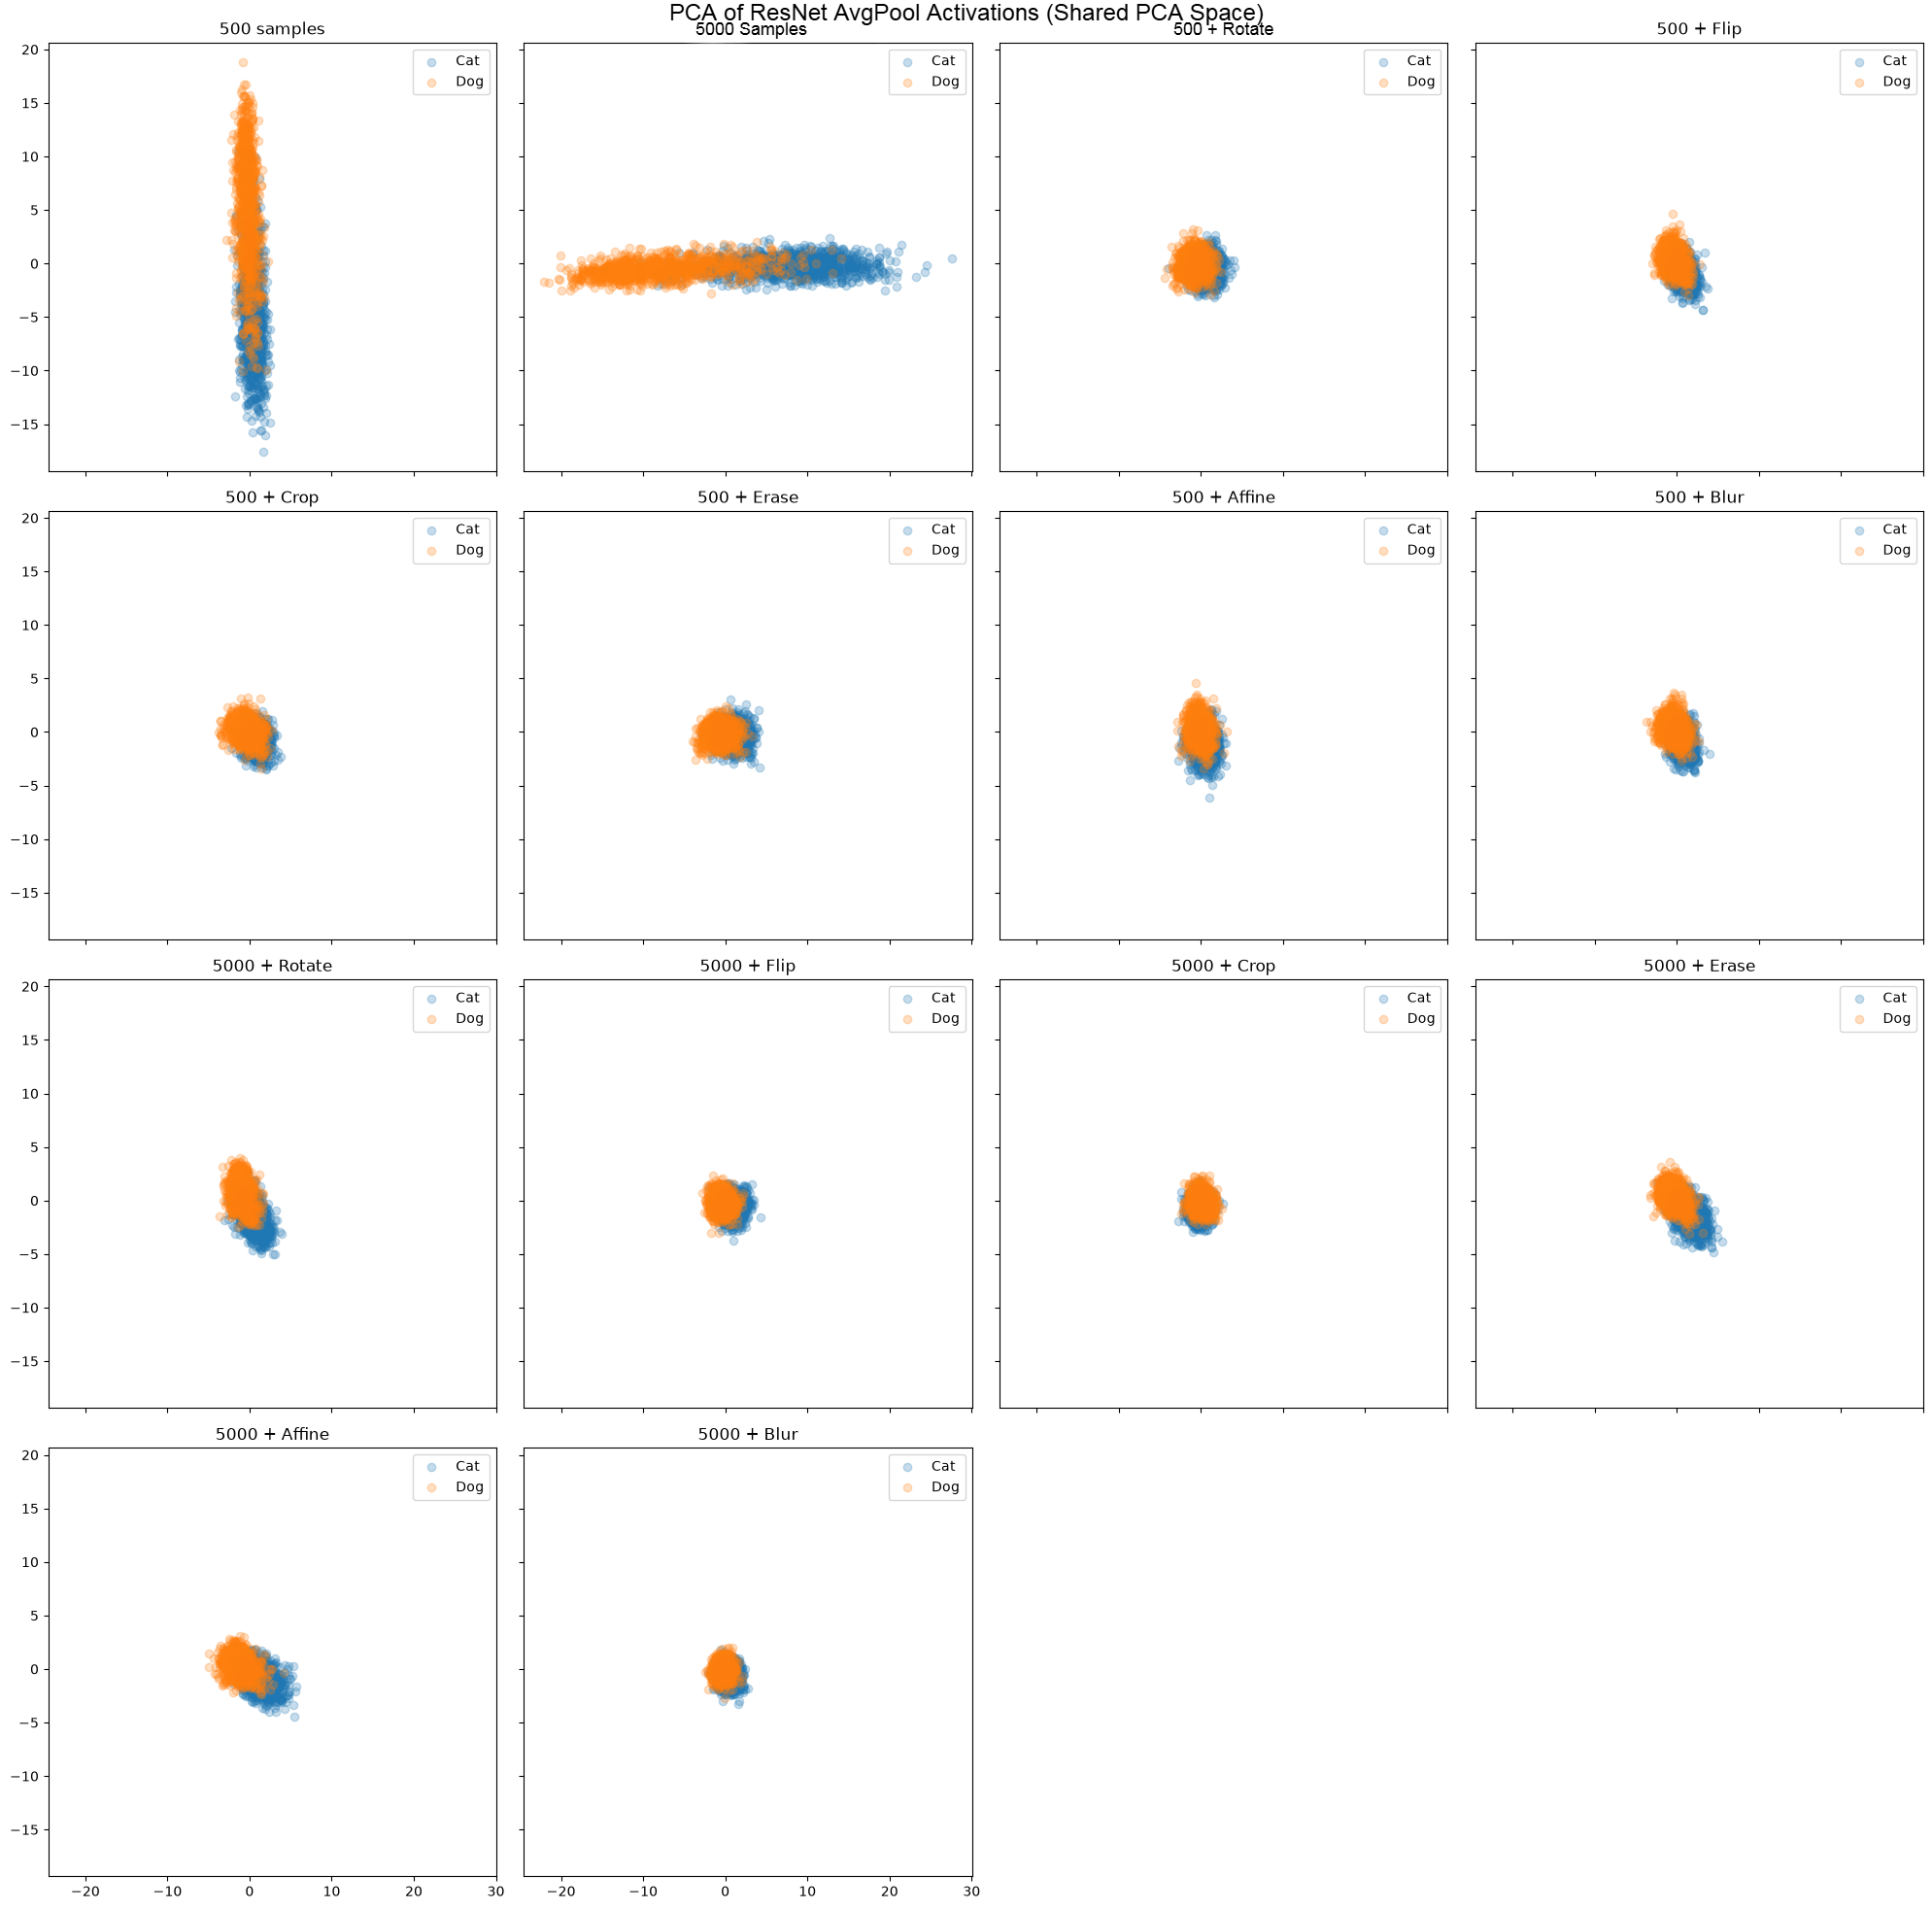
When observing the nonaugmented graphs, the activations were distinguished to an extent, but also very spread out along the dominant feature’s axis (Figure 2). However, the augmented models, regardless of what augmentation was used, all revealed trends of tightly knit clusters or tighter intraclass clustering that was not fully reflected in silhouette score or accuracy differences. It is also important to note the overlap of points in every graph, with the only noticeable decrease in overlap being present in the unaugmented 5000-image model (Figure 2). Overall, the PCA visualizations indicated that increasing dataset size was associated with greater interclass separation and accuracy, whereas augmentation was associated with tighter intraclass clustering under low data conditions. Although it is important to note that the augmentations cannot fully compensate for low sample quantity.
Discussion
When examining the average accuracy score of the 500-image augmented models, compared to the base model’s accuracy of 82.89%, an average augmented accuracy of 82.98% represents a small increase in accuracy. This contrasts with the significantly higher accuracy achieved by the 5000 image model (88.29%) (Table 1). This analysis framed dataset size as a stronger indicator of model performance than augmentation overall but tends to overlook the aspects of what each method actually changes within the model. When examining the average silhouette score of the low image augmented models, compared to the unaugmented low image model’s silhouette score of 0.0868, an average augmented silhouette score of 0.0873 represents a very small increase in class separation. This once again contrasts with the significantly higher silhouette score achieved by the 5000-image model (0.1960) (Table 1). Even the best 500-image augmented model reached only about half the silhouette score of the 5000-base model at 0.0950 compared with 0.1960. The significantly larger silhouette score indicates that increased dataset size exerted a stronger influence on interclass separation.
While training with larger datasets had large improvements in interclass separation, augmentation showed varied results when it came to silhouette scores. The mix of gains and reductions indicates that although it depends on which augmentation is chosen, the use of augmentations in general only provided small changes to separation. On the other hand, augmentation exerted a more consistent visible influence on intraclass structure. Augmentation consistently resulted in reduced intraclass variance, indicating greater internal encoding consistency. Intraclass dispersion was introduced as an additional metric to measure within class consistency in the feature space, separate from the between class focus of silhouette score. This metric was computed on the 512-dimensional AvgPool feature vectors as the average squared distance of each sample to its class centroid, averaged across the cat and dog classes, where lower values mean representations from the same class were grouped tighter. Since it was calculated in the full feature space unlike the reduced PCA space, it captures structure that the two-dimensional projections may not, and it being unnormalized means that its absolute scale is large and only meaningful when it is compared across conditions instead of simply looking at the value by itself. Including this metric allowed within class compactness to be examined directly, rather than viewed solely qualitatively by PCA graphs. For example, the unaugmented base models produced the highest dispersion in both settings (290.22 in the 500-image case and 288.40 in the 5000-image case), while every augmentation reduced it, with blur consistently producing the most compact representations (215.48 and 202.24 respectively). The same trends were present across dataset sizes, with milder transformations such as blur, flip, and crop yielded lower dispersion than stronger ones such as rotation and affine (253.24 and 245.69 in the 500-image setting), suggesting that augmentation exerted a more consistent effect on intraclass structure than on interclass separation, a distinction that would not have been visible from silhouette score alone. Tighter clusters of the activations reveal reductions in intraclass variance and suggest that augmentation leads to greater consistency in how images are encoded in the feature space. Because principal component analysis reduces the 512-dimensional AvgPool feature vectors to only two dimensions for visualization, these plots capture just a fraction of the total variance in the feature space and may omit structure present in the full representation. For this reason, the PCA plots were interpreted only qualitatively, while all quantitative conclusions were drawn from the silhouette score and intraclass dispersion computed in the original 512-dimensional space.
Overall, the hypothesis that both augmentation and increased dataset size would enhance interclass separation was only partially supported, as augmentation didn’t have a consistent increase in separation across conditions. The hypothesis that dataset size would have a stronger effect on interclass separation was supported. For intraclass consistency, the hypothesis that augmentation would reduce intraclass variance more than increasing dataset size was supported: every augmentation lowered dispersion relative to the unaugmented base at both sizes, whereas increasing from 500 to 5000 images changed it little (290.22 vs. 288.40). Practically, these findings suggest that when training an image classifier with limited data, augmentation should not be treated as a full replacement for collecting more real examples. The larger 5000-image model produced stronger interclass separation and higher accuracy, indicating that increasing real sample count remains important when the goal is to improve classification performance. However, augmentation may still be useful in low data settings because certain transformations can encourage more compactness within class feature representations. Therefore, when additional labeled data are unavailable, moderate label preserving augmentations such as horizontal flipping, mild cropping, or mild blur may help stabilize internal representations, but they should be selected carefully because stronger transformations such as rotation, erasing, or affine distortion can reduce performance if they alter important visual cues.
A limitation of this study is that all experiments were conducted on a single binary classification task using the cat and dog classes from CIFAR-10. Although this setup allows controlled comparison of dataset size and augmentation strategies, it does not fully represent low data learning problems with more classes, stronger class imbalance, or harder image distributions. Therefore, the conclusions should be interpreted as evidence for lower class quantity and binary settings rather than as general claims about low data learning across all computer vision tasks. Another limitation of this analysis is that silhouette score was used as the main feature space separation metric in a binary task. Because silhouette score depends on both between class distance and within class compactness, it should be noted that silhouette score is impacted by within class variance and isn’t solely an interclass metric. Future work should test whether the same representation level patterns hold in multiclass CIFAR-10 settings, other datasets, and more difficult low data distributions. Furthermore, future tests could consist of exploring different augmentation strengths, class counts, and data regimes to test the generality of these findings. Evaluating other architectures or freezing strategies could help further clarify how representation stability depends on model design. Furthermore, applying this representational analysis framework to other low data domains could help guide understanding of how different parameters or conditions affect the internal features of the model, especially when the representation structure may vary under limited data conditions.
References
- M. I. Jordan, T. M. Mitchell. Machine learning: trends, perspectives, and prospects. Science. Vol. 349, pg. 255–260, 2015, https://doi.org/10.1126/science.aaa8415. [↩]
- Y. LeCun, Y. Bengio, G. Hinton. Deep learning. Nature. Vol. 521, pg. 436–444, 2015, https://doi.org/10.1038/nature14539. [↩]
- Y. Bengio, A. Courville, P. Vincent. Representation learning: a review and new perspectives. IEEE Transactions on Pattern Analysis and Machine Intelligence. Vol. 35, pg. 1798-1828, 2013, https://doi.org/10.1109/TPAMI.2013.50. [↩]
- M. D. Zeiler, R. Fergus. Visualizing and understanding convolutional networks. Computer Vision – ECCV 2014, pg. 818–833, 2014, https://doi.org/10.1007/978-3-319-10590-1_53. [↩]
- S. Mallat. Understanding deep convolutional networks. Philosophical Transactions of the Royal Society A: Mathematical, Physical and Engineering Sciences. Vol. 374, pg. 20150203, 2016, https://doi.org/10.1098/rsta.2015.0203. [↩]
- D. Bau, J.-Y. Zhu, H. Strobelt, A. Lapedriza, B. Zhou, A. Torralba. Understanding the role of individual units in a deep neural network. Proceedings of the National Academy of Sciences. Vol. 117, pg. 30071-30078, 2020, https://doi.org/10.1073/pnas.1907375117. [↩]
- I. T. Jolliffe, J. Cadima. Principal component analysis: a review and recent developments. Philosophical Transactions of the Royal Society A. Vol. 374, pg. 20150202, 2016, https://doi.org/10.1098/rsta.2015.0202. [↩]
- R. Geirhos, J.-H. Jacobsen, C. Michaelis, R. Zemel, W. Brendel, M. Bethge, F. A. Wichmann. Shortcut learning in deep neural networks. Nature Machine Intelligence. Vol. 2, pg. 665-673, 2020, https://doi.org/10.1038/s42256-020-00257-z. [↩]
- C. Zhang, S. Bengio, M. Hardt, B. Recht, O. Vinyals. Understanding deep learning (still) requires rethinking generalization. Communications of the ACM. Vol. 64, pg. 107-115, 2021, https://doi.org/10.1145/3446776. [↩]
- C. Sun, A. Shrivastava, S. Singh, A. Gupta. Revisiting unreasonable effectiveness of data in deep learning era. Proceedings of the IEEE International Conference on Computer Vision (ICCV), pg. 843-852, 2017, https://doi.org/10.1109/ICCV.2017.97. [↩]
- J. Hestness, S. Narang, N. Ardalani, G. Diamos, H. Jun, H. Kianinejad, M. M. A. Patwary, Y. Yang, Y. Zhou. Deep learning scaling is predictable, empirically. arXiv:1712.00409, 2017, https://arxiv.org/abs/1712.00409. [↩]
- O. Russakovsky, J. Deng, H. Su, J. Krause, S. Satheesh, S. Ma, Z. Huang, A. Karpathy, A. Khosla, M. Bernstein, A. C. Berg, L. Fei-Fei. ImageNet large scale visual recognition challenge. International Journal of Computer Vision. Vol. 115, pg. 211-252, 2015, https://doi.org/10.1007/s11263-015-0816-y [↩]
- C. Shorten, T. M. Khoshgoftaar. A survey on image data augmentation for deep learning. Journal of Big Data. Vol. 6, pg. 60, 2019, https://doi.org/10.1186/s40537-019-0197-0. [↩]
- M. Xu, S. Yoon, A. Fuentes, D. S. Park. A comprehensive survey of image augmentation techniques for deep learning. Pattern Recognition. Vol. 137, pg. 109347, 2023, https://doi.org/10.1016/j.patcog.2023.109347. [↩]
- E. D. Cubuk, B. Zoph, D. Mané, V. Vasudevan, Q. V. Le. AutoAugment: learning augmentation strategies from data. Proceedings of the IEEE Conference on Computer Vision and Pattern Recognition (CVPR), pg. 113-123, 2019, https://arxiv.org/abs/1805.09501. [↩]
- A. Hernández-García, P. König. Data augmentation instead of explicit regularization. arXiv:1806.03852, 2018, https://arxiv.org/abs/1806.03852. [↩]
- A. Hernández-García, P. König. Further advantages of data augmentation on convolutional neural networks. Artificial Neural Networks and Machine Learning – ICANN 2018, pg. 95-103, 2018, https://doi.org/10.1007/978-3-030-01418-6_10. [↩]
- R. Balestriero, L. Bottou, Y. LeCun. The effects of regularization and data augmentation are class dependent. Advances in Neural Information Processing Systems. Vol. 35, 2022, https://arxiv.org/abs/2204.03632. [↩]
- K. L. Hermann, T. Chen, S. Kornblith. The origins and prevalence of texture bias in convolutional neural networks. Advances in Neural Information Processing Systems (NeurIPS). Vol. 33, pg. 19000-19015, 2020, https://proceedings.neurips.cc/paper/2020/hash/db5f9f42a7157abe65bb145000b5871a-Abstract.html. [↩]
- R. Geirhos, P. Rubisch, C. Michaelis, M. Bethge, F. A. Wichmann, W. Brendel. ImageNet-trained CNNs are biased towards texture; increasing shape bias improves accuracy and robustness. International Conference on Learning Representations (ICLR), 2019, https://arxiv.org/abs/1811.12231. [↩]
- J. Geiping, M. Goldblum, G. Somepalli, R. Shwartz-Ziv, T. Goldstein, A. G. Wilson. How much data are augmentations worth? an investigation into scaling laws, invariance, and implicit regularization. International Conference on Learning Representations (ICLR), 2023, https://arxiv.org/abs/2210.06441. [↩]
- L. Shao, F. Zhu, X. Li. Transfer learning for visual categorization: a survey. IEEE Transactions on Neural Networks and Learning Systems. Vol. 26, pg. 1019-1034, 2015, https://doi.org/10.1109/TNNLS.2014.2330900. [↩]
- K. He, X. Zhang, S. Ren, J. Sun. Deep residual learning for image recognition. Proceedings of the IEEE Conference on Computer Vision and Pattern Recognition. pg. 770–778, 2016, https://doi.org/10.1109/CVPR.2016.90. [↩]
- P. J. Rousseeuw. Silhouettes: a graphical aid to the interpretation and validation of cluster analysis. Journal of Computational and Applied Mathematics. Vol. 20, pg. 53-65, 1987, https://doi.org/10.1016/0377-0427(87)90125-7. [↩]
- A. Paszke, S. Gross, F. Massa, A. Lerer, J. Bradbury, G. Chanan, T. Killeen, Z. Lin, N. Gimelshein, L. Antiga, A. Desmaison, A. Köpf, E. Yang, Z. DeVito, M. Raison, A. Tejani, S. Chilamkurthy, B. Steiner, L. Fang, J. Bai, S. Chintala. PyTorch: an imperative style, high-performance deep learning library. Advances in Neural Information Processing Systems. Vol. 32, pg. 8024-8035, 2019, https://arxiv.org/abs/1912.01703. [↩]