
Abstract
This study applies seven unsupervised machine learning models to the BETH cybersecurity dataset. Our primary goal is to detect suspicious and malicious system level events without the use of labeled training data. The BETH (BPF-Extended Tracking Honeypot) dataset consists of over one million kernel level process logs collected from honeypot machines including both benign system activity and a real botnet attack, making it one of the best authentic and modern cybersecurity benchmarks. We tested models such as Isolation Forest, Variational Autoencoder, KMeans, Gaussian Mixture Models, and Spectral Clustering without access to ground truth labels and assessed on an exploited host containing genuine malicious activity. For suspicious event detection we used clustering based models like KMeans and Spectral Clustering which achieved strong validation PR AUC values at 0.988 and test PR AUC values at 0.995, outperforming the original BETH benchmark which reported a best ROC AUC of 0.850. Furthermore, for malicious event detection, KMeans, GMM, Hierarchical Clustering, and DBSCAN all achieved high PR AUC values between 0.998 and 0.999 on the test set, showing confirmed attacker behavior forms a highly distinct distribution from normal system activity. Overall these results show that distance based clustering methods combined with tabular features derived from the BETH benchmark can achieve strong anomaly detection performance on this benchmark dataset, offering a simpler alternative to deep learning approaches.
Keywords: cybersecurity, BETH, suspicious, malicious attacks, machine learning, anomaly detection
Introduction
Cybersecurity threats around the world have increased rapidly causing risks to both governments, corporations and also to everyday users. In the United States, data compromises soared in 2023: there were 3,205 publicly reported incidents, which was the highest ever recorded, and impacted 353,027,892 victims1. Ransomware and malware attacks are one of the most damaging attack types and according to industry reports. Global cybercrime damages are expected to top US $9.5 trillion in 2024, showing how cybercrime contributes to the world’s largest criminal economies2. The impacts are wide spread and even spread to sectors like the healthcare sector. This shows the true gravity of this emerging threat and the need to combat it.
Organizations worldwide take several months to identify and contain a breach. According to the 2023 IBM Security “Cost of a Data Breach,” the global mean time to identify (MTTI) a breach was 204 days, and containment taking an additional 73 days on average3. This delay reveals that there is a major gap in detecting the breach. This gap could result in more damage due to prolonged infiltration.
In modern computing, securing systems against cyber threats has become more important since attacks are growing in size and severity. Many companies rely on servers, the cloud, or other data networks meaning that a single intrusion can disrupt essential services or even cause long term system damage4. Attackers will always continue to develop new ways to disguise their behavior with normal system activity. Traditional security tools are no longer enough to protect complex networks5. This deficit creates the need for more intelligent methods of identifying unusual behavior.
Machine learning has become an important tool for cybersecurity problems. Unlike usual rule based systems, machine learning models learn patterns directly from large amounts of system data and can recognize unusual behavior that may signal a threat6. This allows them to detect unseen attacks and exploits that signature based systems missed. Modern networks generate millions of system events per day. So machine learning methods are valuable for processing large scale data efficiently and automatically4. As attacks grow more complex, machine learning offers a more realistic approach to identifying suspicious and malicious behavior in real time.
In cybersecurity research access to realistic and well structured data is necessary for training accurate machine learning models. Many older security datasets don’t reflect modern operating systems such as cloud based environments, making it difficult to build models that perform well in real world situations7. The BETH dataset provides millions of authentic system level events collected from real honeypot machines activities8. The dataset contains detailed process logs, event types, arguments, and labelled threat indicators.
This real world data and machine learning can help cybersecurity defenses fill in the cracks and develop a safer environment. Through training on legitimate and attacker behavior, researchers can develop systems capable of detecting previously unseen threats and understanding attacker patterns.
Relevant Works
Early research on cybersecurity threat detection depended on rule based systems that required predefined patterns of already known attacks5. These systems were lacking so they struggled to identify attackers who disguised their behavior as normal. So researchers began exploring anomaly detection approaches that rely on an adaptive system. Old anomaly based models that used profiling and unsupervised clustering, attempted to learn normal operational patterns from system logs and flag events that fell outside of normal ranges6. But many of their methods failed as they yielded high false positive rates because the datasets used were limited.
As time passed, the field shifted toward machine learning and deep learning based threat detection by using system call traces and process level logs4. Numerous studies trained classifiers like random forests, support vector machines, and neural networks on datasets like DARPA 19989, KDD Cup 199910, and UNSW-NB1511. These datasets were widely used for evaluating intrusion detection models, but they contained simulated environments that did not really reflect modern operating systems or attacker behavior. So these models performed well in controlled environments but failed when brought to real world logs7.
The most recent research has explored sequence based analysis using LSTM based language models to learn temporal patterns in system call sequences12. These techniques improved the ability to detect complex attacks. However, these studies still relied on datasets with limited diversity. This restricted the generalization capabilities of ML models and made it difficult to study real attacker behavior at scale. Unlike these sequence based approaches, this analysis targets exclusively on per-event tabular features without modeling temporal context or sequential dependencies between system calls. While this simplifies the detection pipeline and enables direct comparison with the original BETH benchmark.
To fix these limitations, a new line of research began focusing on high fidelity honeypot datasets that capture real interactions from attackers in the wild. Studies using modern honeypot systems show that real system level data improves the effectiveness of detection models. The BETH dataset follows this direction by providing a large scale and accurately labeled log collection which represents real attacker behavior, making it a valuable resource in cybersecurity research. Highnam et al.8 deployed 23 cloud hosted honeypots with an intentionally weak SSH configuration so real attackers would infiltrate the machines and generate real malicious activity. They also benchmarked several unsupervised anomaly detection models to evaluate how well machine learning can detect attacker behavior. Their experiments showed that Isolation Forest performed the best with an ROC AUC of 0.85 demonstrating that the dataset is both realistic and challenging, and establishing BETH as an effective benchmark for future anomaly detection research.
Several works have compared unsupervised anomaly detection algorithms and tried to identify the best performing families. One benchmark tested ten datasets with nineteen algorithms13. Another study evaluated twelve algorithms on five intrusion datasets and reported that performance is highly dependent on hyperparameter selections14. Another study performed a more comprehensive comparison of 52 real-world data sets with 33 detectors, which is the largest to date15. It found that distance and density based methods cover most of the achievable or possible performance. This has been extended to the present threat landscape16 and to zero day attack detection17. Both suggest using unsupervised methods when attack signatures are not available.
The Isolation Forest has been improved since its original formulation. One study corrected for a geometric bias in its splitting rule18. Another combined neural representations with isolation based partitioning for high dimensional data19. A third developed an online version for real-time detection over software-defined networks20. And a fourth one developed OptIForest, a theoretical basis for optimal tree branching21.
Clustering based detection has evolved similarly. One study compared fifteen clustering algorithms for User and Entity Behavior Analytics22. This task is closely related to the suspicious and malicious separation in this paper. Another combined contrastive learning with Bayesian Gaussian mixture model for class imbalance23. One study applied variational autoencoders on network flow features on the auto encoder24. Another suggested a deep autoencoding Gaussian mixture model that is very similar to the DoSE scoring used here25. Another study found that a fuzzy CNN autoencoder is competitive with more complex architectures on log data26. This is in line with our finding that a simple VAE-DoSE model performs strongly against clustering baselines.
Sequence based methods have been pushed ahead from early LSTM approaches. A survey studied the importance of sequence and representation learning in the slow move away from count based log analysis27. Another approach is LogFiT, which fine tunes pretrained language models on log sequences28. Lakha et al. worked directly with the BETH dataset. They combined graph neural networks with transformer encoded arguments to improve detection by around eight percent over tabular features alone29. This is directly relevant for the temporal limitation admitted later in this paper.
The BETH dataset has inspired a small but growing number of follow up works. One research provided the first independent analysis of its structure30. Another proposed an ensemble feature engineering framework and evaluated it on the benchmark31. A third outperformed the Isolation Forest baseline with an AUROC of 0.917 compared to the original 0.85032. In a more recent study ten stream learning algorithms were tested on BETH comparing the online and offline detection33. A similar study is about streaming and label free evaluation. One study used unsupervised models on streaming cybersecurity logs34. Another combined PCA based feature extraction with one class classifications on system call trace data35. It found high detection performance by dimensionality reduction which is similar to the preprocessing used in this study.
Finally, evaluation of detectors without ground truth labels is a research problem still yet to be finished. One method called EM AUC, estimates ROC AUC and PR AUC without labels36. Another compared seven evaluation metrics for hyperparameter optimization of unsupervised detectors under class imbalance37. It found that imbalance aware metrics consistently performed better than ROC AUC. This justifies the use of PR AUC in this study since a real deployment would not have the labels used here to compute it.
Research Gap and Contribution
Previous studies have explored machine learning approaches for threat detection, but most of them rely on outdated or artificially generated datasets. There is also a lack in the availability of large scale and real datasets that include both benign system events and real malicious activity collected in natural attack conditions. Additionally, many prior studies frame detection as a task of attack versus non attack, and overlook the importance of identifying suspicious behavior. Understanding this distinction between suspicious and malicious activity is necessary in cybersecurity. Suspicious events serve as an early warning sign that might or might not escalate into a confirmed attack.
The objective of our work is to build on this gap by using the BETH dataset and comparing it with their initial benchmarks. Highnam et al.8 represent an important study by using real and modern process level data. Though great, the reported results rely mainly on simple baseline models. Additionally, Highnam et al. reports suspicious detection results but does not separate confirmed malicious (evil) events as a distinct detection task. We add this separate evil evaluation alongside additional clustering baselines. We go further beyond these benchmarks by using advanced algorithms and developing thorough detection approaches. We first focus on separating suspicious system events from normal activity. This captures slight behavioral changes that may indicate early stage threats. We also test the ability of models to detect explicitly malicious events, which represent more severe and well defined security violations. This two layer method reflects realistic security workflows, where suspicious behavior is identified before being escalated to confirmed malicious activity.
Dataset
We used the BPF Extended Tracking Honeypot (BETH) dataset. It contains detailed system logs of events used for studying threats and unusual computer behavior8. Each row in the dataset has information about a wide array of metadata like what process was running, what type of event occurred, etc. This gives a full picture of what the system was doing at that time and helps find any patterns. The BETH dataset utilizes a monitored computing environment which records system level and process level actions. The environment includes both normal behavior and malicious behavior which allows the data to represent realistic cases.
The dataset contains millions of records and 16 columns as shown in Table S1 (Supplementary Materials). Identification fields track process lineage and are necessary for detecting unusual behavior in malware. The userId field distinguishes system level processes (IDs below 1000) from external users or potential attackers (IDs 1000+). The mountNamespace indicates whether a process operates within standard filesystem permissions (common value 4026531840) or an unusual environment that could signal privilege escalation. Event level fields include eventId and eventName, which identify the specific system call performed such as clone, execve, or kill, and argsNum, which records argument counts. High values can indicate exploitation attempts. The returnValue column captures call success or failure, with patterns of failures signaling brute force. The stackAddresses and args columns provide low level memory addresses and execution parameters that can reveal malicious memory edits. The target columns sus and evil label each event as suspicious (1 = suspicious, 0 = normal) or confirmed malicious (1 = malicious, 0 = benign).
In our study we focus mainly on the columns sus and evil. These columns label each event based on whether it was suspicious or confirmed to be malicious. The sus column marks events that seem unusual or potentially harmful, and evil marks the events that are known to be malicious. Both targets are binary, with a value of 1 indicating suspicious or malicious and 0 for normal or benign, as shown in Table S1 (Supplementary Materials).
Methodology
Data Preprocessing
We followed preprocessing according to the BETH benchmark. The raw system call logs were converted into a fully numeric feature set suitable for model training. Categorical and boolean system attributes were encoded. The is_system_process feature was encoded as 1 if a process was identified as a system process and 0 otherwise. The is_system_parent was encoded to indicate whether a process’s parent was a system process. The is_regular_user feature was encoded as a binary indicator to determine regular user activity from privileged or system level activity. The is_default_mount feature was also mapped to a binary value to indicate whether a process was operating within the default mountNameSpace. We kept the number of arguments passed to each system call (argsNum) as a numeric feature to represent call complexity. Raw system call return values were changed into a simplified numeric representation (returnValue_mapped). This helped separate successful calls from failed calls in order to reduce noise.
Process and event level identifiers like processId, threadId, parentProcessId, and eventId, were kept as numeric features. The BETH methodology suggests that such low level identifiers can still capture meaningful behavioral patterns when combined with other contextual features. Timestamp information was retained, it was already encoded numerically and was not used to impose any temporal ordering during model training.
In our implementation, the final feature set included threadId, eventId, argsNum, is_system_process, is_system_parent, is_regular_user, is_default_mount, and returnValue_mapped. After binary encoding, the original columns processId, parentProcessId, userId, mountNamespace, and returnValue were removed. To be consistent with the BETH benchmark we also excluded eventName, stackAddresses, and args due to their structure. Along with this, timestamp, hostName, and processName were dropped to maintain a fully numeric feature representation. This approach closely follows the methodology outlined in the BETH benchmark.
Train-Test Split
BETH dataset was already separated into train/validation/test splits at the host level rather than by random sampling of events as shown in Table 1. Training and validation hosts run only benign operating system and cloud management activity. A small amount of suspicious (sus=1) events were there in both splits (0.17% of training data) and no confirmed malicious (evil=1) events were present in training or validation. The test set has a single exploited host with genuine out of distribution malicious activity. This design is similar to real world models where anomaly detection models are trained on largely clean systems and evaluated against previously unseen compromised behavior.
In the training set there are 761,875 normal events (sus=0, evil=0), 1,269 suspicious events (sus=1,evil=0), and 0 malicious events as shown in Table 1. The validation dataset is similar with 188,181 normal, 786 suspicious, and 0 malicious events as shown in Table 1. In contrast, the test dataset is dominated by malicious behavior containing 17,508 normal events, 171,459 suspicious events, and 158,432 malicious events as shown in Table 1. Highnam et al. Isolated all malicious labels to the test split to evaluate anomaly and out of distribution detection performance. These splits are not stratified or class balanced across labels. Malicious events are not present in the training and validation sets and a high concentration of malicious activity is in the test set. This causes a big imbalance in the data. Our strategy was kept the same as the benchmark to try to keep the intended out of distribution evaluation protocol.
| Split | SUS (suspicious) | EVIL (malicious) | ||
| Normal (sus=0) | Suspicious (sus=1) | Benign (evil=0) | Malicious (evil=1) | |
| Train | 761,875 | 1,269 | 763,144 | 0 |
| Validation | 188,181 | 786 | 188,967 | 0 |
| Test | 17,508 | 171,459 | 30,535 | 158,432 |
Models and Evaluation Metrics
In our study we evaluated model performance under two objectives to reflect realistic cybersecurity workflows. The first objective is the detection of suspicious activity (sus = 1 vs. sus = 0) which captures deviations from typical operating system behavior. Suspicious events are basically behavioral irregularities that need to be examined more closely but are not confirmed malicious. The second objective was on detecting confirmed malicious activity (evil = 1 vs. evil = 0) corresponding to genuine out of distribution attack behavior present in the exploited host. Both tasks are framed as anomaly detection problems. The malicious detection task represents a more severe deviation from normal system behavior.
For each objective we used unsupervised models that were trained exclusively on training features without label information. The anomaly scores were generated for validation and test splits. These scores were then evaluated separately against the suspicious and malicious binary labels. This was done to check how effectively each model identifies mild behavioral anomalies versus clearly malicious activity. The ground truth labels are used only at inference time to evaluate detection performance. This differs from a one class setup where models are trained only on confirmed normal events, and treat the problem as anomaly detection. Our setup follows the anomaly detection and out of distribution detection framework, in which a model’s ability to flag genuine attacker behavior is assessed by how well it identifies deviations from the normal system activity it was trained on.
We extended this framework and added a separate malicious event evaluation and also the suspicious detection task reported in the original BETH benchmark. All models in this study were trained on the full training set containing both normal events (sus=0, evil=0) and the small number of suspicious events (sus=1, evil=0, representing 0.17% of training data), with labels withheld during training. We also conducted an additional experiment by training the VAE exclusively on confirmed normal events and reported it in the Results section. This was done to investigate whether this distinction affects performance.
We used several unsupervised learning models to detect anomalous behavior in system level security data. All models were trained using feature data without access to sus or evil labels and following standard unsupervised anomaly detection methodology6. To make a direct comparison to the BETH paper we used an Isolation Forest model and a Variational Autoencoder with a DoSE based scoring approach as described in Highnam et al.8. In addition to this benchmark method several other unsupervised learning models such as K-Means clustering, Gaussian Mixture Models, Spectral Clustering, DBSCAN, and Hierarchical Clustering, were evaluated to explore anomaly detection strategies for the BETH dataset.
We selected these models because they are commonly used in anomaly detection research and their structure fits the characteristics of the BETH system call dataset and the goals of this study. The BETH benchmark treats intrusion detection as an anomaly and out of distribution problem, where models are trained only on normal host behavior and then evaluated on an exploited host. Isolation Forest was included because it is designed to separate rare or unusual data points in high dimensional datasets and has been widely used in cybersecurity research38,8. We chose clustering methods like K-Means39 and Gaussian Mixture Models40 because normal system activity often forms clear behavioral patterns, and events that fall far from these patterns may indicate suspicious or malicious behavior. Spectral Clustering41 and Hierarchical Clustering42 were added to capture more complex relationships in the data, since operating system processes aren’t always linearly separable. DBSCAN43 was selected because malicious activity may appear as small, low density regions in feature space. And lastly, we chose the Variational Autoencoder with DoSE scoring44,45 because it can learn deeper patterns of normal system behavior and produce energy based anomaly scores. These models allow us to compare how various assumptions affect the detection of suspicious and malicious activity.
KMeans Clustering used two clusters to partition system events into groups based on feature similarity39. We calculated anomaly scores by using the distance from each sample to its nearest cluster centroid where larger distances mean more anomalous behavior. Gaussian Mixture Models (GMMs) were used with two mixture components to model the data distribution probabilistically40. Each sample’s anomaly score was defined as the negative log likelihood under the fitted mixture model where samples with lower likelihoods were considered more anomalous. We used Spectral clustering with two clusters to capture non linear relationships in the data41. Since spectral clustering does not support direct prediction on unseen data, cluster centroids were computed from the training split and anomaly scores for validation and test samples were calculated using distance to the nearest centroid. Hierarchical (Agglomerative) clustering was implemented with two clusters using Ward linkage. Centroids were computed from training clusters, and anomaly scores were derived from the distance to the nearest centroid42.
The Variational Autoencoder (VAE) was used as an unsupervised neural model44. It consists of an encoder that maps input features to a latent distribution and a decoder that reconstructs the input. Our model was trained using a loss function that combines reconstruction error with a regularization term that enforces a smooth latent space. This allows the VAE to learn patterns of normal system behavior. For anomaly detection, reconstruction error was used as a baseline score. A DoSE-based approach was applied by combining reconstruction error and the regularization term into a single energy score. A density model was fitted on training energies and the negative log density was used as the final anomaly score. For all unsupervised models requiring the number of clusters as an input parameter, we set the number of clusters to two to reflect the binary detection objective of separating normal behavior from anomalous behavior. In this study, anomalous events correspond to either suspicious (sus=1) or malicious (evil=1) activity depending on whether we aim to identify the suspicious from normal or malicious from normal. This method aligns with the BETH benchmark study and helps have consistent comparisons across models.
Due to the computational complexity of Spectral Clustering, Hierarchical Clustering, and DBSCAN on large datasets, these methods required careful implementation to remain tractable. Table S2 (Supplementary Materials) supplies the full hyperparameter configuration for all seven models evaluated in this study. All clustering based models used two clusters to reflect the binary detection objective, with anomaly scores defined as distance to the nearest cluster centroid for KMeans, Spectral Clustering, and Hierarchical Clustering, and negative log likelihood for GMM. Among all models evaluated, only the Isolation Forest contamination parameter was tuned using the labeled validation set; DBSCAN and all other models used fixed, dataset-agnostic hyperparameters without any label-guided tuning. DBSCAN hyperparameters were not tuned on the validation set and the model is treated as a baseline instead of an optimized detector. We trained the VAE by using a combined MSE reconstruction and KL divergence loss with DoSE based scoring using Gaussian KDE instead of DoSE-SVM variant. All models were standardized using StandardScaler prior to fitting, and random seeds were fixed at 42 throughout to ensure reproducibility. All experiments were run on a Windows 11 machine with a Snapdragon X Plus ARM-based CPU and 16GB RAM. All code was implemented in Python 3.13.5 using scikit-learn 1.6.1, numpy 2.1.3, pandas 2.2.3, PyTorch 2.9.1+cpu. Due to memory constraints, Spectral Clustering, Hierarchical Clustering, and DBSCAN were each fitted on a randomly sampled subset of 30,000 training events (RandomState(42)) rather than the full training set of 763,144 events. Spectral Clustering and Hierarchical Clustering each completed within approximately 2 to 5 minutes on our hardware.
Model performance was evaluated using ROC AUC and PR AUC. How well a model separates normal and abnormal behavior across thresholds is measured by ROC AUC. PR AUC is precision and recall and is a better measure for imbalanced data46. Evaluation was performed on the validation and test splits. Our unsupervised learning models were trained only on training features and labels were used only after inference to compute evaluation metrics. The contamination parameter for Isolation Forest was selected by evaluating candidate values against the labeled validation set and choosing the value that maximized ROC AUC. All other models were configured using fixed, dataset-agnostic settings without any label-guided tuning. Even though it does not fully capture the impact of the severe class imbalance, we used ROC AUC for comparison with the literature review in order to maintain consistency with the original benchmark. PR AUC was computed in this research to provide more detailed insight into the model behavior under imbalance conditions.
Results and Discussion
Detection of Suspicious Events
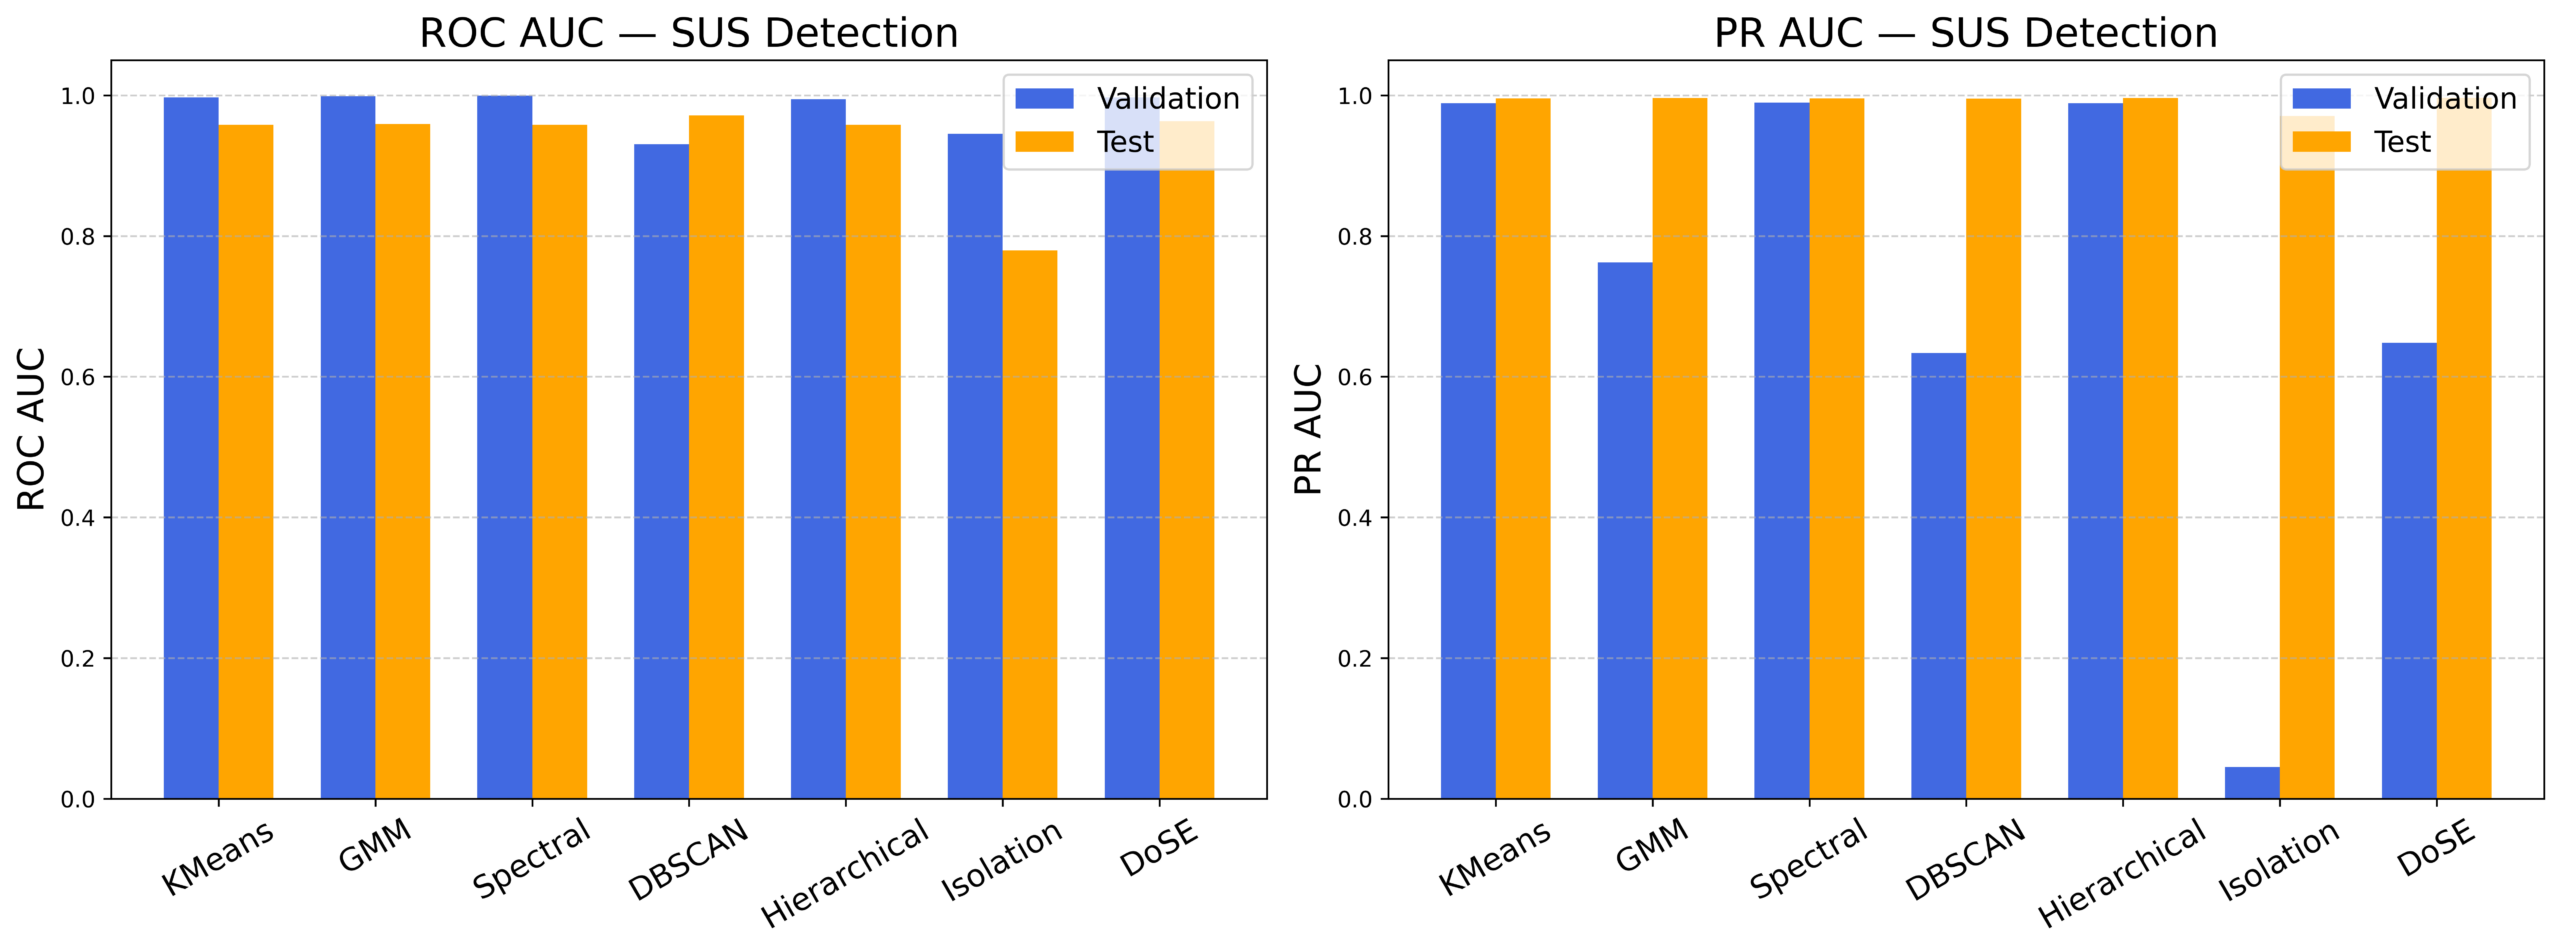
The results for detecting suspicious events (SUS) are presented in this section. We begin with the benchmark models reported in Highnam et al.8, such as Isolation Forest and the Variational Autoencoder with DoSE. Table S3 (Supplementary Materials) summarizes the validation and test performance for these models. One important difference is that they only reported test results, whereas our study also reports validation scores to better understand model performance before evaluation on the exploited host. Our results show improvement over the benchmark, with VAE–DoSE achieving a test ROC AUC of 0.963 compared to the 0.698 reported in literature, and clustering based models emerging as the top performers with PR AUC values at or above 0.988 on the validation set and 0.995 on the test set.
All models in this study are trained without access to class labels during the learning phase. Isolation Forest uses a contamination parameter of 0.001. We produced this specific contamination value by evaluating candidate values against the labeled validation set and choosing the value that maximized ROC AUC. All other models were configured using fixed, dataset agnostic settings without any label guided tuning. On the validation set, Isolation Forest achieved a ROC AUC of 0.945, and on the test set it achieved a ROC AUC of 0.779. Highnam et al.8 reported an ROC AUC of 0.850 for Isolation Forest for suspicious detection. Our Isolation Forest achieved a test ROC AUC of 0.779, which is lower than the benchmark value and is likely explained by differences in model implementation and tuning choices. The VAE–DoSE model achieved a ROC AUC of 0.996 on the validation set and 0.963 on the test set. In Highnam et al.8, VAE + DoSE reported an ROC AUC of 0.698, which was lower than Isolation Forest in that study. In our results VAE–DoSE outperforms Isolation Forest on both sets showing that the model benefits from the model training and evaluation we used.
Figure 1 and Table S3 (Supplementary Materials) show important differences for these two models when PR AUC is measured. On the validation set, Isolation Forest achieved a PR AUC of only 0.045 despite its ROC AUC of 0.945, which is most likely due to the contamination parameter being tuned to 0.001 on the validation set. The model already operates under a conservative anomaly threshold and only 0.42% of the validation set is suspicious events, and the optimal contamination value of 0.001 falls below this true rate. This shows that ROC AUC can be inaccurate on imbalanced data. Since suspicious events are rare in the validation set, the majority of predictions involve the negative class, causing ROC AUC to appear high. PR AUC focuses only on how well the model identifies the positive class, and it reveals that Isolation Forest struggles to detect suspicious events on the validation data. On the test set, Isolation Forest rises to a PR AUC of 0.970, but this rise is due to the much higher concentration of suspicious events in the test set. The VAE–DoSE model is more consistent and achieves a PR AUC of 0.648 on the validation set and 0.996 on the test set. This confirms it is better suited for detecting rare suspicious events. When comparing the two models, the gap in ROC AUC is smaller than the gap in PR AUC on the validation set (Figure 1, Table S3 (Supplementary Materials)).
Looking at the remaining unsupervised models, most clustering based approaches achieve extremely high ROC AUC values on the validation set, close to 1.0 (Figure 1, Table S3 (Supplementary Materials)). DBSCAN produced a slightly lower validation ROC AUC of 0.930 but still yielded good performance, most likely due to the sensitivity of DBSCAN to its epsilon and minimum samples hyperparameters, which were not tuned on the validation set in the same way as Isolation Forest. As a result, DBSCAN results should be used as a baseline comparison. DBSCAN’s core point representation used for scoring validation and test samples could have been affected by the significant number of noise during training. On the test set, all clustering models perform well, producing ROC AUC values around 0.95 to 0.96, and DBSCAN achieving the highest value of 0.971. ROC AUC values were strong across all clustering models but these scores by themselves do not reveal meaningful differences between them. Due to this we also examined PR AUC.
When PR AUC is examined, differences between the clustering models are revealed.On the validation set, KMeans, Spectral Clustering, and Hierarchical Clustering achieve PR AUC values of around 0.988 to 0.989, which are strong and consistent with their high ROC AUC. However, GMM drops to a PR AUC of 0.763 and DBSCAN to 0.634 on the validation set, despite both achieving ROC AUC values at or above 0.93. This gap between ROC AUC and PR AUC for these two models again highlights how ROC AUC can overstate performance when the positive class is rare. On the test set, all clustering models get high PR AUC values at or above 0.995, confirming strong precision and recall for suspicious event detection across the board. Overall Clustering based models are the strongest models as they perform consistently well on both metrics across both sets. DBSCAN is also strong on the test set but its lower validation PR AUC suggests it is somewhat less reliable under heavy imbalance. Isolation Forest remains the weakest benchmark model under imbalance while VAE DoSE is one of the strongest overall.
Our visualization in Figure 2 provides further insight into this behavior. t-SNE (t-distributed Stochastic Neighbor Embedding) was applied to the project to better understand how models separate normal from suspicious activity. And points that were similar in the original feature space tended to appear close together in the projection while points that were different got pushed apart. This is why t-SNE is useful for visualizing whether suspicious and normal events appear in different regions in the feature space. Though its good for visuals, t-SNE can distort global structure and its output is sensitive to hyperparameter choices. We used t-SNE separately on the validation and test sets using StandardScaler-normalized features, with perplexity=30, learning_rate=’auto’, init=’pca’, and random_state=42, applied to all samples in each split without subsampling. Our visualizations are provided for illustrative purposes only, and should not be interpreted as an explanation of why models perform well. The quantitative performance of each model is determined solely by the ROC AUC and PR AUC metrics reported in Figure 1 and Table S3 (Supplementary Materials).
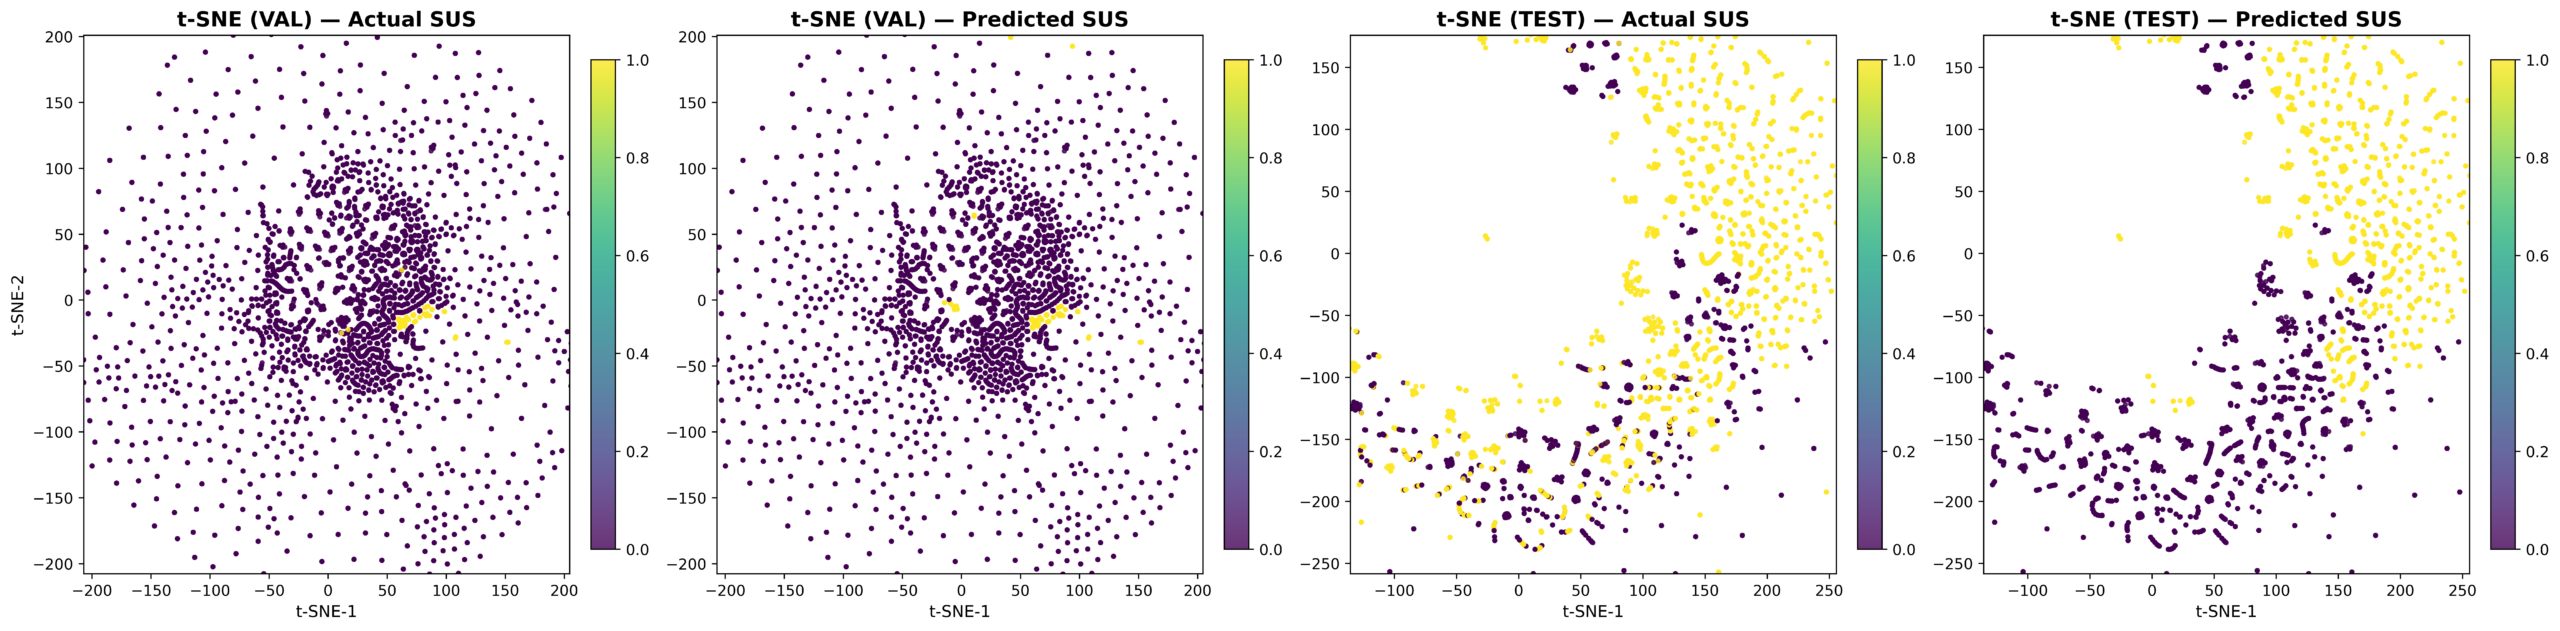
In the t-SNE projection, suspicious events appear as points that deviate from the dense cluster of normal system behavior. In the validation plot, suspicious events appear scattered more sparsely around the boundary of the normal cluster, while in the test set projection, suspicious and normal points appear more visually separated. These patterns are descriptive only and are not used to explain or predict the results reported in Table S3 (Supplementary Materials). Our quantitative metrics show that suspicious system behavior can be detected successfully using several unsupervised learning methods.
McNemar’s Significance Tests
We conducted McNemar’s significance tests to compare predictions across all six models on the suspicious detection test set. All 15 pairwise comparisons are statistically significant (p < 0.05), confirming that all of our models produce meaningfully different binary classifications Table S4 (Supplementary Materials),. Spectral Clustering came out as the strongest model overall. Hierarchical Clustering loses the most comparisons and performs the weakest. GMM correctly classifies 158,890 events that Hierarchical misses while only missing 35 that Hierarchical gets right. Differences in PR AUC between our models are small, but they still correspond to genuinely different classification behaviors on this data.
Detection of Malicious Events
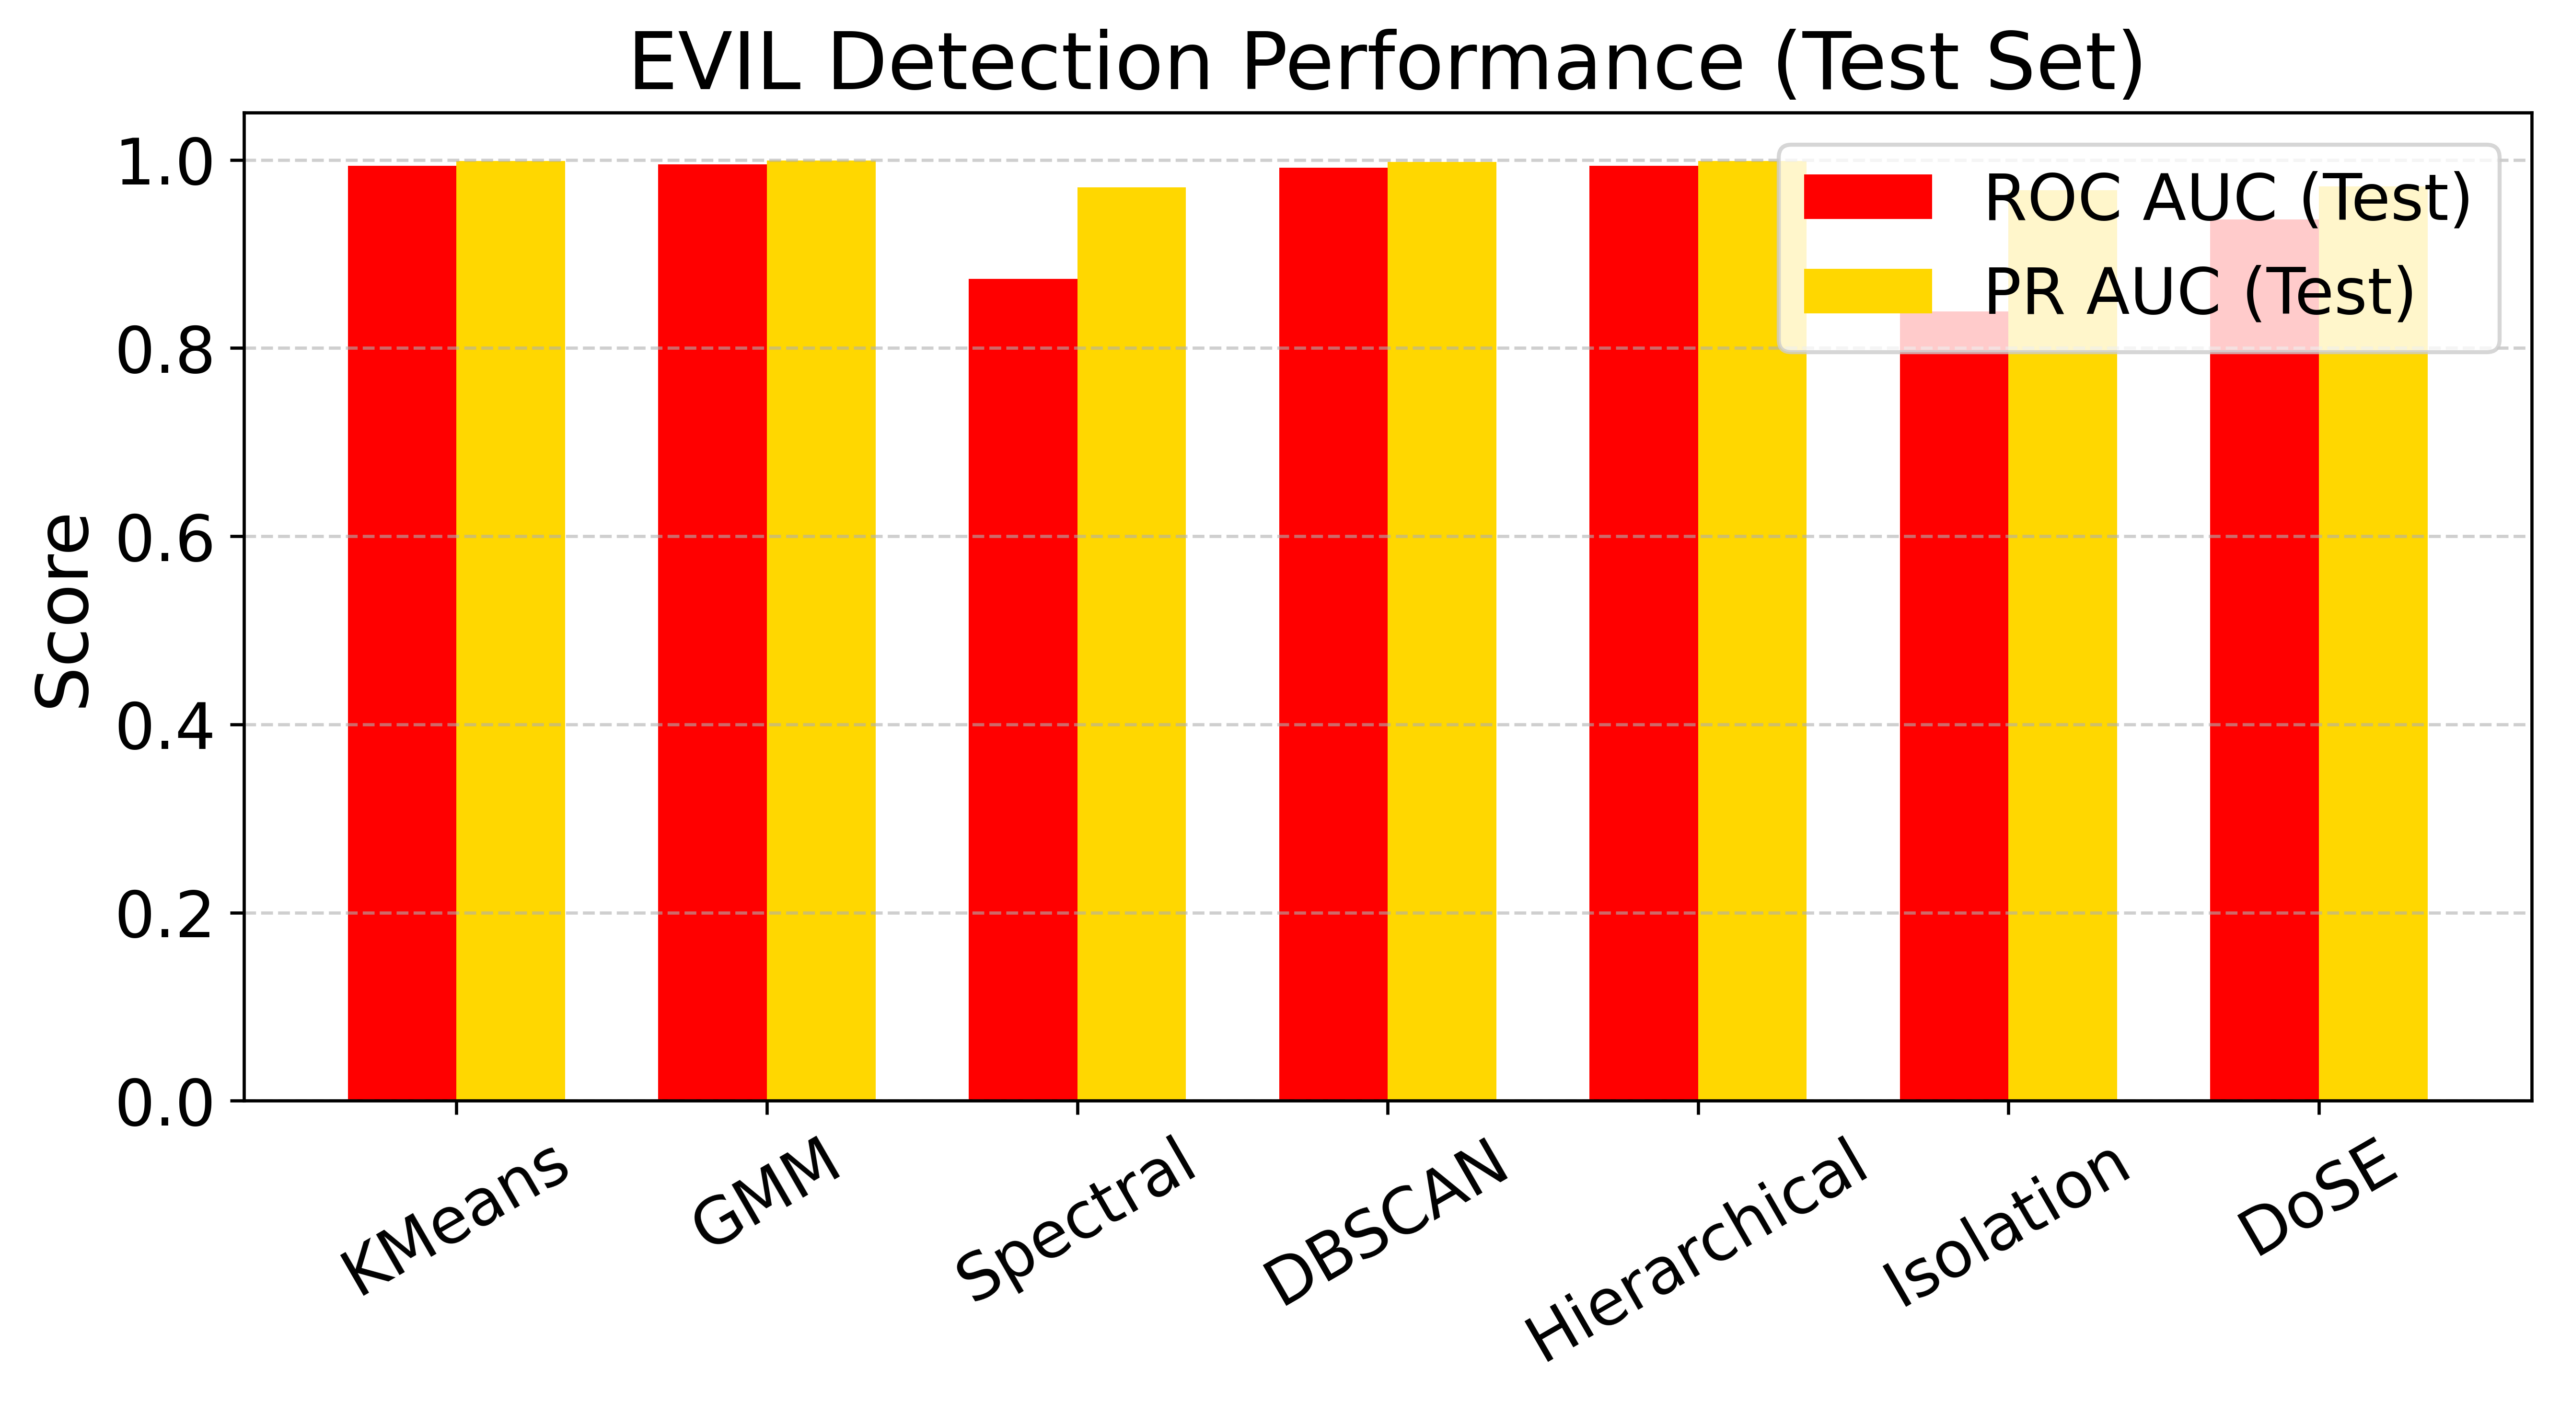
We next evaluate the detection of confirmed malicious activity (EVIL). Unlike suspicious detection, the training and validation datasets contain no malicious examples, meaning validation metrics cannot be computed for any model. So we focused only on the test set as shown in Table S5 (Supplementary Materials). KMeans, GMM, Hierarchical Clustering, and DBSCAN emerge as the strongest models with high PR AUC values of 0.998 to 0.999, while even the benchmark models perform competitively, with VAE–DoSE achieving a ROC AUC of 0.936 and PR AUC of 0.971 on the test set as shown in Figure 3. These results must be interpreted carefully because all malicious activity comes from a single exploited host. This means the model has only been tested against one specific attack pattern.
Furthermore, the class distribution in the test set is different from what would be encountered in real deployment where malicious events would be extremely rare. This means that PR AUC values on the test set cannot be directly compared to PR AUC values on the validation set.
PR curves are prevalence sensitive so a PR AUC on the test set where 90.7% of events are positive is not comparable to a PR AUC on a validation set where only 0.42% of events are positive. This is important for interpreting the PR AUC values reported in our study. To provide additional operational context, FPR at operationally relevant recall levels is reported here for Hierarchical Clustering as the representative model. For suspicious detection, the false positive rate at both 80% and 90% recall is 0.0000. This shows that the model achieves high recall with essentially no false positives on this test set. For malicious detection, the false positive rate at both 80% and 90% recall is 0.0011, and means fewer than 2 false positives per 1,000 benign events at these recall levels. The model at the 99th percentile validation threshold, raised 835 false positive suspicious alerts and 4,791 false positive malicious alerts across the entire test set, corresponding to approximately 167 and 958 false positives per host hour respectively. The exact duration of the single test host session is not separately reported so we used the approximate 5 hour total collection window for the full 23-host BETH dataset as an estimate. Attempts to compute prevalence-normalized metrics at operationally realistic class ratios were not feasible given the limited number of benign events in the test set. Matched prior evaluation sets would require collecting additional benign test hosts with class distributions representative of real deployment environments. This is beyond the scope of our study.
The benchmark models like Isolation Forest achieved a ROC AUC of 0.838 on the test set. Highnam et al.8 did not separately report results for malicious event detection. Their ROC AUC values of 0.850 for Isolation Forest and 0.698 for VAE + DoSE were reported specifically for the suspicious detection task and are not directly comparable to our malicious detection results. Despite this, our Isolation Forest ROC AUC of 0.838 is in a similar range to the paper’s overall value of 0.850, showing reasonable consistency. Our VAE–DoSE model achieved a ROC AUC of 0.936 on the test set, which is higher than the 0.698 reported in the BETH paper. This shows that our implementation allows the model to separate malicious from benign behavior better.
When PR AUC is introduced for both benchmark models, the difference between them narrows considerably. Isolation Forest achieved a PR AUC of 0.967 and VAE–DoSE achieved 0.971. Despite the ROC AUC gap of nearly 0.1 between the two models, their PR AUC values are almost identical. This is an important finding because ROC AUC suggests VAE–DoSE is meaningfully better, but PR AUC reveals that both models perform at a very similar level when it comes to actually identifying malicious events with high precision and recall.
Since no validation labels exist for malicious events, only test results are available for the clustering models. Most clustering approaches achieve extremely high ROC AUC values on the test set. KMeans, GMM, Hierarchical Clustering, and DBSCAN all produce ROC AUC values close to 1.0, with GMM achieving the highest at 0.995 (Table S5 (Supplementary Materials), Figure 3). As with the suspicious detection task, these high ROC AUC values are difficult to differentiate and should be interpreted with some caution. Spectral clustering achieved a noticeably lower ROC AUC of 0.874 and is an exception.
When PR AUC is examined, the results largely confirm the ROC AUC rankings but with some important nuance. KMeans, GMM, Hierarchical, and DBSCAN all achieve PR AUC values of approximately 0.998 to 0.999, confirming high precision and recall for malicious detection. Spectral Clustering achieves a PR AUC of 0.971, which is notably lower than the other clustering models but still strong in absolute terms. Comparing Spectral Clustering’s ROC AUC of 0.874 with its PR AUC of 0.971 shows that while it struggles more with overall class separation, it still maintains reasonable precision and recall for the malicious class specifically. Overall, KMeans, GMM, Hierarchical, and DBSCAN are the strongest models on this task. Our VAE–DoSE also performs well across both metrics. Isolation Forest is competitive but weaker than the clustering models in ROC AUC, but its PR AUC remains high.
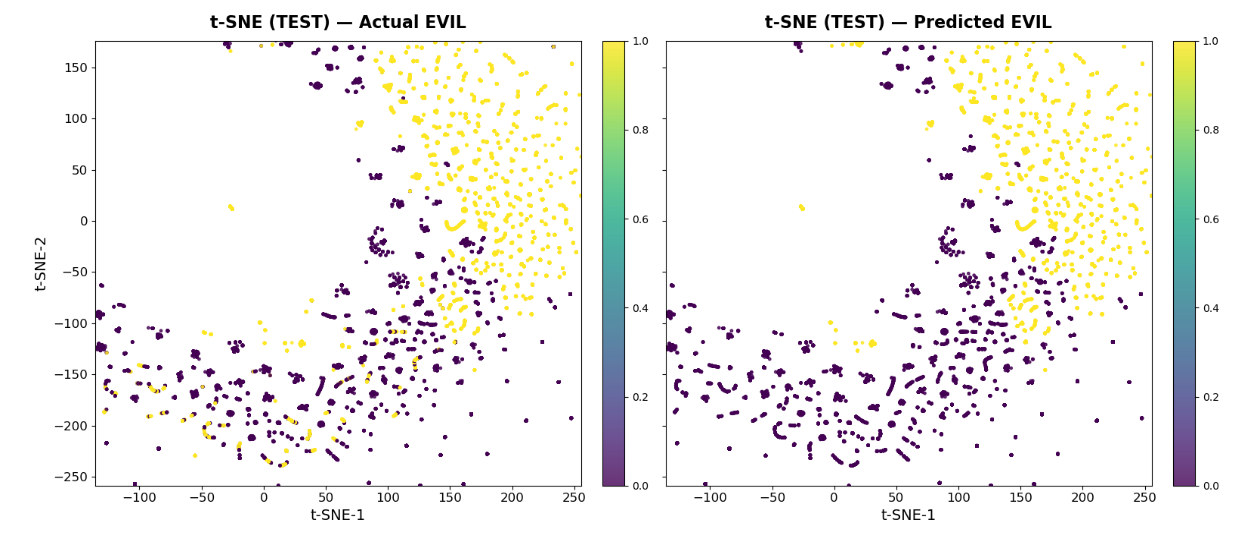
Our visualization in Figure 4 further supports these results. t-SNE was applied to the test set using the same parameters as above (perplexity=30, learning_rate=’auto’, init=’pca’, random_state=42) and is provided for illustrative purposes only. In our t-SNE projection, malicious events form a separated region in the embedded feature space compared to benign system activity. This separation appears more defined than what was observed for suspicious events. This visual pattern is descriptive only and isn’t used to explain the detection results reported in Table S5 (Supplementary Materials).
Sensitivity of Number of Clusters
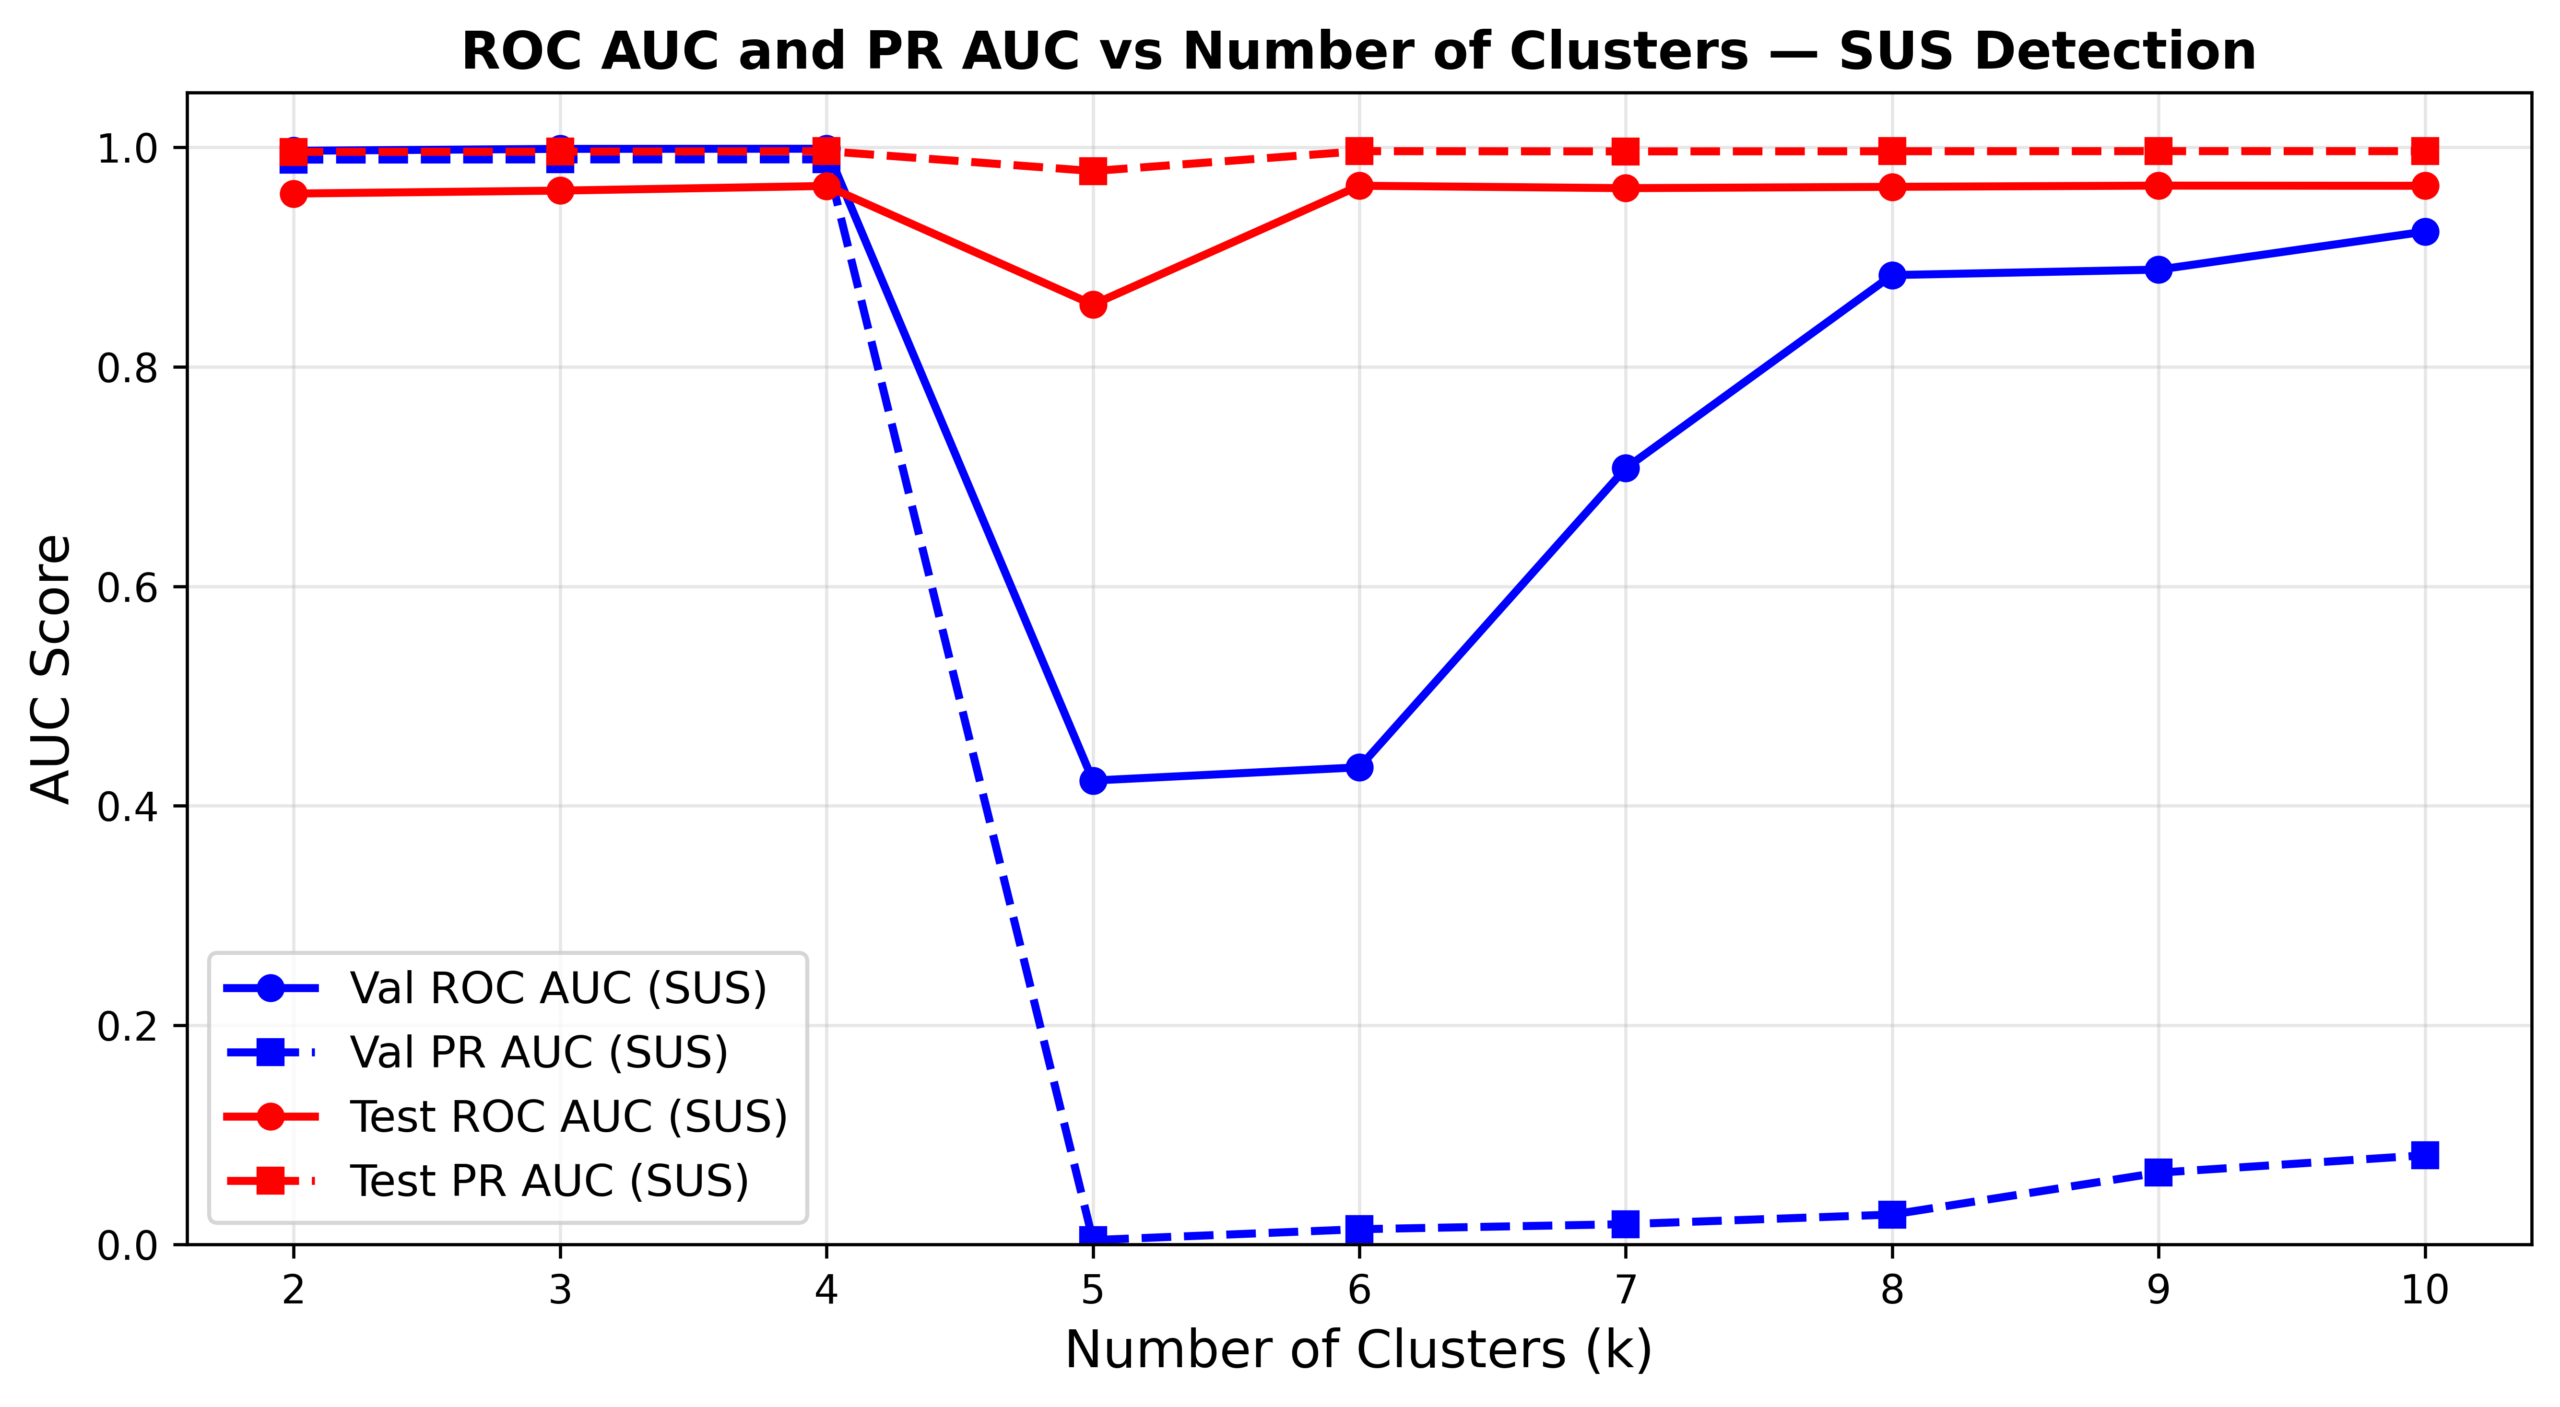
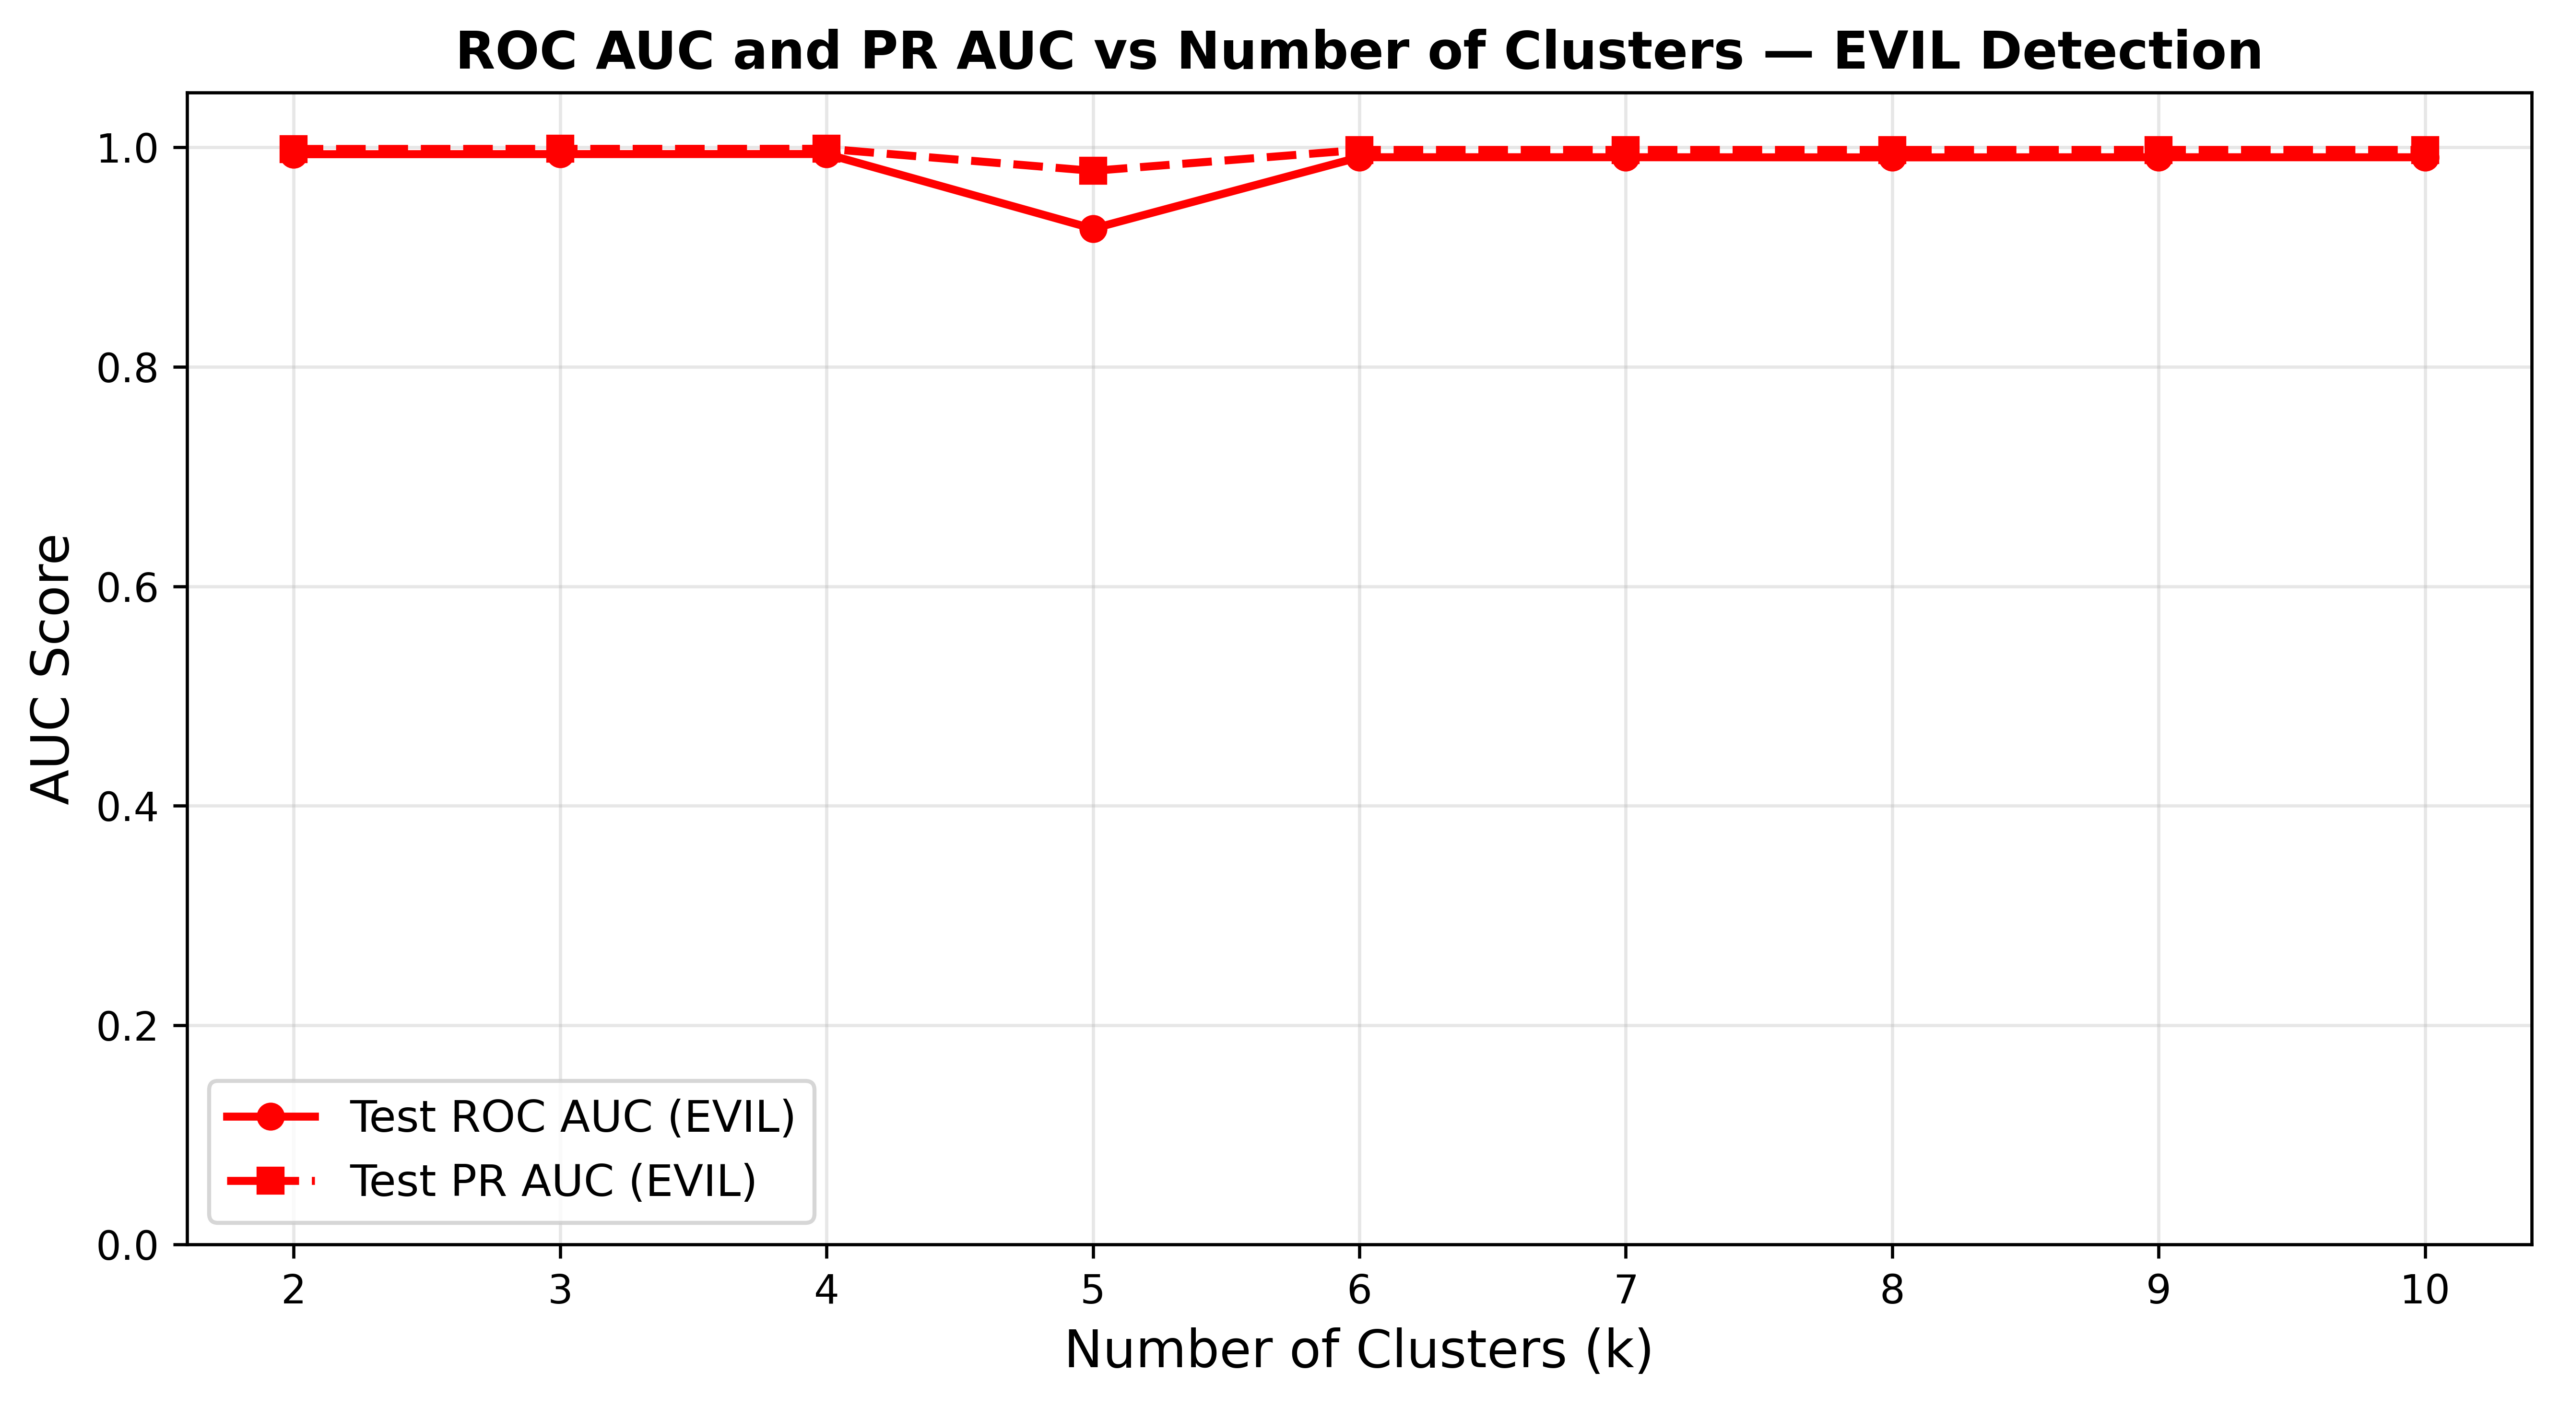
To validate the choice of k=2, KMeans was tested across cluster counts from k=2 to k=10 to ensure results are not an artifact of this hyperparameter decision. We conducted an additional experiment that evaluated KMeans performance across cluster counts ranging from k=2 to k=10 to investigate whether forcing k=2 hides richer cluster structure. As shown in Figure 5, for suspicious detection, validation PR AUC remained strong at approximately 0.989 for k=2, 3, and 4, before collapsing sharply to 0.004 at k=5 and recovering only partially for larger values, while test PR AUC remained relatively stable throughout. As shown in Figure 6, for malicious detection, both ROC AUC and PR AUC remained highly stable across all tested values of k, with test PR AUC staying above 0.978 throughout. Figures 5 and 6 show that k=2 is a justified choice for this dataset and that increasing the number of clusters does not reveal richer structure that improves detection performance.
Operating Point Analysis
Table 2 presents the operating point analysis for all the seven models. The results include precision, recall, F1, and the number of alerts triggered at a threshold corresponding to the suspicious event prevalence of 90.7% in the test set. This threshold was chosen to reflect the actual class distribution of the benchmark test set. At this operating point, most clustering based models raise approximately 172,000 to 173,000 alerts out of 188,967 total test events which was consistent with the high prevalence of suspicious activity in the test set. For suspicious detection, KMeans, Spectral Clustering, and Hierarchical Clustering achieve identical precision of 0.933 and recall of 0.941. GMM performs slightly better with precision of 0.939 and recall of 0.945. VAE–DoSE achieves the highest recall of 0.990 among models with a meaningful decision boundary, at a slightly lower precision of 0.921, suggesting it is more sensitive to suspicious events. For malicious detection, Isolation Forest achieves the highest precision of 0.901, while VAE–DoSE achieves the highest recall of 0.999 among models with a meaningful decision boundary. DBSCAN is an outlier because it flagged all 188,967 events and should be treated as a degenerate baseline. Overall, these results show that clustering based models had consistent precision and recall around 0.93 for this benchmark and provide an helpful comparison of detection performance at a specific operating point, complementing the AUC analysis in Table S3 (Supplementary Materials) and Table 2.
Table 2 presents the operating point analysis for all the seven models. The results include precision, recall, F1, and the number of alerts triggered at a threshold corresponding to the suspicious event prevalence of 90.7% in the test set. This threshold was chosen to reflect the actual class distribution of the benchmark test set. At this operating point, most clustering based models raise approximately 172,000 to 173,000 alerts out of 188,967 total test events which was consistent with the high prevalence of suspicious activity in the test set. For suspicious detection, KMeans, Spectral Clustering, and Hierarchical Clustering achieve identical precision of 0.933 and recall of 0.941. GMM performs slightly better with precision of 0.939 and recall of 0.945. VAE–DoSE achieves the highest recall of 0.990 at a slightly lower precision of 0.921, suggesting it is more sensitive to suspicious events. For malicious detection, Isolation Forest achieves the highest precision of 0.901, while VAE–DoSE achieves the highest recall of 0.999 among models with a meaningful decision boundary. DBSCAN is an outlier because it flagged all 188,967 events and should be treated as a degenerate baseline. Overall, these results show that clustering based models had consistent precision and recall around 0.93 for this benchmark and provide an helpful comparison of detection performance at a specific operating point, complementing the AUC analysis in Table S3 (Supplementary Materials) and Table 2.
| Model | SUS Precision | SUS Recall | SUS F1 | EVIL Precision | EVIL Recall | EVIL F1 | Alerts Raised |
| KMeans | 0.9327 | 0.9411 | 0.9369 | 0.8889 | 0.9707 | 0.9280 | 173,010 |
| GMM | 0.9386 | 0.9448 | 0.9417 | 0.8902 | 0.9696 | 0.9282 | 172,577 |
| Spectral | 0.9327 | 0.9411 | 0.9368 | 0.8889 | 0.9707 | 0.9280 | 173,009 |
| Hierarchical | 0.9327 | 0.9411 | 0.9369 | 0.8889 | 0.9707 | 0.9280 | 173,010 |
| DBSCAN | 0.9073 | 1.0000 | 0.9514 | 0.8384 | 1.0000 | 0.9121 | 188,967 |
| Isolation Forest | 0.9364 | 0.9370 | 0.9367 | 0.9005 | 0.9752 | 0.9364 | 171,572 |
| VAE-DoSE | 0.9208 | 0.9896 | 0.9539 | 0.8584 | 0.9985 | 0.9232 | 184,277 |
Ablation Study
KMeans was evaluated under two conditions: the full eight-feature set and a reduced set with these fields removed. This was done to verify that the identifier features threadId and eventId contribute genuine behavioral signs. We conducted an ablation study using KMeans as a representative model, we also report these results in Table 3. We did this test to assess whether the ID-like features threadId and eventId contribute meaningful signals or introduce arbitrary patterns. The model was evaluated by using the full eight feature set including threadId and eventId, and also a reduced six feature set with these fields removed. For suspicious detection, performance was basically identical between both conditions,with PR AUC values being very similar on both validation and test sets, as shown in Table 3. For malicious detection we removed threadId and eventId. This resulted in a drop in test ROC AUC from 0.994 to 0.874 and test PR AUC from 0.999 to 0.973, suggesting that these fields carry genuine signals for identifying confirmed malicious behavior. Both features were retained in the final feature set.
| Metric | All 8 Features | Without ID Features (threadId, eventId removed) | Difference |
| Val ROC AUC (SUS) | 0.9969 | 0.9991 | +0.0022 |
| Val PR AUC (SUS) | 0.9889 | 0.9891 | +0.0003 |
| Test ROC AUC (SUS) | 0.9579 | 0.9625 | +0.0045 |
| Test PR AUC (SUS) | 0.9959 | 0.9960 | +0.0000 |
| Test ROC AUC (EVIL) | 0.9938 | 0.8737 | −0.1201 |
| Test PR AUC (EVIL) | 0.9986 | 0.9730 | −0.0256 |
One-Class VAE Experiment
We also conducted an additional experiment by training the VAE exclusively on confirmed normal events (sus=0, evil=0) and removing all 1,269 suspicious events from the training set. We did this to address the worry that models trained on data with unlabeled suspicious events might not represent a genuine anomaly detection scenario. This setup was then assessed on the same validation and test sets.
When we trained the VAE only on confirmed normal events it resulted in worse performance across all metrics as shown in Table 4. These results show that the small number of suspicious events in the training set provide useful regularization rather than contaminating the model, justifying the original training setup.
| Metric | Original VAE (trained on all training data) | One-Class VAE (trained on normal events only) | Difference |
| Val ROC AUC (SUS) | 0.9960 | 0.9404 | −0.0556 |
| Val PR AUC (SUS) | 0.6480 | 0.0314 | −0.6166 |
| Test ROC AUC (SUS) | 0.9630 | 0.6512 | −0.3118 |
| Test PR AUC (SUS) | 0.9960 | 0.8863 | −0.1097 |
| Test ROC AUC (EVIL) | 0.9360 | 0.6736 | −0.2624 |
| Test PR AUC (EVIL) | 0.9710 | 0.8250 | −0.1460 |
Discussion
Our Clustering based unsupervised models were the strongest and most consistent when detecting suspicious events. KMeans, Spectral Clustering, and Hierarchical Clustering achieved validation ROC AUC above 0.994, an identical test ROC AUC of 0.958, and PR AUC at or above 0.995 on the test set. GMM was also strong but showed some sensitivity to the imbalance present in the data. DBSCAN’s validation PR AUC was also lower (0.634) but came back up on the test set.
VAE-DoSE was the strongest among the benchmark models, achieving a validation ROC AUC of 0.996, test ROC AUC of 0.963, and test PR AUC of 0.996. Isolation Forest was the weakest overall, with a validation PR AUC of only 0.045 but has a validation ROC AUC of 0.945. These scores demonstrate how confusing ROC AUC values can be when there are few positive events in the dataset and also helps argue that PR AUC is the better measurement in our case.
For detecting malicious events we only used the test set in our evaluation because the training and validation splits have no malicious labels. On this task, KMeans, GMM, Hierarchical Clustering, and DBSCAN all achieved high performance with ROC AUC values between 0.992 and 0.995 and PR AUC values between 0.998 and 0.999. These results were higher than what the same models achieved on the suspicious detection task. Spectral clustering has a lower ROC AUC and PR AUC for malicious detection, meaning that it picks up different data patterns that aren’t that useful for spotting behavior VAE-DoSE performed well with a test ROC AUC of 0.936 and PR AUC of 0.971, and Isolation Forest achieved a ROC AUC of 0.838 and PR AUC of 0.967. An important finding on this task is that even with a gap of 0.1 in ROC AUC between Isolation Forest and VAE-DoSE, their PR AUC values are almost identical at 0.967 and 0.971, showing that ROC AUC overstates meaningful differences between models when data is imbalanced. Our results shouldn’t be used as proof that the detection works for all attack types or system setups.
Our study has improvements for most evaluated models when compared to the BETH benchmark. The literature reported ROC AUC values of 0.850 for Isolation Forest and 0.698 for VAE-DoSE, which were the two best performing models in their study. These values were reported specifically for the suspicious detection task. Our VAE-DoSE has a test ROC AUC of 0.963 for suspicious detection and is higher than the BETH benchmark’s value. The malicious detection ROC AUC of 0.936 on the other hand, cannot be compared to other studies because it wasn’t tested separately on confirmed malicious events. The Isolation Forest’s test ROC AUC of 0.779 for suspicious detection is below the 0.850 from the original paper. This is probably because of differences in how the model is built and tuned.
Our study evaluated five additional clustering methods beyond the benchmark models. All of our models outperformed the original benchmark on both detection tasks. KMeans, GMM, Hierarchical Clustering, and DBSCAN achieved ROC AUC and PR AUC values above 0.99 on malicious detection, showing that simpler distance based and density based methods are effective on this dataset. The inclusion of PR AUC as a primary metric in this study gives a more honest assessment of model performance than the original benchmark. PR AUC measures how well models find rare positive events and not how well they classify the common negative class.
Traditional rule based and supervised intrusion detection systems that were used on data like KDD Cup 1999 and NSL-KDD reported high precision and recall values but were implemented under controlled conditions. These results are often inflated by the use of simulated or outdated data4. Unsupervised anomaly detection systems that evaluated on real world data tended to report lower performance due to the difficulty of detecting novel attack patterns without labeled training examples6,7. Sommer & Paxson7 point out that anomaly detection systems that are deployed in real networks suffer from high false positive rates and making precision a critical operational metric. In our study the precision of our Hierarchical Clustering was 0.9327 for suspicious detection and 0.8889 for malicious detection. These values show strong performance on real data compared to other unsupervised models.
Limitations
First, the training and validation datasets contain no malicious events, so malicious activity could only be evaluated on the test set. This prevents any tuning or validation of models specifically for malicious detection and limits the ability to assess generalization before test evaluation.
Second, the BETH dataset has severe class imbalance. The suspicious and malicious events make up only a fraction of the training and validation data. This imbalance makes it difficult to optimize models for rare event detection and causes these models to inflate metrics like ROC AUC. This is why we also reported PR AUC to provide a more accurate picture of model performance.
Third, the data preprocessing approach used in our study closely follows the methodology outlined in BETH benchmark and does not introduce novel feature engineering. Several potentially informative columns such as stackAddresses, args, and processName were excluded due to their complexity, meaning the models were trained on simplified feature sets that might not have captured the full diversity of the system call data. So the feature set used in this study should not be characterized as carefully engineered, but as a simplified tabular representation derived directly from the BETH benchmark preprocessing guidelines. Incorporating richer feature representations such as processName encodings, argument parsing, and stack address embeddings is up for future work.
Fourth, the test set consists of a single exploited host running a single type of attack. This means that model performance is evaluated against only one attack vector, and results may not generalize to other types of malicious behavior. So claims of high accuracy detection should be taken as applying strictly to this benchmark setting and this attack type, and should not be generalized to other malware families such as ransomware, cryptomining, or lateral movement.
Fifth, this study follows the host-level train/validation/test split established by BETH benchmark, in which specific honeypot hosts are fixed to each partition. This design was preserved to help make a comparison with the original BETH benchmark and to keep it consistent with the evaluation protocol. Since every metric in our study is derived from this single fixed partition, the sensitivity of results to which host is assigned to the test set remains unknown. We haven’t explored alternative host level splits and reporting performance across multiple partitions, this is left as future work.
Sixth, the PR AUC values observed for malicious detection should be interpreted more carefully because of the favorable class distribution of the test set. In the validation set, suspicious events represent only 0.42% of all events, while the test set contains 158,432 malicious events out of 188,967 total events, so malicious activity accounts for approximately 83.8% of the test set. This imbalanced distribution makes it a lot easier for models to achieve high precision and recall for malicious detection. So PR AUC values reported for malicious detection should be understood as reflecting performance under these favorable benchmark conditions instead of a reliable indicator of operational detection capability. We want to advise future studies to evaluate model performance at operationally realistic class ratios to help better understand how the results can translate to real world deployment. Also, our model rankings for malicious detection are based on a single test host, so the ordering of models could be driven by little quirks of this host rather than reflecting genuine differences in detection capability.
Seventh, our study looks only at per-event tabular features and does not model temporal sequences or dependencies between the system calls. Many previous studies found sequence based modeling using LSTMs or transformer architectures important for detecting complex attack patterns that happen over time. Attack behaviors that happen as sequences of individually normal events may then be missed by the models evaluated in this study. Using temporal context represents an important direction for future work.
Eighth, our study relies on the sus and evil labels as already provided by the BETH dataset without independent verification of label quality or noise. The labeling methodology is described in BETH benchmark, where suspicious events were manually labeled to indicate unusual activity and evil events were labeled to indicate confirmed malicious behavior. We did not have access to the original labeling process or any ground truth except what the BETH dataset provides. So some suspicious events in the test set might represent early stages of the attack instead of independent anomalies, which could affect the clean separation between the two detection tasks. We use the labeling method from the BETH data and acknowledge that label quality and possible noise are limits beyond the scope of our study
Conclusions
Our study evaluated seven unsupervised machine learning models for detecting suspicious and malicious system events in the BETH cybersecurity dataset, addressing two separate detection objectives. For suspicious event detection, clustering-based models came out on top by achieving validation PR AUC values of approximately 0.989 and test PR AUC values at or above 0.995. Our VAE-DoSE model also performed well, achieving a test ROC AUC of 0.963 compared to the 0.698 reported in the original benchmark. Isolation Forest got a strong validation ROC AUC of 0.945 but dropped to a PR AUC of only 0.045 on the validation set due to severe class imbalance. Malicious event detection was evaluated only on the test set due to the absence of evil labels in training and validation. KMeans, GMM, Hierarchical Clustering, and DBSCAN all achieved high PR AUC values between 0.998 and 0.999. These results show that malicious behavior forms an easily identifiable distribution from normal system activity and is detectable by a wide range of unsupervised approaches. These results are not in our scope of the evaluation because all malicious activity originates from a single compromised host running a single botnet. Performance on other attack types or deployment environments remains an open question for future studies
When compared to the original BETH benchmark, the results of this study represent an improvement across all evaluated models. Our study tested ROC AUC values of 0.779 and 0.963 for Isolation Forest and VAE-DoSE respectively on suspicious detection, with clustering models reaching ROC AUC values between 0.958 and 0.971. Importantly, the original benchmark reported results for suspicious detection only and did not include a separate malicious event detection evaluation, and did not report PR AUC. By evaluating both tasks separately and reporting PR AUC alongside ROC AUC, this study shows a more complete and realistic picture of model performance under the severe class imbalance that characterizes real-world cybersecurity data. The findings demonstrate that clustering-based methods, which were not evaluated in the original benchmark, are highly competitive and in several cases outperform the models originally proposed. It’s important to know that our findings are specific to per-event tabular features and do not account for temporal or sequential patterns in system call behavior.
Several limitations of this study should be acknowledged. The absence of malicious labels prevented model tuning for evil detection, class imbalance inflated ROC AUC scores, and the preprocessing pipeline BETH benchmark without novel feature engineering. Results are tied to a single botnet attack on a single exploited host and a fixed host-level partition, meaning generalizability remains an open question. Future work should explore richer feature representations, alternative data splits, and a two-stage pipeline where suspicious predictions gate malicious classification.
Future work should fix these problems by incorporating more complex feature representations including processName encodings and argument parsing, evaluating models across multiple data partitions to establish confidence intervals around reported metrics, and testing on the broader BETH dataset which includes cryptomining and lateral movement attacks beyond the botnet used here. More broadly, the performance of simple clustering methods on this dataset suggests that tabular features derived from the BETH preprocessing pipeline combined with distance-based anomaly scoring show strong performance on this benchmark, though generalization to real-world intrusion detection settings requires further investigation, offering a computationally efficient alternative to deep learning approaches.
Supplementary Information
References
- Identity Theft Resource Center (ITRC). 2023 annual data breach report. https://www.idtheftcenter.org/post/2023-annual-data-breach-report-reveals-record-number-of-compromises-72-percent-increase-over-previous-high/, 2024. [↩]
- S. Morgan. Cybercrime to cost the world $9.5 trillion USD annually in 2024. https://cybersecurityventures.com/cybercrime-to-cost-the-world-9-trillion-annually-in-2024/, 2023. [↩]
- IBM Security. Cost of a data breach report 2023. https://www.scottins.com/wp-content/uploads/2023/12/IBM-Cost-of-a-Data-Breach-Report-2023.pdf, 2023. [↩]
- H.-J. Liao, C.-H. R. Lin, Y.-C. Lin, K.-Y. Tung. Intrusion detection system: a comprehensive review. Journal of Network and Computer Applications. Vol. 36, pg. 16–24, 2013, https://doi.org/10.1016/j.jnca.2012.09.004. [↩] [↩] [↩] [↩]
- S. Axelsson. Intrusion detection systems: a survey and taxonomy. Technical Report 99-15, Chalmers University of Technology, 2000, https://www.researchgate.net/publication/2597023_Intrusion_Detection_Systems_A_Survey_and_Taxonomy. [↩] [↩]
- V. Chandola, A. Banerjee, V. Kumar. Anomaly detection: a survey. ACM Computing Surveys. Vol. 41, pg. article 15, 2009, https://doi.org/10.1145/1541880.1541882. [↩] [↩] [↩] [↩]
- R. Sommer, V. Paxson. Outside the closed world: on using machine learning for network intrusion detection. Proceedings of the 2010 IEEE Symposium on Security and Privacy. pg. 305–316, 2010, https://ieeexplore.ieee.org/document/5504793. [↩] [↩] [↩] [↩]
- K. Highnam, K. Arulkumaran, Z. Hanif, N. R. Jennings. BETH dataset: real cybersecurity data for anomaly detection research. ICML Workshop on Uncertainty and Robustness in Deep Learning, 2021, https://ceur-ws.org/Vol-3095/paper1.pdf. [↩] [↩] [↩] [↩] [↩] [↩] [↩] [↩] [↩] [↩]
- R. Lippmann, J. W. Haines, D. J. Fried, J. Korba, K. Das. The 1999 DARPA off-line intrusion detection evaluation. Computer Networks. Vol. 34, pg. 579–595, 2000, https://doi.org/10.1016/S1389-1286(00)00139-0. [↩]
- S. J. Stolfo, W. Fan, W. Lee, A. L. Prodromidis, P. K. Chan. Cost-based modeling for fraud and intrusion detection: results from the JAM project. Proceedings of the DARPA Information Survivability Conference and Exposition (DISCEX 2000). Vol. 2, pg. 130–144, 2000, https://doi.org/10.1109/DISCEX.2000.821515. [↩]
- N. Moustafa, J. Slay. UNSW-NB15: a comprehensive data set for network intrusion detection systems. Proceedings of the 2015 Military Communications and Information Systems Conference (MilCIS). pg. 1–6, 2015, https://doi.org/10.1109/MilCIS.2015.7348942. [↩]
- G. Kim, H. Yi, J. Lee, Y. Paek, S. Yoon. LSTM-based system-call language modeling and robust ensemble method for designing host-based intrusion detection systems. arXiv, 2016, https://arxiv.org/abs/1611.01726. [↩]
- M. Goldstein, S. Uchida. A comparative evaluation of unsupervised anomaly detection algorithms for multivariate data. PLOS ONE. Vol. 11, pg. e0152173, 2016, https://doi.org/10.1371/journal.pone.0152173. [↩]
- F. Falcão, T. Zoppi, C. B. V. Silva, A. Santos, B. Fonseca, A. Ceccarelli, A. Bondavalli. Quantitative comparison of unsupervised anomaly detection algorithms for intrusion detection. Proceedings of the 34th ACM/SIGAPP Symposium on Applied Computing. pg. 318–327, 2019, https://doi.org/10.1145/3297280.3297314. [↩]
- R. Bouman, Z. Bukhsh, T. Heskes. Unsupervised anomaly detection algorithms on real-world data: how many do we need? Journal of Machine Learning Research. Vol. 25, pg. 1–34, 2024, https://jmlr.org/papers/v25/23-0570.html. [↩]
- T. Zoppi, A. Ceccarelli, T. Capecchi, A. Bondavalli. Unsupervised anomaly detectors to detect intrusions in the current threat landscape. ACM/IMS Transactions on Data Science. Vol. 2, pg. article 7, 2021, https://doi.org/10.1145/3441140. [↩]
- T. Zoppi, A. Ceccarelli, A. Bondavalli. Unsupervised algorithms to detect zero-day attacks: strategy and application. IEEE Access. Vol. 9, pg. 90603–90615, 2021, https://doi.org/10.1109/ACCESS.2021.3090957. [↩]
- S. Hariri, M. Carrasco Kind, R. J. Brunner. Extended isolation forest. IEEE Transactions on Knowledge and Data Engineering. Vol. 33, pg. 1479–1489, 2021, https://doi.org/10.1109/TKDE.2019.2947676. [↩]
- H. Xu, G. Pang, Y. Wang, Y. Wang. Deep isolation forest for anomaly detection. IEEE Transactions on Knowledge and Data Engineering. Vol. 35, pg. 12591–12604, 2023, https://doi.org/10.1109/TKDE.2023.3270293. [↩]
- P. Zhang, F. He, H. Zhang, J. Hu, X. Huang, J. Wang, X. Yin, H. Zhu, Y. Li. Real-time malicious traffic detection with online isolation forest over SD-WAN. IEEE Transactions on Information Forensics and Security. Vol. 18, pg. 2076–2090, 2023, https://doi.org/10.1109/TIFS.2023.3262121. [↩]
- H. Xiang, X. Zhang, H. Hu, L. Qi, W. Dou, M. Dras, A. Beheshti, X. Xu. OptIForest: optimal isolation forest for anomaly detection. Proceedings of the 32nd International Joint Conference on Artificial Intelligence (IJCAI-23). pg. 2379–2387, 2023, https://doi.org/10.24963/ijcai.2023/264. [↩]
- P. Artioli, A. Maci, A. Magrì. A comprehensive investigation of clustering algorithms for user and entity behavior analytics. Frontiers in Big Data. Vol. 7, pg. 1375818, 2024, https://doi.org/10.3389/fdata.2024.1375818. [↩]
- L. Liu, M. Xu. A network intrusion detection method based on contrastive learning and Bayesian Gaussian mixture model. Cybersecurity. Vol. 8, 2025, https://doi.org/10.1186/s42400-025-00364-7. [↩]
- S. Zavrak, M. Iskefiyeli. Anomaly-based intrusion detection from network flow features using variational autoencoder. IEEE Access. Vol. 8, pg. 108346–108358, 2020, https://doi.org/10.1109/ACCESS.2020.3001350. [↩]
- B. Zong, Q. Song, M. R. Min, W. Cheng, C. Lumezanu, D. Cho, H. Chen. Deep autoencoding Gaussian mixture model for unsupervised anomaly detection. Proceedings of the 6th International Conference on Learning Representations (ICLR 2018), 2018, https://iclr.cc/virtual/2018/poster/126. [↩]
- O. Gorokhov, M. Petrovskiy, I. Mashechkin, M. Kazachuk. Fuzzy CNN autoencoder for unsupervised anomaly detection in log data. Mathematics. Vol. 11, pg. 3995, 2023, https://doi.org/10.3390/math11183995. [↩]
- M. Landauer, S. Onder, F. Skopik, M. Wurzenberger. Deep learning for anomaly detection in log data: a survey. Machine Learning with Applications. Vol. 12, pg. 100470, 2023, https://doi.org/10.1016/j.mlwa.2023.100470. [↩]
- C. Almodovar, F. Sabrina, S. Karimi, S. Azad. LogFiT: log anomaly detection using fine-tuned language models. IEEE Transactions on Network and Service Management. Vol. 21, pg. 1715–1723, 2024, https://doi.org/10.1109/TNSM.2024.3358730. [↩]
- B. Lakha, S. L. Mount, E. Serra, A. Cuzzocrea. Anomaly detection in cybersecurity events through graph neural network and transformer based model: a case study with BETH dataset. Proceedings of the 2022 IEEE International Conference on Big Data. pg. 5756–5764, 2022, https://doi.org/10.1109/BigData55660.2022.10020336. [↩]
- L. P. Khan, A. Hossain, S. Dey. Anomaly detection for BETH dataset using machine learning approaches. 2023 Fifth International Conference on Electrical, Computer and Communication Technologies (ICECCT). pg. 1–6, 2023, https://doi.org/10.1109/ICECCT56650.2023.10179854. [↩]
- K. N. Neeraja, T. Prabhakara Rao, P. Janardhana Rao, P. B. V. Raja Rao, G. J. Moses, A. Lakshmanarao. A robust anomaly detection framework utilizing feature engineering and ensemble techniques with BETH data. 2024 International Conference on Intelligent Systems for Cybersecurity (ISCS), 2024. [↩]
- E. Alatawi, U. Albalawi. Harnessing AI for cyber defense: honeypot-driven intrusion detection systems. Symmetry. Vol. 17, pg. 628, 2025, https://doi.org/10.3390/sym17050628. [↩]
- E. Eremin. Unsupervised anomaly detection on cybersecurity data streams: a case with BETH dataset. International Journal of Open Information Technologies. Vol. 13, pg. 107–113, 2025, https://arxiv.org/abs/2503.04178. [↩]
- C. Sánchez-Zas, X. Larriva-Novo, V. A. Villagrá, M. S. Rodrigo, J. I. Moreno. Design and evaluation of unsupervised machine learning models for anomaly detection in streaming cybersecurity logs. Mathematics. Vol. 10, pg. 4043, 2022, https://doi.org/10.3390/math10214043. [↩]
- E. Aghaei, G. Serpen. Host-based anomaly detection using Eigentraces feature extraction and one-class classification on system call trace data. Journal of Information Assurance and Security. Vol. 14, pg. 106–117, 2019, https://arxiv.org/abs/1911.11284. [↩]
- K. Z. Bai, J. M. Fossaceca. EM-AUC: a novel algorithm for evaluating anomaly based network intrusion detection systems. Sensors. Vol. 25, pg. 78, 2025, https://doi.org/10.3390/s25010078. [↩]
- J.-I. Iturbe-Araya, H. Rifà-Pous. Hyperparameter optimization and evaluation metrics for unsupervised anomaly-based cyberattack detection in imbalanced smart home datasets. Journal of Network and Systems Management. Vol. 33, pg. article 99, 2025, https://doi.org/10.1007/s10922-025-09973-6. [↩]
- F. T. Liu, K. M. Ting, Z.-H. Zhou. Isolation forest. Proceedings of the 8th IEEE International Conference on Data Mining (ICDM 2008). pg. 413–422, 2008, https://doi.org/10.1109/ICDM.2008.17. [↩]
- J. B. MacQueen. Some methods for classification and analysis of multivariate observations. Proceedings of the 5th Berkeley Symposium on Mathematical Statistics and Probability. Vol. 1, pg. 281–297, 1967, https://projecteuclid.org/ebooks/berkeley-symposium-on-mathematical-statistics-and-probability/Proceedings-of-the-Fifth-Berkeley-Symposium-on-Mathematical-Statistics-and/chapter/Some-methods-for-classification-and-analysis-of-multivariate-observations/bsmsp/1200512992. [↩] [↩]
- C. M. Bishop. Pattern recognition and machine learning. Springer, 2006. [↩] [↩]
- A. Y. Ng, M. I. Jordan, Y. Weiss. On spectral clustering: analysis and an algorithm. Advances in Neural Information Processing Systems (NIPS). Vol. 14, pg. 849–856, 2002, https://proceedings.neurips.cc/paper_files/paper/2001/file/801272ee79cfde7fa5960571fee36b9b-Paper.pdf. [↩] [↩]
- F. Murtagh, P. Contreras. Algorithms for hierarchical clustering: an overview. Wiley Interdisciplinary Reviews: Data Mining and Knowledge Discovery. Vol. 2, pg. 86–97, 2012, https://doi.org/10.1002/widm.53. [↩] [↩]
- M. Ester, H.-P. Kriegel, J. Sander, X. Xu. A density-based algorithm for discovering clusters in large spatial databases with noise. Proceedings of the 2nd International Conference on Knowledge Discovery and Data Mining (KDD-96). pg. 226–231, 1996, https://dl.acm.org/doi/10.5555/3001460.3001507. [↩]
- D. P. Kingma, M. Welling. Auto-encoding variational Bayes. arXiv, 2013, https://arxiv.org/abs/1312.6114. [↩] [↩]
- W. R. Morningstar, C. Ham, A. G. Gallagher, B. Lakshminarayanan, A. A. Alemi, J. V. Dillon. Density of states estimation for out-of-distribution detection. Proceedings of the 24th International Conference on Artificial Intelligence and Statistics (AISTATS). Vol. 130, pg. 3232–3240, 2021, https://proceedings.mlr.press/v130/morningstar21a.html. [↩]
- T. Saito, M. Rehmsmeier. The precision-recall plot is more informative than the ROC plot when evaluating binary classifiers on imbalanced datasets. PLOS ONE. Vol. 10, pg. e0118432, 2015, https://doi.org/10.1371/journal.pone.0118432. [↩]