
Abstract
In Thailand, the agriculture sector and the fast fashion sector are two crucial aspects of the economy. However, as discarded clothing and by-products from the fashion industry are dumped into landfills, contaminated wastewater creates soil pollution that disturbs crop cultivation. This research explores the impact of clothing waste on farmland and strives for a viable solution that allows the agriculture and garment industries to coexist without stunting the growth of each other. To confirm the impact of clothing waste extract (CWE) on agriculture, the levels of Chemical Oxygen Demand (COD), chlorine, heavy metals and microplastics (MPs) of CWE were measured to determine the biotoxicity of clothing on plant and human lung cells. Not only were chlorine, heavy metals, and microplastics detected in CWE, plant growth and cell viability of human lung cells were decreased by CWE of most clothing. Since oyster shells, oyster mushrooms, and Serratia marcescens, lignin decomposing bacteria, were effective in mitigating some pollutants and improving plant growth, they were mixed with cornstarch and agarose to create a chip-shaped device: the CleanGrower. The rice grown in CleanGrower-applied soil were the healthiest as the soil’s moisture was sustained, mitigating the negative effects of clothing waste and dye contaminants. Additionally, Deep Learning Models which utilized provided data, predicted optimal conditions for the use of the CleanGrower. To conclude, the device, the CleanGrower, developed in this study can be produced conveniently at low costs to eliminate the pollutants generated by the clothing industry in Thailand croplands.
Keywords: Clothing Waste, Fast Fashion, Oyster-Mushrooms, Oyster-Shells, Serratia marcescens
Introduction
The Fashion Industry alone produces an estimated amount of 92 million tons of waste discarded into the atmosphere every year1.Waste occurring at every stage of the garment manufacturing process, causes underground water pollution, air pollution, odor pollution and marine pollution2. Consequently, plants are provided with tainted water for sustenance and are constantly facing unretractable impacts on their viability and human safety as textile waste leaks into farmlands3.
A newly developed subtropical country, Thailand’s economy is heavily dependent on the profit that agriculture and clothing production produce. Specifically, Thailand relies on the 46.6% of land allocated to agricultural production4. However, in efforts to keep up with societal demands and reach new heights of economic prosperity, Thailand has established over 2,600 garment companies in its own country5, allowing the economy to increase at an average rate of 7.7% annually6.
In Thailand, the overconsumption of clothing from the textile industry has led to an alarming increase in textile waste7. which leaves clothing to take up valuable space in landfills, potentially leaking microfibers which in turn contaminate waterways8. In addition to clothing waste and by-products containing heavy metals and various toxic substances, the fast fashion industry is also notoriously known to be a major contributor of microplastics that commonly pervade environments, such as polyester (PET), polyamide (PA), acrylic (PAN), polypropylene (PP), etc.9.
Prior studies have tackled the pollution of toxins in clothing using prawn shells to remove discharged metals in water with: Cu, Cr, Cd, Zn, Ni, As, or Pb; yet, a more eco-friendly alternative must be further researched10. Additionally, alternative approaches of filtering out dyes11 and breaking down clothing waste have emerged: micro mediation, adsorption, and coagulation all serve as methods of eliminating the pollutants in clothing12. Despite the discovery of these tactics, there has not been the creation of a soil-remediation technology specific to combatting pollutants present in textile wastewater. Instead, the technology presented above is utilized to mitigate pollutants in general waste streams such as polluted water. Furthermore, numerous challenges to applying these methods and technology on Thailand’s farmlands still stand as they are expensive to implement and maintain, making it difficult to put into practice on large-scale farms as these solutions are not biodegradable.
In search of a low-cost solution to mitigate clothing waste impact on Thailand’s agricultural farmlands, several biodegradable materials were tested to ensure soil fertility and plant growth. The materials used to create the final bio-device were considered with several standards: efficiency for farmland supply, suitability for Thailand’s humid climate, and the feasibility of the materials to obtain in Thailand.
Wood-decaying mushrooms which have a natural metal remediating ability13 and are found in Thailand’s moist environment were utilized in the final product of the CleanGrower. Additionally, because seashells are abundant in Thailand due to their natural beds14, crab and oyster shells were considered as an additional ingredient. Various types of lignin-decomposing bacteria were also selected with the expectation that, due to their biopolymer-decomposing abilities15,16 they could decompose synthetic polymers, specifically clothing textiles as biopolymers and polymers are chemically similar in their basic composition. The materials selected for the CleanGrower are all biodegradable, and can be locally sourced, making it a widely applicable and efficient device to be implemented in Thailand’s abundant farmlands.
Therefore, this study aimed to develop a low-cost, eco- friendly device that can remove textile pollution in agriculture and ensure the safety of crops and humans by integrating the effective bio-materials mentioned above into a single final device.
Materials and Methods
Preparation of Dye Solutions, Clothing Waste Extracts, and Their Water Quality Test
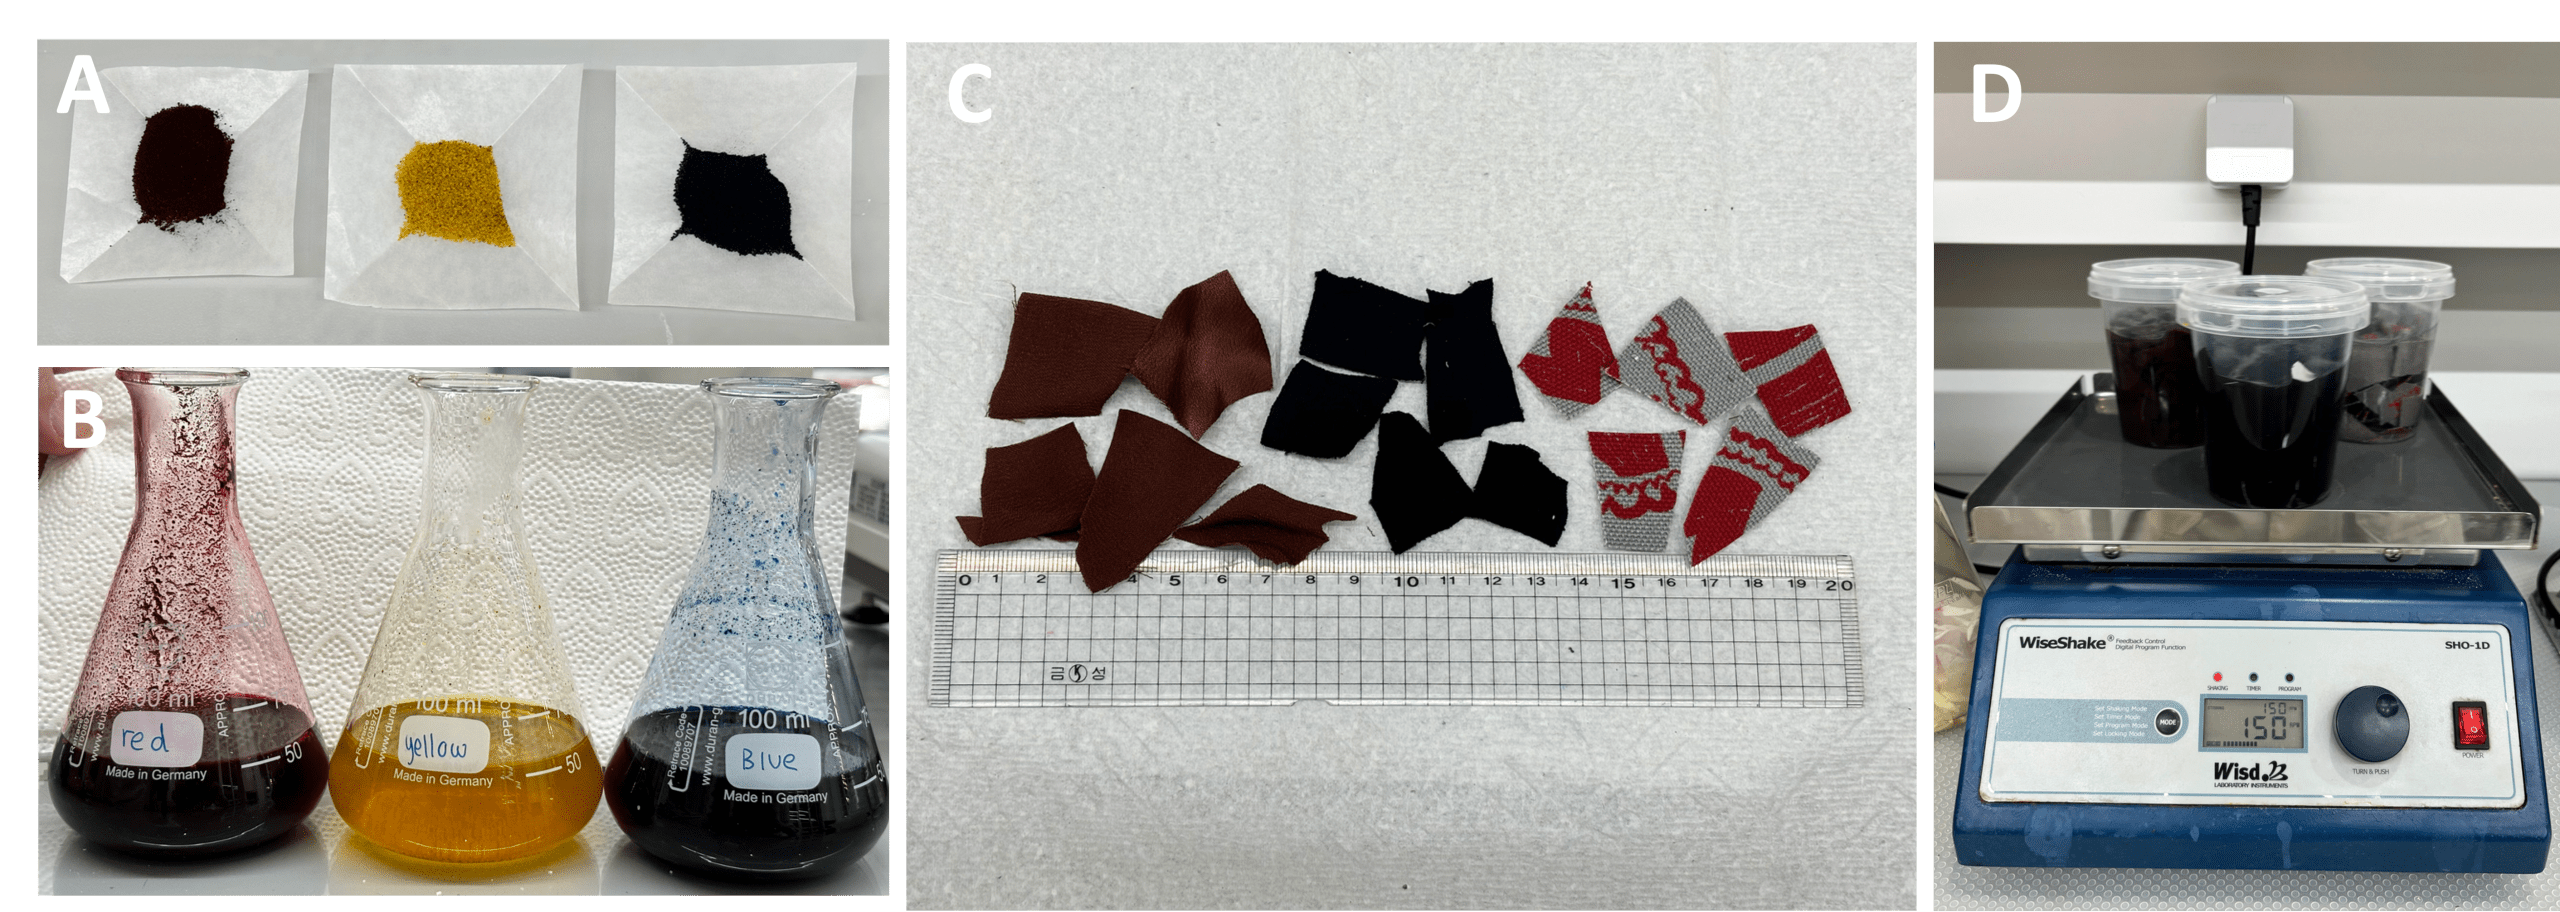
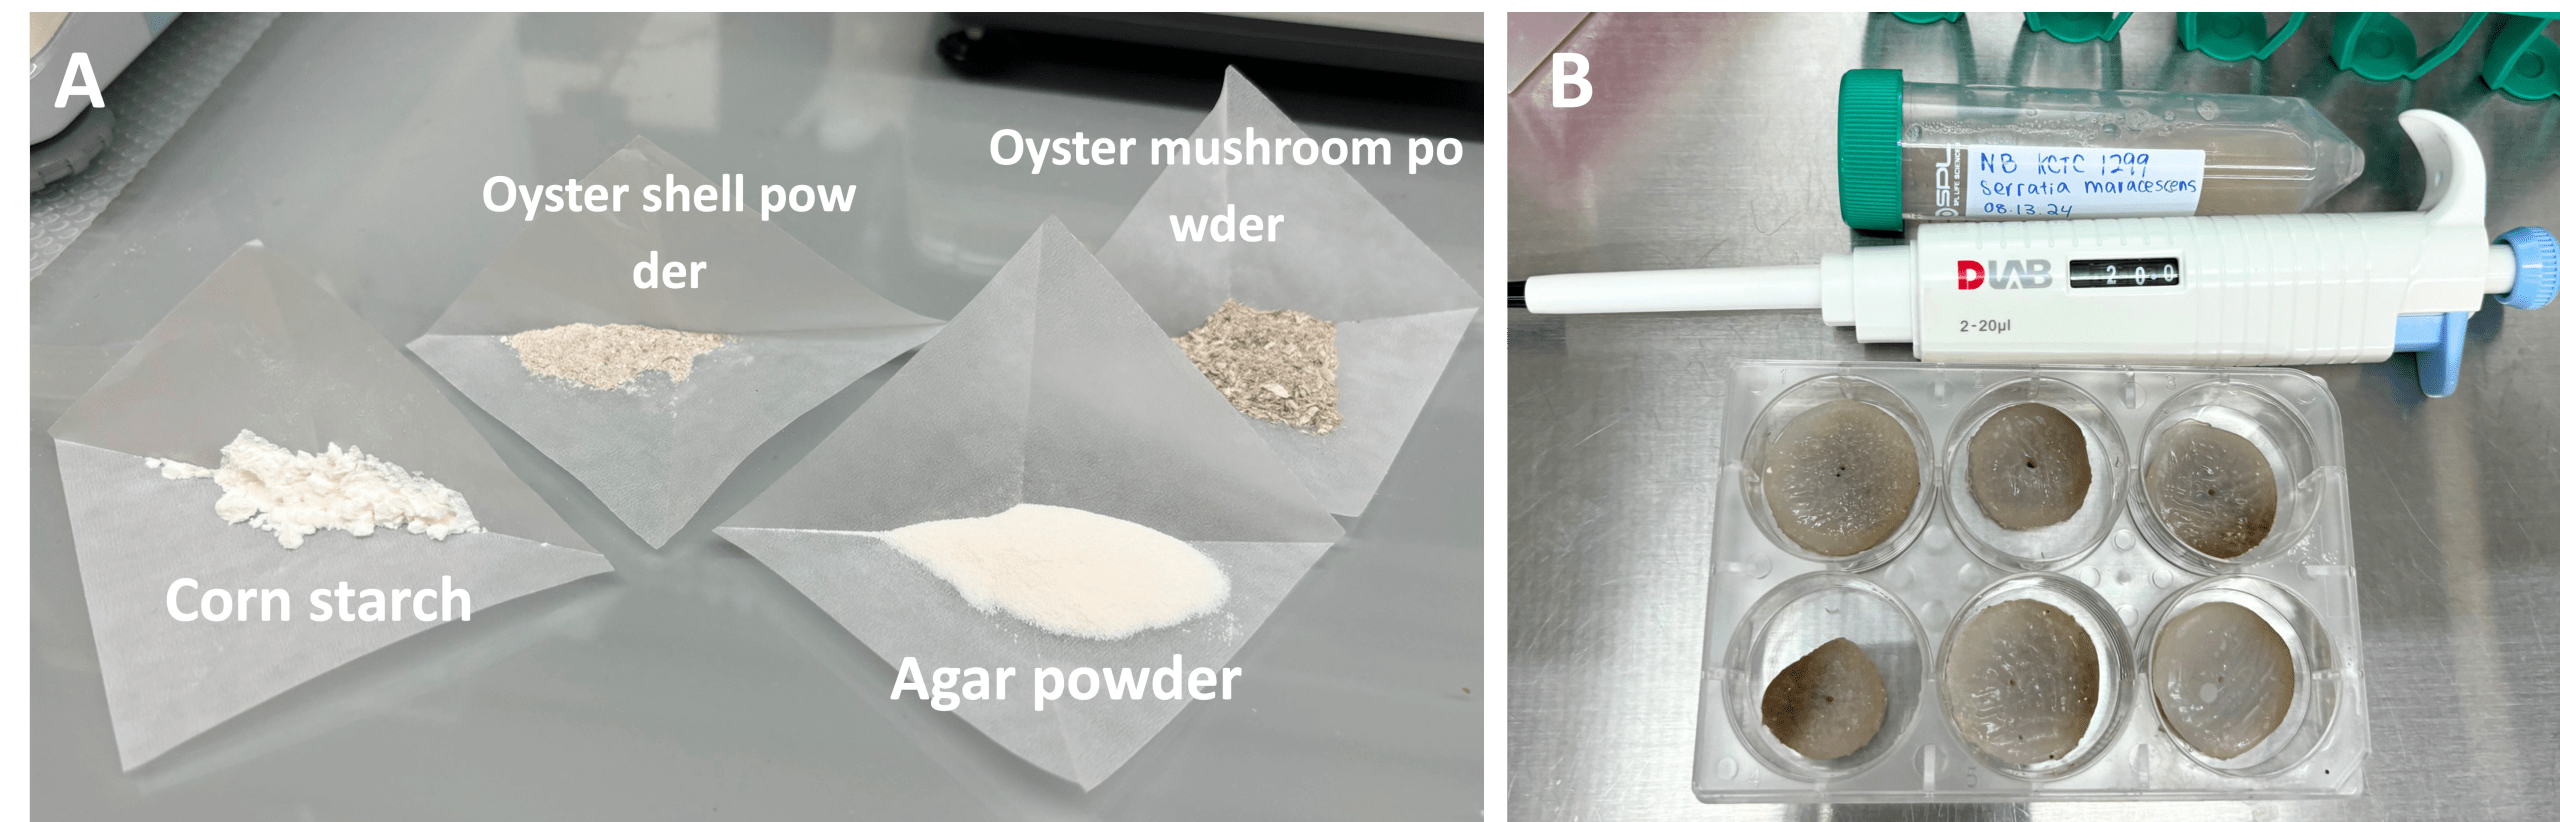
To prepare the dye solutions, 3 g of red, yellow, or blue Rit Dye powder was mixed with 100 mL of 3% (w/v) NaCl solution and stirred on a magnetic stirrer until completely dissolved (Fig. 1A–B). To prepare the clothing waste extract (CWE), 20 g of small pieces from a brown blouse, gray-red backpack, or navy gym shorts was placed into separate plastic containers containing 500 mL of DW (Fig. 1C–D). All containers were shaken at 150 rpm for 1 week to extract soluble compounds (Fig. 1D).
Each dye solution and CWE was centrifuged at 1,200 rpm for 3 min to collect the supernatants. Supernatants were then analyzed for chemical oxygen demand (COD), heavy metal content, chlorine concentration, and pH using the corresponding test kits.
Environmental Impact of Clothing Dye and CWEs
Cabbage Growth in Dye Contaminated Soil
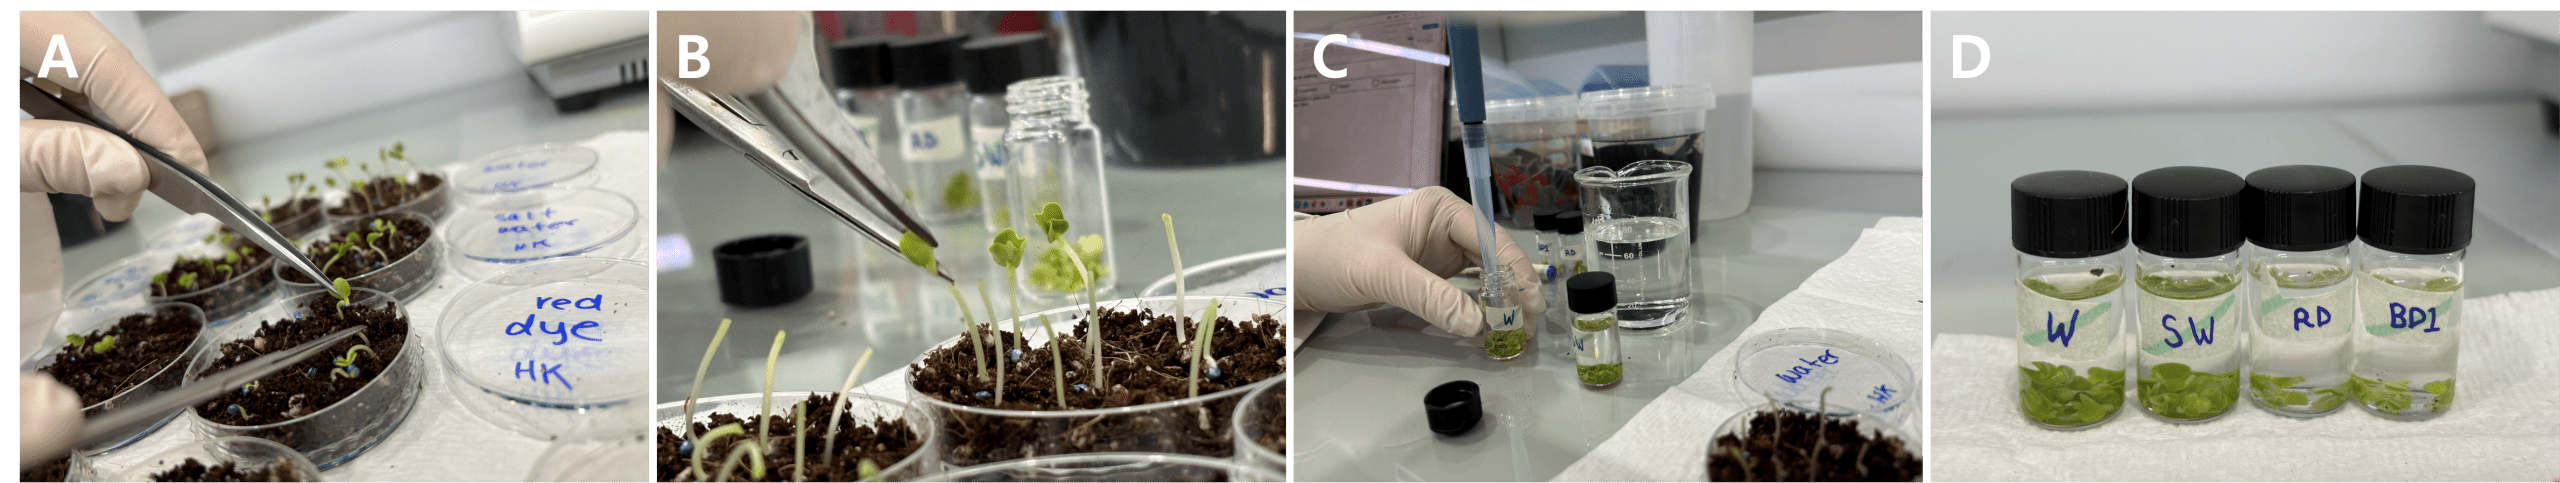
Among 10 Petri dishes containing potting soil, 2 dishes received 1 mL of DW, 6 dishes received 1 mL of each red, yellow, or blue solution, and 2 dishes received 1 mL of 3% salt solution. The dishes were covered and incubated for 24 h to allow complete absorption. Nine cabbage seeds were then planted in each dish and incubated for 1 week for germination. The sprout heads were harvested and transferred to individual glass tubes containing 4 mL of 70% ethanol (Fig. 2).
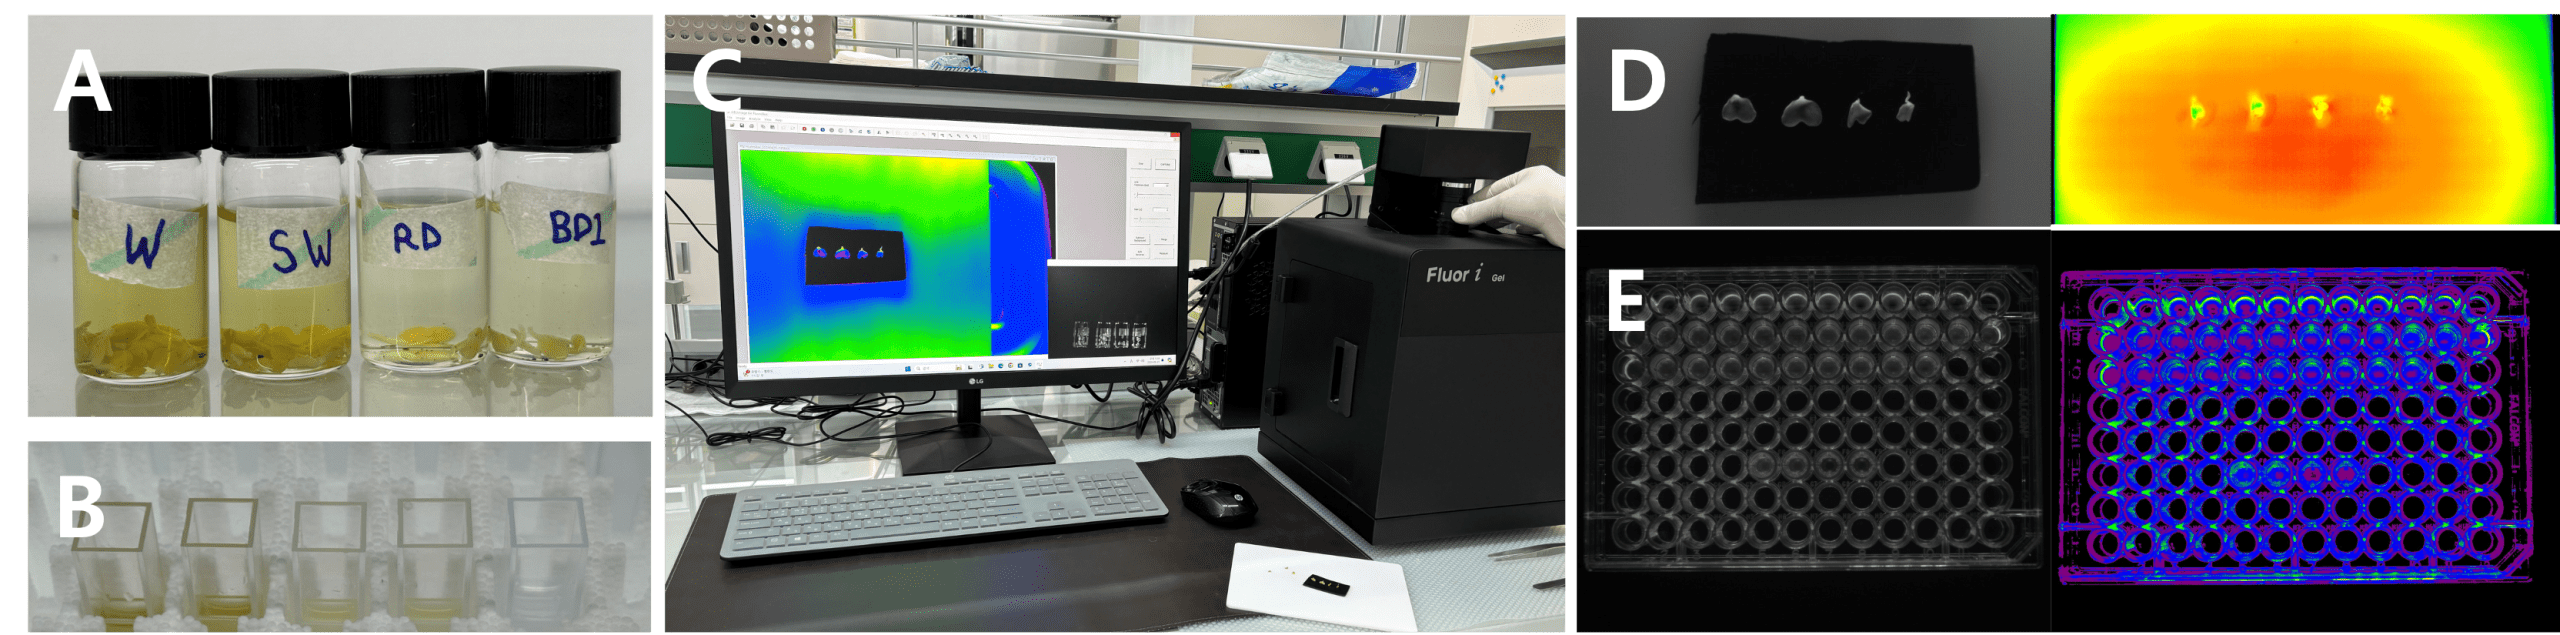
After 2 days, chlorophyll was analyzed using three methods: spectrophotometric measurement, fluorescence imaging of sprout leaves, and fluorescence imaging of chlorophyll extracts. Chlorophyll a and b contents were determined by measuring absorbance at 663 nm and 645 nm, respectively. For fluorescence imaging of sprout leaves, a Gel Doc (Fluor I Gel, Korea) was used to visualize chlorophyll fluorescence (Fig. 3C–D). For fluorescence imaging of chlorophyll extracts, 200 μL of each extract was added into a 96-well plate and imaged using the Gel Doc.
Viability of Lung Cells Exposed to CWE
A549, a human lung cancer cell line, was purchased in freeze-dried form from Korean Cell Line Bank (KCLB). After thawing and subculturing, the cell suspension was seeded into 96-well plates and incubated at 37°C, 5% CO2 for 48 hours (Fig. 4). Dulbecco’s Modified Eagle Medium (DMEM) supplemented with 10% fetal bovine serum (FBS) and 1× penicillin/streptomycin was used as the culture medium. Cell-grown wells were assigned to the following treatment groups: no treatment, DW, brown CWE, navy CWE, and gray-red CWE. Cells exposed to CWE were incubated for 48 hours before analysis. Cells are cultured in media. No treatment was used as a control group to serve the basis for the experimentation when no treatment is given to the cells. Furthermore, CWE is created from clothing pollutants extracted into DW. Thus, DW was used as a control group to confirm that the activity of the lung cells exposed to CWE was due to the clothing pollutants itself, not the DW it was mixed with.
To confirm the cell viability, the old medium was taken out of the 96-well plate and 100 μL of 10% Cell Counting Kit-8 (CCK-8) solution was added to each well. After 30 min of incubation, the absorbance of each well was measured at 450 nm using a microplate reader.

Microplastic Presence in CWE
To measure MPs of CWE, Nile red dye was used to stain MPs in the CWE. Each CWE (1 mL) was mixed with 10 μL of Nile red dye for 5 min and measured at 600 nm using a visible spectrophotometer (Optizen 1412V, Korea). In addition, 10 μL of the stained solution was placed on a glass slide, covered with a coverslip, and observed under a biological microscope to detect MPs.
To simulate soil contaminated with clothing-derived MPs, orange fluorescent microplastics (FMPs) and styrene-acrylonitrile (SAN) MPs were used. 10 μL of the orange FMP stock solution was diluted with 1 mL of DW (Fig. 5), and 1.5g of SAN MPs was mixed with 10 mL of DW.
7 mL of DW, SAN suspension, FMP suspension, or brown CWE was added to each Petri dish containing potting soil. Agarose gel (1.5%, 20 mL) was prepared by microwave heating and poured into separate 300 mL plastic cups. The MPs- or CWE-treated soil dishes were covered with the plastic cups containing solidified agarose gel at the bottom and incubated for 48 h to allow aerosolization into the surrounding environment. After 48 hours, each agarose gel was cut out and placed on Petri dishes. Gels exposed to FMP-treated soil were imaged using a fluorescence microscope, whereas gels exposed to SAN MP– or brown CWE–treated soil were stained with Nile red and observed under a biological microscope.

Heavy Metal Accumulation in Plants Grown in CWE-Contaminated Soil
Among 16 Petri dishes filled with soil, 3 mL of DW, brown CWE, navy CWE, or gray-red CWE was added to 4 Petri dishes per treatment. 2 corn seeds were planted in each of 8 Petri dishes, and 6 rice seeds were planted in each of the remaining 8 dishes. After 12 days, 0.1g of corn sprout leaves grown in each sample was put into a 15 mL conical tube containing 3 mL of DW and 10 beads. The tissue was homogenized using a vortex mixer to release plant extracts, and the heavy metal content of the extract was then measured.
Selection of Remediation Materials for CWE-Contaminated Soil
MPs-Decomposing Effect of Lignin-Decomposing Bacteria and Biotoxicity Test
Brown clothing pieces (0.1 g per flask) were placed into five 100 mL Erlenmeyer flasks containing 20 mL of nutrient broth (NB) and sterilized by autoclaving. The lignin-degrading bacteria of bio-safety level 1 including, (Pseudomonas stutzeri (NB KCTC 12166), Brucella endophytica (NB KCTC 42485), or Serratia marcescens (NB KCTC 1299)) were inoculated into the clothing-containing medium at an initial absorbance of 0.001. A no-treatment control and an Escherichia coli–inoculated control were also prepared. After 2 days of incubation at room temperature, the clothing pieces were observed using an inverted microscope. After 1 month, 10 μL of each culture was loaded into a hemocytometer to quantify microplastic particles released from the clothing.
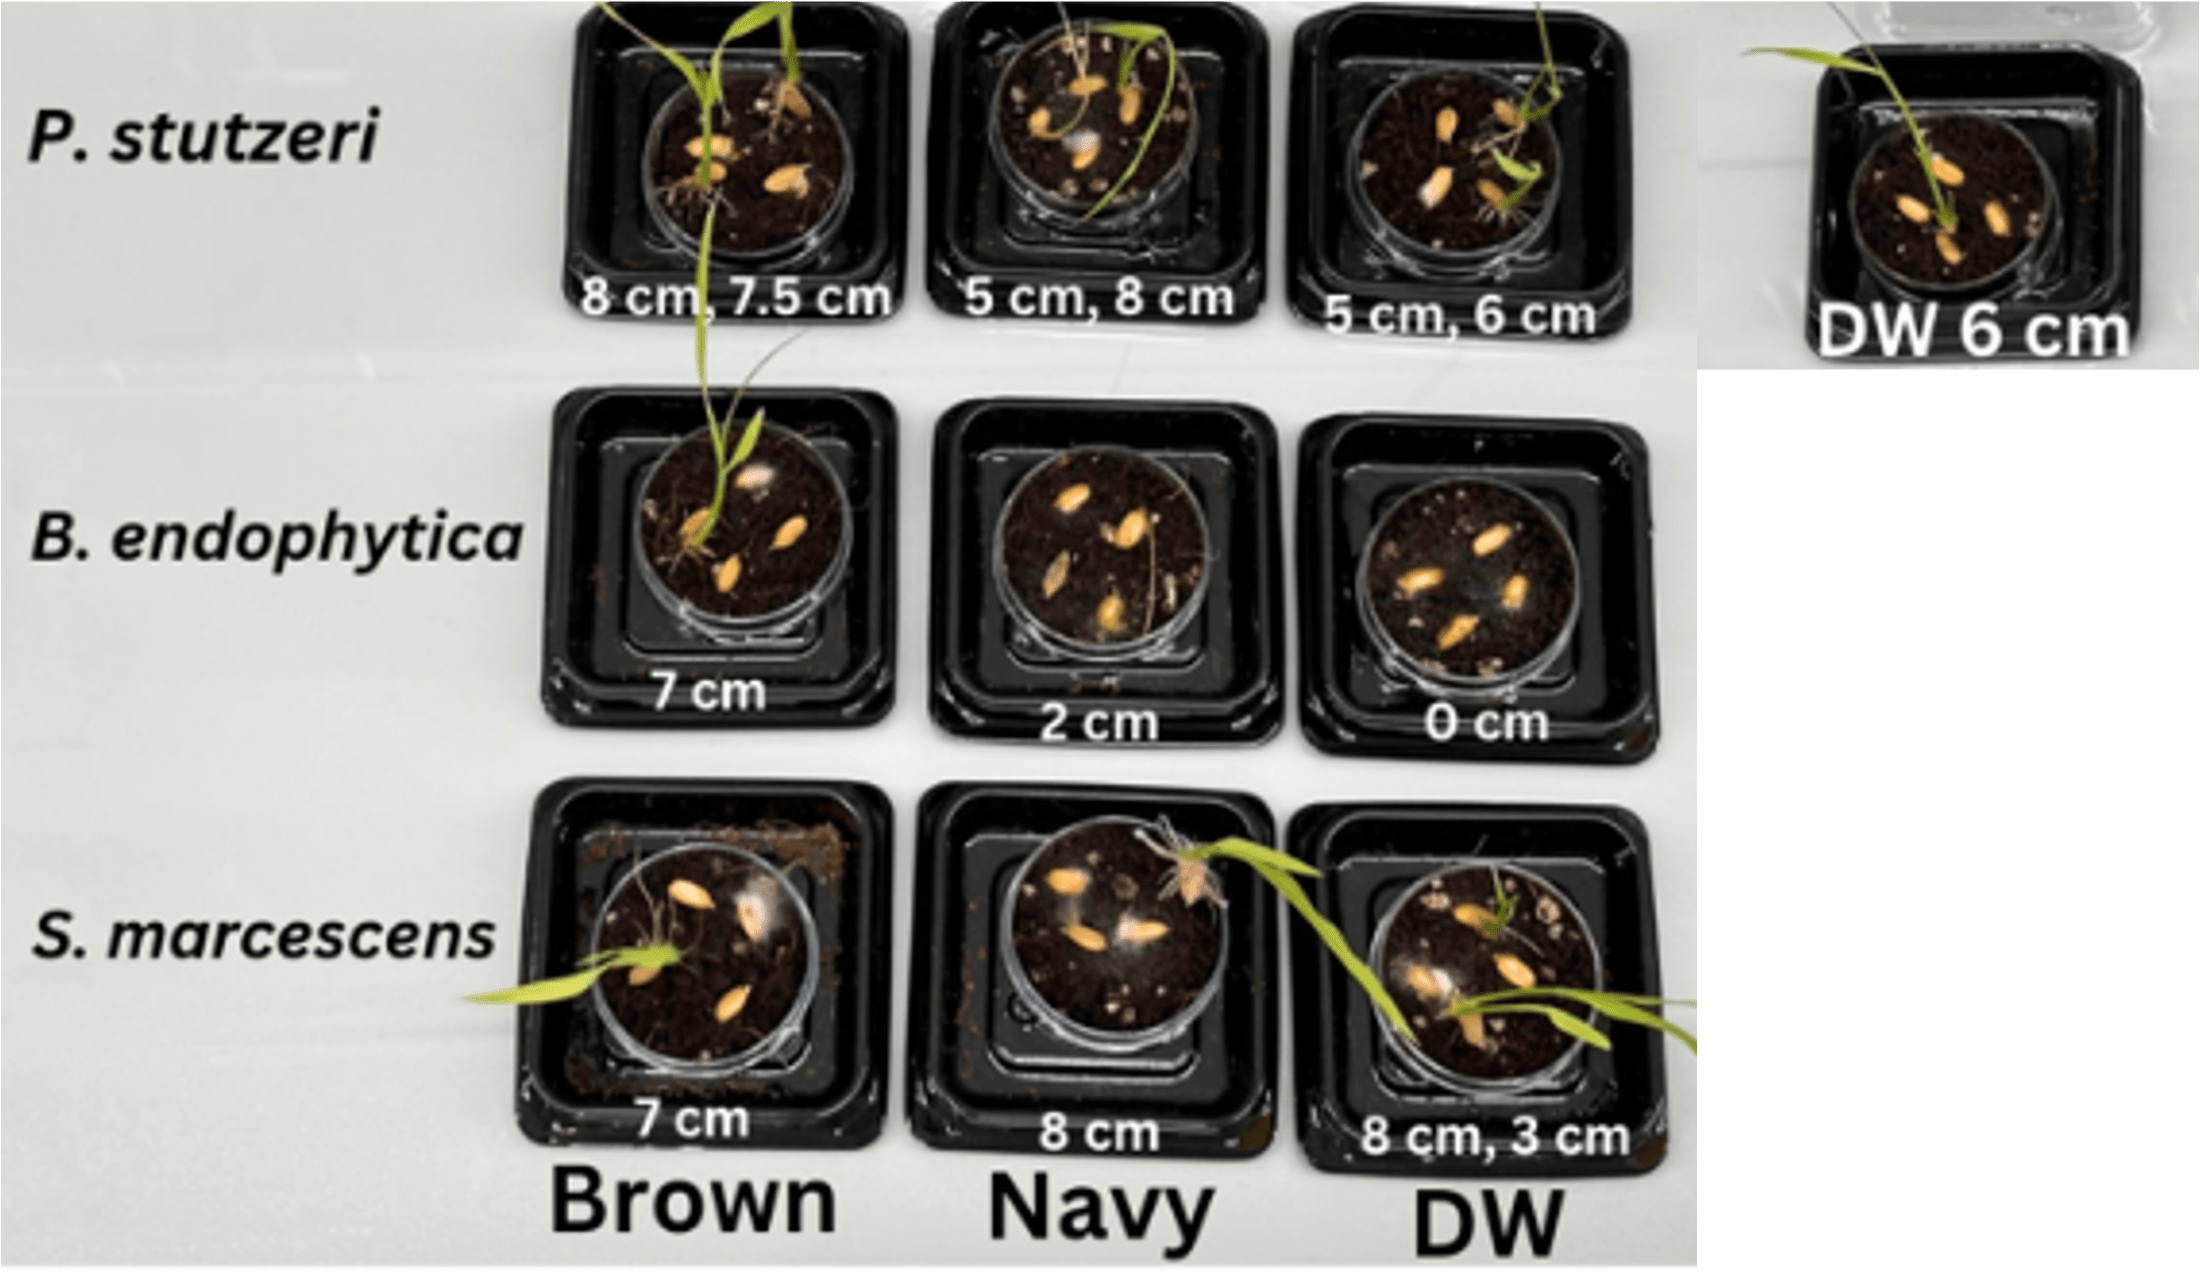
To evaluate the environmental toxicity of the lignin-degrading bacteria, P. stutzeri, B. endophytica, or S. marcescens (OD = 0.001) was inoculated into 4 mL of DW, brown CWE, or navy CWE, respectively. The resulting nine bacterial suspensions were each added (4 mL) to soil in Petri dishes. One additional soil dish received 4 mL of DW as a control. Four rice seeds were planted in each dish, and plant growth was assessed after 1 month.
Adsorption of CWE Pollutants by Shell Powder and Mushrooms
1 mL of brown CWE (1 mL) and DW (4 mL) were added to three 15 mL conical tubes. 0.05 g of crab shell powder or oyster shell powder was added to two tubes, and all tubes were shaken on a shaker at 46 rpm for 2 days. Then, each sample solution was centrifuged at 1,200 rpm for 3 minutes, and the supernatants were measured by COD, heavy metal, and chlorine contents. Each sample solution was stained with Nile red for MP observation.
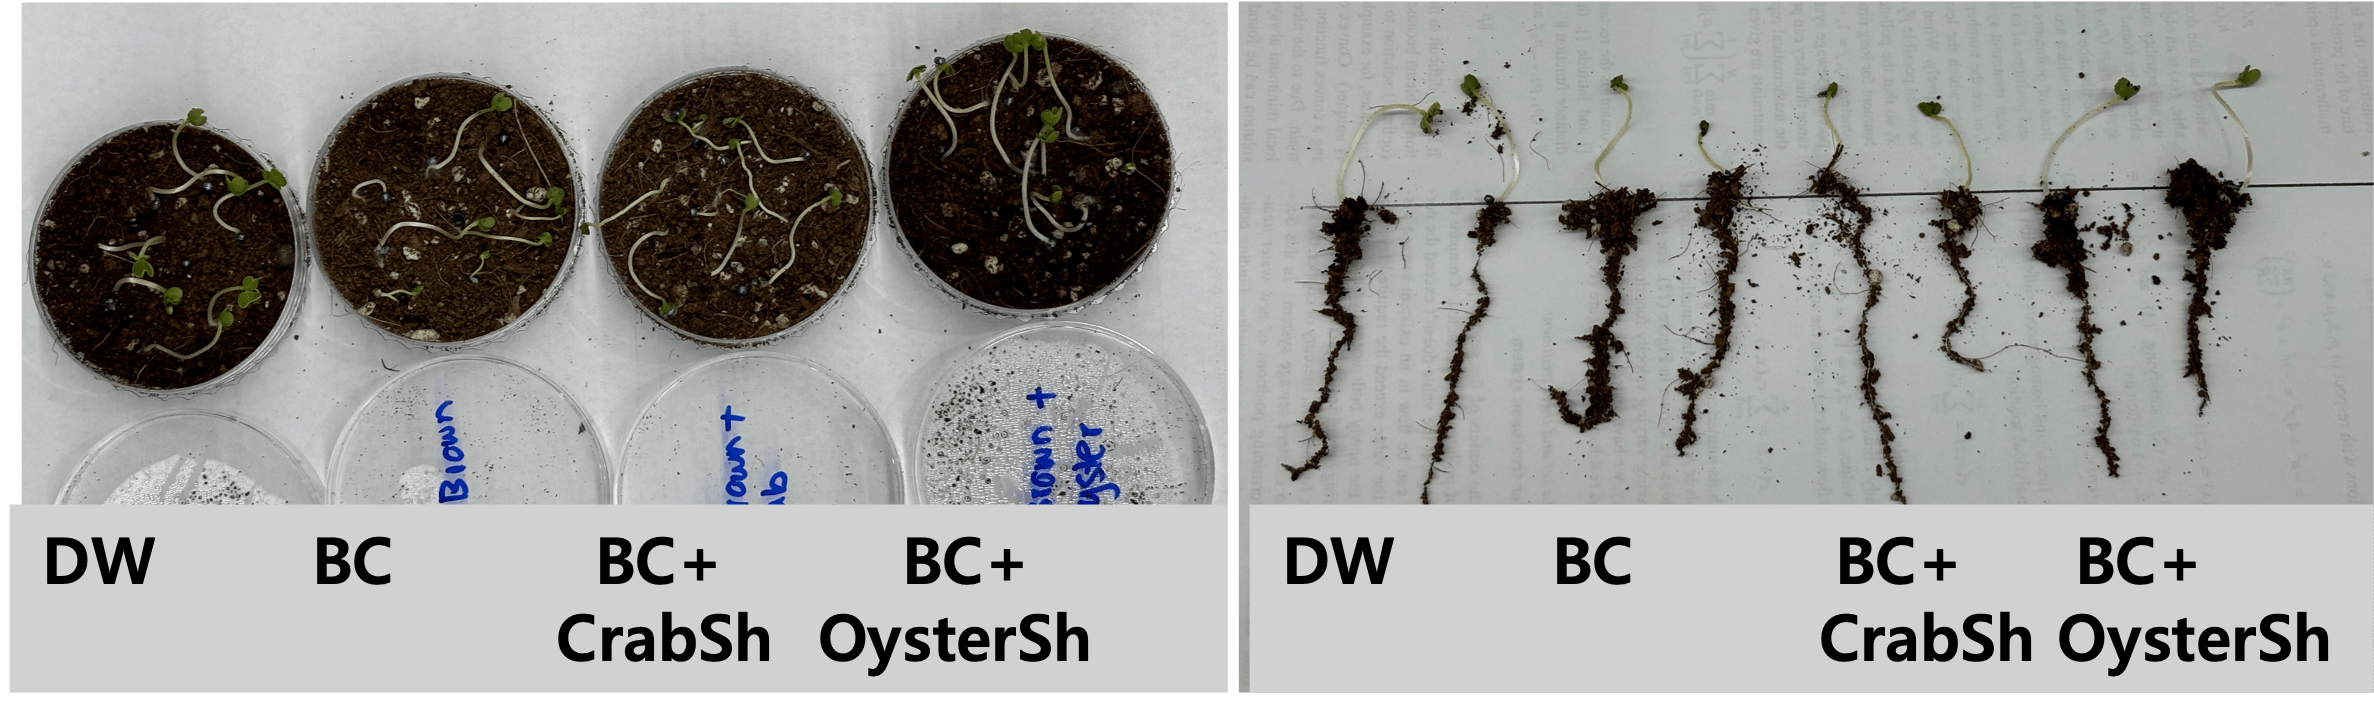
To evaluate the effect of shell powder on CWE-exposed plants, 1 mL of DW, brown CWE, brown CWE + crab shell powder, and brown CWE + oyster shell powder was added to soil-filled Petri dishes. Each dish then received 2 mL of DW, and cabbage seeds were planted to assess growth.
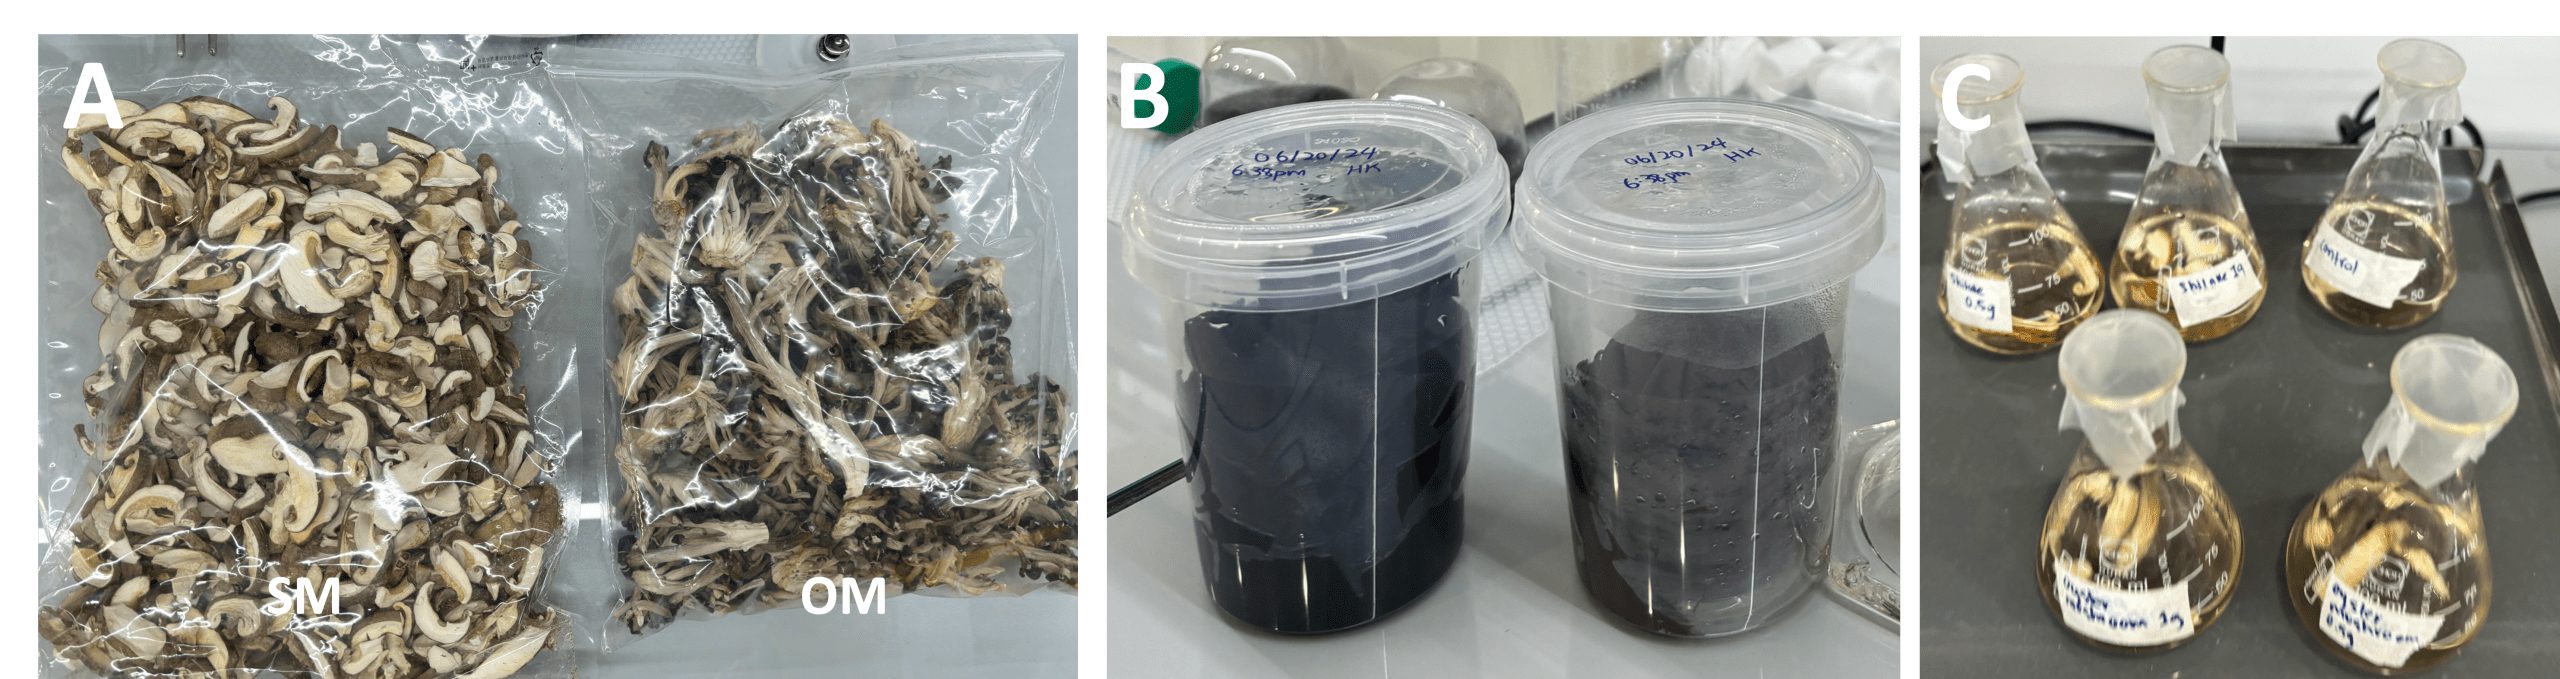
In addition, either 0.5 g or 1 g of dried oyster mushrooms or shiitake mushrooms was added to 100 mL flasks containing 50 mL of a brown and navy CWE mixture (Fig. 6A–B). One flask without mushrooms served as a control. All five flasks were shaken for 2 days (Fig. 6C), and heavy metal concentrations were measured at 30 min and on Day 2.
Soil Remediation Agent, CleanGrower
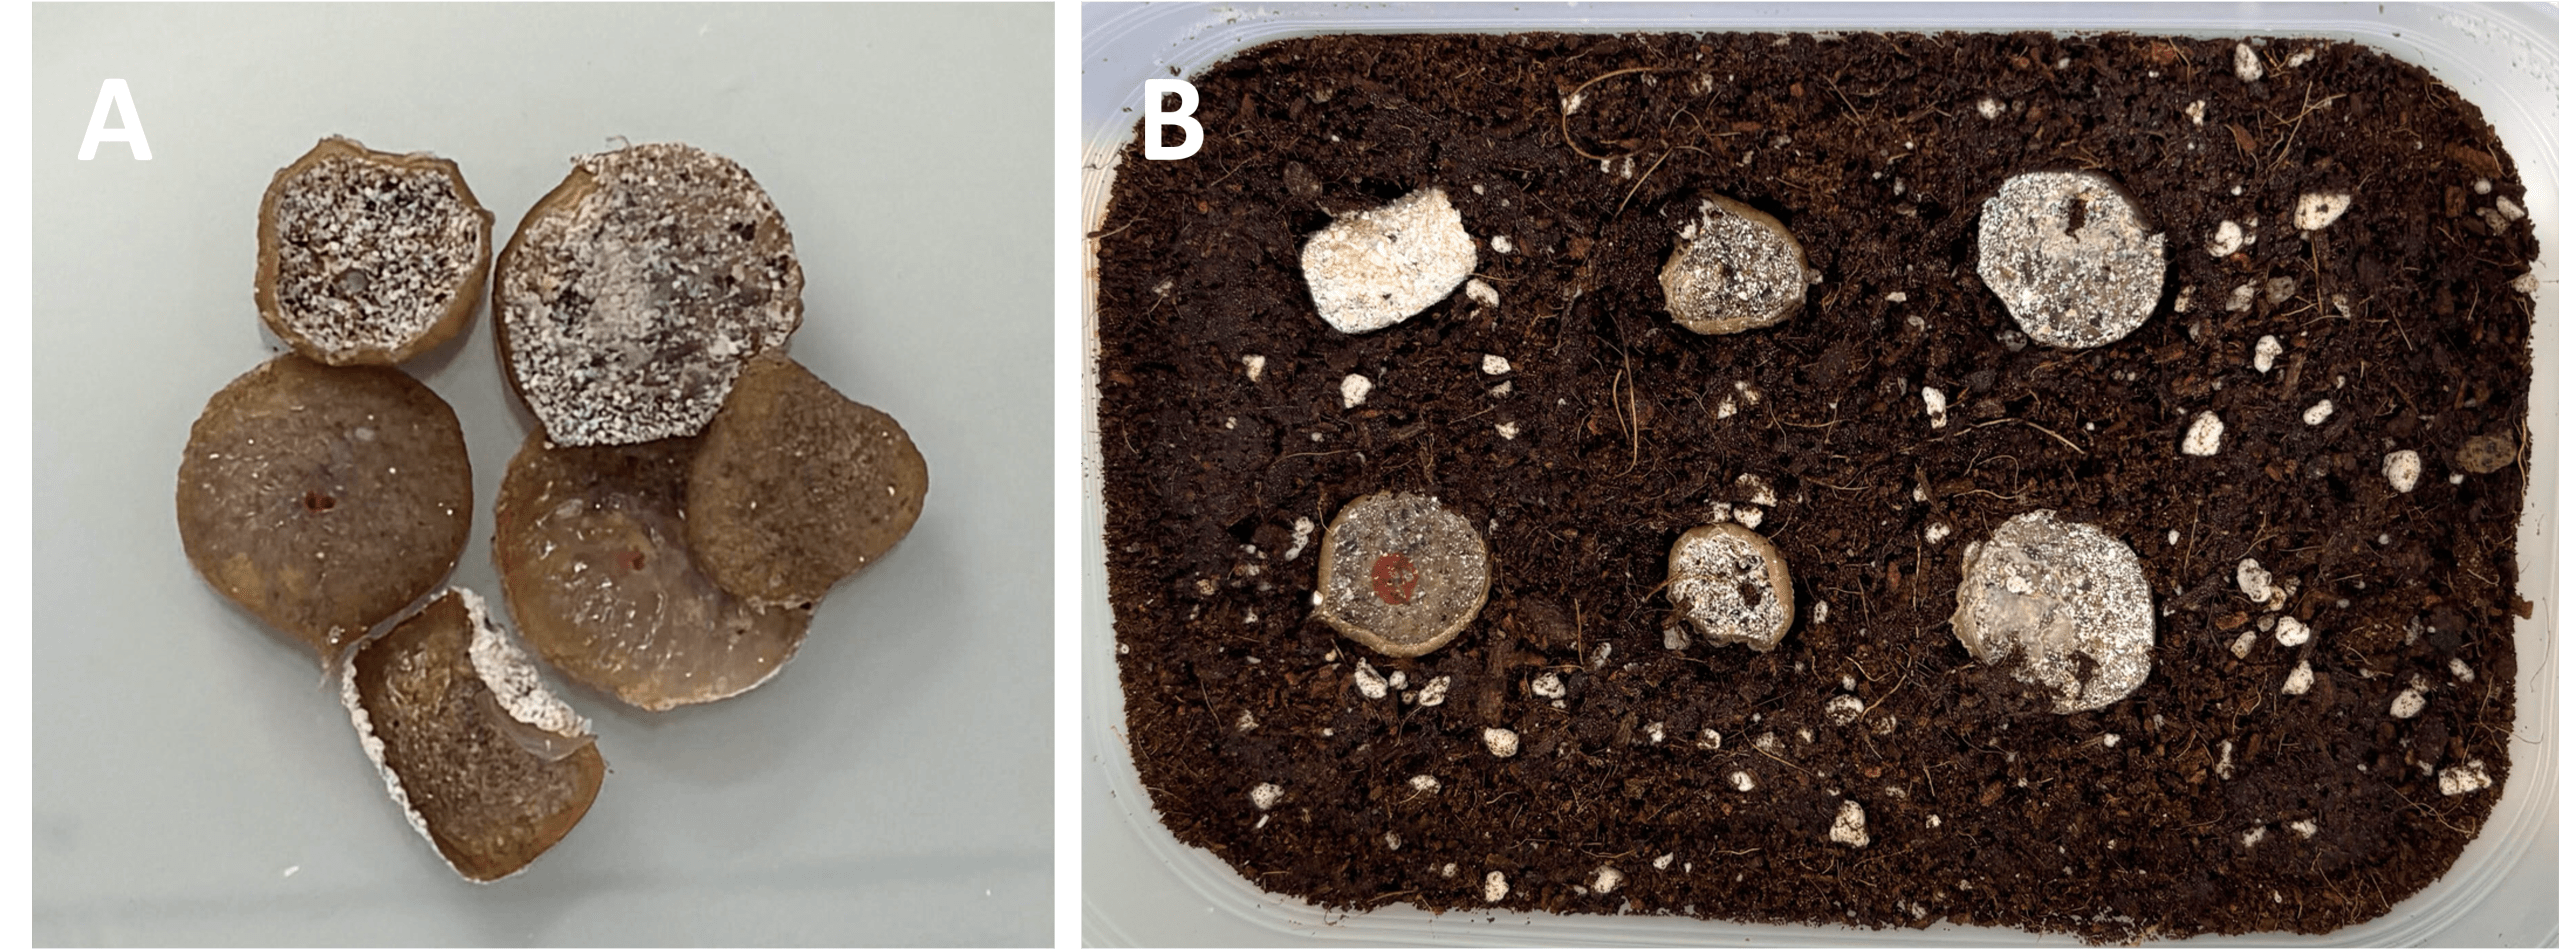
To fabricate CleanGrower, 0.5 g of cornstarch, 1.5 g of agarose powder, 0.5 g of oyster shell powder, and 0.5 g of ground oyster mushroom were mixed with 100 mL of DW (Fig. 7A), boiled in a microwave, and poured into a 6-well plate. The plate was left in a fume hood for 1 day, and a hole was created in the center of each CleanGrower using a sterilized yellow tip. Then, 20 μL of S. marcescens suspension was added to each hole (Fig. 7B). The CleanGrowers were put back into the fume hood and dried for an additional day until a plastic-like texture was obtained.
To evaluate the remediation effect of CleanGrower on CWE-exposed plants, Gray-red, navy, and brown CWE were combined to prepare 300 mL of mixed extract, to which 1 mL each of red, yellow, and blue Rit dye solutions was added. 20 mL of this CWE mixture was added to two soil containers each filled with 110g of soil, and 6 CleanGrowers were planted into one of the two containers. As a control, 20 mL of DW was added to the third container. After 20 hours, rice seeds were planted in all containers.
Prediction of CleanGrower Utilization through Deep Learning Models
The CleanGrower which was only tested on crop growth in lab conditions, utilized deep learning models to predict how it would aid the growth of plants in real life situations with diverse environmental factors. To confirm the predicted effects of the CleanGrower on crops, a dataset was tailored for machine learning to analyze the plant growth and soil bacteria of cabbage and rice seeds as displayed in Table 1. In total, there were 5 groups of datasets, each dataset containing 10 cups filled with 10 cabbage seeds. In each of the datasets, 20 cabbage seeds represented the amount of CWE present either with or without the addition of the CleanGrower as presented in Table 1.
Soil bacteria was assessed with an absorbance test on day 2 and day 4, seed germination was observed on day 4, 5, 6, and plant length was measured on day 6. Statistical tests and conducted training and evaluation of a regression model based on a multilayer perceptron (MLP) was utilized to clarify the impact of the CleanGrower under various criteria. For the deep learning model evaluation, the dataset was divided into training and testing using a 5-fold cross validation approach.
| CleanGrower (+) | CleanGrower (-) | |
| CWE (mL) | 0, 5, 10, 15, 20 | 0, 5, 10, 15, 20 |
| Temperature (°C) | 4, 20, 24, 30, 37 | 4, 20, 24, 30, 37 |
MLP Model and Evaluation
The MLP was trained using the Adam optimization algorithm, with a learning rate of 0.001, and early stopping was employed to avoid overfitting during training. Table 2 shows the MLP model’s structure.
To evaluate the performance of the MLP, multiple statistical metrics were applied. Mean Squared Error (MSE), Mean Absolute Error (MAE), Root Mean Square Error (RMSE), and R-Squared (R²). R² values close to 1 indicated strong predictive power.
| Layer | Type | Output Shape | Parameters |
| 1 | Linear-1 | (–1, 32) | 608 |
| 2 | LeakyReLU-2 | (–1, 32) | 0 |
| 3 | Dropout-3 | (–1, 32) | 0 |
| 4 | Linear-4 | (–1, 128) | 4,224 |
| 5 | LeakyReLU-5 | (–1, 128) | 0 |
| 6 | Dropout-6 | (–1, 128) | 0 |
| 7 | Linear-7 | (–1, 32) | 4,128 |
| 8 | LeakyReLU-8 | (–1, 32) | 0 |
| 9 | Linear-9 | (–1, 1) | 33 |
Total parameters 8,993
Trainable parameters 8,993
Non-trainable parameters 0
Results
Quality of Clothing Polluted Wastewater
The quality of CWE- or dye-contaminated water samples is shown in Table 3.
Chlorine is present during the production of clothing and produces a severe threat to the environment due to its instability and reactivity with other chemicals. If chlorine is released from disposed clothing waste, it can spread into the environment through air and waterways. Consequently, the presence of chlorine in a plant’s environment can negatively impair mechanistic pathways through the promotion of salinity stress, and direct toxic accumulation. To assess the amount of chlorine in different CWE and dyes, tests were conducted. Chlorine was not detected in most of the CWE and dye solutions, but 0.1 ppm was detected in the navy CWE. It indicates that there is still a possibility of chlorine being released into the environment from disposed clothing.
Even if chlorine was not detected in most CWE or dye solutions, a wide variety of chemicals are still present in the solutions, which can pose a threat to the ecosystem1. To assess the overall level of pollution, COD levels were analyzed. All different CWE were contaminated to a certain degree; the brown CWE contained the highest amount of oxygen needed, indicating that the brown CWE contains the most contaminants. However, the dye solution had lower COD levels compared to that of CWE. Meaning that, the finished garment contains more and different chemicals than the dye alone.
Heavy metals are present during textile production, which leads to an increase in COD and biological oxygen demand (BOD)2. The increase of COD and BOD levels in a plant’s environment impedes its mechanistic pathway as it induces stress, reduces growth, and disrupts physiological functions. Among the various samples, the navy CWE contained the highest concentration of heavy metals at 50 ppb. The remaining CWE and dye solutions had 20 ppb, except for the brown CWE, which contained 10 ppb. The pH was measured in the Rit dye solutions. All dye solutions, including the control group of 3% saltwater, had a pH of 6.5.
| Chlorine | COD | Heavy metals | pH | |
| Pollutant | ppm | mg/L | ppb | |
| DW | 0 | 1 | 10 | – |
| Salt sol. | 0 | 4 | 10 | 6.5 |
| BC | 0 | 20 | 10 | – |
| NC | 0.1 | 10 | 50 | – |
| GRC | 0 | 15 | 20 | – |
| YD | 0 | 2 | 20 | 6.5 |
| RD | 0 | 1 | 20 | 6.5 |
| BD | 0 | 4 | 20 | 6.5 |
Impact of Clothing Polluted Wastewater on Plant and Human cells
Negative Effect of Dye Solution on Plant Growth
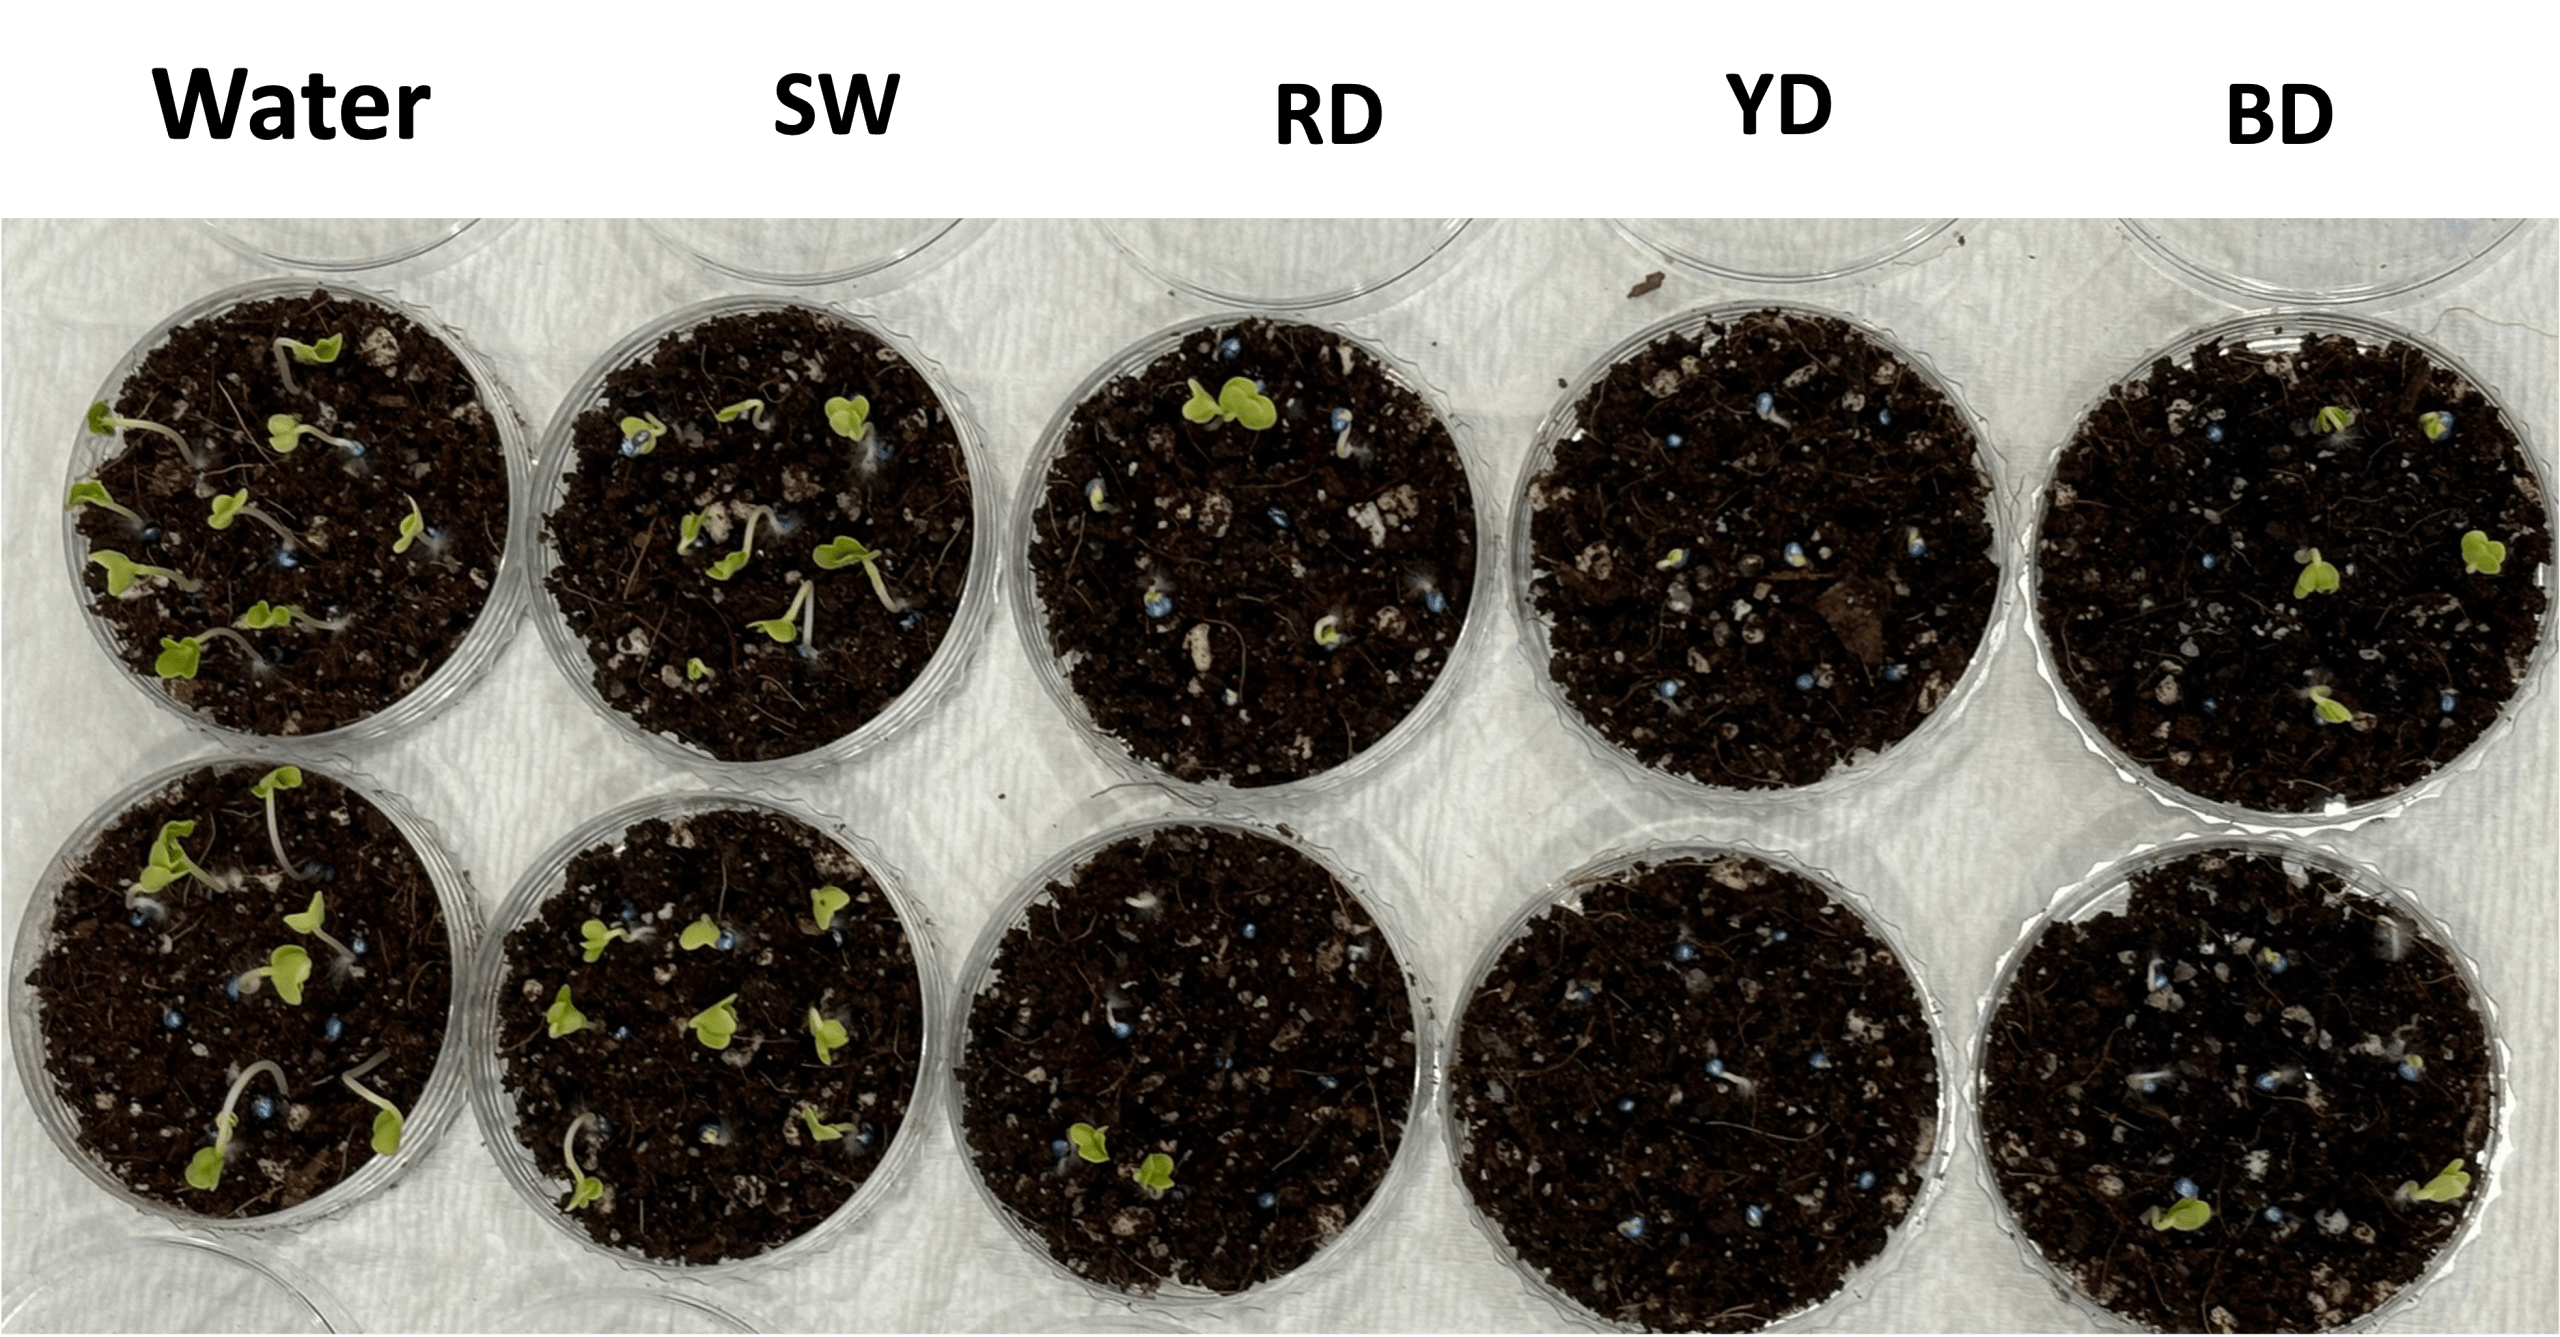
Multiple colors of Rit dye were tested for chlorine, heavy metals, pH, and COD, but all results indicated low levels of contaminants in the Rit Dye. However, it does not indicate that there were no bio-toxic pollutants in the dye solution. Cabbage seeds were planted in Rit Dye-contaminated soil to see the impact of the dye on plant growth. While cabbage seeds germinated in salt water added soil, little germination was observed in most dye-contaminated soils (Fig. 8).
Measurement of the lengths of the germinated cabbage sprouts revealed that they grew slightly less in salt water compared to the control group (1.36 and 1.39 cm vs. 0.59 and 0.84 cm). Since salt water was used in the dye production, this test was to determine whether the reduced growth of the plants was due to salinity. However, the sprouts contaminated with the dye solution were stunted even more, with lengths ranging from 0.50 to 0.67 cm (Table 4). Indicating that, the low growth of the sprouts in dye-contaminated soil was due to toxic components from the Rit Dye. Furthermore, the stunted plant growth can be attributed to the fact that Rit Dye acts as a phytotoxic stressor that inhibits development, and interferes with vital biological processes.
| Sprout + Pollutant | Height (cm) |
| Water 1, 2 | 1.36, 1.39 |
| Salt Water 1, 2 | 0.59, 0.84 |
| Red Dye 1, 2 | 0.50, 0.58 |
| Yellow Dye 1, 2 | 0.50, 0.50 |
| Blue Dye 1, 2 | 0.67, 0.50 |
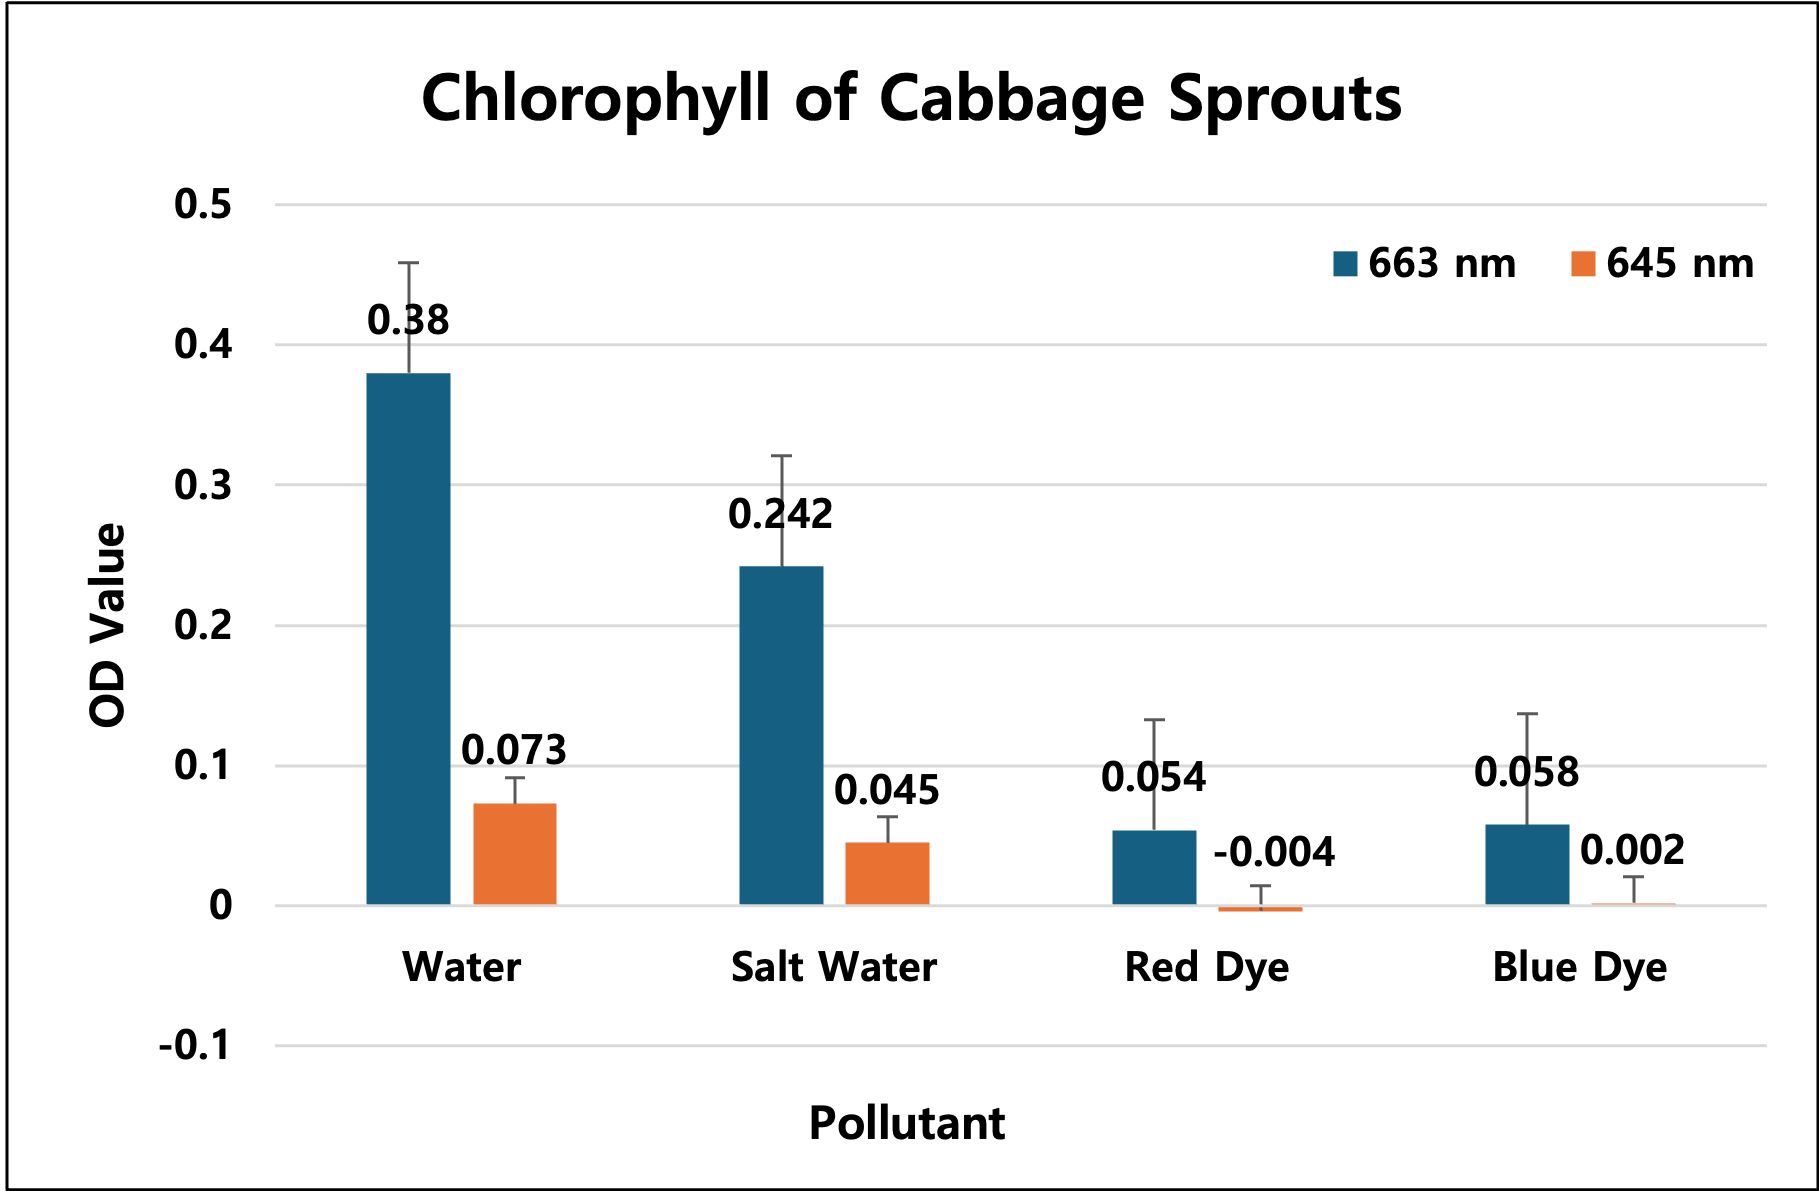
Higher chlorophyll content in plant leaves leads to improved photosynthetic function, making chlorophyll analysis essential for understanding a plant’s functional capacity17. Although the length of sprouts in the saltwater sample was not significantly longer than in the dye solution sample, the chlorophyll content was much higher in the saltwater sample (Fig. 9). These results indicate that the toxic substances present in dyes negatively impact plant function.
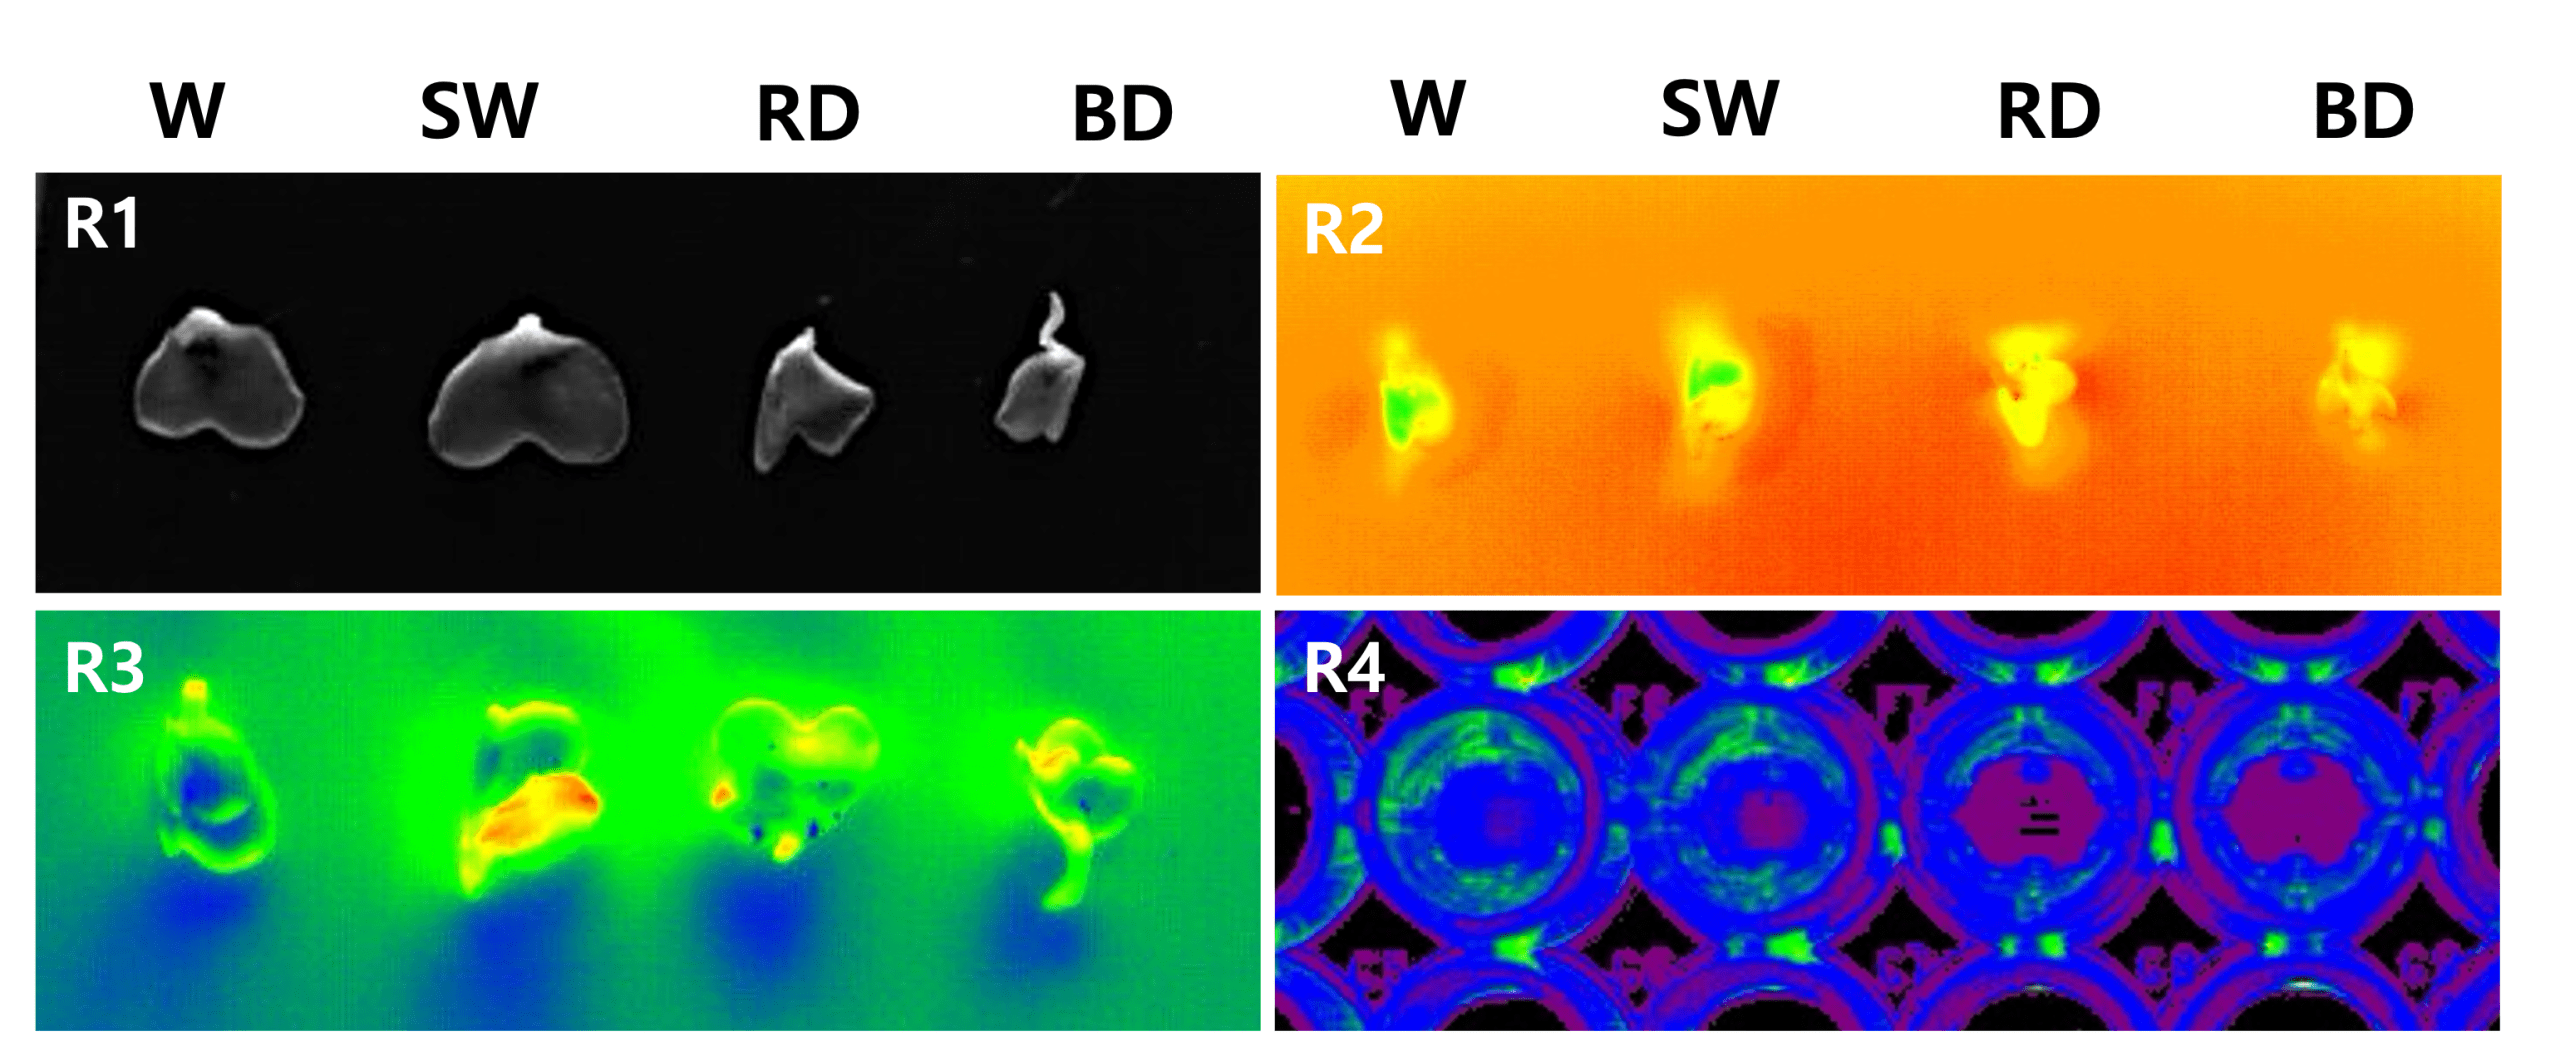
To visually assess plant function, chlorophyll was extracted from cabbage leaves. The chlorophyll was then placed in Gel-Doc and observed under LED and UV light. R1 in Fig. 10 shows the leaf morphology of different samples under general LED light, revealing that the leaves of the RD and BD samples appear shriveled. R2 and R3 present photos of the leaves taken under UV light in reverse and non-reverse states. The colors emitted from the W and SW samples differ significantly from those of the RD and BD samples. This phenomenon was also observed in the chlorophyll extract captured under UV light. Overall, these results indicate that the RD and BD samples exhibit lower plant function.
Negative Effect of CWE on Lung Cell Viability
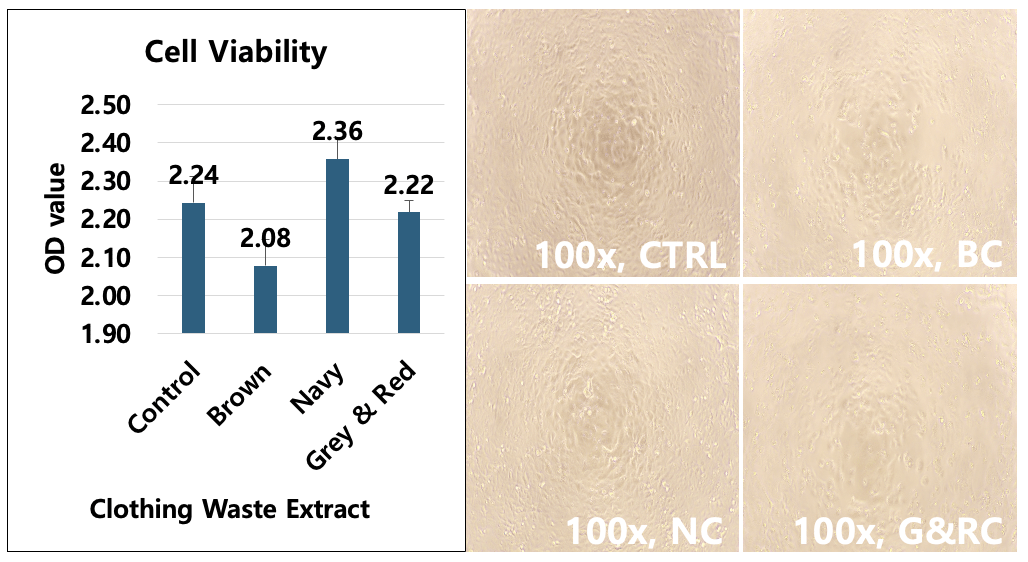
CWE contains many contaminants as tested above and shown in Table 3. If these contaminants enter the human lungs through the respiratory tract, they endanger human health18. The viability of human lung cells cultured with navy CWE was higher than that of the control group which was set as the standard, except for the brown clothing waste group (Fig. 11-left). The cell morphology in the brown CWE group showed reduced proliferation (Fig. 11-right). The result exemplifies that the brown CWE, which has the highest COD, hindered the growth of lung cells.
MPs Presence in CWE
This experiment was conducted to measure the amount of MPs present in CWE. Since synthetic clothing is primarily made from the same raw materials as plastics, microfibers released from worn fabrics pose a threat to the environment and humans, similar to MPs19. After dyeing each CWE with Nile Red, which stains plastics, and measuring the absorbance at 600 nm, microplastics were detected in all groups, with the highest concentration found in the brown CWE at 0.133 (Fig. 12-Left). This indicates the presence of MPs at a concentration of 0.133 x 10⁹/mL. Fig. 12-right shows the dyed MPs observed under a microscope in each sample. The control (DW) contained no MPs, while all other types of CWE resulted in the presence of at least small amounts of MPs. Therefore, no matter the type of clothing, there will always be presence of MPs that can harm the environment. Furthermore, the presence of MPs in the soil decreases soil health as it reduces its water-holding capacity, consequently inhibiting plant root growth.

Evaporation of MPs from Soil
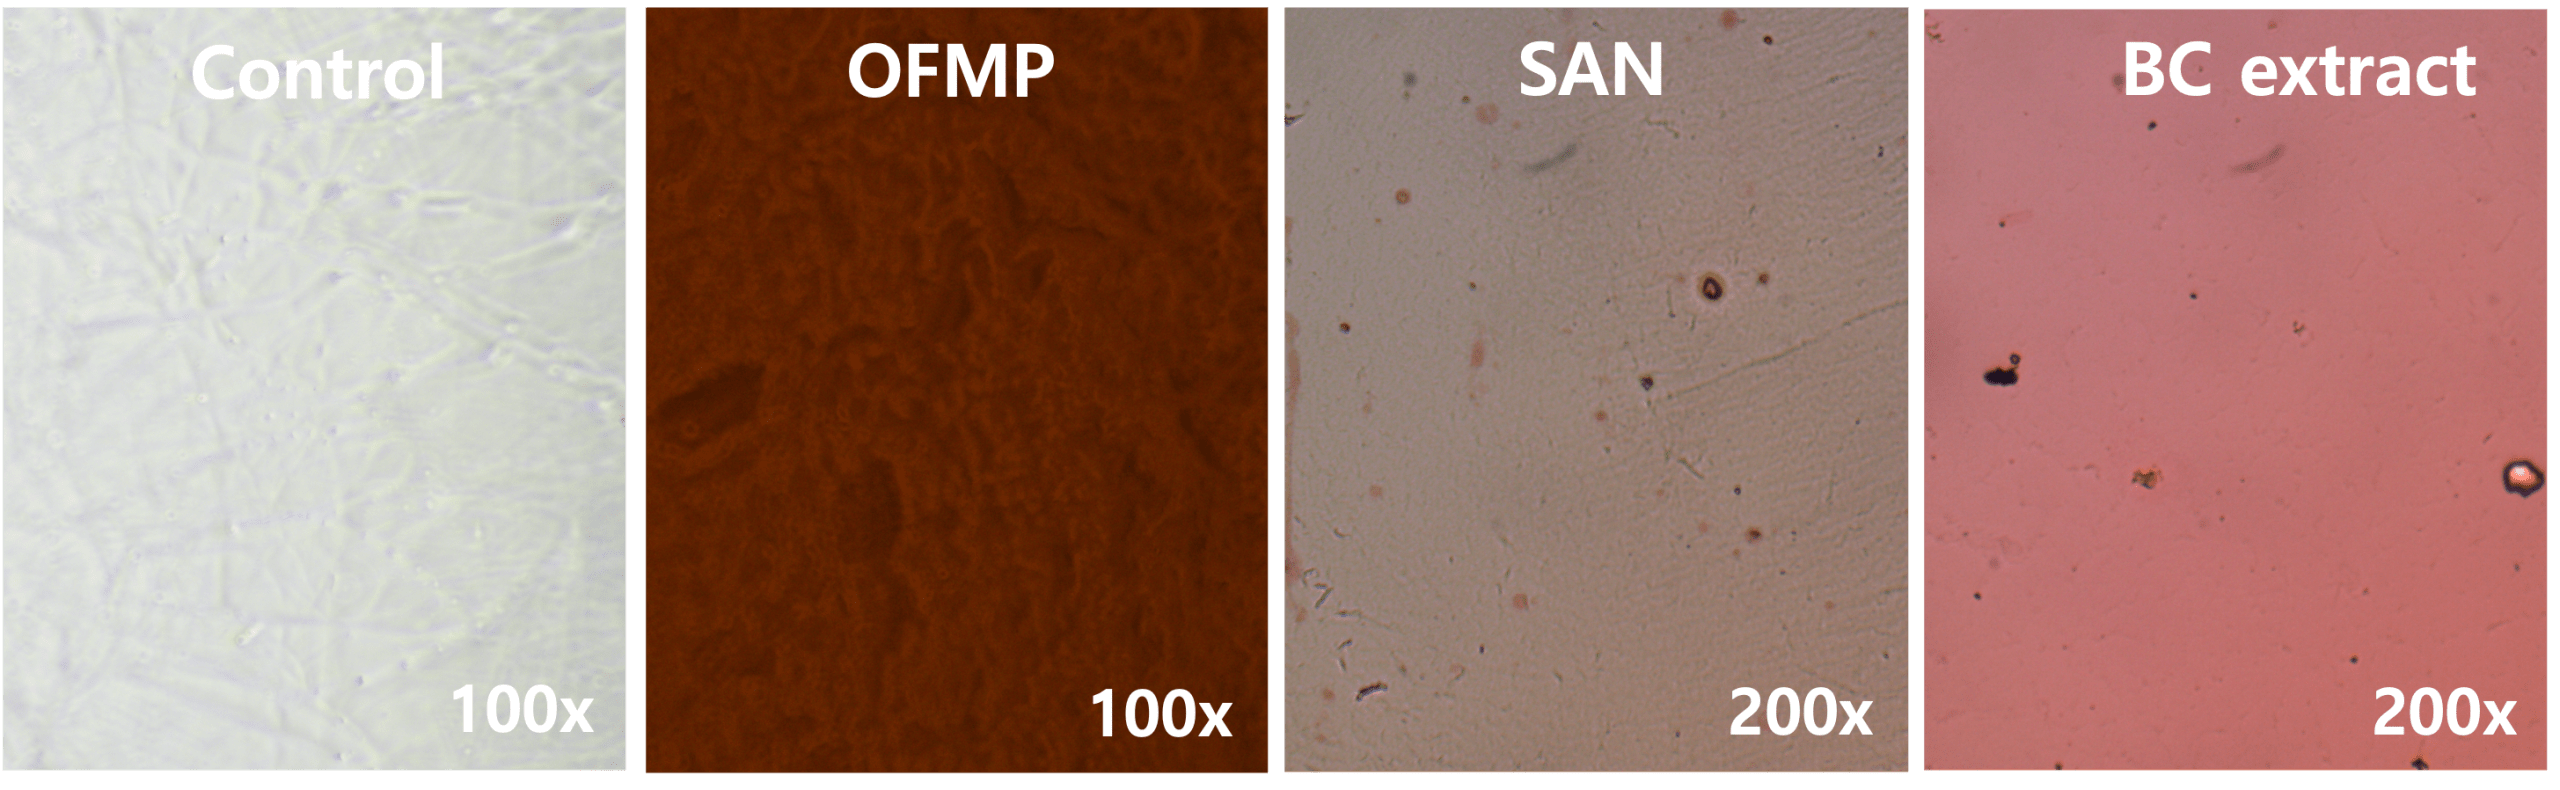
If MPs evaporate with water vapor from contaminated soil, they may enter the body through the respiratory tract. In this experiment, various types of MPs were introduced into the soil. The release of MPs from the soil was confirmed through the analysis of agarose gel placed above the soil, which absorbs the evaporated vapor. Water vapor evaporating from soil contaminated with FMPs, SAN, or brown CWE contained high amounts of MPs. No matter the type of MPs, their evaporation was evident (Fig. 13).
Heavy Metal Accumulation in Plants Exposed to CWE
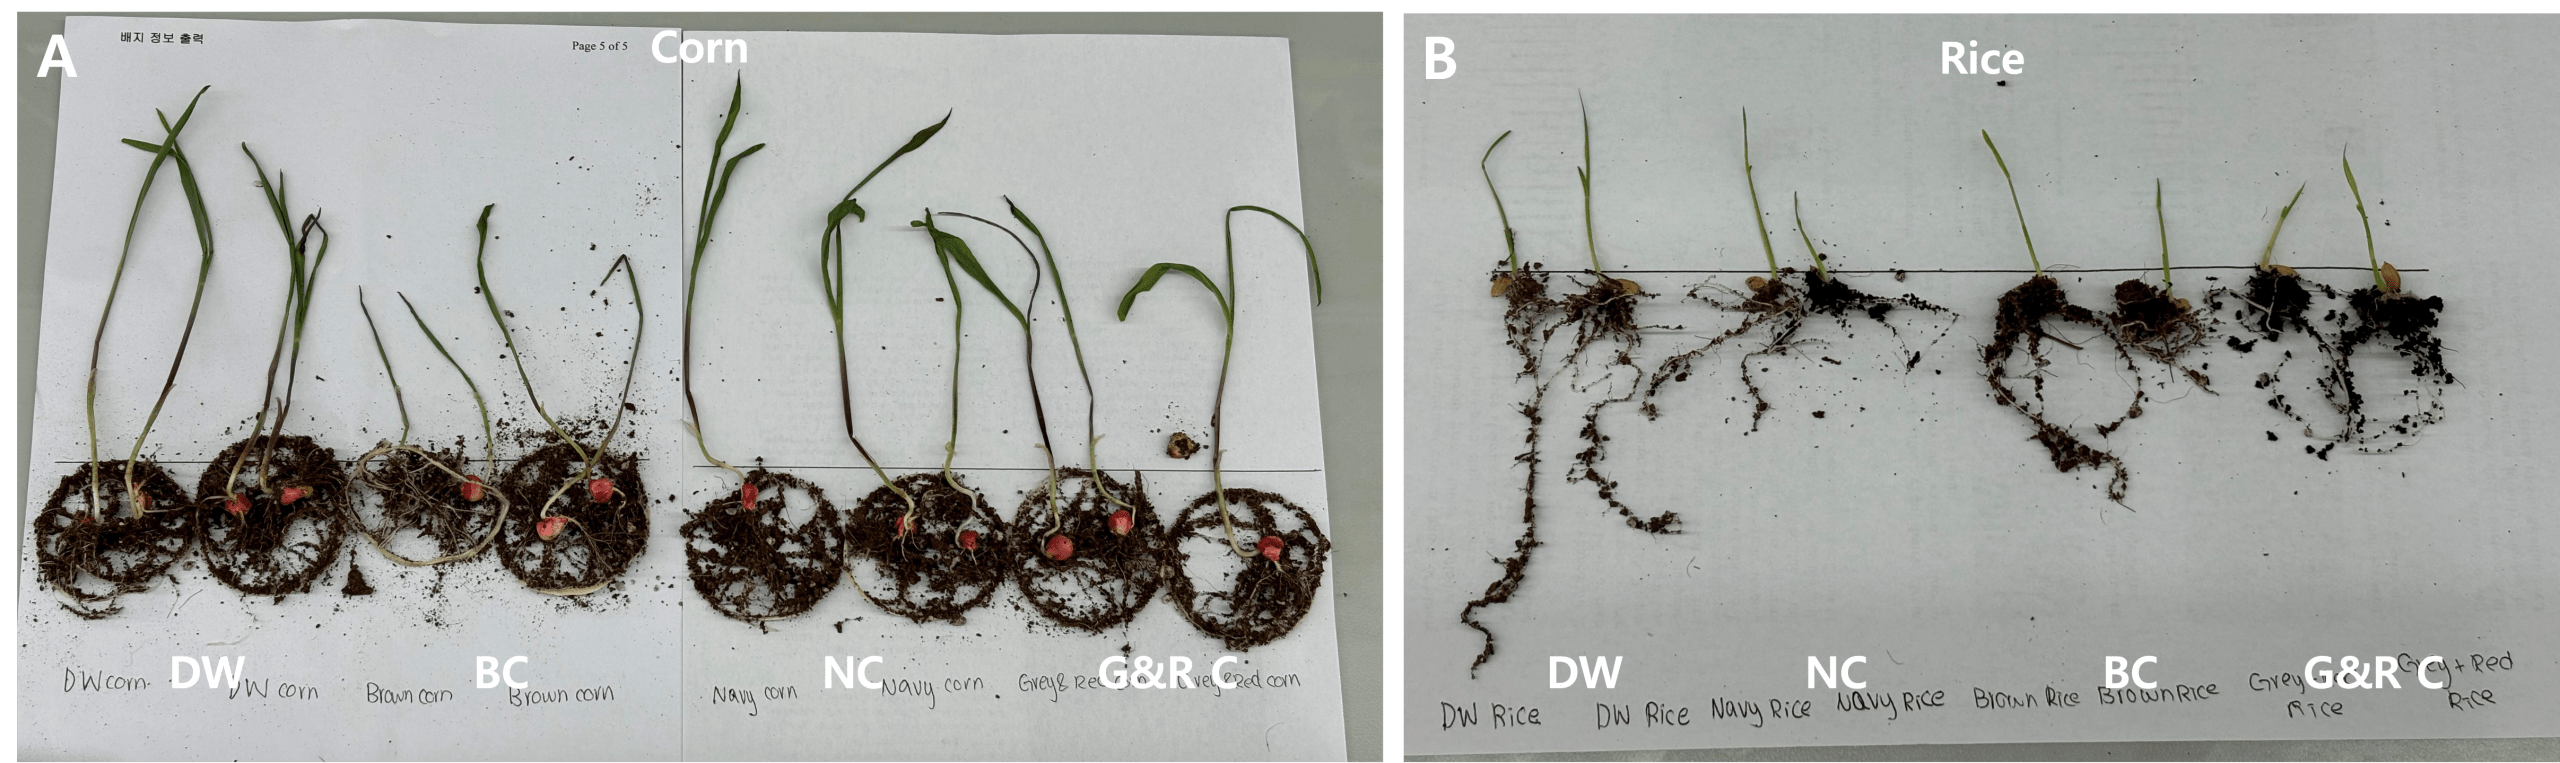
Rice and corn were planted in different CWE contaminated soils. After germination, corn grown in brown CWE contaminated soil faced stunted growth, while the corn sprouts in DW remained healthy.
The rice sprouts grown in navy or gray-red CWE-contaminated soil had the most stunted and shortest crops compared to those grown in DW-watered soil. Rice grown in DW grew the tallest and healthiest (Fig. 14).
Heavy metal tests were conducted with corn sprouts grown in different CWE-contaminated soils (Table 5). Heavy metals appeared in corn sprouts grown in CWE-contaminated soils, meaning that the heavy metals in CWE, along with water transfer to plants through the vascular system. The presence of heavy metals in crops causes toxicity by interfering with nutrient uptake. Thus, if eaten, these crops can potentially cause unnatural heavy metal accumulation in the human body.
| Clothing Pollutant in Soil | Heavy metal (ppb) |
| DW | 20 |
| Brown CWE | 70 |
| Navy CWE | 70 |
| Gray-red CWE | 50 |
Selection of Remediation Materials for CWE-Contaminated Soil
Selection of MP-decomposing Bacteria
If lignin-decomposing bacteria breaks down a biopolymer lignin, then the bacteria could also effectively decompose plastic, a polymer due to similar chemical structure of basic composition and bonds20,21. Specifically, this process would consist of bacteria breaking down covalent bonds between polymers, transforming them into monomers22.
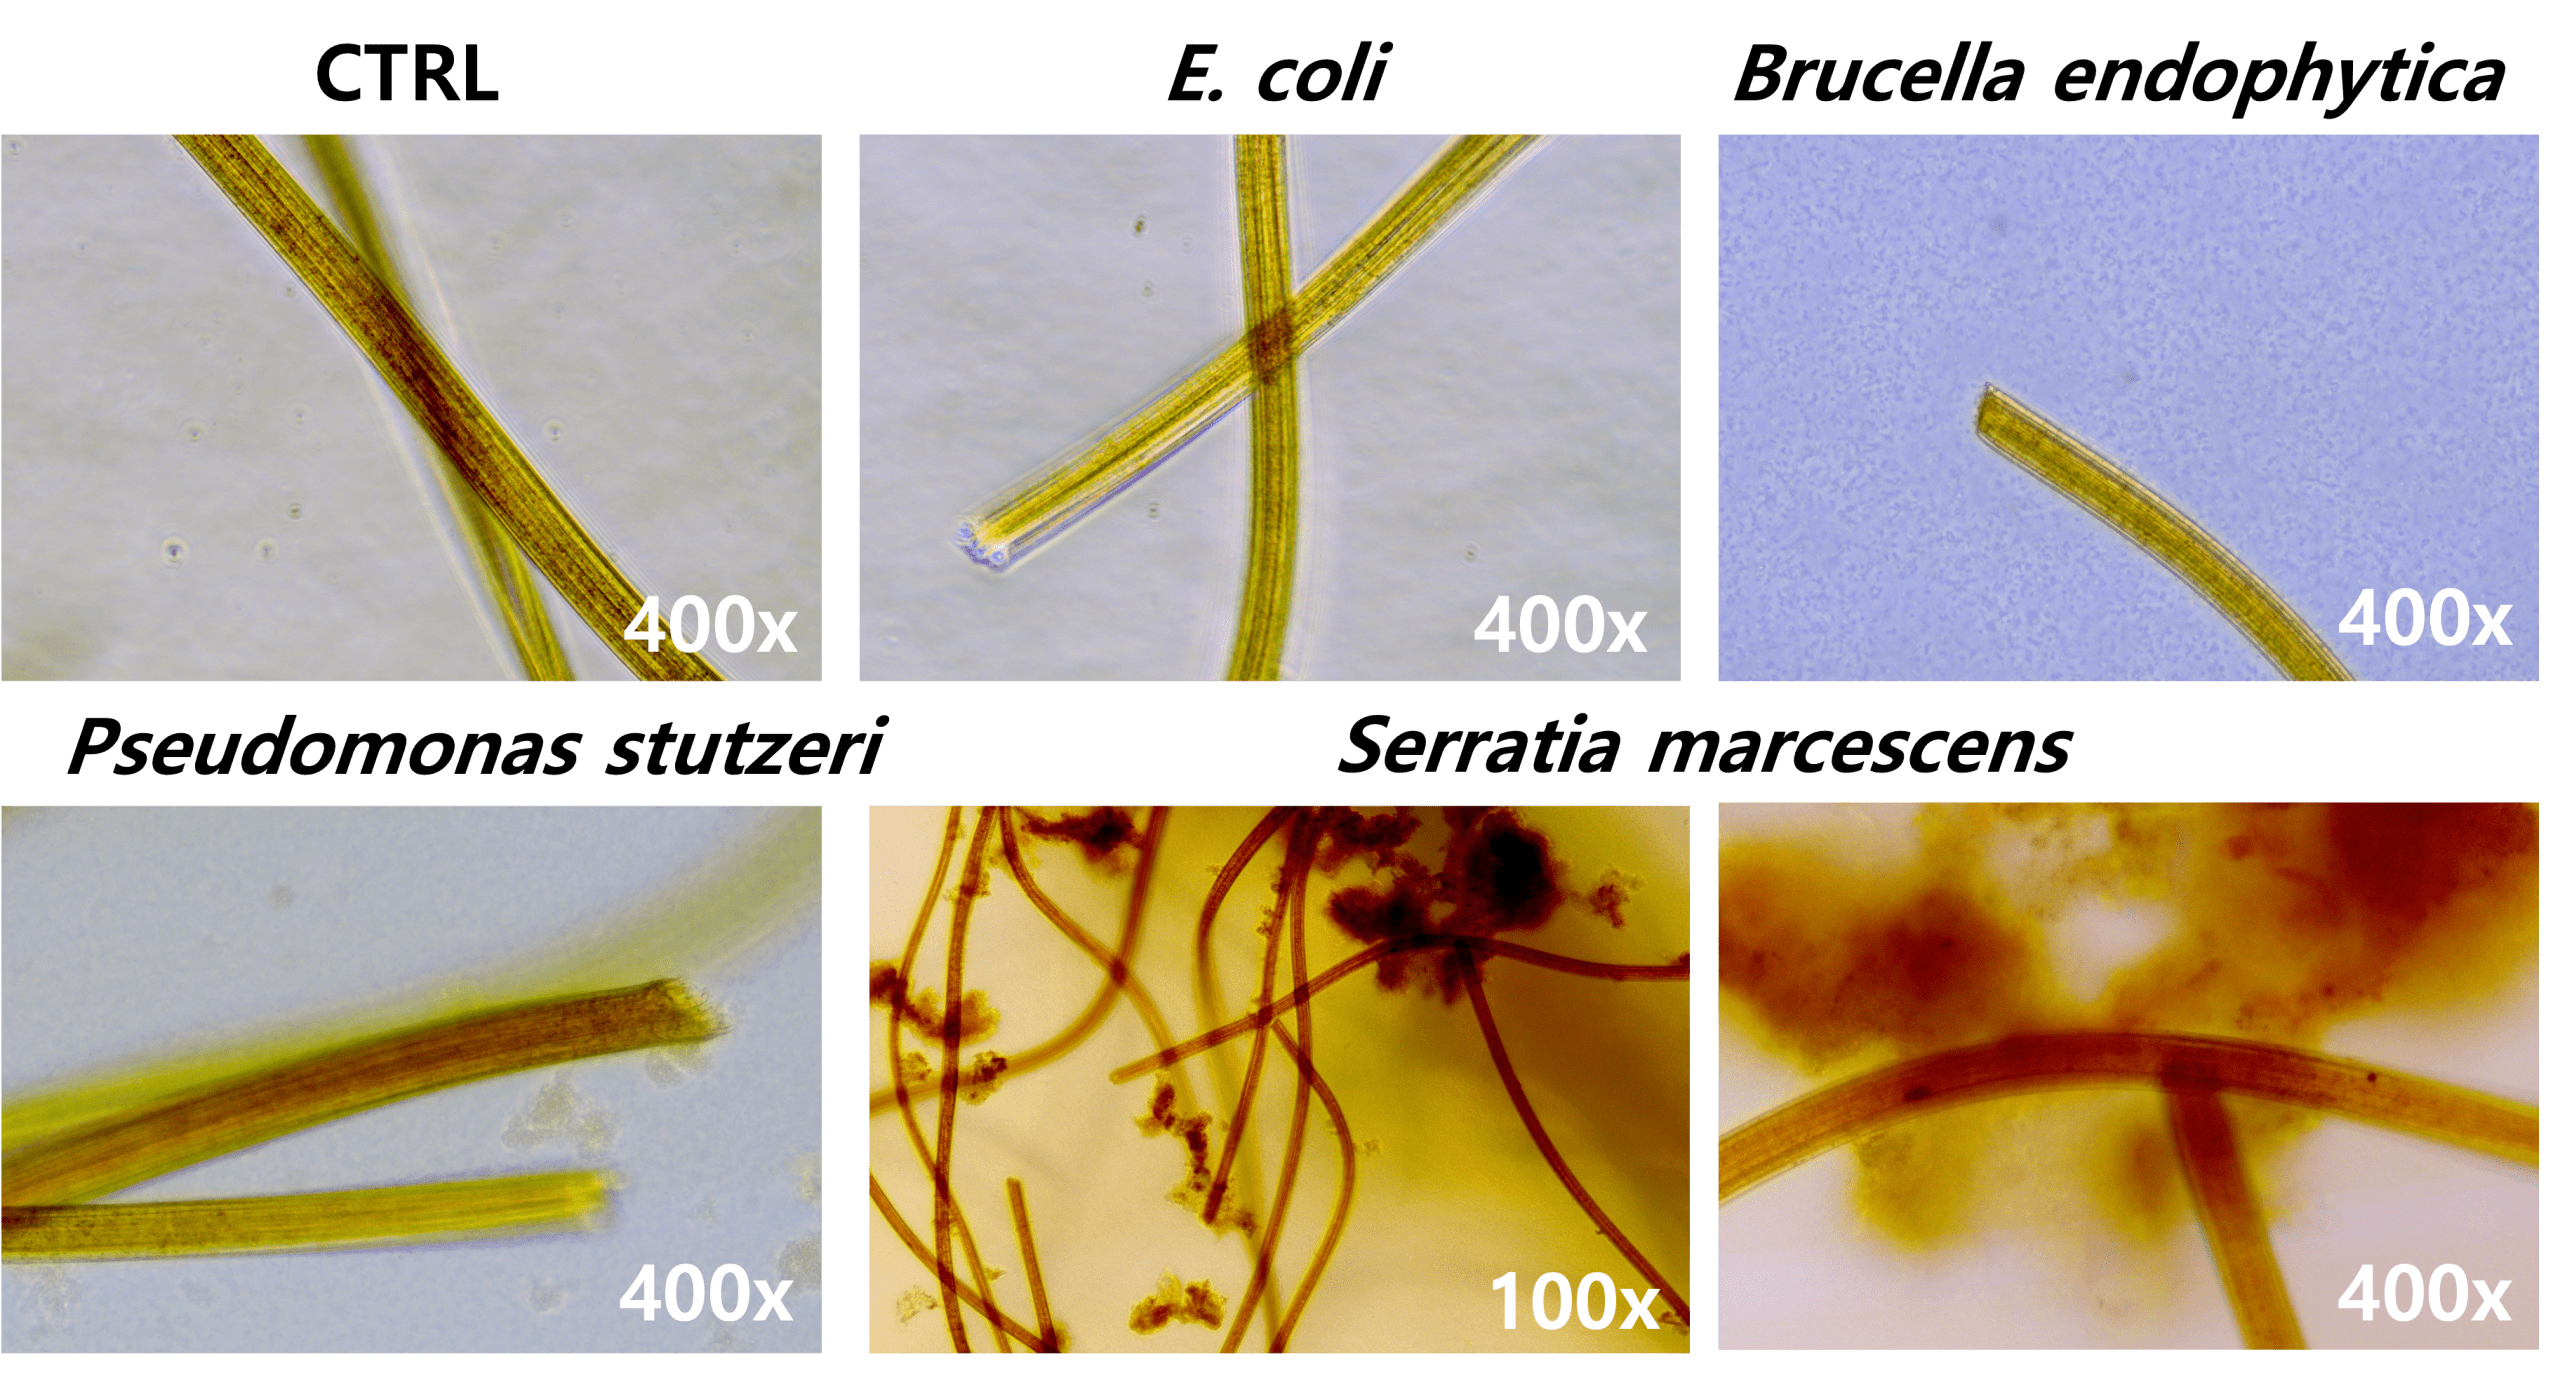
Brown clothing pieces were treated with lignin-decomposing bacteria, B. endophytica, P. stutzeri, and S. marcescens in which S. marcescens had the best positive outcome. Additionally, E. coli, used as a positive control, was inefficient in deteriorating apparel. While other bacteria, including lignin-decomposing strains, were ineffective in breaking down clothing, S. marcescens caused the clothing to release brown dye and accumulated pollutants after 48 hours. Furthermore, after 1 month, S. marcescens successfully extracted the most MPs from the clothing fibers compared to the other bacteria (Fig. 15).
Safety of MPs-decomposing Bacteria for Plant Growth
Along with other lignin-decomposing bacteria, S. marcescens, which proved to be effective in breaking down clothing, was analyzed to observe the impact and safety on plant growth. Rice seeds planted in the soil treated with P. stutzeri or S. marcescnes similarly grew the tallest (average 6.6cm vs. 6.5cm) (Fig. 16). Despite similar heights, S. marcescens was utilized in creating the final bio-device because it most effectively degraded clothing microfibers.
Absorption of Shell Powder for CWE Pollutants
The removing ability of shells from shellfish was tested in lessening MPs, heavy metals and chemicals from CWE. While CWE and CWE treated with crab shells contained the same amounts of heavy metals, the crab shells nor the oyster shells were ineffective in removing heavy metals (Table 6).
Additionally, COD and chlorine tests were conducted. Out of the three CWE samples, crab shells were most effective in reducing the chemical contaminants, including chlorine, of CWE (Table 6).
After testing MPs adsorption, while the CWE contained 54 MPs, the CWE containing crab shells had the least amount of 39 MPs meaning that crab shells decreased original MPs by approximately 27.78% (Table 6).
| Treatment | Heavy Metal | COD | Chlorine | MPs |
| ppb | mg/L | ppm | ||
| CWE | 50 | 20 | 0.15 | 54 |
| +Oyster Shells | 60 | 20 | 0.2 | 61 |
| +Crab Shells | 50 | 15 | 0.1 | 39 |
Effect of Shells on Plants Grown in Contaminated Soil
Cabbage plant seeds were grown in soil contaminated with crab or oyster shell-treated CWE to observe the soil remediating ability of the shells on the growth and health of the plants. While the data presented in Table 6 suggests that crab shells caused toxin levels of CWE to be lower, sprouts grown in the oyster shell group grew 1.5x taller than those of the crab shell group and were similar heights to those of the control group (Fig. 17). Evident through the physical growth of the sprouts, oyster shells were generally more effective in neutralizing toxins and therefore were chosen to be used in the final bio-device over the crab shells.
Mushroom Effectiveness in Removing Heavy Metals
Observed from the results of 3.5, heavy metals were seen to accumulate in sprouts, necessitating a new solution to clearing heavy metal contamination in plants. Consequently, mushrooms’ effectiveness in removing heavy metals were tested due to the fact that they serve as wood-decaying fungi and have successfully decreased heavy metal content23. Specifically, Shiitake and Oyster mushrooms were s tested because they are easily found in Thailand’s environment.
1% or 2% of Shiitake or Oyster mushrooms were mixed with the CWE. After 1-hour, 2% of both mushrooms indicated a low heavy metal amount compared to 1% (Table 7). Because mushroom concentrations of 2% too densely colored, only 1% of both mushroom groups were tested after 48 hours. The 1% Oyster mushroom group had significantly reduced heavy metal content to 20 ppb, while the only CWE group had a heavy metal content of 70 ppb. Thus, 1% of Oyster mushrooms was selected to be used in creating the final bio-device.
| CWE | Shiitake mushroom | Oyster mushroom | |||
| 1% | 2% | 1% | 2% | ||
| 1 hr | 100 | 80 | 40 | 100 | 30 |
| 48 hrs | 70 | 50 | N/A | 20 | N/A |
Soil remediation of the CleanGrower
Due to the successful remediation of pollutants by S. marcescens, Oyster shells and Oyster Mushrooms, these materials were combined to create the CleanGrower: a chip-shaped bio device made from agar and cornstarch (Fig. 18).
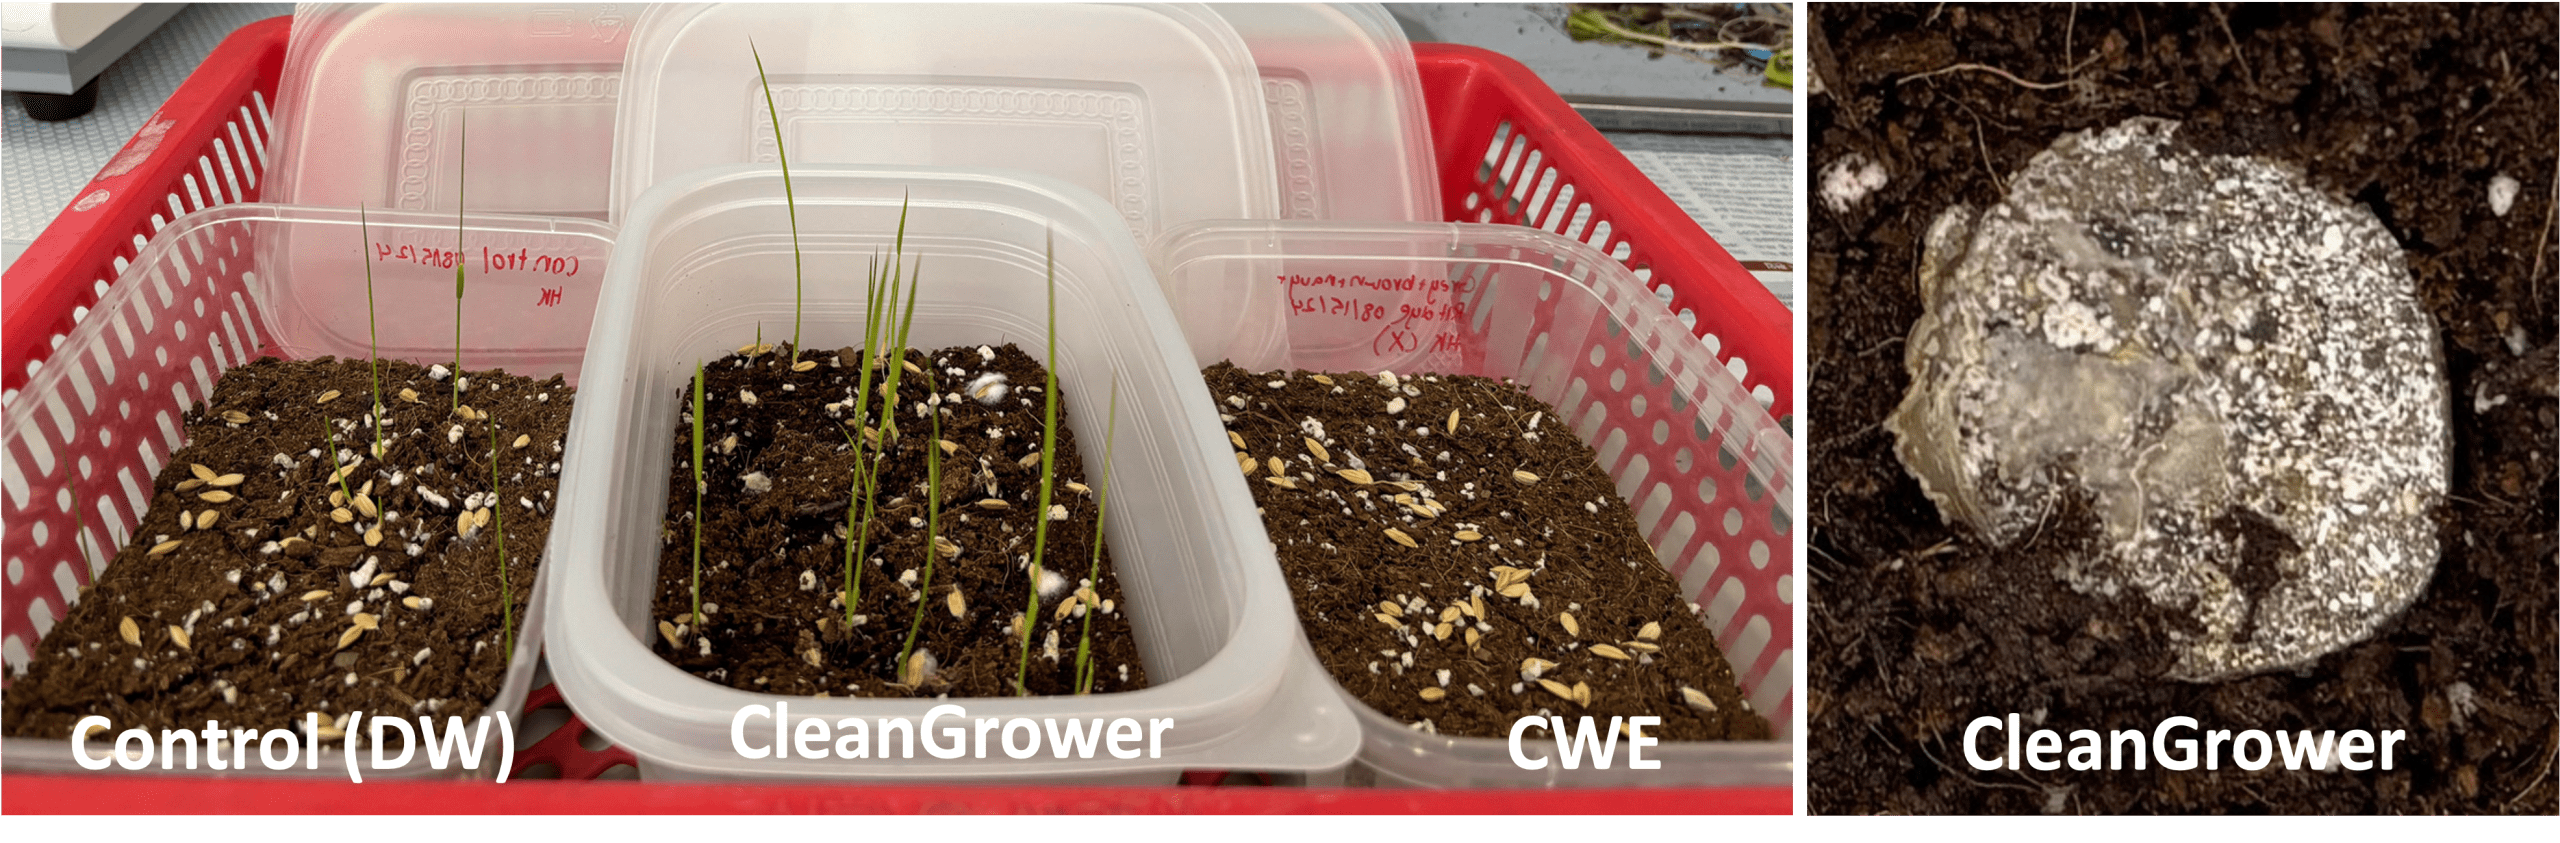
To observe the effect of the CleanGrower on rice plants, three containers filled with soil were prepared. One of the containers contained 6 CleanGrowers and was supplied with CWE. The other two containers were supplied with either water or CWE. Rice seeds were planted in all the containers, and their growth was compared.
The sprouts grown with the aid of the CleanGrower grew taller and retained more moisture than those grown without the CleanGrower, indicating that this bio-device effectively mitigates the pollutants of CWE (Fig. 19). Although the controlled soil only contained DW, the germination rate of the rice sprouts was significantly slower and less frequent than that of the soil containing CWE and CleanGrower. The soil containing only CWE supported no germination due to the damaged soil.
Predicting the ability of CleanGrower Utilization in Real-Life Environments Using Deep Learning Models
Effectiveness of CleanGrower in Various Conditions
First, to prepare the dataset for developing deep learning models, the CWE concentration, the presence or absence of the CleanGrower, and temperature were varied to measure soil bacterial concentration and the number of germinated crops in each soil group. Fig. 20 shows the results of the OD values of soil bacteria taken on Day 2 under each condition. Soil bacteria proliferated rapidly within just two days under the presence of the CleanGrower compared to the control (no CleanGrower), regardless of CWE concentration or temperature. This increased bacterial activity in the soil, evident in the test groups, is expected to positively impact subsequent plant germination and growth.
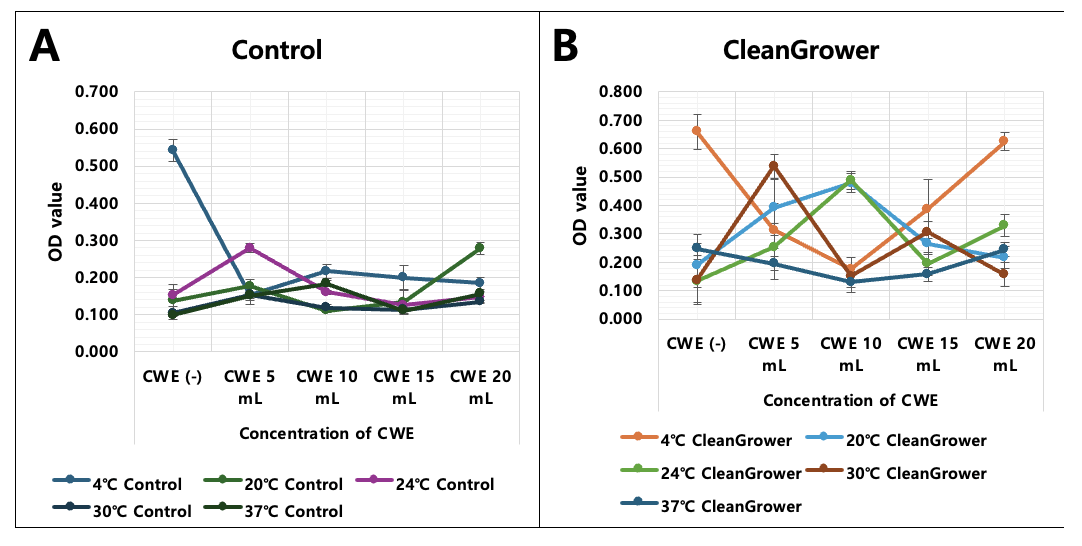
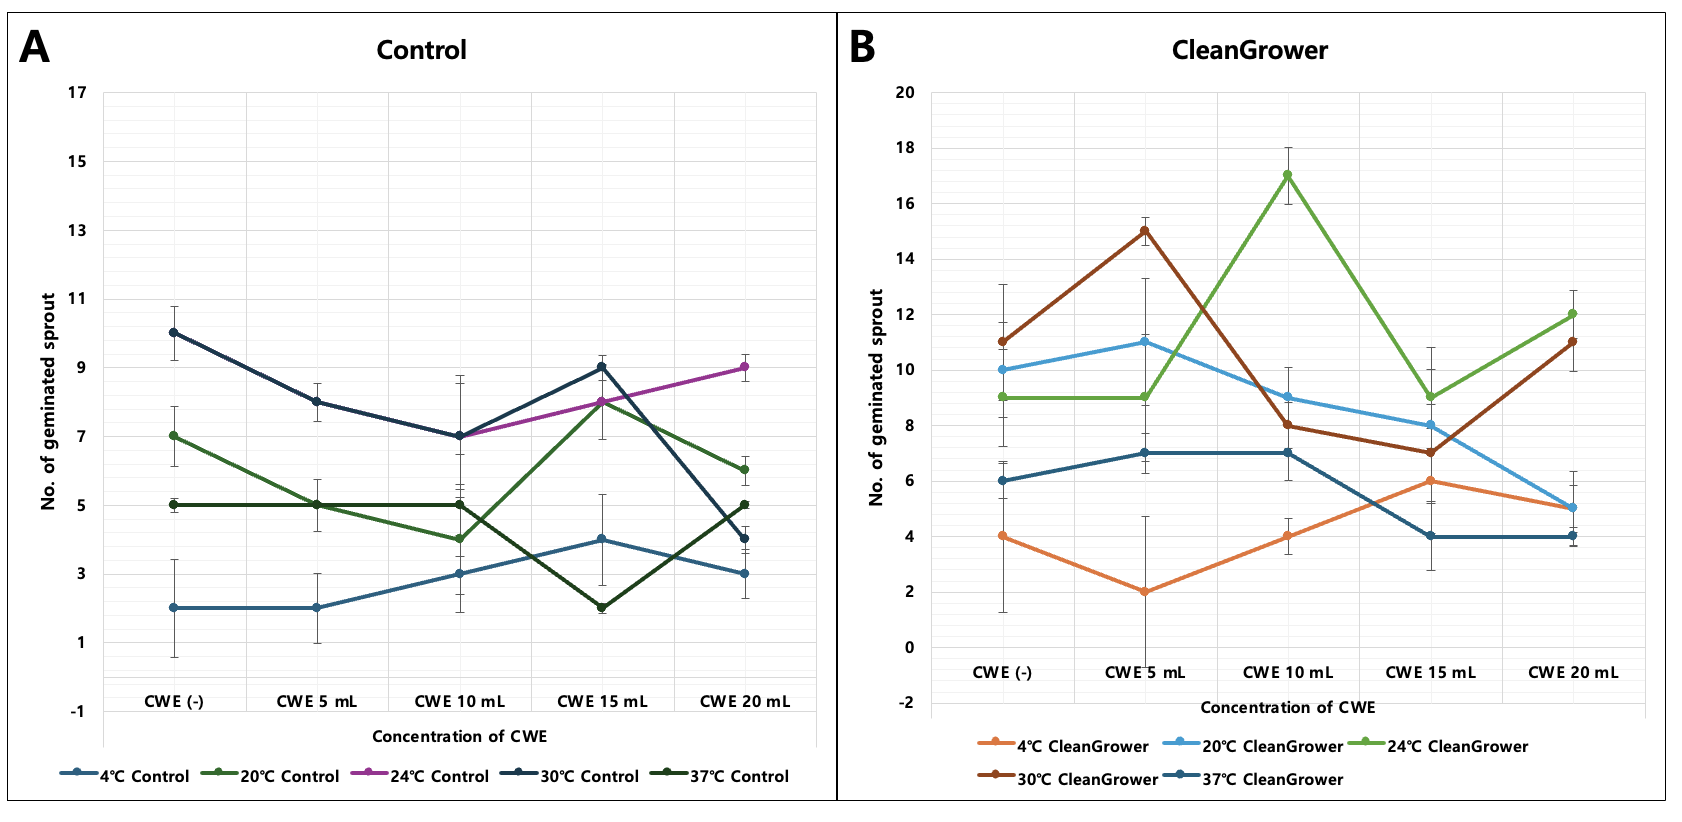
Fig. 21 shows the number of germinated cabbage sprouts on Day 6. Although the germination count was lower under increasing CWE concentration or temperatures outside the 24-30°C range, in all conditions, the presence of the CleanGrower resulted in higher germination rates compared to those with the absence of the CleanGrower. This demonstrates that the CleanGrower can help reduce clothing fiber pollutants and support crop growth even under extreme conditions and environments.
Statistical Testing
In this experiment, regression analysis was performed on previously collected plant length data for each criteria, and the results are shown in Table 8. The statistical tests conducted demonstrate the significant effect of CleanGrower treatment and its interaction with other variables on plant growth. The regression analysis reveals that CleanGrower treatment alone positively influences plant growth, as evidenced by its coefficient of 0.4005, indicating a substantial increase in growth. With a p-value of 0.00000573, the effect is statistically significant. In addition, the variables representing “Days,” “CG & Days,” and “CG & temperature” also exhibit a significant positive long-term effect on plant growth.
| Variable | CoE | SE | T-Statistic | P-Value |
| CleanGrower | 0.400499 | 0.087956 | 4.553426 | 0.00000573 |
| Days | 0.411341 | 0.024247 | 16.964700 | 0.00000001 |
| Temperature | 0.012447 | 0.004140 | 3.006443 | 0.00268938 |
| CG & Days | 0.1 5329 | 0.017316 | 10.702912 | 0.00000001 |
| CG & Temp. | 0.016825 | 0.003163 | 5.319007 | 0.00000012 |
| CG & CWE | 0.012642 | 0.003601 | 3.510360 | 0.00046142 |
MLP Model Evaluation
The dataset obtained for each condition was divided into five groups (Fold 1–5) and applied to the MLP model to analyze the prediction accuracy. The MLP model was developed by providing the dataset to Cops Lab, and the analysis results are shown in Table 9.
MLP demonstrated high predictive accuracy, as indicated by an average R² value of 0.8209 across five cross-validation folds. This suggests that the model explains approximately 82% of the variance in plant growth data, underscoring its effectiveness. Additionally, the results of the MLP model, including MSE, MAE, RMSE, and R², demonstrating consistency and robustness across five folds.
| Fold 1 | Fold 2 | Fold 3 | Fold 4 | Fold 5 | |
| Average (± std) | |||||
| MAE | 0.5433 | 0.2967 | 0.7599 | 0.4723 | 0.3783 |
| 0.4990 ± 0.1797 | |||||
| MAE | 0.2194 | 0.1673 | 0.2182 | 0.1722 | 0.1626 |
| 0.1846 ± 0.0359 | |||||
| RMSE | 0.7371 | 0.5447 | 0.8717 | 0.6873 | 0.6151 |
| 0.6951 ± 0.1260 | |||||
| R² | 0.8313 | 0.8994 | 0.7326 | 0.7994 | 0.8557 |
| 0.8209 ± 0.0623 | |||||
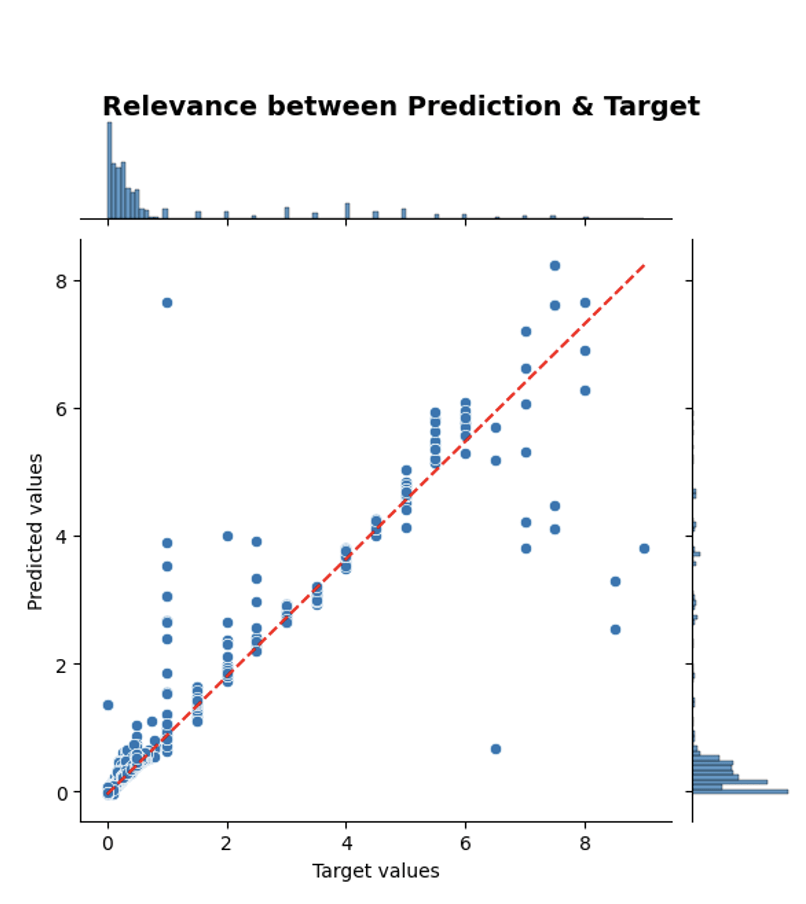
Fig. 22 demonstrates that the values predicted by the developed AI model after training closely align with the actual measurements. This minimized-deviation model accurately predicts the usefulness of the CleanGrower, indicating that it has the ability to effectively remove pollutants and supports normal crop growth under conditions contaminated with waste clothing or CWE.
Discussion
Clothing waste imposes detrimentally harmful effects on agriculture, including the stunting of plant growth due to the toxins such as heavy metals and microplastics present in clothing waste extract24. Due to Thailand’s economy being heavily reliant on agriculture and clothing production for economic profit, the harmful relationship between the clothing industry and farmlands must be addressed. Therefore, the intertwined relationship between the clothing waste discarded from factories and agriculture must be clarified through an emergent solution.
To do this, clothing waste extract and clothing dye were tested to find specific toxins that the clothing industry imposes on the environment. With this, the toxins were more intricately inquired, as possible eco-friendly bio-products were tested to mitigate these toxins. Bio-products of shells, mushrooms, and lignin-decomposing bacteria were not only tested for effectiveness in clearing pollutants, but they were also tested to ensure positive impact on overall plant growth (Table 10).
Commonly found in Thailand, oyster shells25 oyster mushrooms26 and S. marcescens most positively mitigated pollutants of clothing waste extract without interfering in plant growth. While oyster shells increased plant growth even under suppressive conditions with clothing pollutants, oyster mushrooms were effective in lessening heavy metal content, and S. marcescens were effective in degrading clothing.
| Materials | Plant Growth | Heavy Metals | MPs | Degradation of Clothing |
| Oyster Shells | E | Not E | Not E | Not E |
| Oyster Mushroom | – | E | – | Not E |
| S. marcescens | E | Not E | Not E | E |
The shape of the final bio-device, the CleanGrower, was considered by standards of money, efficiency and sustainability. While the chip-shaped CleanGrower is cheap and efficient to produce, the CleanGrower also utilizes only sustainable materials and is efficient for farmers to use. With customers in mind, the CleanGrower only necessitates farmers to plant their crops with the CleanGrower without taking it out, due to the CleanGrowers ability to biodegrade.
After the careful selection of materials, and the mindful creation of CleanGrower, the effectiveness of the bio-device in improving plant growth and health was finally tested. The rice sprouts in the soil containing clothing waste extract and the CleanGrower grew taller than that of the control with only DW. With moisture retained soil and tall healthy rice sprouts, the CleanGrower can prove to be effective for the cultivation of rice, a major crop in Thailand27. The CleanGrower has proven to be effective in this study conducted over a short-period of time. Thus, further tests and research must be conducted to substantiate the CleanGrower’s long-term impact on crop growth, soil health, and pollutant re-release. To predict the usefulness of CleanGrower in real-world environments, regression analysis and the MLP model were employed. Results demonstrated that CleanGrower treatment is effective in streamlining crop growth and sustainability, even under various environmental conditions.
In conclusion, the CleanGrower developed with agarose gel, cornstarch, oyster mushroom, oyster shells, and S. marcescens not only enhances the growth of rice sprouts in clothing-contaminated soils, but also proved to be effective under unpredictable environmental conditions using the AI deep learning model.
References
- J. H. Clark. Textile waste – an opportunity as well as a threat. Green Carbon. Vol. 1, pg. 146-149, 2023, https://doi.org/10.1016/j.greenca.2023.10.002. [↩] [↩]
- A. Siddiqua, J. N. Hahladakis, W. A. K. A. Al-Attiya. An overview of the environmental pollution and health effects associated with waste landfilling and open dumping. Environmental Science and Pollution Research. Vol. 29, pg. 58514-58536, 2022, doi: 10.1007/s11356-022-21578-z. [↩] [↩]
- Y.J. Dhir. 2- Hazards of fashion and textile waste: Approaches for effective waste management. The Textile Institute Book Series. 31-58, 2021, https://doi.org/10.1016/B978-0-12-818758-6.00002-8. [↩]
- P. Soni. Agricultural value added in Thailand, expressed as proportion of GDP. https://www.researchgate.net/figure/Agricultural-value-added-in-Thailand-expressed-as-proportion-of-GDP-Source-World-Bank_fig1_305166783. 2015. [↩]
- B. Rocco. Number of textile and apparels factories Thailand 2020-2024. https://www.statista.com/statistics/1307385/thailand-number-of-textile-and-clothing-factories/. 2024. [↩]
- Thailand Manufacturing Firm Productivity Report Public Disclosure Authorized.2020,https://documents1.worldbank.org/curated/en/497151606302306312/pdf/Thailand-Manufacturing-Firm-Productivity-Report.pdf. [↩]
- S. Banlang, C. Kanjanpan. Influence of Social Norms on Sufficenciy-Oriented Fashion Consumption among Thai Consumers. Arts of Management Journal. Vol. 9, 2025, https://so02.tci-thaijo.org/index.php/jam/article/view/282613. [↩]
- M. Suran. A Planet too rich in Fibre. EMBO Reports. Vol 19, 2018, 10.15252/embr.201846701. [↩]
- A. P. Periyasamy, A. Tehrani-Bagha. A review on microplastic emission from textile materials and its reduction techniques. Polymer Degradation and Stability. Vol 199, 2022, https://doi.org/10.1016/j.polymdegradstab.2022.109901. [↩]
- S. K. Sela, A. K. M. N. Hossain, S. Z. Hussain, N. Hasan. Utilization of prawn to reduce the value of BOD and COD of textile wastewater. Cleaner Engineering and Technology. Vol 1, 2020, https://doi.org/10.1016/j.clet.2020.100021. [↩]
- G. Bal, A. Thakur. Distinct approaches of removal of dyes from wastewater: A review. Materials Today: Proceedings. Vol 50, pg. 1575-1579, 2022, https://doi.org/10.1016/j.matpr.2021.09.119. [↩]
- W. Gao, Y. Zhang, A. Mo, J. Jiang, Y. Liang, Z. Cao, D. He. Removal of microplastics in water: Technology progress and green strategies. Green Analytical Chemistry. Vol 3, 2022, https://doi.org/10.1016/j.greeac.2022.100042. [↩]
- J. Gabriel, M. Mokrejš, J. Bílý, P. Rychlovský. Accumulation of heavy metals by some wood-rotting fungi. Folia Microbiologica. Vol 39, pg. 115-118, 1994, https://doi.org/10.1007/BF02906805. [↩]
- S. Tamjidi, A. Ameri. A review of the application of sea material shells as low cost and effective bio-adsorbent for removal of heavy metals from wastewater. Environ Sci Pollut Res int. Vol 27, pg. 31105-31119, 2020, 10.1007/s11356-020-09655-7. [↩]
- T. L. Rhoads, A. T. Mikell Jr, M. H. Eley. Investigation of the lignin-degrading activity of Serratia marcescens: biochemical screening and ultrastructural evidence. Can J Microbial. Vol 41, pg. 592-600, 1995, 10.1139/m95-079. [↩]
- Q. Qiu, X. Sun, H. Li, F. Zhang, D. Zhou, K. Tian, X. Zhang, H. Huo. Biodegradation of polystyrene and its mechanisms driven by customized lignin-degrading microbial consortium and degrading bacteria. Journal of Enviromental Management. Vol 384, 2025, https://doi.org/10.1016/j.jenvman.2025.125560. [↩]
- T. Chan-juan, L. Ming-Zhao, Z. Shuo, J. Guan-qing, T. Sha, J. Yan-chao, Z. Hui, D. Xian-min. Variations in chlorophyll content, stomatal conductance and photosynthesis in Setaria EMS mutants. Journal of Integrative Agriculture. Vol 22, pg. 1618-1630, 2023, https://doi.org/10.1016/j.jia.2022.10.014. [↩]
- E. Yadav. The Role of the Fashion Industry and Textiles in Lung Health and Associated Pathogens: A Review. 2023, 10.24966/PMRR-0177/100077. [↩]
- Ankit, L. Saha, V. Kumar, J. Tiwari, Sweta, S. Rawat, J. Singh, K. Bauddh. Electronic waste and their leachates impact on human health and envrioment: Global ecological threat and management. Enviromental Technology and Innovation. Vol 24, 2021, https://doi.org/10.1016/j.eti.2021.102049. [↩]
- J. K. Schniete, T. Brüser, M. A. Horn, N. Tschowri. Specialized biopolymers: versatile tools for microbial resilience. Current Opinion in Microbiology. Vol 77, 2024, doi: 10.1016/j.mib.2023.102405. [↩]
- T. T. H. Thi, E. H. Pilkington, D. H. Nguyen, J. S. Lee, K. D. Park, N. P. Truong. The Importance of Poly(ethylene glycol) Alternatives for Overcoming PEG Immunogenicity in Drug Delivery and Bioconjugation. Polymers. Vol 12, 2020, doi: 10.3390/polym12020298. [↩]
- Q. Gao, L. Guo, S. Li, W. Wu, J. Ding, H. Xu, C. Luo, J. Li, D. Li, Z. Liu. et al. Biodegradation mechanism of cellulose, hemicellulose, and lignin in bacteria-dominant aerobic composting from agricultural biomass waste: A review. Carbohydrate Polymer Technologies and Applications. Vol 11, 2025, https://doi.org/10.1016/j.carpta.2025.100879. [↩]
- W. Gao, Y. Zhang, A. Mo, J. Jiang, Y. Liang, X. Cao, D. He. Removal of microplastics in water: Technology progress and green strategies. Green Analytical Chemistry. Vol 3, 2022, https://doi.org/10.1016/j.greeac.2022.100042. [↩]
- S. O. Aniebonam. Heavy Metals and Microplastics: Synergistic Threats To Agricultural Sustainability. International Journal of Multidisciplinary Research and Growth Evaluation. Vol 4, 2023, https://doi.org/10.54660/.IJFMR.2023.4.4.1156-1168. [↩]
- R. Chilakala, C. Thannaree, E. J. Shin, T. Thenepalli, J. Ahn. Sustainable Solutions for Oyster Shell Waste Recyling in Thailand and the Philippines. Recycling. Vol 4, 2019, https://doi.org/10.3390/recycling4030035. [↩]
- P. Sridonpai, P. Suthipibul, K. Boonyingsathit, C. Chimkerd, S. Jittinandana, K. Judprasong. Vitamin D Content in Commonly Consumed Mushrooms in Thailand and Its True Retention after Household Cooking. Food. Vol 12, 2023, https://doi.org/10.3390/foods12112141. [↩]
- N. Arunrat, N. Pumijumnong. The Preliminary Study of Climate Change Impact on Rice Production and Economic in Thailand. Asian Social Science. Vol 11, 2015, 10.5539/ass.v11n15p275. [↩]


