
Abstract
Thank you to An Zhao from University College London for the guidance provided in the development of this research paper. Abstract – Throughout aviation history, safety has remained a top priority in the industry. In particular, many collision avoidance systems, such as the Traffic Alert and Collision Avoidance System (TCAS), help planes communicate important information to avoid collisions. In addition to aircraft collisions, bird strikes pose a significant threat to aviation safety, as they often occur when birds fly into aircraft engines at low altitudes. Airports employ numerous techniques and systems to mitigate these threats, continually seeking new, more efficient methods. At the same time, deep learning and detection models are becoming increasingly relevant, making them a reliable tool for aviation safety. This paper aims to use deep learning models to take initial steps toward enhancing pilots’ awareness by using a visual display of their real-time surroundings. This particular study uses a pre-trained DETR, a transformer-based detection model. Additionally, a specific dataset was constructed by collecting images from the internet and synthetic samples generated with generative AI to challenge and assess the model. After conducting the experiment, the data proved encouraging: the model achieved 88% precision for aircraft and 85% for birds, with recall rates of 92% for aircraft and 79% for birds. To compare the DETR model with other algorithms, a YOLOv8 detection model was developed on the same dataset, yielding higher speed but inferior accuracy. These results demonstrate that detection-based models and deep learning algorithms can play a role in preventing impact collisions, provided that further research is conducted.
Keywords: deep learning, object detection, DETR, Traffic Alert and Collision Avoidance System, YOLOv8
Introduction
Throughout aviation history, safety and security have remained the utmost priority in designing, maintaining, and directing air traffic. Yet factors such as human error and airspace congestion are only increasing as the volume of aircraft continues to grow. Deep learning (DL) and machine learning (ML) models have infiltrated almost every aspect of the modern world. AI has enormous potential in the aviation industry as it can process information faster than humans in specific tasks. In this day and age, ML and DL models are more practical than ever, with rising travel demand and the number of aircraft. AI has already demonstrated its potential in the industry, and with continued research, as aviation transitions into a data-driven sector, its transformative power will help keep the skies safer1. In the aviation industry, pilot error remains a top safety concern, particularly with the increasing presence of new technologies in the airspace, such as drones. The danger of human error can result in fatal and economically devastating aircraft collisions both in the air and on the ground. Additionally, bird strikes can cause severe damage and even fatal crashes, posing a serious threat to aviation safety2.
In this paper, I intend to leverage my knowledge of DL systems to develop a novel aviation detection system that can potentially help pilots avoid collisions with airborne objects. My research question is as follows: Can a general-purpose pre-trained object detection model (DETR) detect airplanes and birds in aviation-context images without domain-specific training to help prevent in-air collisions? This study serves as a preliminary step toward the future capabilities of this idea and the development of AI- and machine-learning-based aviation safety systems. Furthermore, my hypothesis states that the DETR pre-trained on COCO will achieve greater than a 80% precision and recall for airplane and bird detection.
Literature Review
Object detection remains a fundamental task in computer vision, with some common examples including autonomous driving and aerial surveillance. Over many years, with the help of Convolutional Neural Network (CNN) backbones, multiple deep learning approaches have been developed and tested for object detection and classification in images. More recently, transformer-based architectures have emerged as a high-quality alternative to conventional detection models, offering improved global context modeling and greater flexibility in detecting complex object relationships. This section reviews both CNN-based and transformer-based detection methods, highlighting their architectures, key features, and performance characteristics.
CNNs are deep learning models inspired by the hierarchical processing of visual information. Each model consists of layers: an input layer, one or more hidden layers, and an output layer3. The network adjusts its weights and biases to minimize a loss function during training, thereby improving accuracy. These properties make CNNs highly effective for object detection tasks, which require the simultaneous localization and classification of objects in images4. CNN models are categorized into two groups: one-stage and two-stage, which depend on whether detection and classification are performed simultaneously or sequentially. Before reviewing types of CNN models, one must analyze the CNN backbone.
CNN Backbone
The CNN backbone forms the foundation of most object detection models, as it generates feature maps that enable localization and classification. Below are examples and descriptions of different CNN backbone models. DenseNet is a widely used backbone in which every layer is connected directly to every other layer, creating a dense connection pattern. As a result, much of the data is reused, leading to more efficient outcomes5. SqueezeNet is another popular backbone that uses fewer parameters than other models. The model is much smaller than other programs, and it works well with lower-resource devices. The key difference in this model is the fire modules. By implementing a squeeze layer that uses 1×1 filters to reduce the number of input channels, the model can then pass information through an expand layer to restore the feature map dimensions. This technique yields faster results without compromising accuracy5. ResNet 50 is another backbone, short for Residual Network, and is known for using over 50 layers in detection. This model employs a residual block technique that enables the input to a layer to be added directly to its output, known as a skip connection, thereby preventing the vanishing gradient problem6.
One Stage Object Detection
You Only Look Once (YOLO) is a one-stage object detection model that uses a single neural network to predict class probabilities and bounding boxes in a single forward pass. YOLO first divides an input image into an s x s grid. If an object falls into a grid cell, the cell detects the object, predicts a bounding box, and assigns a confidence score. Because there are multiple bounding boxes per grid cell, the training process assigns responsibility for an object to the box with the highest Intersection over Union (IoU) with the ground truth. During training, the model learns to specialize each bounding-box predictor to achieve more accurate detection. To improve accuracy, the YOLO model employs non-maximum suppression (NMS). This technique helps remove redundant bounding boxes, since multiple are often generated for a single detected object. Although YOLO is a very accurate and reliable deep learning model, limitations persist. Due to its one-stage architecture, the model struggles to detect smaller objects and those of varying scales. Additionally, YOLO often fails in poor lighting and other adverse environmental conditions. Finally, the model requires high-end GPUs to run in real time, making it slow and unreliable on less capable devices. Given the aviation industry’s need for high accuracy and adaptability, YOLO was not selected as the primary model but was used as a baseline for comparison7.
Two-Stage Object Detection
Two-stage object detection models first identify a region of interest and then classify objects within the bounding boxes. This process takes longer yet yields more accurate results. Below are some examples of two-stage object detection methods. R-CNN remains one of the most accurate detection methods available, thanks to the contributions of two key methods. First, the model generates proposed object regions within an image, known as “region proposals.” It then feeds this region into a pre-trained CNN model, such as AlexNet. Finally, a Support Vector Machine (SVM) predicts the probability of a specific object in the region of interest, creating a bounding box around it8. Fast R-CNN is part of the R-CNN family, but it runs significantly faster. The entire image is first processed through a CNN backbone to produce a shared feature map. Region proposals are mapped onto this feature map. Using an ROI (Region of Interest), the pooling process creates fixed-size feature vectors for each proposal, which are then used for classification and bounding box regression9. Faster R-CNN is similar to Fast R-CNN, but it combines Fast R-CNN’s processes with an RPN (Region Proposal Network). RPN uses anchor boxes with different scales (small, medium, large) and aspect ratios (square, landscape, etc.) to help the algorithm identify various shapes and sizes. The system adjusts the anchors to fit the proposed object more tightly and uses Non-Maximum Suppression (NMS) to filter the suggested scales and ratios9. Mask R-CNN, the latest model in the R-CNN family, extends the R-CNN framework by using RoIAlign to accurately extract features from regions of interest and generate pixel-level masks that define object shapes and classifications10.
Detection methods based on transformers
The original transformer model was not designed for object detection but rather for natural language processing (NLP), specifically for machine translation. It was first introduced in 2017 by Google researchers, who focused on using a self-attention mechanism to process sequences simultaneously. This method differed from previous neural networks, which processed data word by word11. Additionally, vision transformers, introduced in 2021, offer an alternative to conventional object detection methods and Recurrent Neural Networks (RNNs) by leveraging the transformer architecture. Vision transformers transform images into sequences composed of different patches, which are then flattened into a vector. Then, classification predictions enable the model to learn image structure independently12.
In this paper, I will focus on a specific transformer-based model, DETR, developed in 2020 by Nicolas Carion at Facebook AI. DETR uses a unique encoder-decoder architecture to establish a global relationship between object queries and image features, enabling it to predict class labels and bounding boxes. An advantage of DETR is that it doesn’t require hand-crafted anchors or post-processing steps, such as Non-Maximum Suppression (NMS). It also has a relatively higher efficiency than Faster R-CNN and other CNNs, yet lacks superior speed. Additionally, DETR does not need any custom layers, allowing for easy changes to the model. Finally, new DETR models, such as RT-DETR, strike a balance between speed and accuracy while also enabling real-time performance in cases13.
General Aviation Challenges
Although aircraft have become the safest mode of travel, inherent risks still threaten daily aviation operations. For instance, aviation safety is not consistent worldwide, as developing countries often have more lenient aircraft regulations, guidelines, and rules. Poor maintenance, older aircraft, weak infrastructure, and limited pilot training in many developing countries pose a serious challenge to worldwide aviation safety. Furthermore, missing or incomplete data due to data-sharing limitations and confidentiality concerns has become more prevalent, making it hard to calculate accident rates and identify high-risk segments. Additionally, terrorism remains a dangerous security challenge in aviation as agencies focus on balancing security and costs. Threats constantly evolve, but policy responses are often slow and resource-consuming14.
The primary challenge in modern aviation safety has proven to be human error. This is due to poor communication between pilots, crew, and ground control, coordination problems, and poor decision-making. Additionally, the high pressure and tight schedules that pilots face create stress and fatigue, degrading cognitive abilities. Also, maintenance errors on the ground during inspections, repairs, or installations can pose serious safety risks even before flight14.
AI in Aviation and Existing Collision-Avoidance Systems
Already, ML and DL systems are making an impact in aviation safety. On the ground, Air Traffic Management (ATM) utilizes large amounts of data to predict, avoid, and mitigate potential collisions. The ATM system employs machine learning algorithms to predict bottlenecks and suggest alternative flight paths. In contrast, deep learning models continuously track aircraft trajectories and velocities, alerting pilots to potential collisions1.
Additionally, AI can predict aircraft maintenance needs by analyzing historical performance and real-time sensor data to anticipate required replacements or safety checks. For example, in Rolls-Royce engines, sensors monitor engine health, detecting even tiny deviations in performance that could require maintenance. This process increases operational safety and saves valuable time. Furthermore, AI plays a role in anomaly detection in order to enhance aviation safety by flagging departures from expected performance patterns. These ML systems analyze flight data to identify any abnormalities that could lead to mechanical failure. The system provides greater situational awareness for pilots and ground control, alerting them to potential hazards as they occur1.
Artificial intelligence also helps optimize flight paths to save time and fuel. With increasing air traffic, static routing has become less effective at reducing fuel consumption and diverting planes from adverse weather. AI analyzes real-time factors such as weather patterns, air traffic congestion, and travel time, producing recommended routes for aircraft. In addition to saving fuel and time, passengers can enjoy a much more comfortable experience with reduced turbulence. Serving as a third pilot, AI can help in decision-making and operational control through pilot assistance and automation. DL models help pilots analyze complex scenarios in real time, providing credible insights and risk assessments. For example, DL models track take-off, landing, and airdrop risks, providing recommendations to pilots. Autopilot has also been impacted by DL models, which handle demanding maneuvers to preserve flight stability1.
Finally, with the increased use of digital systems in aviation for communication and navigation, cybersecurity has become increasingly important for ensuring industry safety. ML models detect anomalies in the system behavior that suggest potential attacks. Additionally, ML cybersecurity systems use pattern recognition to detect hostile Automatic Dependent Surveillance-Broadcast (ADS-B) messages that can disrupt air traffic control1.
TCAS, or the Traffic Collision Avoidance System, remains the primary system for preventing collisions. It uses sensors to determine the velocity and direction of incoming aircraft. The algorithm then calculates a possible collision and the appropriate response to avoid it. The TCAS system also communicates directly between planes, creating a complex data link. If the system identifies a potential collision, the model will alert the pilot through a warning light and suggest the necessary adjustments. These warnings range from a Traffic Advisory (TA), issued when an aircraft is on a collision course and has time, to a Resolution Advisory (RA), issued when the collision risk is urgent15.
Bird Strikes
Bird strikes remain a top threat to aviation, dating back to the 1900s, and have taken the lives of over 240 passengers. Statistics show that over 90 percent of bird strikes occur in the vicinity of the airport right after takeoff16. Additionally, the number of bird reports to the International Civil Aviation Organization (ICAO) from pilots has increased from 42,508 to 97,751 sightings per year. Even more concerning, over 75 percent of cases go unreported16.
On the ground, airports remove sources of water, food, and shelter, creating an environment that is uninhabitable for birds. Additionally, the industry uses nets, chemicals, covers, and even firearms to minimize bird activity around airports. These techniques have shown positive results; however, their efficacy is limited as birds adapt to this harassment. To address this issue in the sky, researchers have found that brighter colors help birds spot a plane from farther away; therefore, many liveries feature bright blues, yellows, and reds. Flashing or pulsing lights on aircraft, as well as bioacoustic sounds, also reduce bird sightings. Moreover, radar systems, satellite imagery, and air traffic controllers monitor and relay messages to aircraft via radio or Automatic Terminal Information Service (ATIS) messages16. Overall, bird movement has proven erratic and unpredictable, making it difficult for these systems to avoid collisions entirely.
Challenges in Methods, AI Implementation, and Collision Avoidance Systems
In object recognition, the challenge arises from the diversity and variability of individual images and datasets. ML and DL models rely on numerous datasets, and the volume of unstructured, heterogeneous data in the aviation industry further complicates the process17. Additionally, training these complex models takes a tremendous amount of energy and powerful, expensive GPUs, which makes it difficult to fully incorporate ML into aircraft18. More importantly, new AI technologies require rigorous testing to be ethically approved by the FAA and to meet stringent safety standards. Additionally, some pilots find it challenging to trust new AI systems and frequently doubt the accuracy of their corrections19.
Over the years, aviation collision avoidance systems have evolved into reliable and safe tools for directing and managing air traffic. Yet, issues still occur in these modern systems. The TCAS system can sometimes trigger false warnings, prompting unnecessary maneuvers that distract the pilot and disrupt air traffic. For example, the 2025 DCA anomalies caused an unusually high number of TCAS alerts at Reagan National Airport, resulting in delays and communication issues15. Additionally, pilots can become overly reliant on these systems, leading to costly and potentially deadly errors. The TCAS system also only detects other crewed aircraft, not birds, debris, or autonomous aircraft (which often confuse it), because it relies on communication between aircraft. Finally, the lack of system integration with older aircraft, combined with the need for constant maintenance, increases overall costs15. This experiment aims to solve some of these issues.
Methodology
Collecting Dataset
In this project, the dataset serves to evaluate the pre-trained model’s performance in aviation contexts. One of the primary challenges in creating the dataset was the limited availability of high-resolution images for model testing. This is due to the lack of high-quality photos taken from the aircraft’s perspective. Additionally, many photos included parts of the central aircraft, such as wings, that confused the model. Furthermore, the model required multiple specific angles and perspectives that simple online images could not provide. To address this issue, AI was used to generate the needed data. After identifying three high-quality reference images, Adobe Firefly and ChatGPT were used to generate the majority of the dataset. To generate the photos, the AI was provided with a general prompt and the reference photos. Some of these prompts included: “sky full of clouds with aircraft several miles away”, “sky with two airplanes in background at night time”, “sky with an airplane from a below perspective”, “sky with an airplane from above perspective”, “sky with airplane from cockpit point of view”, “sky with airplane view from behind”, and “sky with airplane with rain and dark clouds”. The ultimate goal is to create a unique yet uniform dataset that can effectively challenge the model. These steps were then repeated to generate images with flocks of birds. Some prompts include: “flock of birds in sky with clouds in the background”, “flock of over 50 birds in sky with clear background”, “Small flock of birds with less than 5 in the sky”, “Visible flock of birds at night in sky”, “White/black/grey birds in sky with clouds”, and “flock of birds in sky with thunder storm”. The end goal remains the same: generate the most unique yet usable dataset. Finally, the model must be able to identify photos that contain neither birds nor aircraft to avoid false alarms. To generate this dataset, prompts such as “sky with clouds”, “sky with clouds at night”, “empty sky”, “empty sky at night”, “sky with storm clouds”, and “sky with stars” were used. Because AI-generated images may not fully represent realistic flight conditions, websites such as iStock and Getty Images were used to obtain supplementary photos of real aircraft and birds in flight. In total, 146 photographs were used. Eighty-five photos contained birds and airplanes, each with unique angles, perspectives, times, and weather conditions. Additionally, 61 negative photos contained neither aircraft nor birds. Of the 146 photos, 50 positive and 40 negative were generated using AI. I recognize that AI-generated images may introduce inaccuracies, but in the future, live video and photos from aircraft will strengthen the dataset by providing more realistic conditions.
Model selection – Bird and aircraft detection using DETR
DETR Architecture
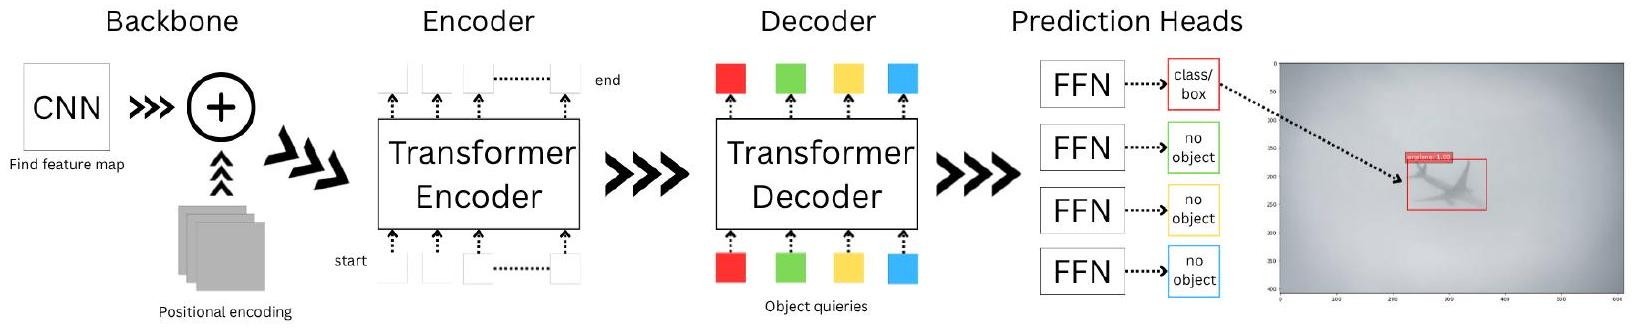
After careful consideration and analysis of the literature review, I’ve concluded that the most suitable model for this experiment is the DETR transformer model. The DETR process contains three key steps. First, the model runs the dataset through a CNN backbone to extract the feature map, followed by an encoder-decoder transformer and a feed-forward network (FFN) that are used to make the final prediction20. The primary purpose of the backbone is to identify edges, shapes, and patterns, thereby capturing global relationships between image patches. After the CNN backbone, the model continues to the transformer encoder. First, the feature map is reduced to enable a linear transformation that lightens it. Because transformer models only take 1D inputs, the map is flattened into a “token”. However, the model requires additional assistance in locating these patches or tokens. The model adds a position to each token, known as positional encoding. Then, the token is fed into the transformer encoder layer by layer, where the model captures similarities and connections between tokens. This new information is then taken to the decoder21.
The decoder’s job is to process an object’s queries to locate it within the image. First, the model obtains N object queries, which are questions that help the algorithm identify an object. To process these queries, the model uses two attention techniques: self-attention and encoder-decoder attention. In self-attention, all object queries communicate with one another to prevent duplicate detections while allowing the model to understand how objects compare and contrast. In the encoder-decoder attention, the queries attend to the image features from the transformer encoder mentioned above. This is used to find the image’s location. Ultimately, each N query will yield an output embedding that represents the computer’s understanding of what an object may be.
After the decoder process, the N output embeddings are passed to the network’s final prediction heads. A shared 3-layer feed-forward network (FFN) predicts the bounding box coordinates for each object query by outputting four values: the center x , center y , width, and height. At the same time, a separate classification head predicts the object class for each query, including a special ‘no-object’ ( ) class to indicate queries that do not correspond to any object. The final detections are obtained by combining the outputs of both heads22. After that, a loss function is needed to compare the model’s prediction with the ground truth.
DETR Loss Function
This DETR model uses a fixed set of N predictions per decoder pass, where N is set much larger than the average number of objects in the photo. This makes it hard to identify objects that match the ground truth. The loss function used creates an optimal bipartite matching between the predicted and actual objects.
![\[\hat{\sigma} = \arg \min_{\sigma \in \mathfrak{S}_N} \sum_{i}^{N} \mathcal{L}_{\text{match}}\left(y_i, \hat{y}_{\sigma(i)}\right)\]](https://nhsjs.com/wp-content/ql-cache/quicklatex.com-e4ac42603f19c3bb83f4d6ffd409a604_l3.png "Rendered by QuickLaTeX.com")
The equation above illustrates the Hungarian algorithm, which facilitates matching predictions to ground truth as the model learns to improve its accuracy. First, there is a Y ground truth ( ) that represents the model’s predictions. Most of these N predictions will be no object” as most photos contain around 1-5 objects. To match predictions to the ground truth, we utilize the Hungarian algorithm. Each object is represented by
  where
where  is the class and
  is the bounding box. Then, the models predict a class, generating a confidence score, as well as a bounding box, the model’s estimated location. After finding these values, we can then calculate the
  using the formula
  . This formula helps find the cost of matching a ground truth to a prediction. This process of finding one-to-one matches without duplicates becomes essential when moving on to the loss function6.
![\[\mathcal{L}_{\text{Hungarian}}(y, \hat{y}) = \sum_{i=1}^{N} \left[ -\log \hat{p}_{\hat{\sigma}(i)}(c_i) + \mathbf{1}_{{c_i \neq \varnothing}} \mathcal{L}_{\text{box}}(b_i, \hat{b}_{\hat{\sigma}(i)}) \right]\]](https://nhsjs.com/wp-content/ql-cache/quicklatex.com-841eb66d4771992b40e3c676b6027f9d_l3.png "Rendered by QuickLaTeX.com")
The equation above represents the Hungarian loss function used in this DETR model to compute the total loss. This formula is made of two parts: class loss and box loss. The first part of the formula is the classification loss,  , which quantifies the model’s overall confidence in its classifications. If the model’s prediction is wrong, the formula will punish the model. If the model gets a no object” wrong, there is a down-weight punishment of 10, meaning that the formula won’t punish the DETR as much. The second part of the formula,
  ,deals with the box loss, or how far off a predicted box is from the ground truth. Afterwards, we must normalize the total loss. This process involves dividing the formula by the number of real objects in the photo to ensure the resultant value is neither too large nor too small9.
Implementation Details
To set up the model, a pre-trained DETR-resnet-50 model from Hugging Face, trained on the COCO 2017 dataset (330,000 + images), was used. Additionally, I performed only inference on the model, without any specific fine-tuning or modification. This is to ensure whether this general-purpose model can detect aviation objects without aviation-specific training. Because only inference is performed without ground-truth bounding box annotations, standard IoU-based mAP metrics cannot be computed. Instead, I manually verified each image for the presence or absence of airplanes and birds, and counted the number of objects. Then, true positives (correct detections), false positives (incorrect detections), false negatives (missed objects), precision, and recall were calculated. I acknowledge that this process is coarser than standard bounding box precision metrics, but it is appropriate given limited resources. I also recognize that 2D boxes from uncalibrated monocular images cannot provide accurate range without camera calibration, object size priors, or sensor fusion
The model was evaluated using Google Colab on a MacBook Pro with a Tesla T4 GPU. Furthermore, the framework utilizes PyTorch with Hugging Face Transformers and an input resolution of 800 x 800 pixels (DETR standard). Below are the code for the specific model, the model link, and a Google Drive link to the dataset used.
Links to Code, Model, and Dataset
Link to code:
https://colab.research.google.com/drive/1uRELZqAs0SLuaUF18B75AsBMPXgME3Qn?usp=sharing#scrollTo=Act2kffEQC
Link to the model: https://huggingface.co/facebook/detr-resnet-50
Link to Dataset: https://drive.google.com/drive/u/0/folders/1v87QhquMP5RysdWv02gWbTZJDBGB3-GS
Results
Quantitative Results
After running the model, the following data were collected. Three metrics were used to evaluate the model: precision, recall, and F1. Precision measures the proportion of predicted positives that are actually correct (higher the better). This measure is used when the cost of a false positive can be severe. Recall measures how many of the actual positive cases were accurately detected (the higher the better). Like precision, this measure helps avoid false negatives that could lead to catastrophes. Below are the equations for each metric.
![\[\text{Precision} = \frac{\text{True Positives (TP)}}{\text{True Positives (TP)} + \text{False Positives (FP)}}\]](https://nhsjs.com/wp-content/ql-cache/quicklatex.com-86f18a280a2a888a7752fd7676091c7a_l3.png "Rendered by QuickLaTeX.com")
![\[\text{Recall} = \frac{\text{True Positives (TP)}}{\text{True Positives (TP)} + \text{False Negatives (FN)}}\]](https://nhsjs.com/wp-content/ql-cache/quicklatex.com-1ee80390f74c8db72c9583295dbdf049_l3.png "Rendered by QuickLaTeX.com")
F1 provides a balanced measure between precision and recall using the equation below (the higher the value, the more balanced). This metric is helpful when a single numerical digit is needed.
![\[F_1 = 2 \times \frac{\text{Precision} \times \text{Recall}}{\text{Precision} + \text{Recall}}\]](https://nhsjs.com/wp-content/ql-cache/quicklatex.com-8c90ce8d510e991e431016e179c1773c_l3.png "Rendered by QuickLaTeX.com")
| Dataset amount: 146 | Airplane | Bird |
| Precision | 0.88 | 0.85 |
| Recall | 0.92 | 0.79 |
| F1 | 0.90 | 0.81 |
For airplane detection, the data indicate that the model is reliable, as it achieves precision, recall, and F1 scores in the upper quartile. For precision, recall, and F1, a 80% threshold is considered acceptable for general detection models; all collected data exceed it. For bird detection, precision, recall, and F1 are inferior yet above average, as expected. Birds are harder to detect because they are much smaller and often travel in large flocks. For airplanes, 88% precision corresponds to a 12% false-alarm rate. For birds, 85% precision corresponds to a 15% false-alarm rate. In aviation contexts, false alarms can cause pilot distraction, unnecessary evasive maneuvers, alert fatigue, and loss of trust in the system. It is important to determine acceptable false alarm rates, a task that requires human factors expertise and pilot input. At the same time, the current results indicate that further improvement is needed, particularly in reducing false alarm rates through additional optimization. These issues are further investigated in the error analysis section. Furthermore, the model took approximately 12 minutes to process 146 images, with each image taking approximately 5 seconds. This raises concerns because the model must operate much faster to be effective in real-world flight.
Additionally, different thresholds were tested to examine the trade-off between detecting threats (recall) and avoiding false alarms (precision). The original threshold used in the first experiment is 0.5.
| Threshold | Airplane Precision | Airplane Recall | Bird Precision | Bird Recall |
| 0.3 | . 88 | . 93 | . 73 | . 79 |
| 0.5 | . 88 | . 92 | . 85 | . 79 |
| 0.7 | . 91 | . 91 | . 85 | . 79 |
Thresholds are numerical cutoffs that help reduce false positives and minimize missed detections. The higher the threshold the more precision but less recall or threats detected. On the other hand, lower threshold helps increase recall or false negatives but lowers precision or false positives. It is important to understand these trade-offs as different thresholds are used based on the needs of a specific project or model. In the aviation industry, false negatives can lead to catastrophic failure and even death, meaning a lower threshold would maximize detection in high-risk scenarios. At the same time, objects that evade detection by the detection model can lead to pilot error and an unsafe environment. As a result, further investigation is needed using real, in-flight data to optimize the threshold number.
Qualitative Results
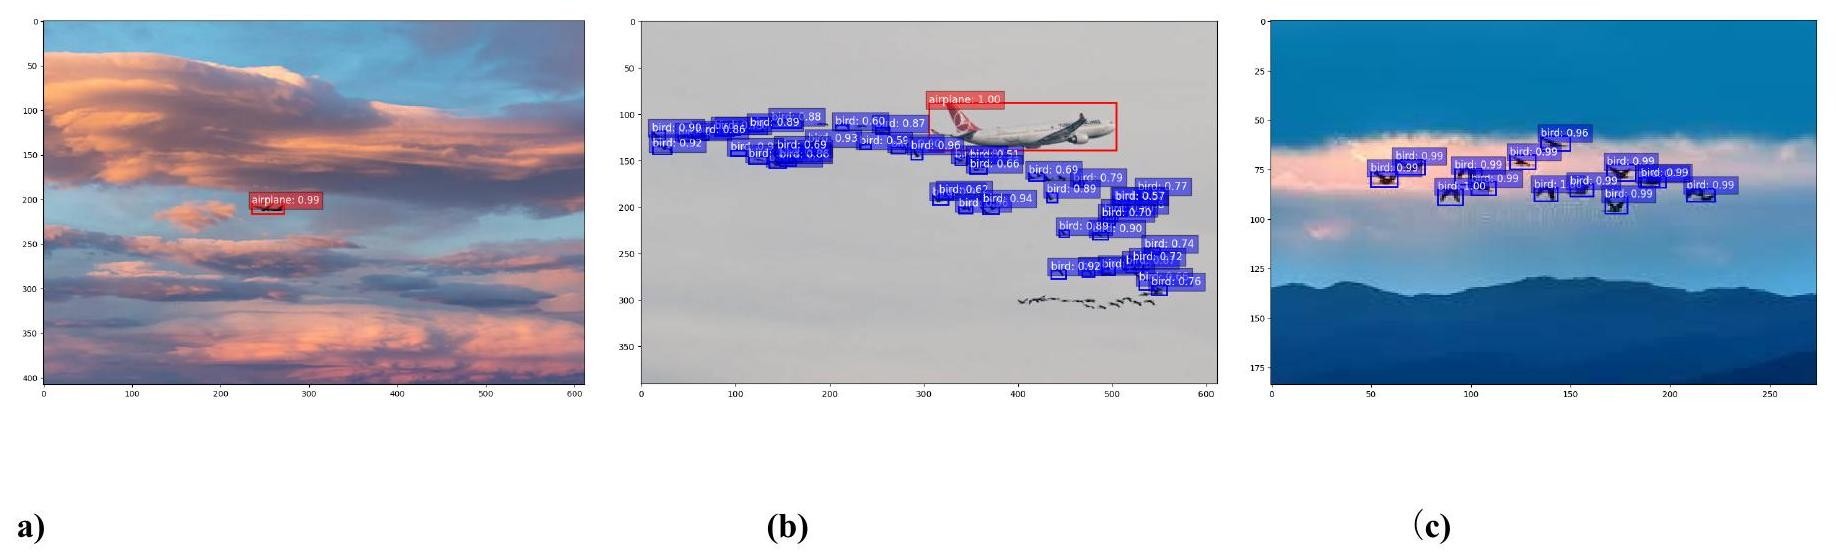
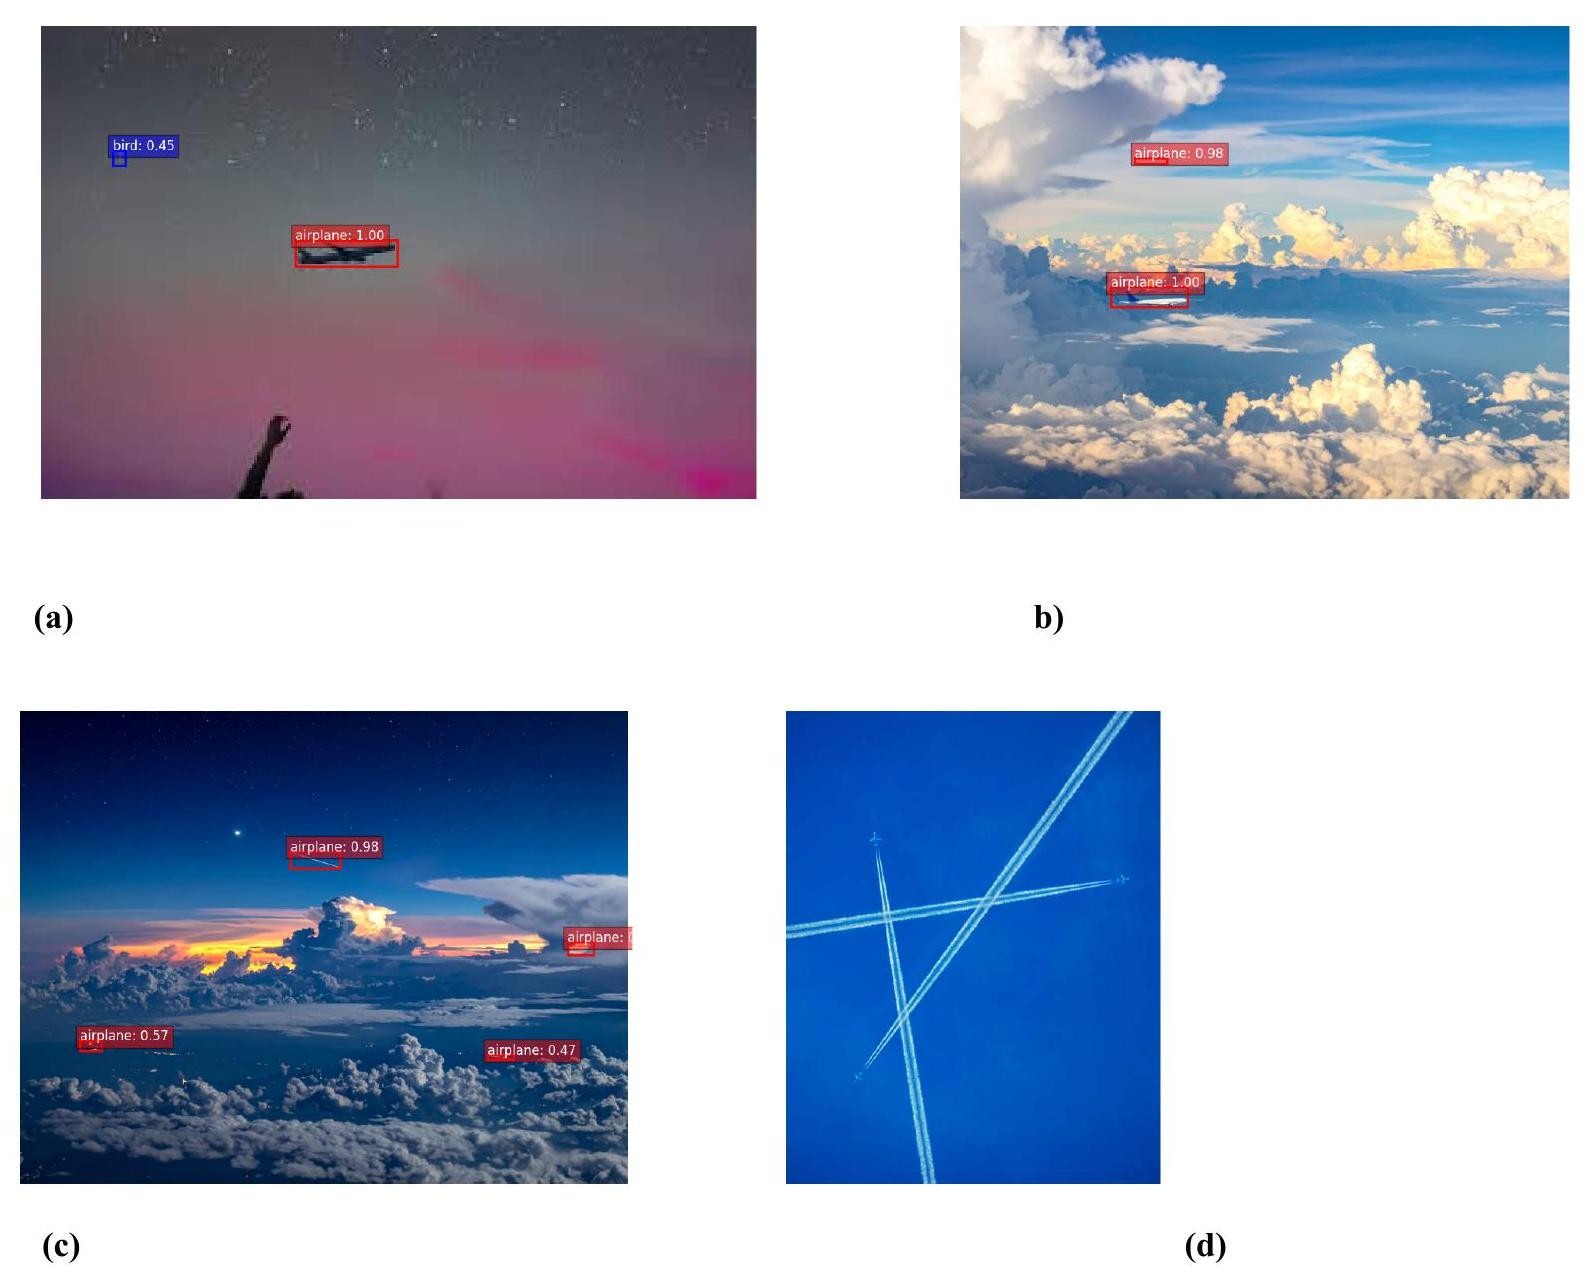
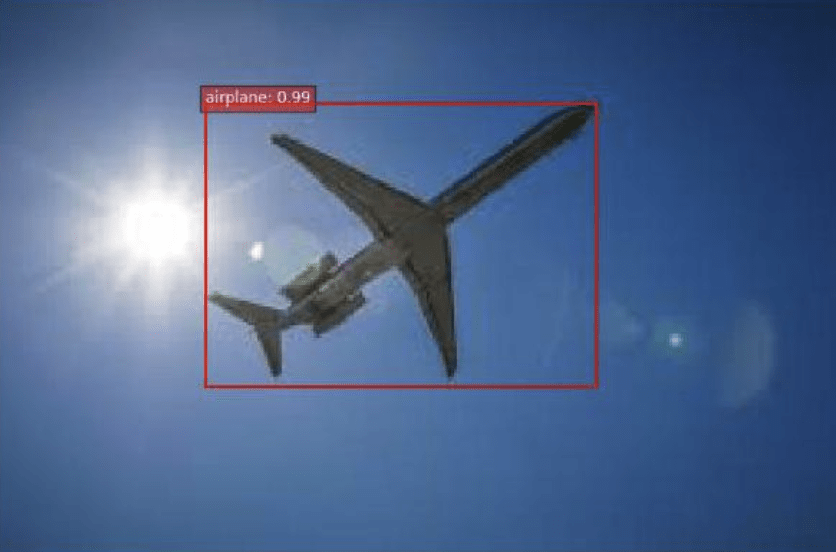
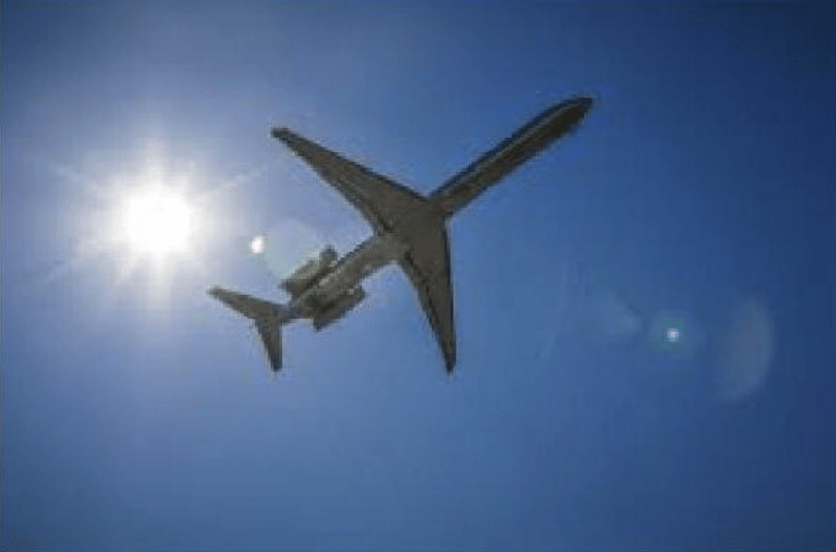
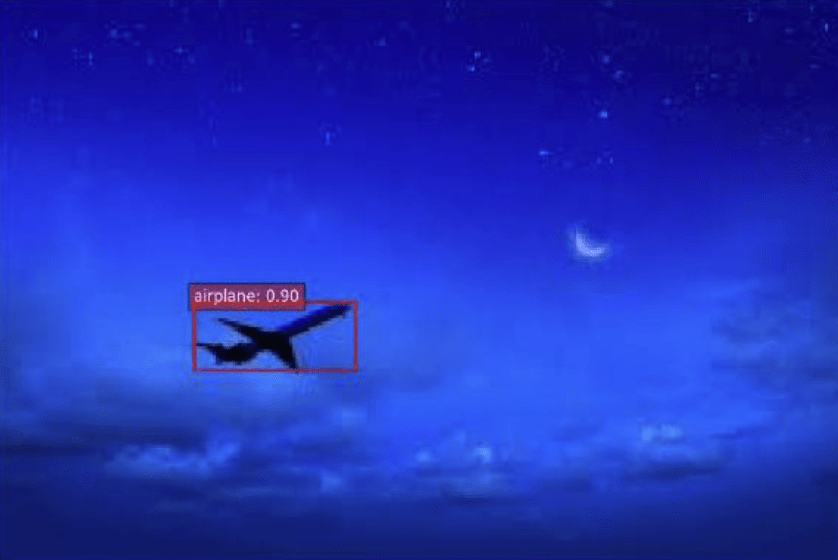
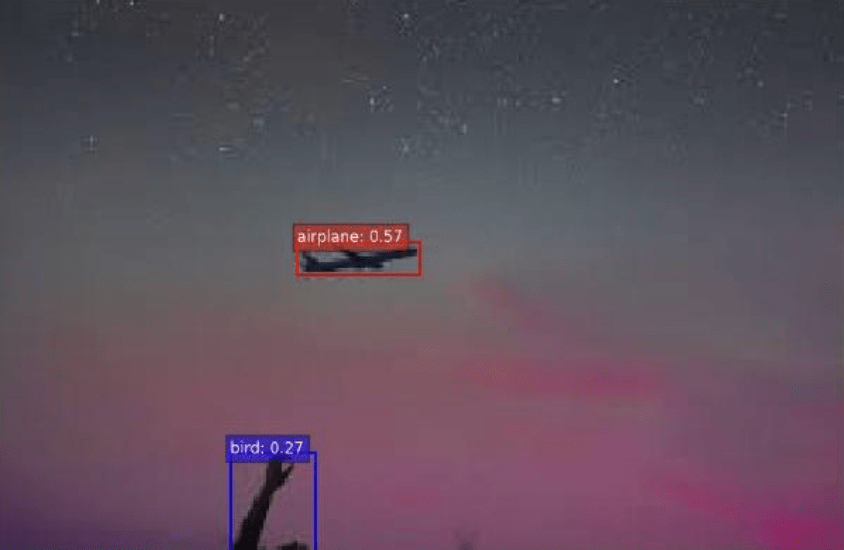
Below are examples of the algorithm’s final output. The outputs display bounding boxes that indicate the predicted object class and its corresponding aligned confidence score. Additionally, the bounding boxes provide the model’s confidence percentage. The higher the number, the more confident the program is that the identified object is the ground truth. When detecting aircraft, the model performs well in identifying airplanes across varying scopes and under different weather conditions at different times of day. As shown in Image A, the model can identify an aircraft from a sufficient length, giving the pilot enough time to react.
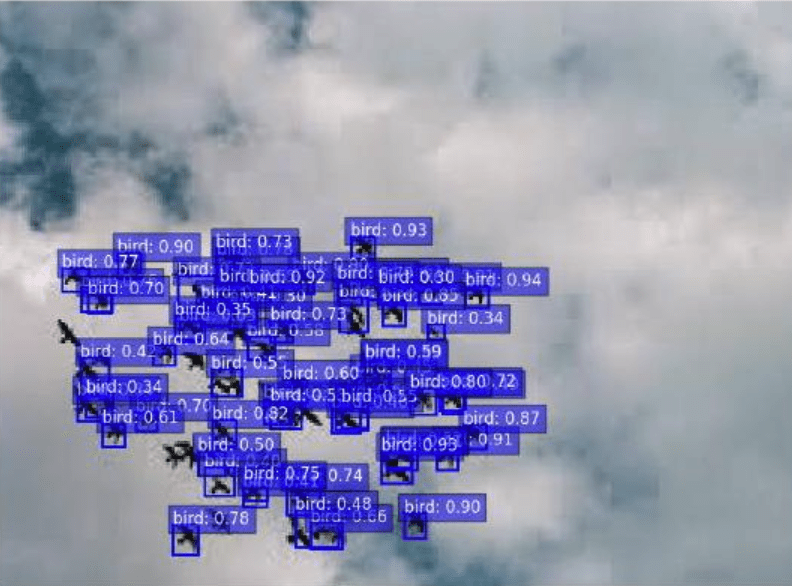
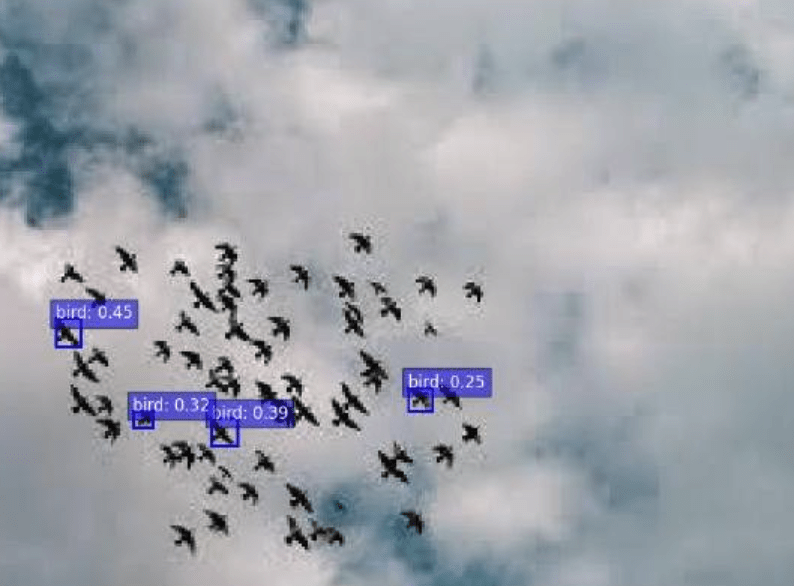
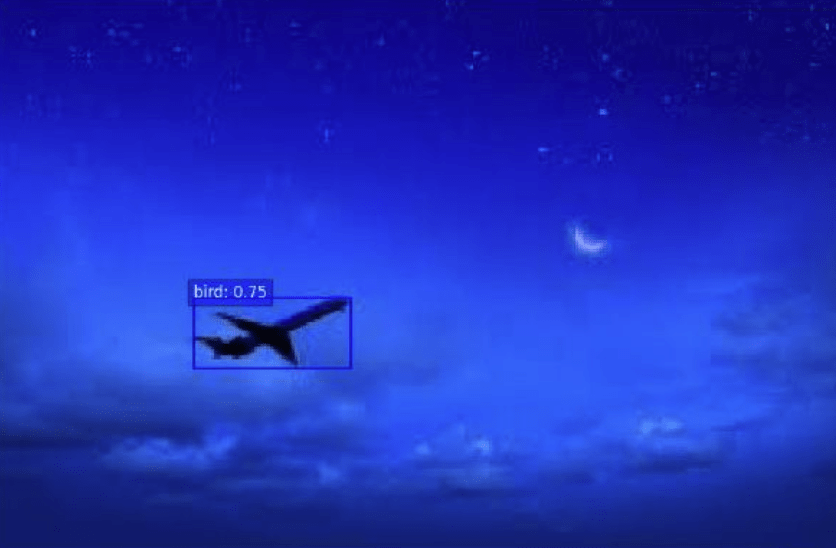
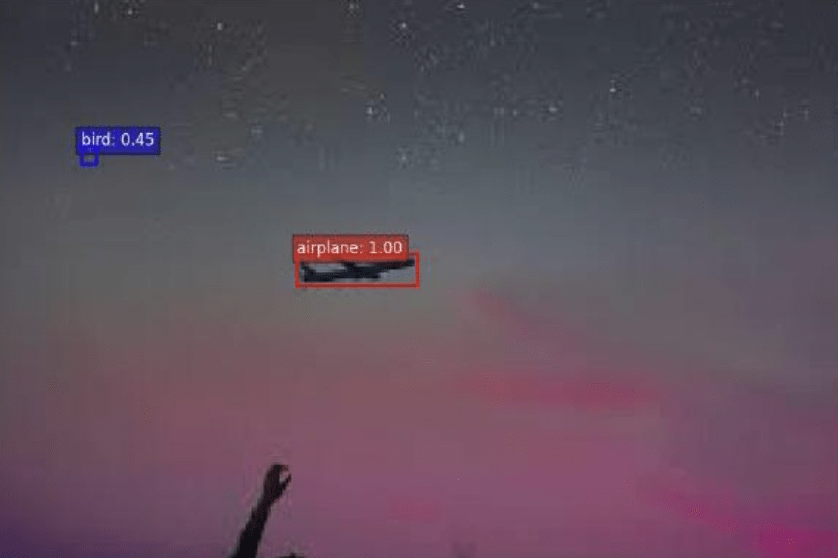
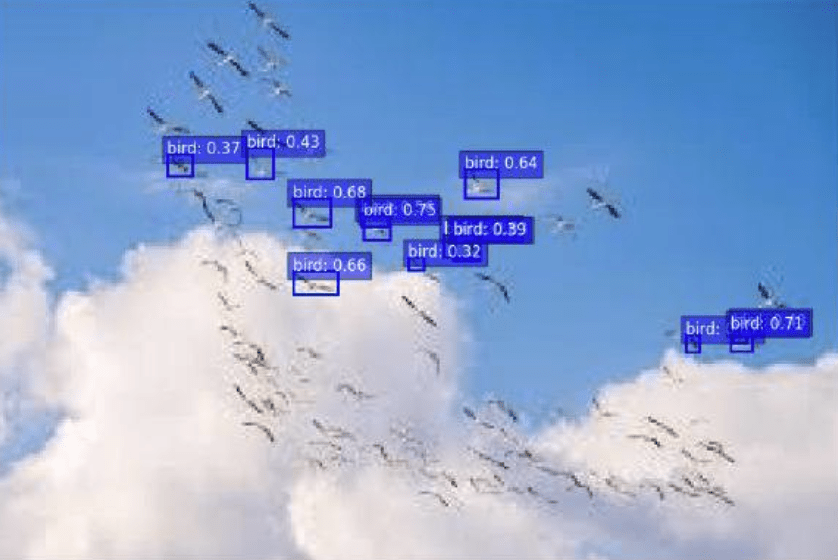
On the other hand, bird detection proved to be more challenging. Because birds are much smaller and travel in larger groups, the model had trouble detecting every bird with high confidence. Shown below in image B, most of the birds were identified with a relatively positive confidence rate, yet some birds failed to be detected. At the same time, birds in much smaller packs, as shown in image C , are easily detected by the model with high accuracy. When observing photos with both plants and birds, the model performs quite efficiently. As shown in Image A, the model clearly distinguished between planes and birds. However, the model often confused aircraft with birds when they were far from the origin, as they blended in with the flock. Overall, the promising qualitative results and visual outputs prove that this technology can be helpful in the aircraft industry given future research.
Error Analysis
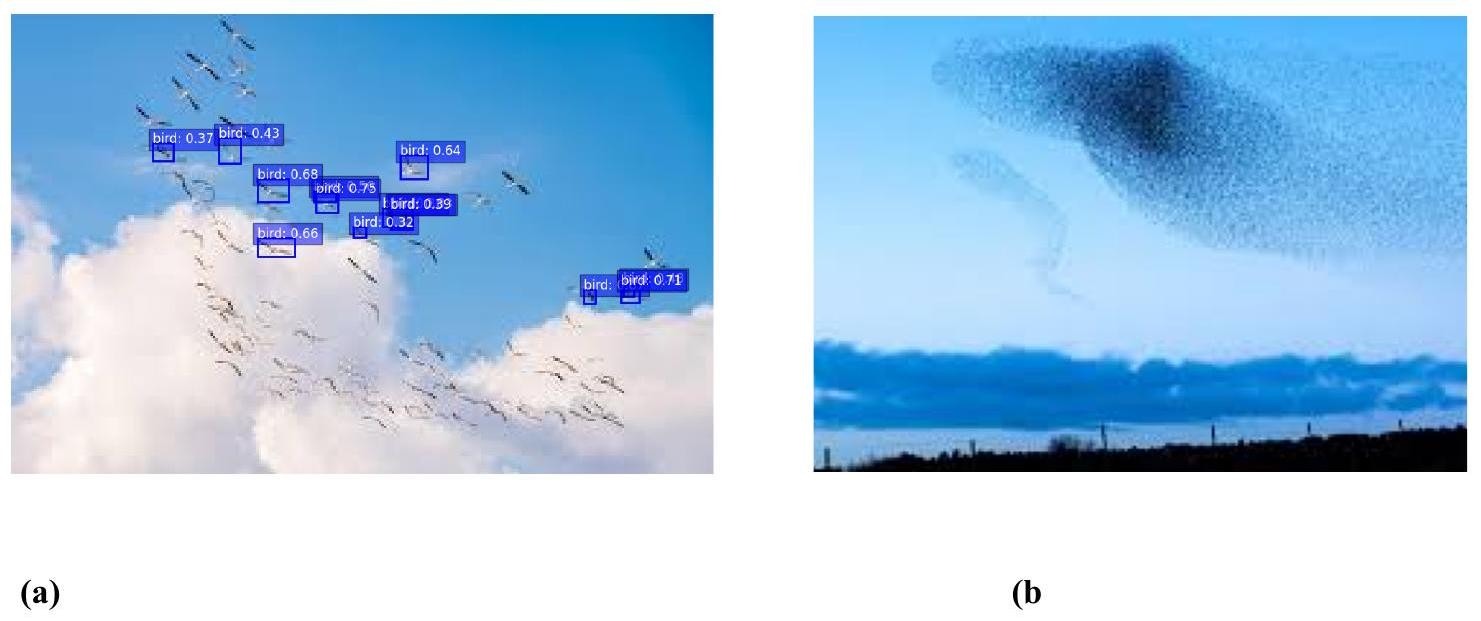
Although the model demonstrates initial success, testing also revealed critical issues that could affect its performance. A primary issue is the model’s failure to detect all birds within an area. It is important that the model captures every bird, as flocks often spread, diverge, and move in highly unpredictable ways. As shown in example A, the main issues are the camera’s quality and the bird’s small size. Additionally, overlap is a significant issue; if the bird flock becomes too dense, the model cannot detect the birds shown in example B. Finally, certain backgrounds, such as clouds or grey skies, obscure the birds and reduce detection accuracy. As a result, precision and recall remain below average.
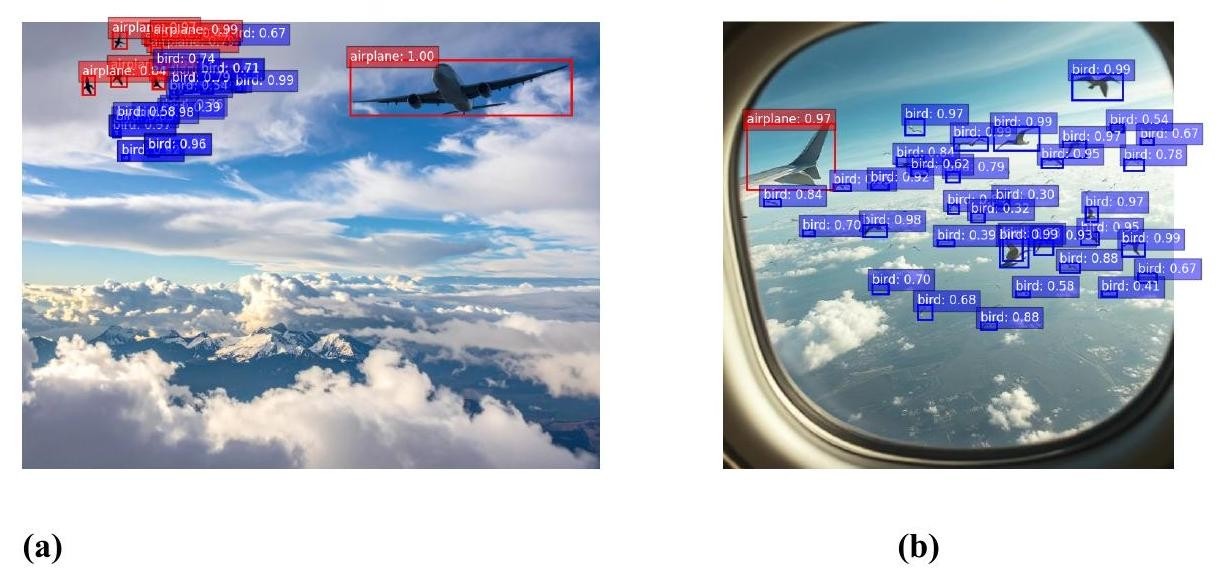
Another flaw in the model is its confusion between distant planes and a flock of birds when both appear in the same frame. Overall, the system performed relatively well at distinguishing birds from planes in the same photo, but errors still occurred. When objects appear small in the frame, birds and planes can be confused with each other, especially in low-quality photos and poor lighting, as shown in example A. Additionally, the overlap of birds and planes in a photo poses a challenge for the detection model. Additionally, Photo B emphasizes the importance of excluding the central plane from the dataset, as the model will treat it as a separate entity. These issues raise the question of whether separate detection models should be trained for planes and birds, rather than combining them into a single model.
After analyzing the results, the main issue and safety concern remain false positives and negatives, primarily due to the natural background. For false positives, the model often detects parts of the environment, such as clouds, streaks, or stars, as planes, shown in photos A, B, and C . On the other hand, planes and birds can blend into the environment, leading the model to fail. In addition, some aircraft produce contrails (the white lines left behind when flying), as shown in photo D, which can limit the model.
These failures lead to the conclusion that the farther the birds and planes are from the central aircraft, the more difficult it is for the model to accurately detect and identify them. This is concerning because distant threats need the earliest warning. The lack of high-quality photos/camera and real-world examples necessitates further testing with in-flight footage captured using high-end cameras. With this new dataset, the model can be tested under real-world conditions to assess whether these errors persist in actual flight across varied weather conditions and environments.
| Error Category | Count | Percentage |
| Small/distant objects and environment | 11 | 55% |
| Ambiguous (plane vs bird) | 2 | 10% |
| Poor quality of image | 1 | 5% |
| Occlusion (object partially hidden) | 1 | 5% |
| Dense overlapping objects | 5 | 25% |
As shown in the data table, the most frequent errors were false positives and negatives, attributable to birds and aircraft appearing at smaller scales in the image, leading to many clouds, stars, and other objects being misclassified.
YOLO Comparison
To compare the DETR model’s performance with other models and outline its advantages, I ran a YOLOv8 detection model on the same dataset using the same metrics. Below are the results for detection performance and speed comparison.
| Model | Airplane Precision | Airplane Recall | Bird Precision | Bird Recall | Airplane F1 | Bird F1 |
| DETR | . 88 | . 92 | . 85 | . 79 | . 90 | .81 |
| YOLO | . 88 | . 81 | . 67 | . 71 | . 85 | . 69 |
| Model | Total Time (min) | Time per Image (seconds) | Real-time capable (.03s) |
| DETR | ~12 | ~5 | No |
| YOLO | ~2.5 | ~1 | No |
As shown in Table 4, the DETR model performs at least as well as, and in some cases better than, the YOLO detection model in terms of quantitative detection performance. Although the airplane precision remains constant, the DETR airplane recall outperforms by 11 percent, a significant amount. In addition, the F1 model achieved a 5 percent higher DETR score than YOLO. For bird detection, the DETR model outperforms all other models across all categories. The DETR model exceeds YOLO’s bird precision by a substantial 18 percent and its bird recall by 8 percent. In addition, the DETR F1 score for birds exceeds that of the YOLO model by 12 percent. To analyze the reason for DETR’s superiority, one must examine the qualitative results shown in Figure 6.

As shown above, the YOLO model failed to detect as many birds across multiple images and missed entire flocks of birds. Additionally, YOLO often misclassified birds as planes and sometimes failed to detect entire aircraft. Overall, the YOLO often struggles with dense images in dark, claustrophobic backgrounds. Unlike YOLO, DETR employs an attention mechanism that captures relationships among all elements in an image, enabling the model to interpret more complex, crowded scenes. Due to its transformer architecture, DETR often achieves higher precision than one-stage, CNN-based YOLO models. Finally, DETR does not employ a Non-Maximum Suppression system, which yields cleaner and more accurate detections. These consistent YOLO errors justify the model’s poor performance and support the validity of DETR-based detection for this purpose.
When examining speed-based quantitative results, the YOLO functions must be faster than the DETR model. For the DETR model, processing each of the 146 images required more than 12 minutes, with 5 seconds per image. On the other hand, the YOLO model required only 2.5 minutes and 1 second per photo to complete detection. At the same time, neither model meets the preferred .03 secs per photo, the optimal time for real, in-flight detection. Although YOLO performs faster, DETR proves more accurate. In the aviation industry, accuracy is the most important metric for ensuring safety, thereby justifying DETR’s superiority. Additionally, real deployment would require optimized versions, such as RT-DETR and the lightweight YOLOv8, on more powerful GPUs. As detection models improve, detection time and accuracy will also improve, potentially meeting the required performance standards.
Link to code:
https://colab.research.google.com/drive/1uRELZqAs0SLuaUF18B75AsBMPXgME3Qn?usp=sharing#scrollTo=3PyIhwShhA
Discussion
The performance of this DETR model provides a series of lessons and feedback through the challenges and results of detecting and identifying birds and aircraft. To do so, it is crucial to analyze the study’s architecture, methods, and results to understand the project’s impact. Overall, the model performed well. Only after the first trial did the precision and recall scores for all results exceed the 80 percent average, except for one. These results help demonstrate that deep learning AI models have the potential to be utilized to enhance pilot awareness and prevent air collisions.
This DETR model is unique in that it generates a visual representation indicating presence and identifying the exact object that poses a threat to the central aircraft. Compared to the existing TCAS system, it currently lacks the robustness and reliability required for direct implementation. At the same time, the TCAS system does not provide the pilot with a visual representation of potential collision courses; instead, it uses flashing alerts. The unique visual component of the DETR model is the primary focus of this research project.
Overall, future research and development can turn this project into a real, impactful resource for the industry. With a faster DETR model and additional systems, we can enhance pilot awareness by creating a 3D/360-degree visual feature map that detects incoming objects within a specified radius. To make this possible, authentic in-flight videos remain a top priority for turning this idea into reality. This would require testing different cameras at different angles and locations on the aircraft, as well as programming the model to handle video analysis. Before initiating video analysis, camera placement, field of view, resolution, frame rate, environmental protection, and day/night capability must be addressed on the actual aircraft in order to obtain 360 -degree coverage. Next, we must incorporate the existing systems with the new DETR addition and analyze its results. Furthermore, other airborne objects, such as drones, helicopters, and space debris, should be integrated into the model. Additionally, the programming can incorporate an alarm system and AI suggestions when potential collisions are detected. This technology has the potential to revolutionize the way we view aviation safety by enabling pilots to make decisions more quickly and efficiently than ever before.
Limitations
Although this experiment shows promising results, applying the method to real-life situations has its limitations. First, the model must adapt to video analysis, which can affect its efficiency and speed. Other issues arise with the limitations of aircraft’s GPU systems. Many aircraft cannot support sophisticated GPU systems that run at such high rates. If this technology were implemented, it would require additional onboard hardware, which could affect power consumption, heat generation, and aircraft weight.
Regarding the dataset, I used a limited evaluation set (146 images) to test the model. To implement this project at scale, a dataset of 1000-plus reliable images is needed. Additionally, this small sample size makes precision and recall
estimates less reliable and accurate. Furthermore, 50 images were created using AI due to the lack of high-quality, real flight images. AI-generated images may not accurately capture conditions and can present abnormalities within each photo. Additionally, a lack of environmentally diverse images, such as rain, fog, and night conditions, motion blur, or high-altitude effects within the dataset limits the overall analysis of the model.
In the methodology sections, I used an inference-only approach with a pre-trained model, with no aviation-specific fine-tuning, which likely limits its performance in detecting aircraft-related objects under certain conditions. Additionally, I used only static images, without any video processing, which is a critical requirement for real-world applications. Also, a processing speed of 5 seconds per image is far too slow for real-time standards of 0.033 seconds per image (30 frames per second). Finally, this paper focuses only on whether detections were present, rather than on precise bounding-box accuracy, which limits the depth of the analysis.
Regarding overall performance, the bird detection recall of 79 percent indicates that 21 percent of bird groups are missed, which is insufficient for safety-critical applications. Mentioned in the error analysis section, the model often confuses distant aircraft with bird flocks. Although the false alarm rates (12-15%) recorded in the study are within an acceptable range for detection models, they may be unacceptable for real operational use. In this research paper, no direct comparison between TCAS and alternative detection systems was conducted, nor was any integration architecture with existing avionics. There was no assessment of the model against FAA safety standards or certification requirements, as I lack professional expertise in aviation engineering and safety. Finally, further testing is needed to complete hardware integration, define the deployment pathway, or produce safety documentation. This work demonstrates the technical feasibility of the detection approach. Deployment would require validation using real flight data, video-processing capability, optimization for aircraft-grade hardware, professional safety analysis, FAA certification, and systems integration by aerospace engineers.
Conclusion
This proof-of-concept study demonstrates that pre-trained object detection models can identify airplanes and birds in aviation context images with reasonable accuracy. The DETR model results show precision of 88% for aircraft and 85% for birds, and recall of 92% for aircraft and 79% for birds, both of which meet or exceed the standard precision and recall thresholds of approximately 80%. These findings demonstrate that deep learning models have the potential to significantly enhance aviation safety by improving pilot awareness, allowing them to allocate more time to other essential tasks. This suggests the approach warrants further investigation by professional aviation engineers. However, I acknowledge that substantial additional work is required before practical deployment, including: validation on real flight footage, video processing, optimization for aircraft hardware, comprehensive safety analysis, and regulatory certification
Continuously improving, AI remains the fastest and most accurate tool for minimizing catastrophic and unfortunate accidents across multiple industries. At the same time, the current TCAS system remains a highly safe and reliable tool that continues to improve. As a result, this DETR model should build off the TCAS principles, serving as a complementary enhancement to existing systems rather than replacing them. For example, the DETR model could implement a visual component to the system and provide a 3D map of the aircraft’s surroundings. To further develop this project, authentic in-flight videos taken from different angles remain a top priority. Furthermore, additional research and testing are required to evaluate how this system can be integrated with TCAS, ensuring that both systems operate in coordination without generating conflicting alerts. In closing, this study suggests that this technology could be beneficial for aviation applications, pending further research and validation.
References
- W. Ahmed, “Artificial intelligence in aviation: A review of machine learning and deep learning applications for enhanced safety and security,” Intelligence, vol. 3, 2025. [↩] [↩] [↩] [↩] [↩]
- M. H. Moghimisfandabadi, M. H. Djavareshkian, and S. Abedi, “Significance of aviation safety, its evaluation, and ways to strengthen security,” International Journal of Reliability, Risk and Safety: Theory and Application, vol. 6, no. 2, pp. 37-45, 2023. [↩]
- I. Aziz, “Deep learning: An overview of convolutional neural networks (CNN),” M.S. thesis, Faculty of Information Technology and Communication Sciences, 2020. [↩]
- O. I. Obaid et al., “Comparing the performance of pre-trained deep learning models in object detection and recognition,” Journal of Information Technology Management, vol. 14, no. 4, pp. 40-56, 2022. [↩]
- Z. Guo et al., “Village building identification based on ensemble convolutional neural networks,” Sensors, vol. 17, no. 11, 2017. [↩] [↩]
- T.-Y. Lin et al., “Feature pyramid networks for object detection,” in Proc. IEEE Conf. Computer Vision and Pattern Recognition (CVPR), 2017. [↩] [↩]
- I. B. Hassani et al., “From YOLO V1 to YOLO V11: Comparative analysis of YOLO algorithm,” International Journal of Electrical and Computer Engineering (IJECE), vol. 16, no. 1, pp. 450-462, 2026. [↩]
- T. Evgeniou and M. Pontil, “Support vector machines: Theory and applications,” in Advanced Course on Artificial Intelligence, Berlin, Germany: Springer, 1999, pp. 249-257. [↩]
- S. Ren et al., “Faster R-CNN: Towards real-time object detection with region proposal networks,” in Proc. Advances in Neural Information Processing Systems (NeurIPS), 2015. [↩] [↩] [↩]
- K. He et al., “Mask R-CNN,” in Proc. IEEE Int. Conf. Computer Vision (ICCV), 2017, pp. 386-397. [↩]
- A. Vaswani et al., “Attention is all you need,” in Proc. Advances in Neural Information Processing Systems (NeurIPS), 2017. [↩]
- A. Dosovitskiy et al., “An image is worth 16 x 16 words: Transformers for image recognition at scale,” arXiv preprint arXiv:2010.11929, 2020. [↩]
- E. Arkin et al., “A survey: Object detection methods from CNN to transformer,” Multimedia Tools and Applications, vol. 82, no. 14, pp. 21353-21383, 2023. [↩]
- Oster, C.V., Strong, J.S., and Zorn, C.K., 2013. Analyzing aviation safety: Problems, challenges, opportunities. Research in Transportation Economics, 43(1), pp.148-164. [↩] [↩]
- J. E. Kuchar and A. C. Drumm, “The traffic alert and collision avoidance system,” Lincoln Laboratory Journal, vol. 16, no. 2, 2007. [↩] [↩] [↩]
- A. Rowicki et al., “Bird collision prevention systems in passenger aviation,” Problems of Mechatronics: Armament, Aviation, Safety Engineering, vol. 14, no. 4, pp. 103-122, 2023. [↩] [↩] [↩]
- B. R. Reddy and S. P. Chokkalingam, “Enhancing transportation security: Automated prohibited object detection for baggage inspection leveraging YOLO-NAS,” in Proc. 7th Int. Conf. Image Information Processing (ICIIP), 2023. [↩]
- Y. Li, “Safe training of traffic assistants for detection of dangerous accidents,” Ph.D. dissertation, Brunel University London, 2023. [↩]
- W. Xu, “From automation to autonomy and autonomous vehicles: Challenges and opportunities for human-computer interaction,” Interactions, vol. 28, no. 1, pp. 48-53, 2020. [↩]
- A. Paszke et al., “PyTorch: An imperative style, high-performance deep learning library,” in Proc. Advances in Neural Information Processing Systems (NeurIPS), 2019. [↩]
- N. Parmar et al., “Image transformer,” in Proc. Int. Conf. Machine Learning (ICML), 2018. [↩]
- N. Carion et al., “End-to-end object detection with transformers,” in Proc. European Conf. Computer Vision (ECCV), 2020. [↩]


