
Abstract
Human papillomavirus (HPV) is a sexually transmitted infection directly associated with the development of cervical cancer. Vaccination against HPV has been widely recognized as one of the most effective strategies for preventing cervical cancer, with the first vaccines approved by the US Food and Drug Administration in 2006. However, in 2023, 40% of adolescents were not up-to-date on HPV vaccination. We utilized nationally representative data of N=42,920 teenagers aged 13 to 17 years collected through the Centers for Disease Control and Prevention National Immunization Survey 2023 to examine the prevalence of over 30 distinct reasons why teenagers may not receive HPV shots. We found the leading reasons a teen would not receive the HPV shot in the next 12 months were: safety concerns or side effects (16.9%), not needed or not necessary (15.2%), provider did not recommend (14.1%), lack of knowledge (13.9%), and already up-to-date (8.6%). Compared to females, the odds of reporting safety concerns or side effects as the main reason for not receiving the HPV vaccine was significantly lower for males (odds ratio [OR]=0.78; 95% Confidence Interval [CI]: 0.70–0.87). The odds of reporting not needed or not necessary as the main reason for not receiving the HPV vaccine was greater among males compared to females (OR=1.16; 95% CI: 1.04–1.29). Our study highlights the importance of improving focused health education and provider-patient communication to narrow the gender gap and increase overall HPV vaccine coverage.
Keywords: Human papillomavirus, vaccine, hesitancy
Introduction
Human papillomavirus (HPV) is a sexually transmitted infection that is directly associated with the development of cervical cancer, as well as cancers of the oropharynx, anus, and other tissues1. Chesson et al. (2014) estimated that the lifetime probability of acquiring HPV among individuals with at least one opposite-sex partner was 85% for women and 91% for men2. Bosch et al. (2002) discovered that persistent infection with high-risk HPV types, particularly HPV-16 and HPV-18, is a common cause of cervical cancer, responsible for approximately 70% of cases worldwide3. Gargano et al. found that 42.2% of U.S. males aged 14–59 were infected with genital HPV, underscoring the high prevalence in men and the need for vaccination coverage across sexes4.
Beyond the virus itself, co-infection with other pathogens, lifestyle risks such as smoking, and long-term contraceptive use act as tumor-promoting factors that enables HPV to persist and promote cancer development. Recently, Huang et al. (2024) reported that dysbiosis in the vaginal microbiome may weaken the body’s immune regulation and inflammatory response, facilitating HPV-related cancer progression5.
Vaccination against HPV has been widely recognized as one of the most effective strategies for preventing cervical cancer, with the first vaccines approved by the US Food and Drug Administration in 20066. Arbyn et al. (2023) demonstrated that prophylactic (i.e., preventive) HPV vaccines significantly reduced the incidence of cervical precancerous lesions (CIN2+, CIN3+) among adolescent girls and young women7. However, despite strong clinical evidence supporting the vaccine’s effectiveness, recent trends raise concerns about its uptake rate8. Pingali et al. (2023) found that up-to-date HPV vaccination coverage among adolescents in the US was 61% in 20239. Szilagyi et al. (2020) reported that 23% of US parents expressed hesitancy toward the vaccine, citing concern over lack of strong provider recommendation10.
At present, several critical gaps remain in our understanding of HPV vaccine uptake among adolescents. First, what were the leading reasons why teens would not receive an HPV shot in the next year? Second, how do these reasons differ across population subgroups? Finally, what socio-demographic characteristics are associated with specific leading reasons?
We utilize nationally representative data of N=42,920 teenagers aged 13 to 17 years collected through the US Centers for Disease Control and Prevention (CDC) National Immunization Survey 2023 to examine the prevalence of over 30 distinct reasons why teenagers may not receive HPV shots. The reasons include safety concerns, beliefs, attitudes, and knowledge gaps, and the socio-demographic characteristics associated with specific leading reasons are analyzed.
We hypothesized that safety concerns would be the most common reason why teenagers would not receive the vaccine. We also hypothesized that male teenagers would be more likely than females to perceive the vaccine as unnecessary. Furthermore, we expected that doctors’ recommendations of the vaccine would not differ based on patients’ gender.
Methods
Data
We used data from the 2023 CDC National Immunization Survey (NIS). The NIS-Teen is a nationwide phone and mail survey used to assess HPV and other routine vaccine coverage among adolescents aged 13–17 years in the US. It collects data from parents/guardians and vaccination providers to monitor HPV vaccine uptake, dose completion, and trends across states and territories.
In 2023, N=42,920 teenagers aged 13 to 17 years were sampled from randomly selected households that had at least one child or teen. HPV vaccination was accessed by the question, “How many HPV shots did [TEEN NAME] ever receive”. Among those who answered 0 HPV shots, respondents were asked, “What is the main reason [TEEN NAME] will not receive HPV shots in the next 12 months”. Reasons included: [1] provider did not recommend, [2] knowledge- did not know about diseases/did not know was recommended for my teen, [3] vaccine is not needed or necessary-adolescent has received all of the recommended doses, [4] vaccine is not needed or necessary- other reasons, [5] school does not require, [6] safety concerns, [7] teen is not the appropriate age/provider indicated could vaccinate at older age, [8] uninsure/insurance doesn’t fully cover shots/insurance co-pay or other costs too high, [9] shot could be painful, [10] yet/already planned, [11] vaccine not available in provider’s office difficulty making or getting to, [12] appointment/transportation problems, [13] concern about increasing sexual activity if receive shot, [14] is not sexually active, [15] not sure if they have already received all of the HPV shots they need, and [16] other. Socio-demographic characteristics included: age, sex, race/ethnicity, census region, maternal education attainment, home ownership status, and poverty status.
Statistical Analyses
First, we ascertained the socio-demographic characteristics of the sample. Second, we estimated the weighted prevalence of the main reasons teens would not receive HPV shots in the next 12 months. Third, we also estimated the weighted prevalence by sex.
Finally, we fit three separate weighted logistic regression models. The outcome for the first model was safety concerns or side effects as the main reason teens would receive HPV shots in the next 12 months (no/yes). The outcome for the second model was not needed or necessary as the main reason teens would receive HPV shots in the next 12 months (no/yes). The outcome for the third model was not recommended as the main reason teens would receive HPV shots in the next 12 months (no/yes). For each of the three regression models, covariates included age, sex, race/ethnicity, census region, maternal education attainment, home ownership status, and poverty status.The type I error rate was set at 𝛂=0.05. R version 4.5.0 was used for all statistical analyses, including the srvyr, tidyverse, and gtsummary packages.
The NIS-Teen survey uses a two-phase sampling design: a random-digit dialing (RDD) phase to identify households with teens and a provider phase to verify vaccination records. Because not all households or providers respond and some groups have different chances of being selected, each teen is assigned a sampling weight. These weights adjust for unequal selection probabilities, nonresponse, and demographic differences, ensuring that the results represent all U.S. teens. Without weighting, vaccination coverage estimates would be biased toward respondents and not accurately reflect the national population
The NIS-Teen data are publicly available and fully de-identified, containing no personally identifiable information. Therefore, this study was exempt from institutional review board oversight and informed consent requirements. Data collection procedures for the NIS-Teen are reviewed and approved by the National Center for Health Statistics Research Ethics Review Board at the CDC. All analyses in this study followed CDC guidelines for appropriate data use.
Results
Characteristics of Study Sample
Among the 42,920 teenagers surveyed, ages varied between 13 and 17 years, 52% were male and 48% were female (Table 1). By race and ethnicity, 56% were non-Hispanic white, 21% were Hispanic, and 10% were non-Hispanic Black. In terms of census region, most respondents were from the South (36%), followed by the West (23%), the Midwest (22%), and the Northeast (19%). By maternal education attainment, 6.4% of respondents’ mothers had less than 12 years of education, 17% had completed 12 years, 25% had more than 12 years but were not college graduates, and 52% were college graduates. Regarding home ownership, 73% of respondents’ families owned or were buying a house and 24% rented. Fourteen percent of respondents’ families were below poverty, 27% were above poverty but earned ≤$75,000 per year, and 59% were above poverty and earned >$75,000 per year. Finally, 60% of teens had received one or more HPV shots.
Main Reasons Teens Would Not Receive HPV Shots in the Next 12 Months
The main reason a teen would not receive the HPV shot in the next 12 months was: safety concerns or side effects (16.9%), not needed or not necessary (15.2%), provider did not recommend (14.1%), lack of knowledge (13.9%), and already up-to-date (8.6%; Figure 1). Figure 1 also identified other notable reasons. For instance, a small percentage of teens or their parents reported not believing in immunizations (1.4%), having special needs or illnesses (1.3%), the teen being fearful (1.1%), or religion (0.7%).
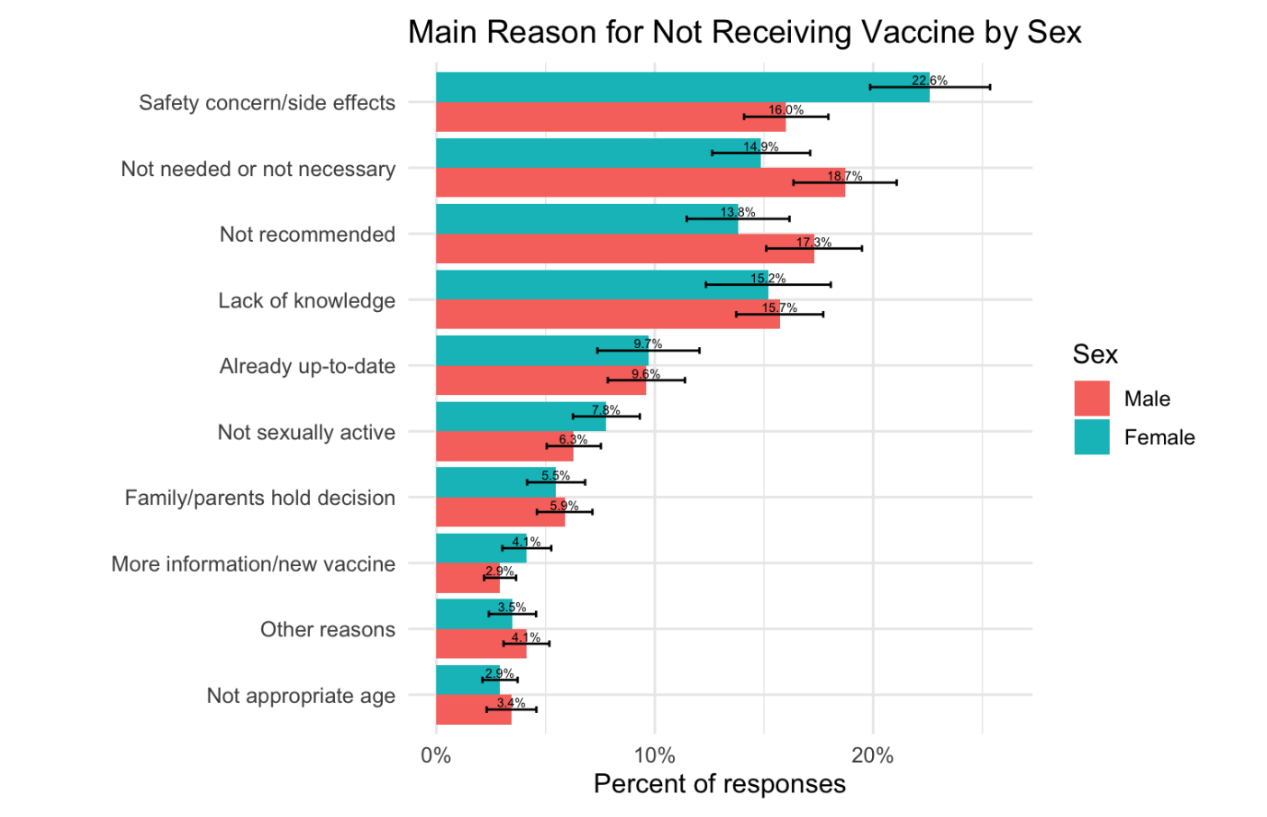
Main Reasons Teens Would Not Receive HPV Shots in the Next 12 Months by Sex
Of teens surveyed about their intention to receive the HPV vaccine within the next 12 months, there was a noteworthy difference between females and males (Figure 2). Safety concerns or side effects were a commonly cited reason for both groups, but more females (22.6%) than males (16.0%) reported this concern. Similarly, 7.8% of females and 6.3% of males reported not being sexually active as the main reason. Also, 18.7% of males and 14.9% females believed the vaccine was not needed or not necessary. More males (17.3%) than females (13.8%) reported that their provider did not recommend the vaccine. The percentage of teens who reported being up-to-date on the HPV vaccine was similar between females (9.7%) and males (9.6%), as well as the lack of knowledge between females (15.2%) and males (15.7%).
Logistic Regression Results
Safety Concerns or Side Effects
Compared to 13-year olds, the odds of reporting safety concerns or side effects as the main reason for not receiving the HPV vaccine was significantly lower for 15-year olds (odds ratio [OR]=0.73; 95% confidence interval [CI]: 0.61-0.87), 16-year olds (OR= 0.69; 95% CI: 0.57-0.82), and 17-year olds (OR=0.63; 95% CI: 0.53-0.76; Table 2). The odds were lower among males compared to females (OR=0.78; 95% CI: 0.70–0.87). The odds were also lower among Hispanic (OR=0.76; 95% CI: 0.64-0.90) and non-Hispanic black teens (OR=0.58; 95% CI: 0.46-0.73) compared to non-Hispanic white teens.
Not Needed or Not Necessary
The odds of reporting not needed or not necessary as the main reason for not receiving the HPV vaccine was greater among males compared to females (OR=1.16; 95% CI: 1.04–1.29). The odds were lower for Hispanic teens compared to non-Hispanic whites (OR=0.82; 95% CI: 0.69–0.97). Regionally, the odds were higher for teens in the West compared to those in the Northeast (OR=1.23; 95% CI: 1.03–1.46).
Provider Did Not Recommendation
Finally, the odds of reporting that the provider did not recommend as the main reason were higher among males than females (OR=1.24; 95% CI: 1.12–1.37). The odds were also greater for non-Hispanic Black teens (OR=1.26; 95% CI: 1.05–1.50) and Hispanic teens (OR=1.45; 95% CI: 1.26–1.66), compared to non-Hispanic whites. The odds were lower among teens whose families were below poverty compared to those who were above poverty and earned ≤$75,000 per year (OR=0.78; 95% CI: 0.64–0.94).
Secondary Analysis: Interaction Between Sex and Age
Safety Concerns or Side Effects (Sex × Age)
Across all ages, males had significantly lower odds than females of reporting safety concerns or side effects as the main reason for not receiving the HPV vaccine (OR=0.63; 95% CI: 0.48–0.82). Age also demonstrated a strong negative gradient: compared with 13-year-olds, 15-year-olds (OR=0.63; 95% CI: 0.50–0.81), 16-year-olds (OR=0.63; 95% CI: 0.49–0.80), and 17-year-olds (OR=0.48; 95% CI: 0.37–0.62) were significantly less likely to cite safety concerns.
Not Needed or Not Necessary (Sex × Age)
The odds of reporting not needed or not necessary as the main reason for not receiving the HPV vaccine were greater among males compared to females (OR=1.36; 95% CI: 1.03–1.82). The odds were lower for Hispanic teens compared to non-Hispanic whites (OR=0.82; 95% CI: 0.69–0.97). Regionally, the odds were higher for teens in the West compared to those in the Northeast (OR=1.23; 95% CI: 1.03–1.47).
Provider Did Not Recommend (Sex × Age)
The odds of reporting that a healthcare provider did not recommend the HPV vaccine were higher among males compared to females (OR=1.61; 95% CI: 1.24–2.10). The odds were also higher for Hispanic (OR=1.45; 95% CI: 1.26–1.67), non-Hispanic Black (OR=1.26; 95% CI: 1.05–1.50), and non-Hispanic Other/Multiple Race teens (OR=1.56; 95% CI: 1.35–1.79) compared to non-Hispanic whites.
Discussion
Our study identifies three central findings. First, we found that the lack of a healthcare provider recommendation was more commonly reported as the main reason for not receiving the HPV vaccination among males compared to females. This reason was also more commonly reported by non-Hispanic Black and Hispanic teens compared to non-Hispanic white teens. Second, we found safety concerns were among the leading reasons for not receiving the HPV vaccination and more commonly so among females than males. Third, males were more likely than females to report not needed or necessary as the main reason for not receiving the HPV vaccination.
Our secondary analysis revealed that both sex and age interact in shaping vaccine hesitancy patterns. Specifically, younger teens (ages 13–14) expressed more safety concerns, whereas older teens (ages 16–17) were less likely to report such concerns but more likely to indicate lack of provider recommendation. Interestingly, the interaction between sex and age showed that 17-year-old males were significantly more likely to report safety concerns than their younger or female counterparts. These results show a developmental and gendered dimension in vaccine attitudes, suggesting that targeted communication strategies may need to be age-specific, especially for older adolescent boys. Additionally, regional and racial differences indicate that Hispanic and Black adolescents were disproportionately more likely to cite lack of provider recommendation, echoing structural and communication gaps in healthcare outreach.
Our findings contribute to a growing body of literature on HPV vaccination uptake. Tsui et al. (2021) studied provider behaviors and found that physicians were more likely to recommend HPV vaccination to female patients than to male patients11. Hansen et al. surveyed medical residents on their HPV vaccine practices and concluded that gender biases persisted in clinical training, with many residents expressing less urgency in recommending the vaccine to adolescent males12. Similarly, we found that males were significantly less likely than females to report receiving a healthcare provider recommendation for the vaccination.
Our finding aligned with and extended previous findings that this disparity persisted even after controlling for socio-demographic factors such as race/ethnicity, income, and geographic region. Fu et al. observed that providers were less likely to initiate HPV vaccine conversations with parents of boys, often waiting for parental inquiry13. Moreover, Chan et al. found that ethnic minority adolescent girls faced especially low uptake rates, with healthcare provider recommendations and trust being key factors influencing acceptance14. Our findings also showed that gender-based gaps in provider behavior may occur across multiple socio-demographic groups and remain a critical barrier to vaccine coverage. Also, a substantial proportion of respondents indicated their primary reason for not receiving an HPV shot in the next 12 months was already up-to-date. Although these results were not logically consistent, it does highlight a potential misunderstanding among teenagers on clinical recommendation of the HPV vaccine.
Recent studies have explored the reasons behind provider-related disparities. Kong et al. found that the likelihood of an HPV vaccine recommendation varied depending on visit context, with well-child visits being the most consistent opportunity15. Garcia et al. found that structural barriers within clinics, such as time constraints and workflow disruptions, limited the consistency of vaccine recommendations16. Additionally, Bobakova et al. found that marginalized communities, such as Roma populations in Slovakia, face unique structural and trust-related barriers to HPV vaccination17. Rosen et al. (2019) found that school health personnel play a critical role in encouraging HPV vaccination through parental engagement18. These studies support our findings that missed vaccination opportunities may stem, in part, from structural and provider-level issues.
Concerns about vaccine safety remain one of the most cited barriers to HPV vaccination uptake19. Our findings found that safety concerns were more commonly reported by females. This finding aligns with previous research. In a national survey, Kester et al. found that mothers more commonly cited concerns for their daughters about vaccine safety, danger, and lack of provider recommendation as reasons for non-vaccination20. Similarly, Albright et al. reported that English-speaking parents often declined vaccination due to fears of side effects and general distrust of medical institutions21. Pierce et al. found that although 85% of parents were aware the HPV vaccine was recommended, only 59% believed it was safe22.
Despite common fears about vaccine safety, years of research have shown that the HPV vaccine is safe. Angelo et al. analyzed post-licensure safety surveillance covering more than four years of global use and found that serious side effects were rare and no unusual safety concerns stood out where most reported issues were expected and occurred at normal background rates23. Stillo et al. reviewed both bivalent and quadrivalent vaccines, concluding that public concerns were not supported by scientific data and emphasized that improving risk communication is critical24. Quattrone et al. similarly noted that persistent rumors about HPV vaccine are one of the greatest obstacles to acceptance, even in developed countries with national vaccination programs24. Vichnin et al. found that serious adverse events, including those most feared by the public, remained rare and aligned with background rates, even after over 178 million doses distributed25. Our findings build on previous research that showed concerns over serious side effects lack scientific evidence and the HPV vaccine has proven safe.
We also found that there is a clear disparity between males and females in HPV vaccine uptake, particularly for the reason that the vaccine is “not needed.” Choi et al. reported that 24% of parents of unvaccinated male adolescents cited “not recommended by a provider” and “unnecessary” as top reasons for refusal, compared to 18% for females26. Johnson et al. similarly found that vaccine completion rates were lower among males, with only 14% of boys completing the three-dose series compared to 38% of girls27. Our data supports this trend that males were significantly more likely than females to cite lack of necessity as their primary reason for not taking the vaccine.
Several studies have identified important reasons behind this disparity. Similarly, Hirth showed that gender-specific health communication and health policies have long prioritized HPV prevention among women, potentially contributing to male underrepresentation28. Our findings support these patterns, showing that males were significantly more likely than females to report “not needed or necessary” as their main reason for not receiving the HPV vaccine.
Our findings suggest several policy implications that could improve HPV vaccine uptake among adolescents. First, continuing education for healthcare providers could emphasize the importance of vaccinating both boys and girls, which could reduce disparities in provider recommendations. Additionally, schools could incorporate a health education curriculum that emphasizes the safety and benefits of HPV vaccination.
We note several strengths of this study. We utilized nationally representative data on vaccination records that were verified by healthcare providers. However, we also acknowledge several important limitations. First, the NIS did not ascertain details of specific safety concerns adolescents or parents had. Safety concerns could range from short-term effects (e.g., soreness at injection site) to long-term effects (e.g., infertility). The NIS also did not ascertain precise reasons why males, in particular, perceived the vaccine as unnecessary or not needed, or why some healthcare providers were less likely to recommend HPV vaccination for males. Future qualitative-studies could provide a more nuanced understanding.
Conclusion
This cross-sectional study found that gender disparities persisted in HPV vaccination uptake, with males significantly less likely than females to report receiving a provider recommendation. Safety concerns and the perception that the vaccine was unnecessary were among the top reported reasons for non-vaccination, especially among males. Our findings suggest provider and structural barriers may disproportionately impact males, despite national efforts to promote vaccination among all teenagers. Our study also highlighted the importance of improving focused health education, provider-patient communication, and policy interventions to narrow the gender gap and increase overall HPV vaccine coverage.
Characteristic | N = 42,9201 |
|---|---|
| Age (years) | |
| 13 | 8,111 (19%) |
| 14 | 8,587 (20%) |
| 15 | 8,739 (20%) |
| 16 | 8,896 (21%) |
| 17 | 8,587 (20%) |
| Sex | |
| Male | 22,495 (52%) |
| Female | 20,425 (48%) |
| Race/ethnicity | |
| Non-Hispanic White Only | 23,982 (56%) |
| Hispanic | 9,220 (21%) |
| Non-Hispanic Black Only | 4,368 (10%) |
| Non-Hispanic Other + Multiple Race | 5,350 (12%) |
| Census Region | |
| Northeast | 7,674 (19%) |
| Midwest | 9,221 (22%) |
| South | 15,014 (36%) |
| West | 9,285 (23%) |
| Maternal educational attainment | |
| Less Than 12 Years | 2,749 (6.4%) |
| 12 Years | 7,221 (17%) |
| More Than 12 Years, Non-College Grad | 10,585 (25%) |
| College Graduate | 22,365 (52%) |
| Home ownership status | |
| Owned or being bought | 31,218 (73%) |
| Other | 1,112 (2.6%) |
| Rented | 10,161 (24%) |
| Poverty status | |
| Below Poverty | 5,693 (14%) |
| Above Poverty ≤$75k | 10,690 (27%) |
| Above Poverty >$75k | 23,752 (59%) |
| Teen received any HPV shots | 25,665 (60%) |
| How likely teen would receive any HPV shots in next 12 months | |
| Very Likely | 7,308 (24%) |
| Somewhat Likely | 6,030 (20%) |
| Not Too Likely | 3,827 (13%) |
| Not Likely At All | 8,834 (29%) |
| Not Sure/Don’t Know | 4,186 (14%) |
| Missing In Error | 0 (0%) |
| Refused | 38 (0.1%) |
| 1 n (%) | |


| Characteristic | Safety Concerns or Side Effects | Not Needed or Not Necessary | Not Recommended | ||||||
| OR1 | 95% CI1 | p-value | OR1 | 95% CI1 | p-value | OR1 | 95% CI1 | p-value | |
| Age (years) | |||||||||
| 13 | — | — | — | — | — | — | |||
| 14 | 1.22 | 1.02, 1.46 | 0.03 | 1.10 | 0.91, 1.34 | 0.32 | 1.01 | 0.85, 1.21 | 0.92 |
| 15 | 0.73 | 0.61, 0.87 | <0.001 | 0.89 | 0.75, 1.07 | 0.21 | 0.91 | 0.78, 1.07 | 0.24 |
| 16 | 0.69 | 0.57, 0.82 | <0.001 | 0.82 | 0.68, 0.98 | 0.03 | 0.88 | 0.75, 1.03 | 0.12 |
| 17 | 0.63 | 0.53, 0.76 | <0.001 | 0.89 | 0.75, 1.07 | 0.20 | 0.76 | 0.64, 0.89 | <0.001 |
| Sex | |||||||||
| Female | — | — | — | — | — | — | |||
| Male | 0.78 | 0.70, 0.87 | <0.001 | 1.16 | 1.04, 1.29 | 0.01 | 1.24 | 1.12, 1.37 | <0.001 |
| Race/ethnicity | |||||||||
| Non-Hispanic White Only | — | — | — | — | — | — | |||
| Hispanic | 0.76 | 0.64, 0.90 | <0.001 | 0.82 | 0.69, 0.97 | 0.02 | 1.45 | 1.26, 1.66 | <0.001 |
| Non-Hispanic Black Only | 0.58 | 0.46, 0.73 | <0.001 | 1.03 | 0.84, 1.25 | 0.80 | 1.26 | 1.05, 1.50 | 0.01 |
| Non-Hispanic Other + Multiple Race | 0.67 | 0.56, 0.80 | <0.001 | 0.91 | 0.76, 1.07 | 0.25 | 1.56 | 1.35, 1.79 | <0.001 |
| Census Region | |||||||||
| Northeast | — | — | — | — | — | — | |||
| Midwest | 1.03 | 0.86, 1.23 | 0.76 | 1.13 | 0.95, 1.35 | 0.18 | 0.82 | 0.70, 0.96 | 0.02 |
| South | 1.18 | 1.00, 1.39 | 0.05 | 1.09 | 0.93, 1.29 | 0.31 | 0.88 | 0.77, 1.02 | 0.09 |
| West | 1.02 | 0.86, 1.23 | 0.80 | 1.23 | 1.03, 1.46 | 0.02 | 0.86 | 0.74, 1.00 | 0.05 |
| Maternal educational attainment | |||||||||
| 12 Years | — | — | — | — | — | — | |||
| Less Than 12 Years | 0.91 | 0.67, 1.23 | 0.55 | 0.90 | 0.67, 1.20 | 0.48 | 0.99 | 0.77, 1.26 | 0.92 |
| More Than 12 Years, Non-College Grad | 1.49 | 1.26, 1.77 | <0.001 | 1.00 | 0.85, 1.18 | 1.00 | 0.75 | 0.64, 0.88 | <0.001 |
| College Graduate | 1.03 | 0.87, 1.22 | 0.73 | 0.86 | 0.74, 1.01 | 0.07 | 0.95 | 0.82, 1.09 | 0.46 |
| Home ownership status | |||||||||
| Owned or being bought | — | — | — | — | — | — | |||
| Other | 1.24 | 0.86, 1.73 | 0.23 | 1.18 | 0.81, 1.67 | 0.37 | 0.94 | 0.65, 1.32 | 0.73 |
| Rented | 0.83 | 0.71, 0.97 | 0.02 | 0.85 | 0.72, 0.98 | 0.03 | 1.01 | 0.88, 1.15 | 0.92 |
| Poverty status | |||||||||
| Below Poverty | 1.10 | 0.90, 1.34 | 0.36 | 0.94 | 0.76, 1.16 | 0.58 | 0.78 | 0.64, 0.94 | 0.01 |
| Above Poverty ≤$75k | — | — | — | — | — | — | |||
| Above Poverty >$75k | 0.92 | 0.81, 1.06 | 0.25 | 1.04 | 0.91, 1.19 | 0.55 | 0.89 | 0.79, 1.01 | 0.06 |
| 1 OR = Odds Ratio, CI = Confidence Interval | |||||||||
| Characteristic | Safety Concerns or Side Effects (Sex × Age) | Not Needed or Not Necessary (Sex × Age) | Not Recommended (Sex × Age) | ||||||
| OR | 95% CI | p-value | OR | 95% CI | p-value | OR | 95% CI | p-value | |
| Sex | |||||||||
| Female | — | — | — | — | — | — | |||
| Male | 0.63 | 0.48, 0.82 | <0.001 | 1.36 | 1.03, 1.82 | 0.03 | 1.61 | 1.24, 2.10 | <0.001 |
| Age (years) | |||||||||
| 13 | — | — | — | — | — | — | |||
| 14 | 1.22 | 0.94, 1.57 | 0.13 | 1.33 | 0.99, 1.81 | 0.06 | 1.13 | 0.85, 1.50 | 0.41 |
| 15 | 0.63 | 0.50, 0.81 | <0.001 | 0.99 | 0.75, 1.31 | 0.93 | 1.11 | 0.86, 1.44 | 0.43 |
| 16 | 0.63 | 0.49, 0.80 | <0.001 | 0.88 | 0.67, 1.18 | 0.40 | 1.12 | 0.87, 1.45 | 0.38 |
| 17 | 0.48 | 0.37, 0.62 | <0.001 | 1.00 | 0.76, 1.33 | 0.99 | 0.89 | 0.69, 1.16 | 0.39 |
| Race/ethnicity | |||||||||
| Non-Hispanic White only | — | — | — | — | — | — | |||
| Hispanic | 0.76 | 0.64, 0.89 | <0.001 | 0.82 | 0.69, 0.97 | 0.02 | 1.45 | 1.26, 1.67 | <0.001 |
| Non-Hispanic Black Only | 0.58 | 0.46, 0.73 | <0.001 | 1.03 | 0.84, 1.25 | 0.80 | 1.26 | 1.05, 1.50 | 0.01 |
| Non-Hispanic Other + Multiple Race | 0.67 | 0.56, 0.80 | <0.001 | 0.90 | 0.76, 1.07 | 0.24 | 1.56 | 1.35, 1.79 | <0.001 |
| Census Region | |||||||||
| Northeast | — | — | — | — | — | — | |||
| Midwest | 1.03 | 0.86, 1.23 | 0.76 | 1.13 | 0.95, 1.35 | 0.17 | 0.82 | 0.70, 0.96 | 0.02 |
| South | 1.18 | 1.00, 1.39 | 0.05 | 1.09 | 0.93, 1.29 | 0.30 | 0.89 | 0.77, 1.02 | 0.09 |
| West | 1.02 | 0.86, 1.23 | 0.80 | 1.23 | 1.03, 1.47 | 0.02 | 0.86 | 0.74, 1.00 | 0.05 |
| Maternal educational attainment | |||||||||
| 12 Years | — | — | — | — | — | — | |||
| Less Than 12 Years | 0.91 | 0.67, 1.23 | 0.55 | 0.90 | 0.67, 1.20 | 0.50 | 0.99 | 0.77, 1.26 | 0.92 |
| More Than 12 Years, Non-College Grad | 1.50 | 1.27, 1.78 | <0.001 | 1.00 | 0.85, 1.18 | 0.98 | 0.75 | 0.64, 0.87 | <0.001 |
| College Graduate | 1.03 | 0.88, 1.23 | 0.69 | 0.86 | 0.74, 1.01 | 0.07 | 0.95 | 0.82, 1.09 | 0.44 |
| Home ownership status | |||||||||
| Owned or being bought | — | — | — | — | — | — | |||
| Other | 1.24 | 0.87, 1.74 | 0.22 | 1.18 | 0.81, 1.67 | 0.36 | 0.93 | 0.65, 1.32 | 0.71 |
| Rented | 0.83 | 0.71, 0.97 | 0.02 | 0.84 | 0.72, 0.98 | 0.03 | 1.01 | 0.88, 1.15 | 0.92 |
| Poverty status | |||||||||
| Below Poverty | 1.10 | 0.90, 1.35 | 0.34 | 0.94 | 0.76, 1.16 | 0.57 | 0.78 | 0.64, 0.94 | 0.01 |
| Above Poverty ≤$75k | — | — | — | — | — | — | |||
| Above Poverty >$75k | 0.92 | 0.81, 1.06 | 0.25 | 1.04 | 0.91, 1.19 | 0.55 | 0.89 | 0.79, 1.01 | 0.06 |
| Sex × Age interaction | |||||||||
| Male * 14 | 1.00 | 0.70, 1.45 | 0.98 | 0.72 | 0.49, 1.07 | 0.11 | 0.84 | 0.58, 1.21 | 0.35 |
| Male * 15 | 1.34 | 0.94, 1.91 | 0.10 | 0.84 | 0.59, 1.21 | 0.36 | 0.72 | 0.52, 1.00 | 0.05 |
| Male * 16 | 1.19 | 0.84, 1.70 | 0.33 | 0.88 | 0.61, 1.27 | 0.49 | 0.67 | 0.48, 0.93 | 0.02 |
| Male * 17 | 1.73 | 1.21, 2.48 | <0.001 | 0.82 | 0.57, 1.18 | 0.29 | 0.77 | 0.55, 1.07 | 0.12 |
| Abbreviations: CI = Confidence Interval, OR = Odds Ratio | |||||||||
References
- Jain M, Yadav D, Jarouliya U, et al. Epidemiology, Molecular Pathogenesis, Immuno-Pathogenesis, Immune Escape Mechanisms and Vaccine Evaluation for HPV-Associated Carcinogenesis. Pathogens. 12(12):1380 (2023). [↩]
- Chesson HW, Dunne EF, Hariri S, Markowitz LE. The Estimated Lifetime Probability of Acquiring Human Papillomavirus in the United States. Sex Transm Dis. 41(11):660-664 (2014). [↩]
- Bosch FX, Lorincz A, Muñoz N, Meijer CJLM, Shah KV. The causal relation between human papillomavirus and cervical cancer. J Clin Pathol. 55(4):244-265 (2002). [↩]
- Gargano, J. W.; Unger, E. R.; Liu, G.; Steinau, M.; Meites, E.; Dunne, E.; Markowitz, L. E. Prevalence of Genital Human Papillomavirus in Males, United States, 2013-2014. J. Infect. Dis. 2017, 215 (7):1070–1079 (2017). [↩]
- Huang R, Liu Z, Sun T, Zhu L. Cervicovaginal microbiome, high-risk HPV infection and cervical cancer: Mechanisms and therapeutic potential – PubMed (2024). [↩]
- Jiayao Lei, Alexander Ploner, K. Miriam Elfström, et al. HPV Vaccination and the Risk of Invasive Cervical Cancer. New England Journal of Medicine. N Engl J Med 383:1340-1348 (2020). [↩]
- Arbyn M, Xu L, Simoens C, Martin-Hirsch PP. Prophylactic vaccination against human papillomaviruses to prevent cervical cancer and its precursors. Cochrane Database Syst Rev. 5(5):CD009069 (2018). [↩]
- Bednarczyk RA. Addressing HPV vaccine myths: practical information for healthcare providers. Hum Vaccin Immunother. 15(7-8):1628-1638 (2019). [↩]
- Pingali C, Yankey D, Chen M, et al. National Vaccination Coverage Among Adolescents Aged 13-17 Years – National Immunization Survey-Teen, United States, 2023. MMWR Morb Mortal Wkly Rep. 73(33):708-714 (2024). [↩]
- Szilagyi PG, Albertin CS, Gurfinkel D, et al. Prevalence and characteristics of HPV vaccine hesitancy among parents of adolescents across the US. Vaccine. 38(38):6027-6037 (2020). [↩]
- Tsui J, Vincent A, Anuforo B, Btoush R, Crabtree BF. Understanding primary care physician perspectives on recommending HPV vaccination and addressing vaccine hesitancy. Hum Vaccin Immunother. 17(7):1961-1967 (2021). [↩]
- Hansen K, Ward M, Avashia S, Duc J, Spielberg F. What Impacts HPV Vaccination Recommendations? An Exploration of Medical Residents’ Knowledge, Training, Barriers, and Practices. Family Medicine. 52(10):745-751 (2020). [↩]
- Fu Y, He Y, Wang Z, Sun J. Strategies, Barriers, and Facilitators for Healthcare Professionals to Recommend HPV Vaccination: A Systematic Review. Vaccines (Basel).(4):402 (2025). [↩]
- Chan DNS, Li C, Law BMH, Choi KC, Lee PPK, So WKW. Factors affecting HPV vaccine uptake among ethnic minority adolescent girls: A systematic review and meta-analysis. Asia Pac J Oncol Nurs. 10(9):100279 (2023). [↩]
- Kong WY, Queen TL, Gottfredson O’Shea N, et al. Impact of visit characteristics on intention to recommend HPV vaccine: An experiment with US health care professionals. Prev Med. 179:107841 (2024). [↩]
- Garcia MA, Schlecht NF, Rokitka DA, Attwood KM, Rodriguez EM. Examining the Barriers and Opportunities for Human Papillomavirus Vaccine Delivery in Cancer Care Settings: A Mixed-Methods Study. Cancer Prev Res (Phila). 16(10):581-589 (2023). [↩]
- Filakovska Bobakova D, Plavnicka J, Urbancikova I, Edelstein M, Jansen D, Dankulincova Veselska Z. Barriers to HPV vaccination in marginalized Roma communities in Slovakia. Front Public Health. 11:1239963 (2023). [↩]
- Rosen BL, Rhodes D, Visker J, Cox C, Banez JC, Lasser B. Factors Associated with School Nurses’ and Personnel’s Professional Practice to Encourage Parents to Vaccinate Against Human Papillomavirus. J Sch Health. 89(7):569-577 (2019). [↩]
- Btoush R, Kohler RK, Carmody DP, Hudson SV, Tsui J. Factors that Influence Healthcare Provider Recommendation of HPV Vaccination. Am J Health Promot. 36(7):1152-1161 (2022). [↩]
- Kester LM, Zimet GD, Fortenberry JD, Kahn JA, Shew ML. A national study of HPV vaccination of adolescent girls: rates, predictors, and reasons for non-vaccination. Matern Child Health J. 17(5):879-885 (2013). [↩]
- Albright K, Barnard J, O’Leary ST, et al. Noninitiation and Noncompletion of HPV Vaccine Among English- and Spanish-Speaking Parents of Adolescent Girls: A Qualitative Study. Acad Pediatr. 17(7):778-784 (2017). [↩]
- Pierce JY, Korte JE, Carr LA, Gasper CB, Modesitt SC. Post Approval Human Papillomavirus Vaccine Uptake Is Higher in Minorities Compared to Whites in Girls Presenting for Well-Child Care. Vaccines (Basel). 1(3):250-261 (2013). [↩]
- Angelo MG, Zima J, Tavares Da Silva F, Baril L, Arellano F. Post-licensure safety surveillance for human papillomavirus-16/18-AS04-adjuvanted vaccine: more than 4 years of experience. Pharmacoepidemiol Drug Saf. 23(5):456-465 (2014). [↩]
- Stillo M, Carrillo Santisteve P, Lopalco PL. Safety of human papillomavirus vaccines: a review. Expert Opin Drug Saf. 14(5):697-712 (2015). [↩] [↩]
- Vichnin M, Bonanni P, Klein NP, et al. An Overview of Quadrivalent Human Papillomavirus Vaccine Safety: 2006 to 2015. Pediatr Infect Dis J. 2015;34(9):983-991 (2015). [↩]
- Choi Y, Eworuke E, Segal R. What explains the different rates of human papillomavirus vaccination among adolescent males and females in the United States? Papillomavirus Res. 2016;2:46-51 (2016). [↩]
- Johnson KL, Lin MY, Cabral H, Kazis LE, Katz IT. Variation in Human Papillomavirus Vaccine Uptake and Acceptability Between Female and Male Adolescents and Their Caregivers. J Community Health. 42(3):522-532 (2017). [↩]
- Hirth J. Disparities in HPV vaccination rates and HPV prevalence in the United States: a review of the literature. Hum Vaccin Immunother. 2019;15(1):146-155 (2019). [↩]


