
Abstract
Background/Objective: Compact gene panels are widely proposed as interpretable substitutes for whole-transcriptome cancer classifiers and are typically reported as discovered signatures. Feature-selection instability is well established statistically, yet applied studies naming specific genes rarely measure it. This study asks whether a compact tissue-of-origin panel selected by a standard pipeline is stable under resampling, and what drives any instability observed.
Methods: Gene-symbol-labeled TCGA RNA-seq from UCSC Xena was used (2,928 primary tumors of breast, kidney clear-cell, colon, lung and prostate; 20,289 genes). Genes were ranked by random-forest importance, recomputed independently inside every cross-validation fold. Panel size was chosen by a parsimony rule applied to paired fold differences, without reference to the test set. Membership was re-derived across 60 resamples at two panel sizes, and stability quantified by selection frequency, Jaccard overlap and the chance-corrected Kuncheva index. The frozen classifier was applied without retraining to 440 CPTAC tumors.
Results: Only 14 of 75 genes were selected in at least 80% of resamples, and 381 distinct genes entered the top 75 (mean pairwise Jaccard 0.319). Canonical markers including GPA33, PAX2 and KLK15 were least stable, and the most reproducibly selected gene outside the reported panel (NAPSA) was not in the panel. Substitution reflected rank noise rather than redundancy (median correlation 0.058). Held-out accuracy was nonetheless 99.32% (random forest) and 99.66% (SVM) against 99.83% for all 20,289 genes, and the panel transferred to CPTAC at 97.7%.
Conclusions: High classification accuracy does not imply a stable gene signature. Studies reporting compact panels should report selection stability alongside accuracy.
Keywords: RNA-Seq; cancer classification; feature selection; selection stability; nested cross-validation; random forest; TCGA; external validation; reproducibility; interpretable machine learning
Introduction
Background and Context
Tissue of origin shapes cancer treatment, and gene expression provides a quantitative complement to morphological diagnosis. The idea that expression profiles alone can assign cancer class dates to Golub and colleagues, who separated acute myeloid from acute lymphoblastic leukemia by expression monitoring1, and resources such as The Cancer Genome Atlas (TCGA) have since assembled expression profiles across many tumor types2. A recurring goal in this literature is to compress whole-transcriptome accuracy into a compact panel of named genes3, motivated by the broader argument that models used for high-stakes decisions should be interpretable rather than explained after the fact4. Small panels are cheaper to assay, and a short list of named genes can be read and argued about in a way that a 20,000-dimensional model cannot. Such panels are usually reported as discovered signatures, yet a prior question is far less often asked: is the selected panel stable, or is its membership an artifact of a single data split?
Prior Work on Feature-Selection Stability
Instability is not a new observation. In the microarray era, Ein-Dor and colleagues showed that breast-cancer outcome signature genes are far from uniquely determined, and that many alternative gene sets predict survival comparably well5. Michiels and colleagues reached a similar conclusion through repeated random validation, finding that the gene lists obtained depended strongly on which patients entered the training set6. Kalousis and colleagues formalized the problem as a property of the selection algorithm itself and studied it systematically in high-dimensional spaces7; Kuncheva introduced a chance-corrected consistency index that makes stability comparable across selected-subset sizes8; and Nogueira, Sechidis and Brown later gave an axiomatic treatment of what a stability measure must satisfy9.
Methods intended to improve stability also exist: Meinshausen and Bühlmann’s stability selection combines subsampling with an existing algorithm and provides error control over the selected set10, and Haury, Gestraud and Vert compared thirty-two feature-selection methods on breast-cancer prognosis data, reporting that the choice of method substantially affects signature stability and interpretability11.
Instability is also documented for the specific ranking used here: Strobl and colleagues showed that random-forest Gini importance is biased when predictors differ in scale or number of categories12, and that importance measures favor correlated predictors13 — precisely the regime of co-expressed tissue-of-origin genes. He and Yu reviewed stable selection for biomarker discovery14.
Problem Statement and Rationale
This study therefore does not claim to discover feature-selection instability, nor to offer a method that outperforms stability selection. The claim is narrower: a standard pipeline — random-forest importance ranking, nested cross-validation, a compact panel — produces a panel whose membership is largely non-reproducible, and applied cancer-classification studies reporting such panels rarely measure this. The analysis that reveals it costs a single resampling loop around code the study has already written.
It is also worth being precise about what is measured, because “reproducibility” is used in at least three senses. Statistical reproducibility asks whether the same analysis on resampled data returns the same result; biological reproducibility whether an independently analyzed cohort yields the same biology; technical reproducibility whether the same data and code return the same numbers. This study evaluates the first. The resampling analysis re-runs one random-forest ranking on overlapping subsets of the same TCGA data, and the external cohort tests whether predictions from a frozen panel transfer, not whether an independent pipeline rediscovers the same genes. The term used throughout is therefore selection stability under resampling.
Significance and Purpose
Two claims are routinely conflated. Showing that five tumor types are separable using few genes says something about the data; naming twenty particular genes says something about those genes, and it is the second that drives assay design and biological stories about individual markers. If the gene list does not survive resampling, work aimed at those genes may be wasted even though the reported accuracy is real.
Objectives
We evaluate a five-type tissue-of-origin classifier on three axes: (i) how few genes reproduce whole-transcriptome accuracy, benchmarked against a model fitted on all 20,289 genes; (ii) whether a frozen panel transfers without retraining to an independent cohort; and (iii) — the axis we emphasize — whether the selected panel is stable under resampling, assessed at two panel sizes and under two importance measures, and whether any instability reflects biological redundancy or the behavior of the ranking procedure. The guiding hypothesis was that accuracy and selection stability are separable properties.
Scope and Limitations
The scope is narrow. Five anatomically distinct tumor types were used, so near-ceiling internal accuracy is expected and is not the contribution. This makes the task an easy one, which is a conservative setting for a stability analysis: if membership is unstable when the classes are trivially separable, instability is unlikely to be milder in harder regimes — pan-cancer classification, or subtype discrimination within one tumor type — where compact signatures are more often proposed. Those regimes are the natural next test. Only expression data were used, and the work is a cautionary methodological study rather than a clinical assay.
Methodology Overview
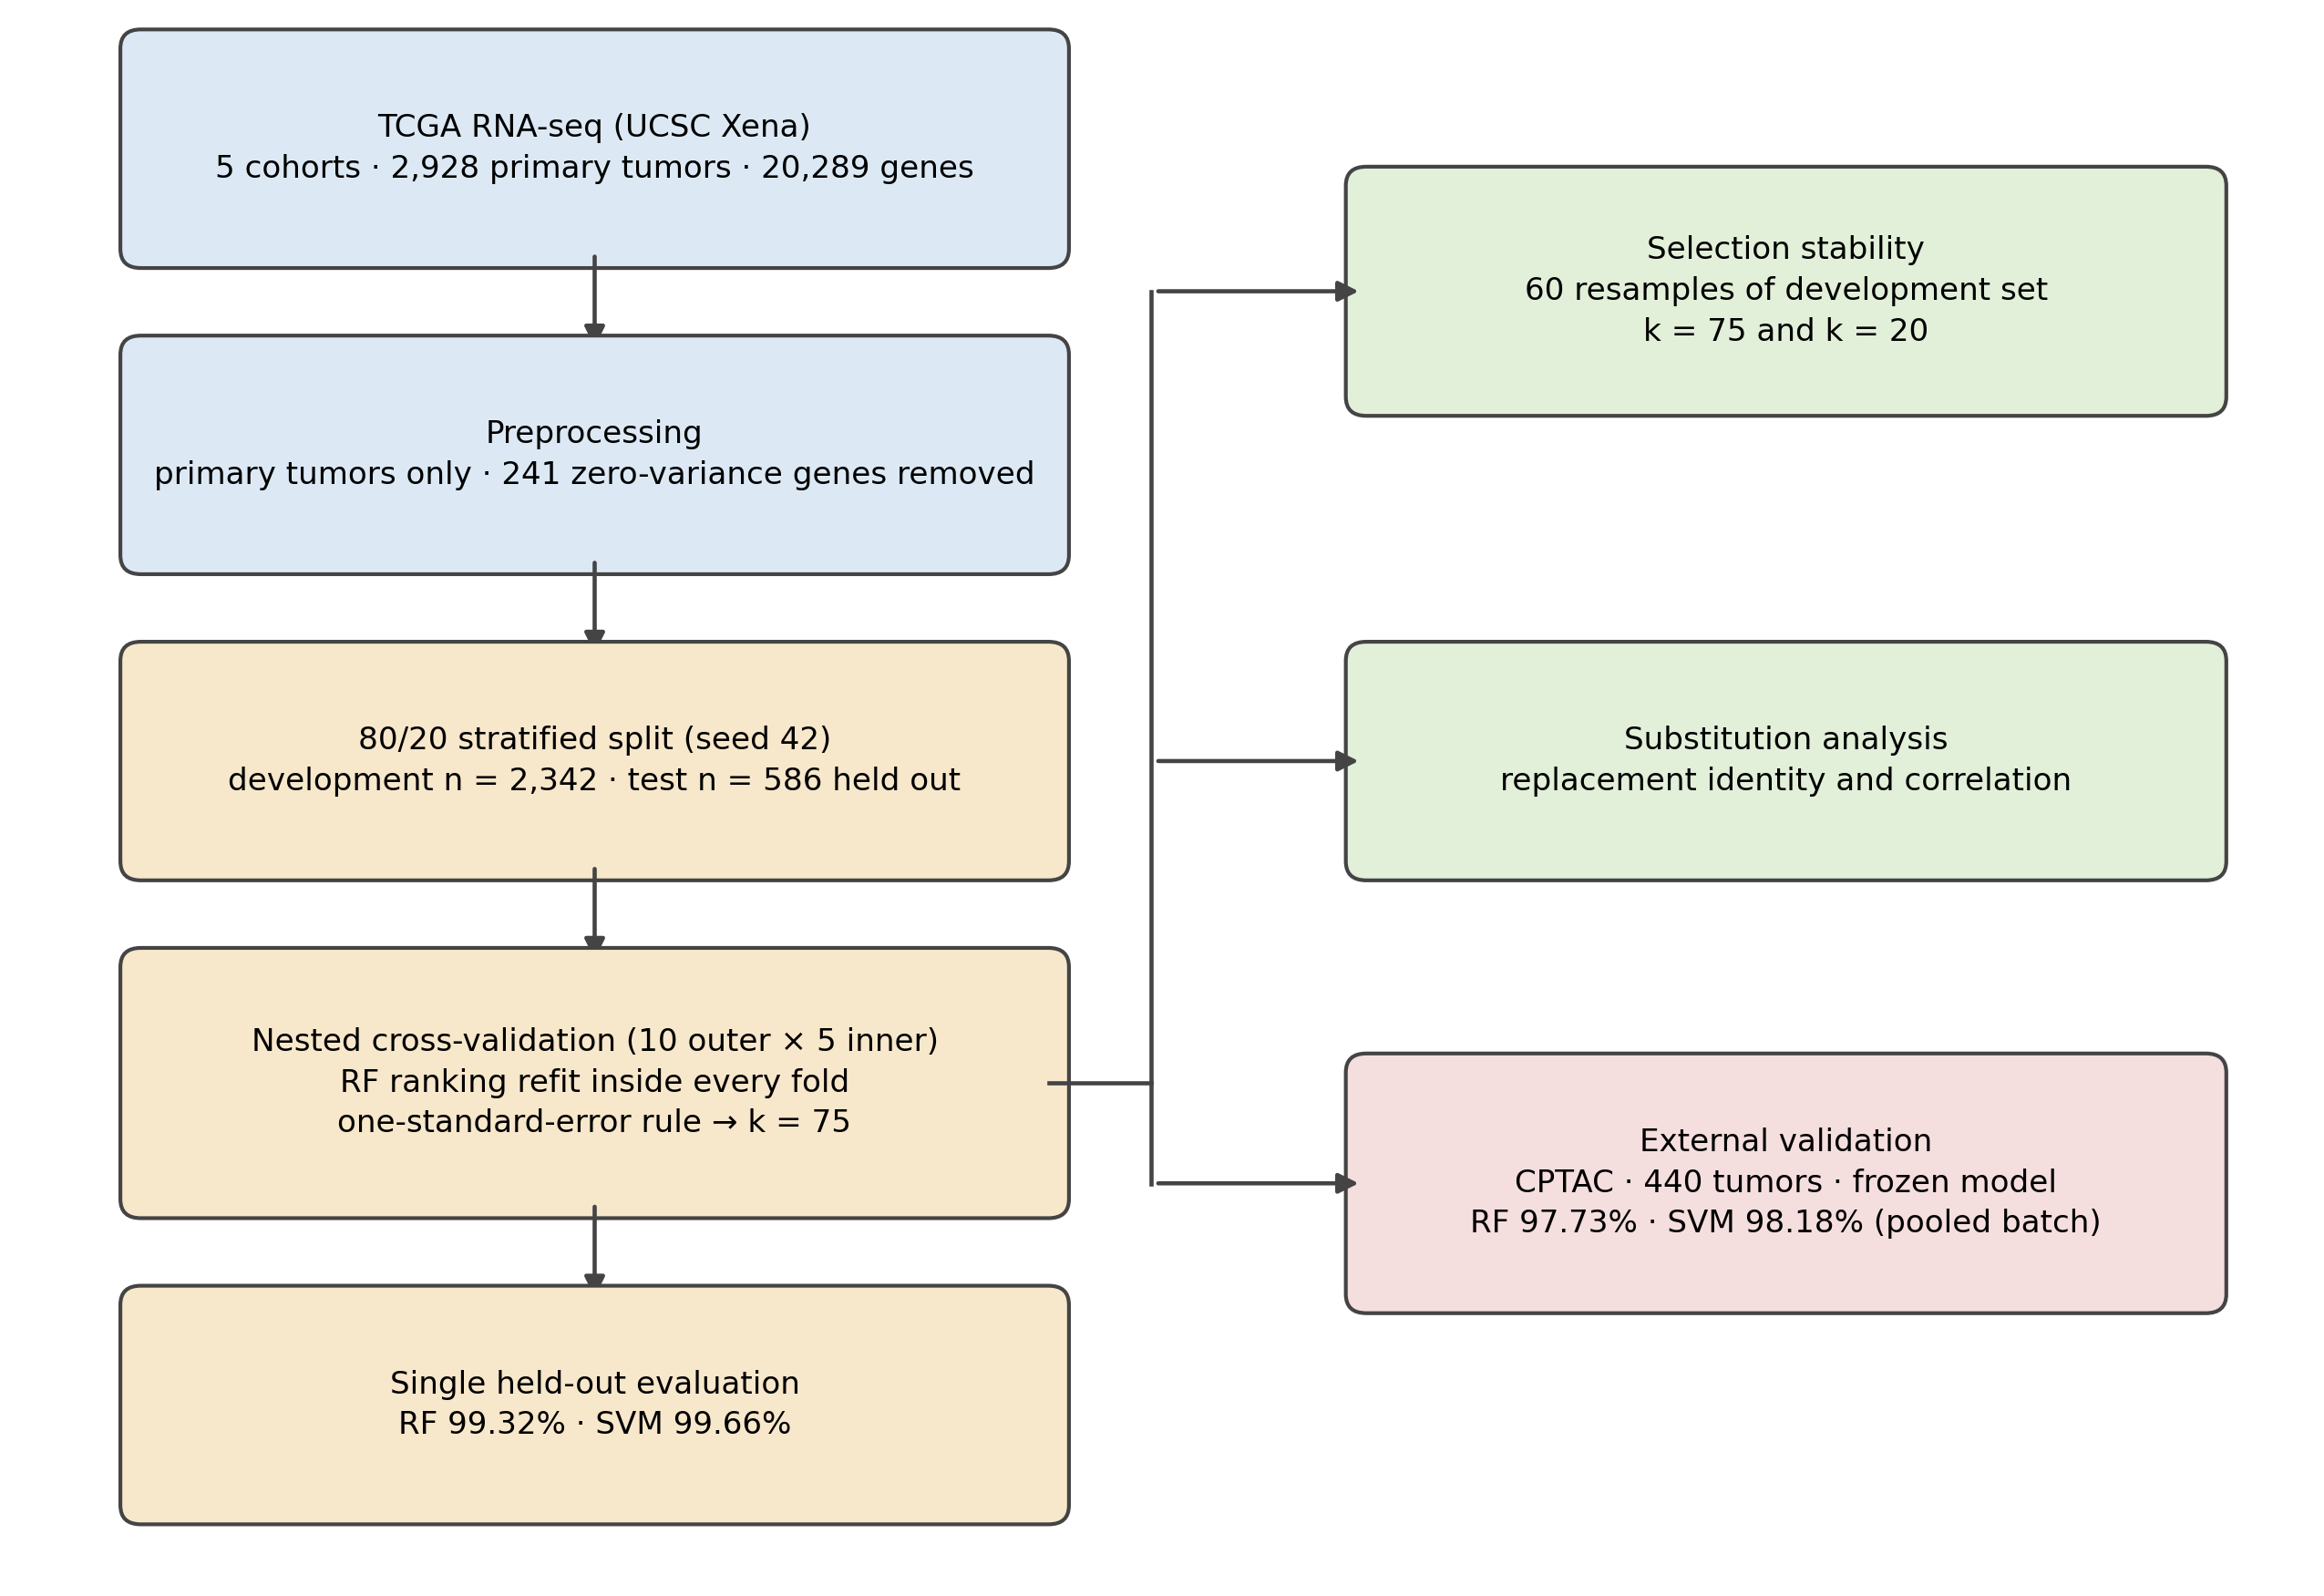
Genes were ranked by random-forest importance refitted inside every cross-validation fold; panel size was fixed by a parsimony rule on paired fold differences; the resulting panel was evaluated once on a held-out test set, frozen and applied to an independent cohort, then re-derived across 60 resamples to measure how often each gene was reselected.
Methods
Research Design
This was a retrospective, cross-sectional computational study using publicly available, de-identified secondary gene-expression data; no new specimens were collected and no human participants were recruited. The design has three stages: internal model development and evaluation on TCGA data; external application of the frozen model to an independent cohort; and a resampling analysis of feature-selection stability (Figure 1). Selection stability was the primary endpoint. The internal-accuracy and external-transfer analyses are reported chiefly to establish the regime in which stability is assessed.
Sample and Data Sources
Gene-symbol-labeled per-cohort TCGA RNA-seq data (IlluminaHiSeq, log2(norm_count + 1)) for five cohorts — breast invasive carcinoma (BRCA), kidney renal clear-cell carcinoma (KIRC), lung adenocarcinoma (LUAD), prostate adenocarcinoma (PRAD) and colon adenocarcinoma (COAD) — were obtained from the UCSC Xena TCGA hub15.
Each cohort was restricted to primary solid tumors (sample-type code 01), reducing the cohorts from 1,218, 606, 576, 550 and 329 samples to 1,097 BRCA, 533 KIRC, 515 LUAD, 497 PRAD and 286 COAD. All five carried the same 20,530 gene symbols, so the intersection removed none; 241 had zero variance across the pooled matrix and were removed, leaving 20,289. No further filtering was applied — in particular no expression-level or detection-rate threshold — so selection operated on the full symbol space. The final matrix comprised 2,928 tumors across 20,289 genes.
The log2(norm_count + 1) transformation is the form in which UCSC Xena distributes these data. The pseudocount keeps zero counts finite and compresses differences among low-expression genes, which is conservative here because it reduces their influence on the variance-based splits the random forest uses.
Class imbalance reflects the underlying TCGA cohort sizes and was retained rather than corrected, with stratification at every split. Because unequal sizes could in principle let the classifier exploit cohort-specific technical variation, a class-balanced sensitivity analysis was also run (Section “Sensitivity and Mechanism Analyses“).
For external evaluation, tumor RNA-seq matrices (gene-level, upper-quartile-normalized log2 RSEM, coding genes) were obtained from the CPTAC pan-cancer data freeze v1.2 via LinkedOmicsKB16 for the four cohorts matching our classes: breast (n = 121), clear-cell renal cell carcinoma corresponding to KIRC (n = 103), colon (n = 106) and lung adenocarcinoma (n = 110), giving 440 tumors. CPTAC has no prostate cohort. Versioned Ensembl gene identifiers were mapped to HUGO symbols, with retired symbols resolved to their current equivalents (for example C8ORF85 to CFAP418 and C17ORF93 to PRAC2) and duplicate symbol mappings resolved to the higher-expressed transcript. All 75 panel genes were recovered in every cohort.
Preprocessing and Data Splitting
Class labels were integer-encoded. A 20% stratified test set (n = 586) was held out once using seed 42, leaving 2,342 development samples. Features for the support vector machine were standardized using training-fold statistics only, so that no test-set information entered the scaling parameters; the random forest used unscaled inputs.
Variables and Measurements
The predictor variables were per-gene normalized expression values; the outcome variable was tumor type, a five-level categorical label. Classification performance was measured as overall accuracy, macro-averaged F1, and per-class recall.
Selection stability was measured by three quantities. Selection frequency is the number of resamples, out of 60, in which a gene appeared in the re-derived top-k panel. Jaccard overlap is intersection over union between two panels. The Kuncheva consistency index corrects observed overlap for chance, IC = (r − k²/p)/(k − k²/p) for panels of size k from p candidates with intersection r, and unlike Jaccard is comparable across k8. With p = 20,289 the expected Jaccard between independent draws is 0.0005 at k = 20 and 0.0019 at k = 75, so observed overlaps far exceed chance and the measures agree closely; both are reported. A gene belongs to the stable core if selected in at least 80% of resamples.
Models and Hyperparameters
Two classifiers were used: a random forest and a linear support vector machine17,18, both implemented in scikit-learn19. Two model families were used so that performance would not rest on a single learner.
The random forest used for gene ranking was grown with 300 trees; the random forest used as a final classifier was grown with 500 trees. Both used scikit-learn defaults otherwise: Gini splitting criterion, max_features = sqrt(p), unlimited depth, no class weighting, random seed 42. Tree counts were fixed rather than tuned, on the grounds that random-forest generalization error converges almost surely as trees are added and does not increase with over-large forests17. The linear SVM used C = 1.0, the scikit-learn default, fixed rather than tuned. This is a genuine limitation rather than a design choice and is stated as such in Section “Limitations“.
Feature importance was scikit-learn’s default mean decrease in impurity (Gini importance). Gini importance is known to be biased toward correlated predictors12,13 — precisely the regime under study — and the stability analysis was therefore repeated under permutation importance as a sensitivity check (Sections “Sensitivity and Mechanism Analyses” and “Sensitivity Analyses”).
Procedure: Nested Cross-Validation and Panel Selection
Gene ranking and panel-size selection were performed within outer training folds only, using an outer 10-fold loop and an inner 5-fold loop, with the ranking recomputed independently inside every fold. Candidate panel sizes were 5, 10, 15, 20, 30, 50, 75, 100, 150 and 200.
The prespecified nested procedure did not converge on a single panel size. Across the ten outer folds it selected 150, 75, 200, 75, 75, 50, 75, 150, 100 and 150 genes — five distinct values, with no size chosen in more than four folds. This is reported as a result in its own right (Section “A Compact Panel Matches Whole-Transcriptome Accuracy, and the Accuracy Surface Is Flat“) rather than resolved by taking a modal value.
Because the procedure gave no consensus, panel size was fixed by a one-standard-error rule applied to the cross-validation folds and without reference to the held-out test set: the smallest candidate size whose mean outer-fold accuracy lies within one standard error of the best-performing size. The best sizes (100–200 genes) achieved 99.915% with a standard error of 0.057 percentage points, giving a threshold of 99.858%; the smallest size clearing it is 75 genes, which is the panel size reported throughout. No panel size was chosen by reference to held-out performance.
For completeness, an alternative rule — the smallest size not significantly worse than any larger size, by paired Wilcoxon test — selects 30 genes (Table 2). Both rules select a panel substantially larger than the 20 genes reported in the original submission of this work, and the discrepancy is discussed in Section “A Note on the 20-Gene Panel”.
External Validation Procedure
The frozen classifiers were applied without retraining to the 440 CPTAC tumors under three normalization schemes, reported together so that the sensitivity of transfer to this choice is visible.
In the raw scheme, CPTAC values were supplied directly to the frozen models with no alignment. In the pooled-batch scheme, each gene was standardized once across all 440 samples together, with cohort labels never used, reflecting the prospectively realistic setting in which an unlabeled batch is normalized against itself. In the within-sample rank scheme, each sample’s panel genes were converted to percentile ranks, requiring no batch statistics. Pooled batch is the primary external result. A per-cohort scheme was also examined but is not reported: because each CPTAC cohort contains a single class, centring within cohorts removes the between-class differences the classifier depends on.
Selection-Stability Analysis
To test whether panel membership is stable, the top-k panel was re-derived across 60 resamples of the development split only: the 10 outer cross-validation folds plus 50 repeated 80/20 stratified splits generated with different random seeds. The held-out test set was excluded from every resample. For each gene we recorded selection frequency; for each pair of resampled panels we recorded Jaccard overlap and the Kuncheva index. The ranking forest was re-seeded on each resample, so the reported instability includes the estimator’s own randomness as well as the data resampling. Holding the forest seed fixed would attribute variation to the data alone and would report higher apparent stability; since the study’s subject is instability, the more inclusive accounting was preferred.
Sensitivity and Mechanism Analyses
Three further analyses were run.
- Panel size. The entire stability analysis was repeated at k = 20 and k = 75, so that whether a larger panel yields more reproducible membership is answered by measurement rather than assertion.
- Ranking criterion. The stability analysis was repeated at k = 20 using permutation importance in place of Gini importance, to test whether the observed instability is a property of the data or an artifact of the documented irregularity of impurity-based importance with correlated predictors12,13. Because permutation importance is roughly an order of magnitude more costly, this run used 30 resamples rather than 60, and permutation was applied to the 500 highest-ranked genes rather than to all 20,289; genes outside that pool cannot plausibly enter a top-20 panel. Both departures are noted where the result is reported.
- Class balance. All five cohorts were downsampled to the size of the smallest (n = 286 per class, 1,430 total) and the accuracy-versus-size curve recomputed, to test whether performance depends on the cohort size imbalance.
- Substitution structure. For every gene in the reported panel that dropped out on a given resample, the genes that entered in its place were recorded, together with their Pearson correlation with the dropped gene. This tests directly whether instability reflects redundancy among co-expressed genes or arbitrary reordering near the selection threshold.
Benchmarks and Statistical Analysis
A model fitted on all 20,289 genes provides the whole-transcriptome benchmark against which compact-panel accuracy is compared. Accuracy at each candidate panel size is reported with 95% confidence intervals computed from the standard error of the fold means, and differences between panel sizes are assessed by paired per-fold differences with a Wilcoxon signed-rank test rather than by comparison against a pooled standard deviation. Because several fold means sit close to the ceiling, normal-approximation intervals can extend above 100%; such intervals are truncated at 100 in the reported tables.
Wilson 95% confidence intervals are reported for accuracy and recall, since the observed proportions sit close to 1. Macro-F1 intervals were bootstrapped with 5,000 resamples, seed 42.
The selected genes were submitted to g:Profiler (g:GOSt) for functional enrichment analysis20 against Gene Ontology, KEGG, Reactome and related sources, using the default g:SCS multiple-testing correction and an adjusted p-value threshold of 0.05.
Ethical Considerations
This study used only publicly available, de-identified secondary data from TCGA and CPTAC, collected under the informed-consent and governance frameworks of their originating studies. No new human-participant data were collected, no attempt was made to re-identify any individual, and no clinical decisions were made on the basis of these analyses; institutional review board approval and informed consent were therefore not applicable. All analysis code and derived tables are released openly.
Results
Internal Performance
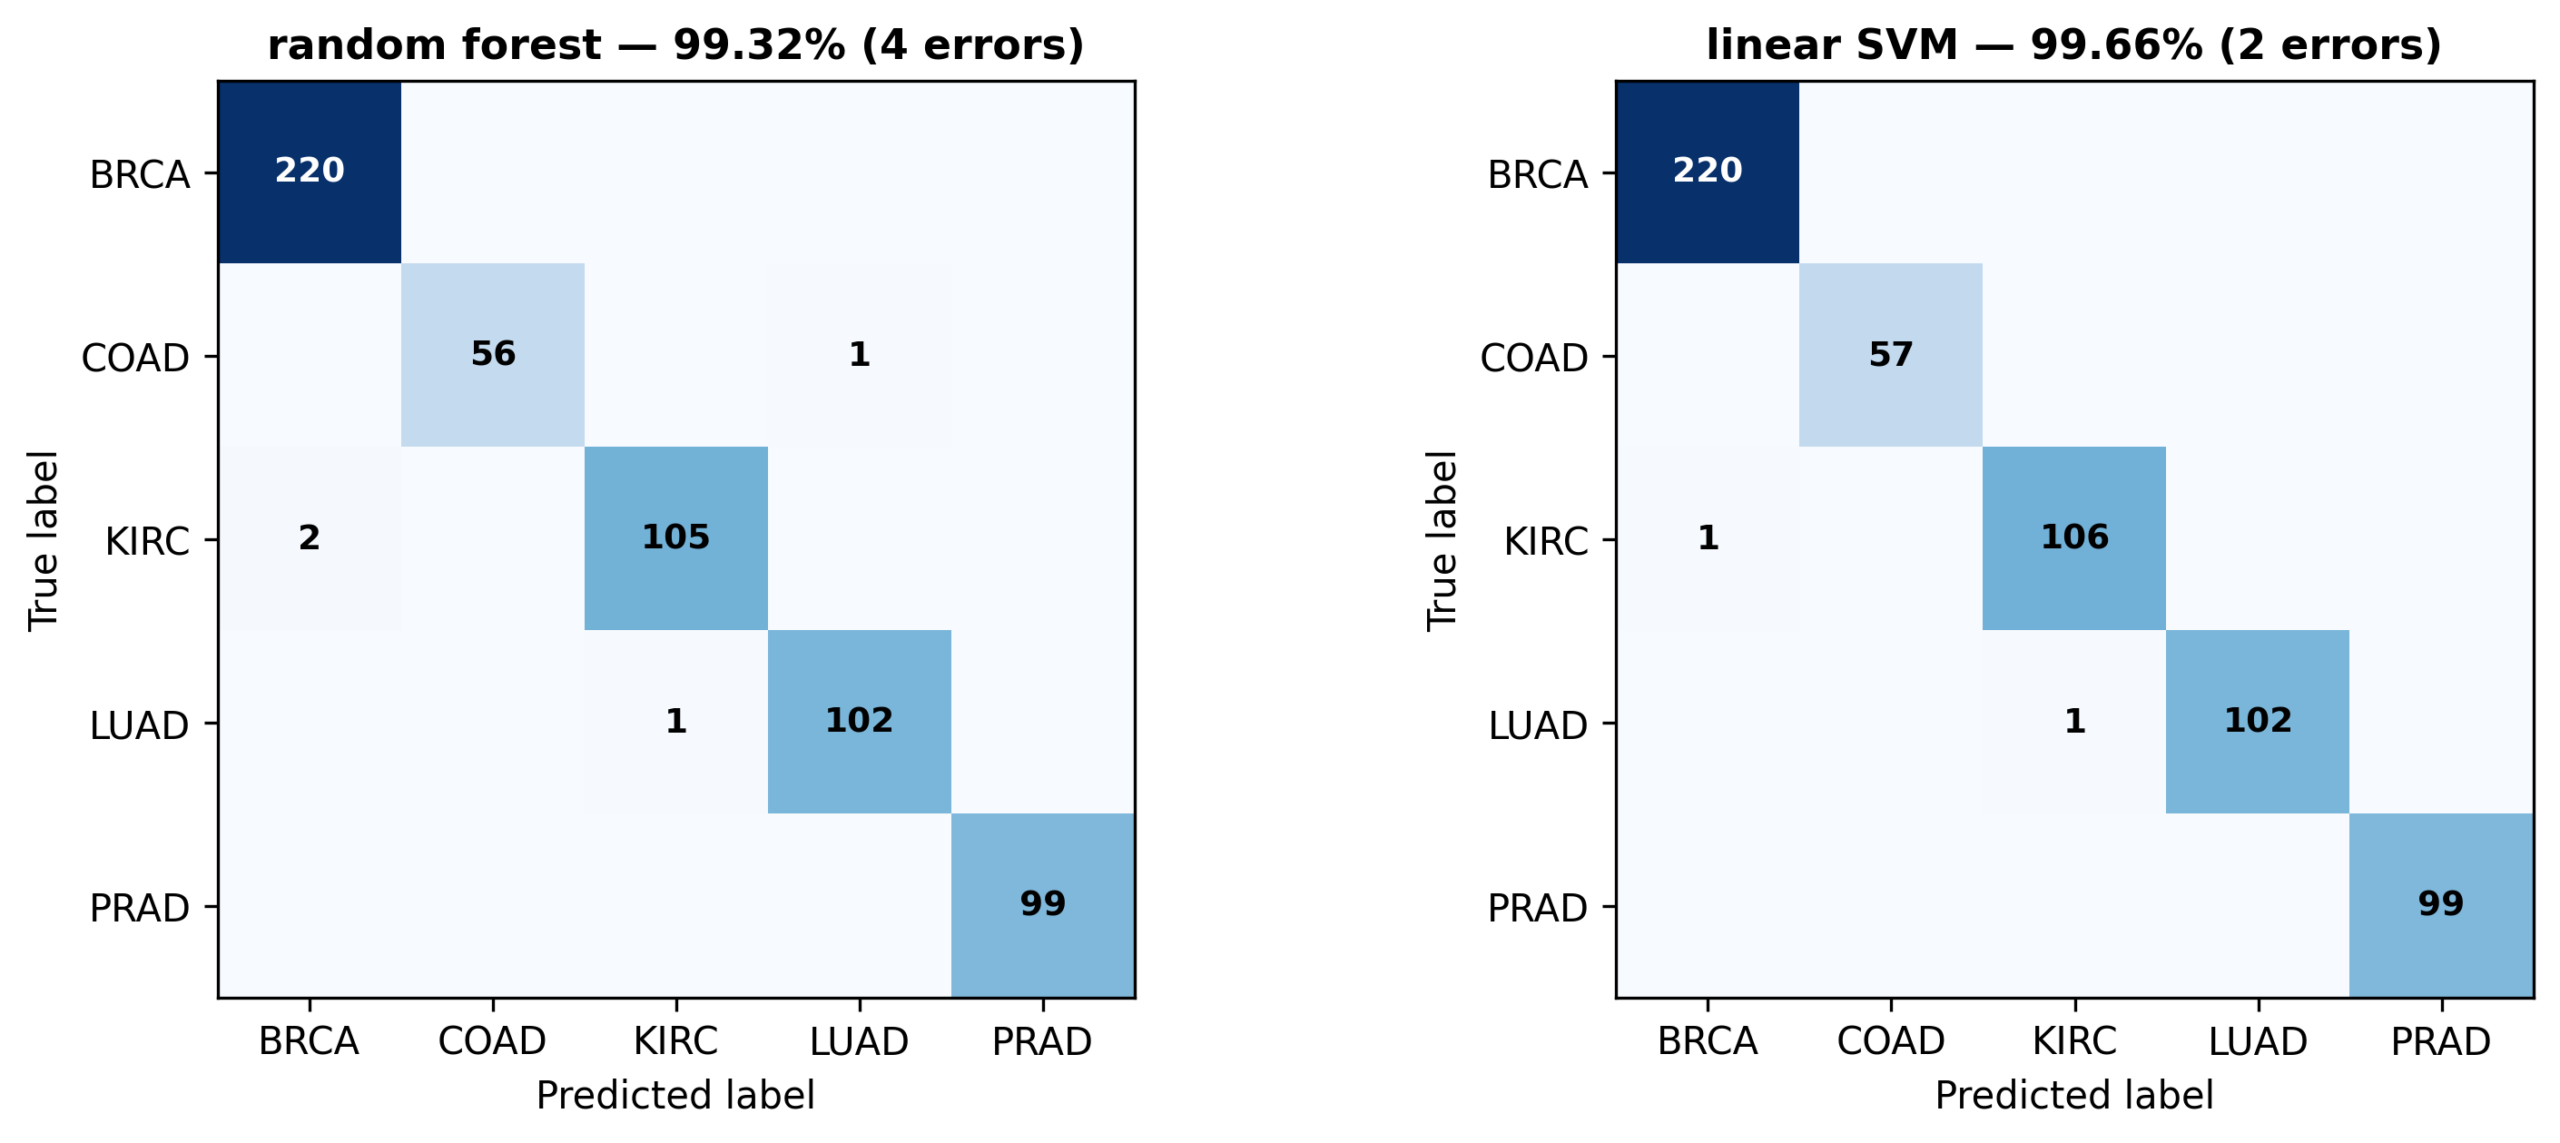
Nested cross-validation accuracy was 99.83% ± 0.28%. On the held-out test set (n = 586), the 75-gene random forest reached 99.32% accuracy (95% CI 98.26–99.73; macro-F1 99.26%, 95% CI 98.39–99.87) and the linear SVM reached 99.66% (95% CI 98.76–99.91; macro-F1 99.67%, 95% CI 99.13–100.00). Per-class recall was at or above 0.98 for every class in both models (Table 1; confusion matrices in Figure 2). Near-ceiling accuracy of this kind is expected for five anatomically distinct organs and is reported as context for the stability analysis rather than as a finding in itself.
| Model | Accuracy (95% CI) | Macro-F1 (95% CI) | BRCA | COAD | KIRC | LUAD | PRAD |
| Random forest | 99.32 (98.26–99.73) | 99.26 (98.39–99.87) | 1.00 | 0.98 | 0.98 | 0.99 | 1.00 |
| Linear SVM | 99.66 (98.76–99.91) | 99.67 (99.13–100.00) | 1.00 | 1.00 | 0.99 | 0.99 | 1.00 |
Class support: BRCA 220, COAD 57, KIRC 107, LUAD 103, PRAD 99
Misclassified Cases
The random forest misclassified 4 of 586 held-out samples: two KIRC specimens assigned to BRCA, one LUAD assigned to KIRC, and one COAD assigned to LUAD. The SVM misclassified 2, one KIRC assigned to BRCA and one LUAD assigned to KIRC, both of which the random forest also missed. Errors were distributed across three classes rather than concentrated in one, and no pair of classes was systematically confused. At this error rate a single specimen shifts per-class recall by a full percentage point, and COAD figures rest on only 57 test samples, so per-class differences of this magnitude should not be over-interpreted.
A Compact Panel Matches Whole-Transcriptome Accuracy, and the Accuracy Surface Is Flat
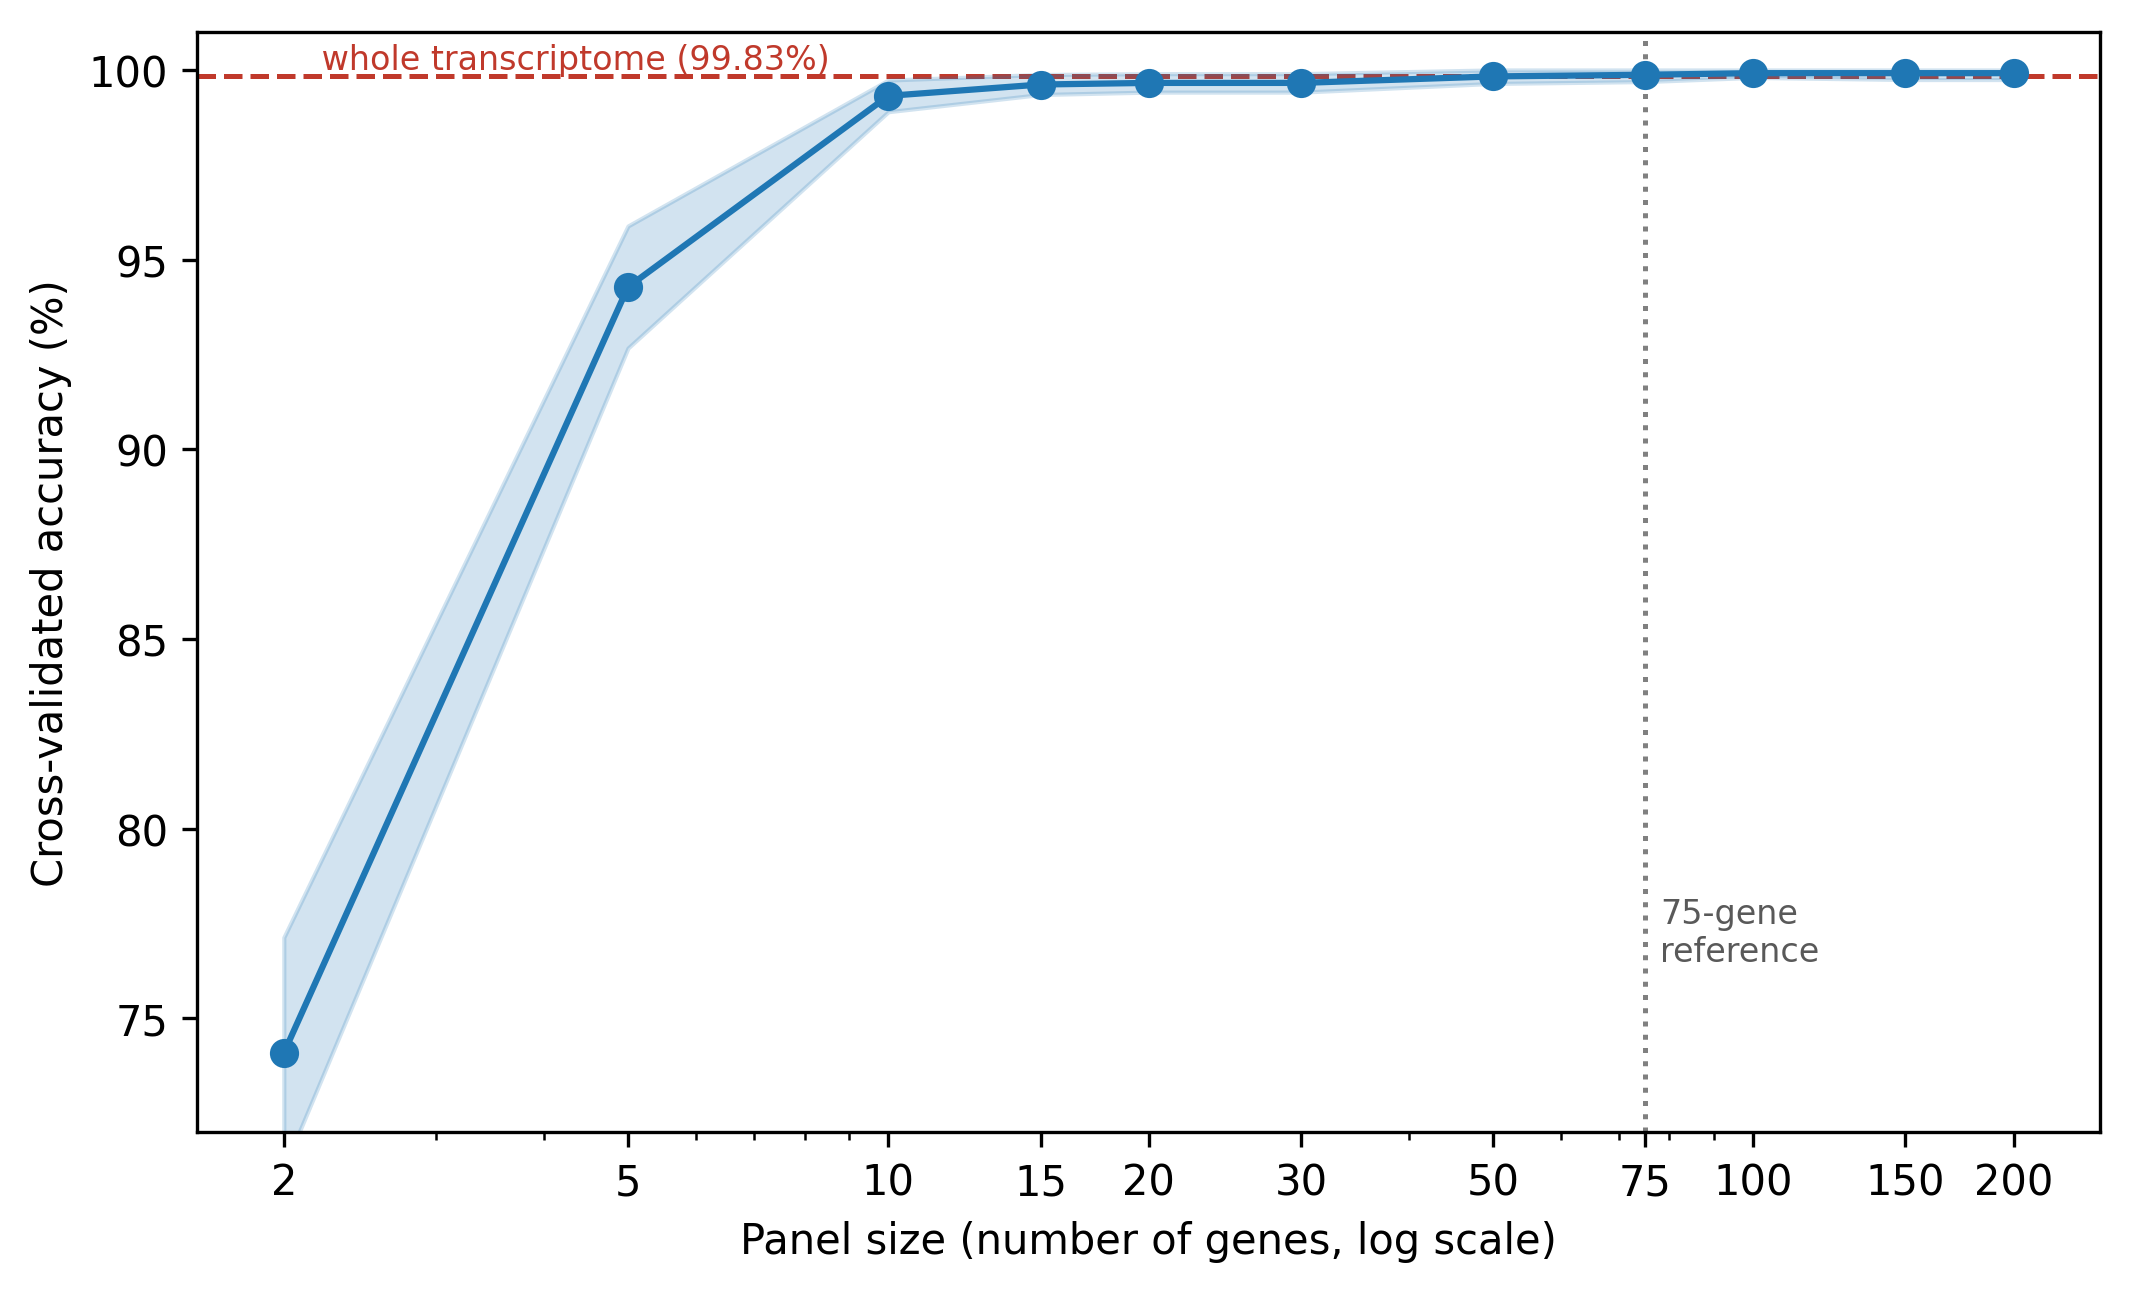
A model fitted on all 20,289 genes achieved 99.83% ± 0.30% cross-validated accuracy. Accuracy rose steeply over the first ten ranked genes and then plateaued (Figure 3): 74.09% with 2 genes, 94.28% with 5, 99.32% with 10, 99.62% with 15, 99.66% with 20 and 30, 99.83% with 50, 99.87% with 75, and 99.92% with 100 through 200. Seventy-five genes — 0.37% of the transcriptome — match the whole-transcriptome model to within 0.04 percentage points. The ranking was recomputed independently inside each training fold, so no validation sample informed the gene ordering used to score it.
| Panel size | Mean accuracy (%) | Significantly worse than |
| 2 | 74.09 | all larger sizes |
| 5 | 94.28 | all larger sizes |
| 10 | 99.32 | 50, 75, 100, 150, 200 |
| 15 | 99.62 | 150, 200 |
| 20 | 99.66 | 150, 200 |
| 30 | 99.66 | none |
| 50 | 99.83 | none |
| 75 | 99.87 | none |
| 100 | 99.92 | none |
| 150 | 99.92 | none |
| 200 | 99.92 | none |
Two features of Table 2 matter for what follows. First, the accuracy surface is flat over a wide range but not uniformly so: 15 and 20 genes remain significantly worse than 150 and 200 (p = 0.031 in each case), while every size from 30 upward is statistically indistinguishable from all larger sizes. Differences among the larger sizes are 0.04 to 0.09 percentage points — a fraction of one misclassified sample per fold.
Second, this flatness explains why the nested procedure failed to converge. When the objective cannot distinguish 30 from 200 genes, the size chosen in any fold reflects fold-level noise rather than a genuine optimum, which is exactly what the scatter across 50, 75, 100, 150 and 200 in Section “Procedure: Nested Cross-Validation and Panel Selection” shows. The same argument anticipates Section “The Selected Panel Is Largely Unstable“: an objective this flat exerts almost no pressure on which genes are selected either.
The Selected Panel
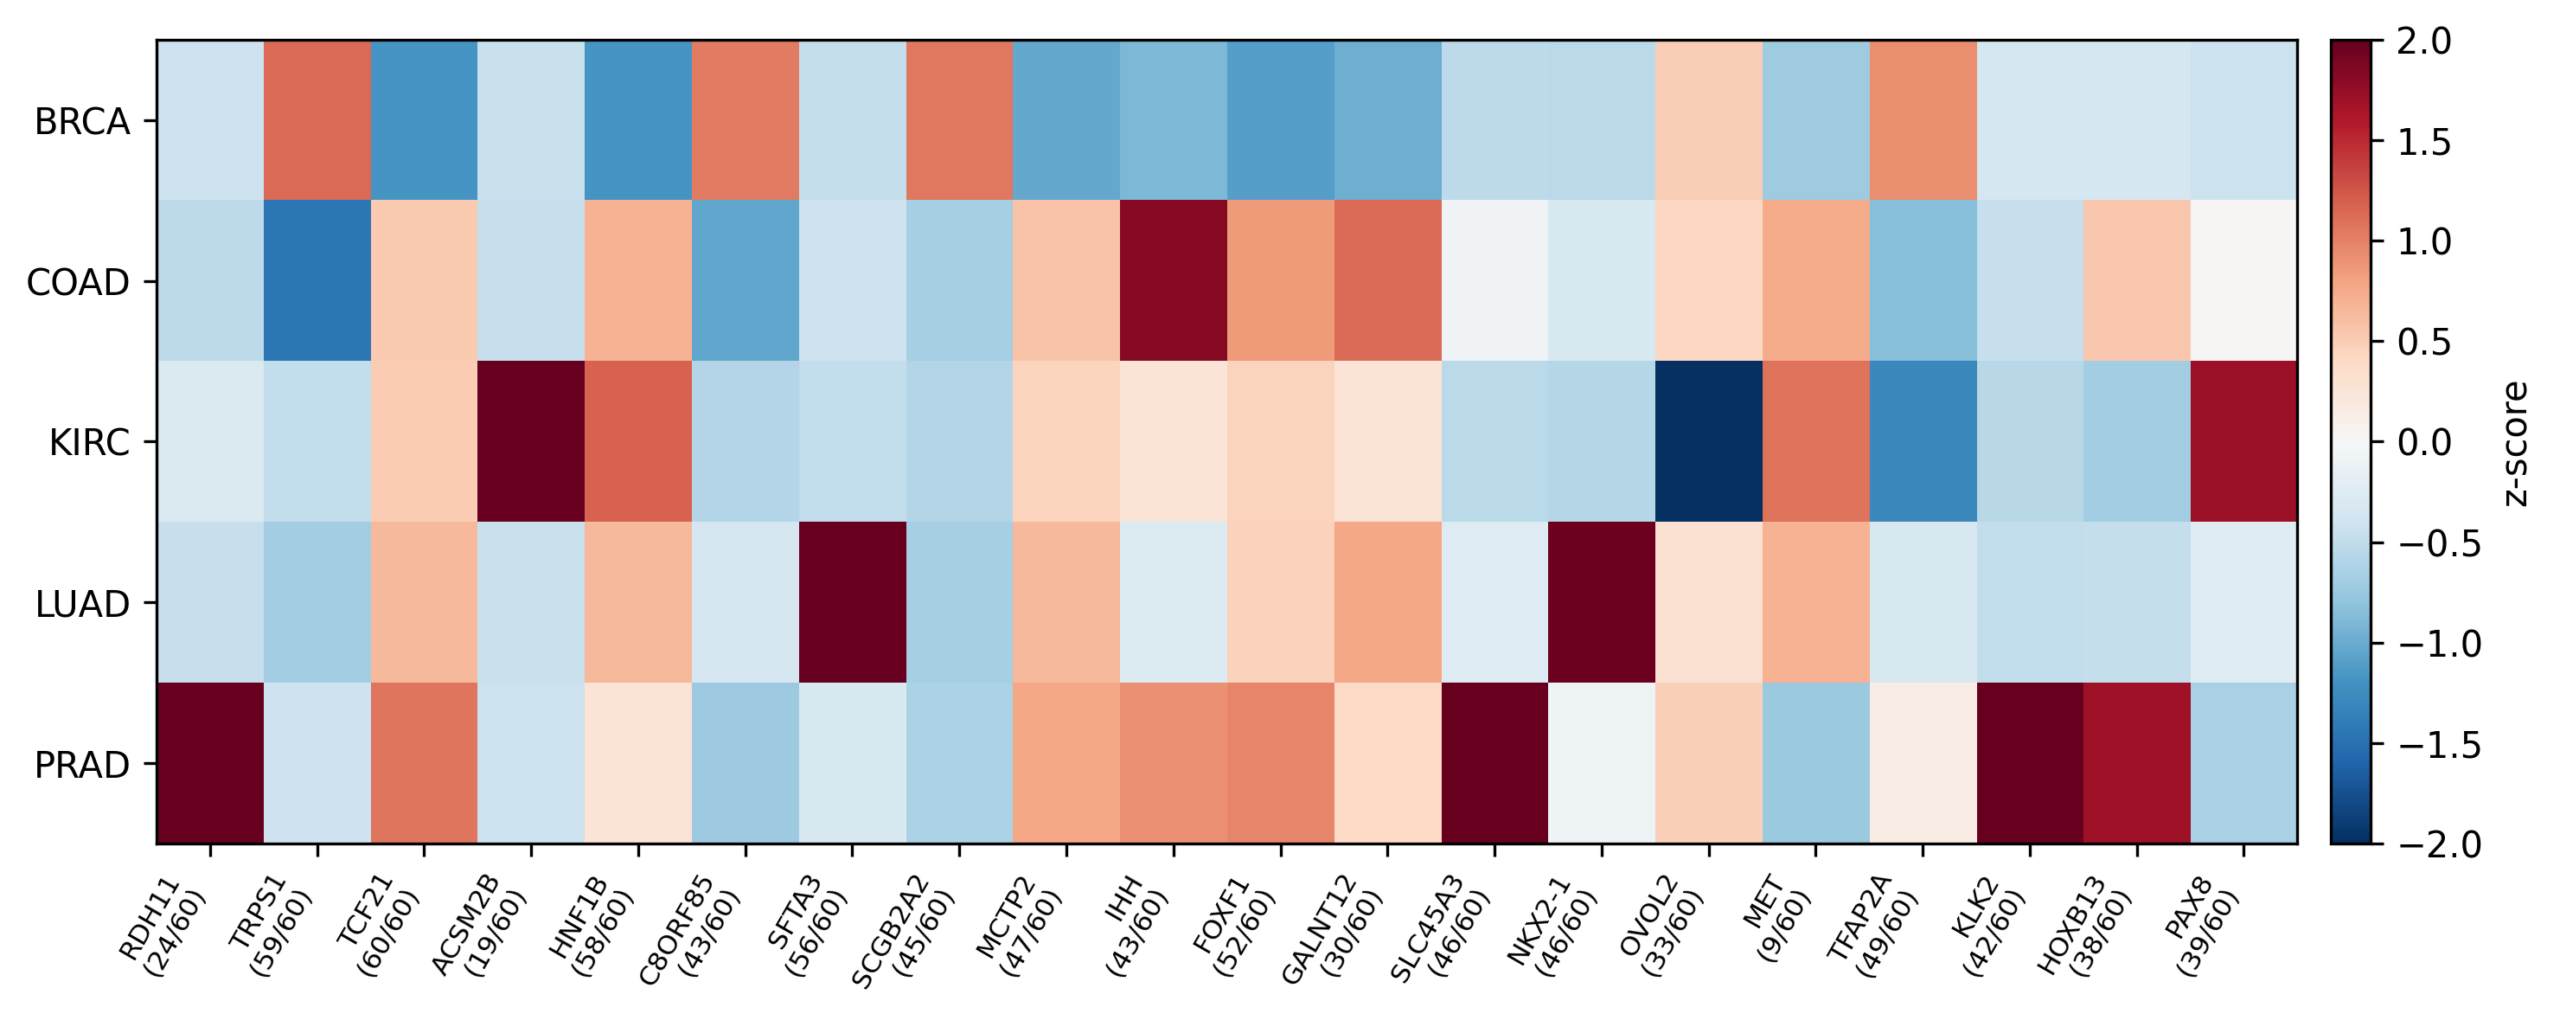
The 75-gene panel contains recognized lineage markers — NKX2-1, SFTA3 and the surfactant genes SFTPA1, SFTPA2, SFTPB and SFTPD for lung; KLK2, KLK3, KLK15, HOXB13, SLC45A3, NKX3-1 and FOLH1 for prostate; PAX2, PAX8, HNF1B and CDH16 for kidney; TRPS1, GATA3 and SCGB2A2 for breast; GPA33 for colon — alongside tissue-enriched genes and several that peak in a type without being established markers for it. Standardized mean expression of the most highly ranked of these genes across the five tumor types is shown in Figure 4. As shown below the membership is not stable, so this list should be read as one draw from a much larger pool of near-equivalent genes rather than a uniquely determined signature.
The full 75-gene panel, with each gene’s selection frequency across the 60 resamples, is provided as Supplementary Table S2.
The Panel Is Functionally Coherent Even Though Its Membership Is Not
Submitted to g:Profiler, the panel returned significant enrichment across 136 biological-process terms, 13 molecular-function terms and 2 cellular-component terms, together with hits in KEGG, Reactome (9 terms) and WikiPathways (3 terms). The strongest signal was morphogenesis of an epithelium (adjusted p = 1.71 × 10⁻¹¹), followed by urogenital system development (1.01 × 10⁻⁶), positive regulation of transcription by RNA polymerase II (3.29 × 10⁻⁶), response to chemical (2.98 × 10⁻³), dorsal/ventral pattern formation (7.49 × 10⁻³), right lung development (1.40 × 10⁻²), lung alveolus development (2.24 × 10⁻²) and regulation of hormone levels (2.66 × 10⁻²). Molecular-function terms were led by DNA-binding transcription factor activity and RNA polymerase II regulatory-region binding (3.17 and 3.20 × 10⁻³); cellular-component terms were chromatin (5.62 × 10⁻³) and clathrin-coated endocytic vesicle (2.71 × 10⁻²).
This should be read alongside Section “The Selected Panel Is Largely Unstable“. Enrichment asks whether a gene set is drawn from a coherent functional space, and this one plainly is: organ-identity transcription factors, developmental patterning genes and lineage-restricted effectors. It does not establish that the particular genes drawn from that space are reproducible. Given that 381 distinct genes entered the top 75 across resamples, and that the pool near the selection threshold is itself dominated by tissue-restricted genes, a resampled panel would enrich for similar terms while sharing a minority of its members. Functional coherence at the level of the set does not mitigate instability at the level of the gene.
Transfer to an Independent Cohort Depends Entirely on Normalization
Applied without retraining to the 440 CPTAC tumors, the frozen 75-gene classifier behaved very differently under the three normalization schemes (Table 3).
Supplied with raw CPTAC values, transfer failed: 32.05% accuracy for the random forest and 40.23% for the SVM, barely above the 25% expected from guessing a single class among four. The failure mode is informative — 237 of 440 samples were assigned by the random forest to PRAD, a class with no representatives in CPTAC at all. TCGA expression is distributed as log2(norm_count + 1) from RSEM while CPTAC is upper-quartile-normalized log2 RSEM; the two encode the same biology on incompatible scales, and a frozen model has no mechanism to bridge them.
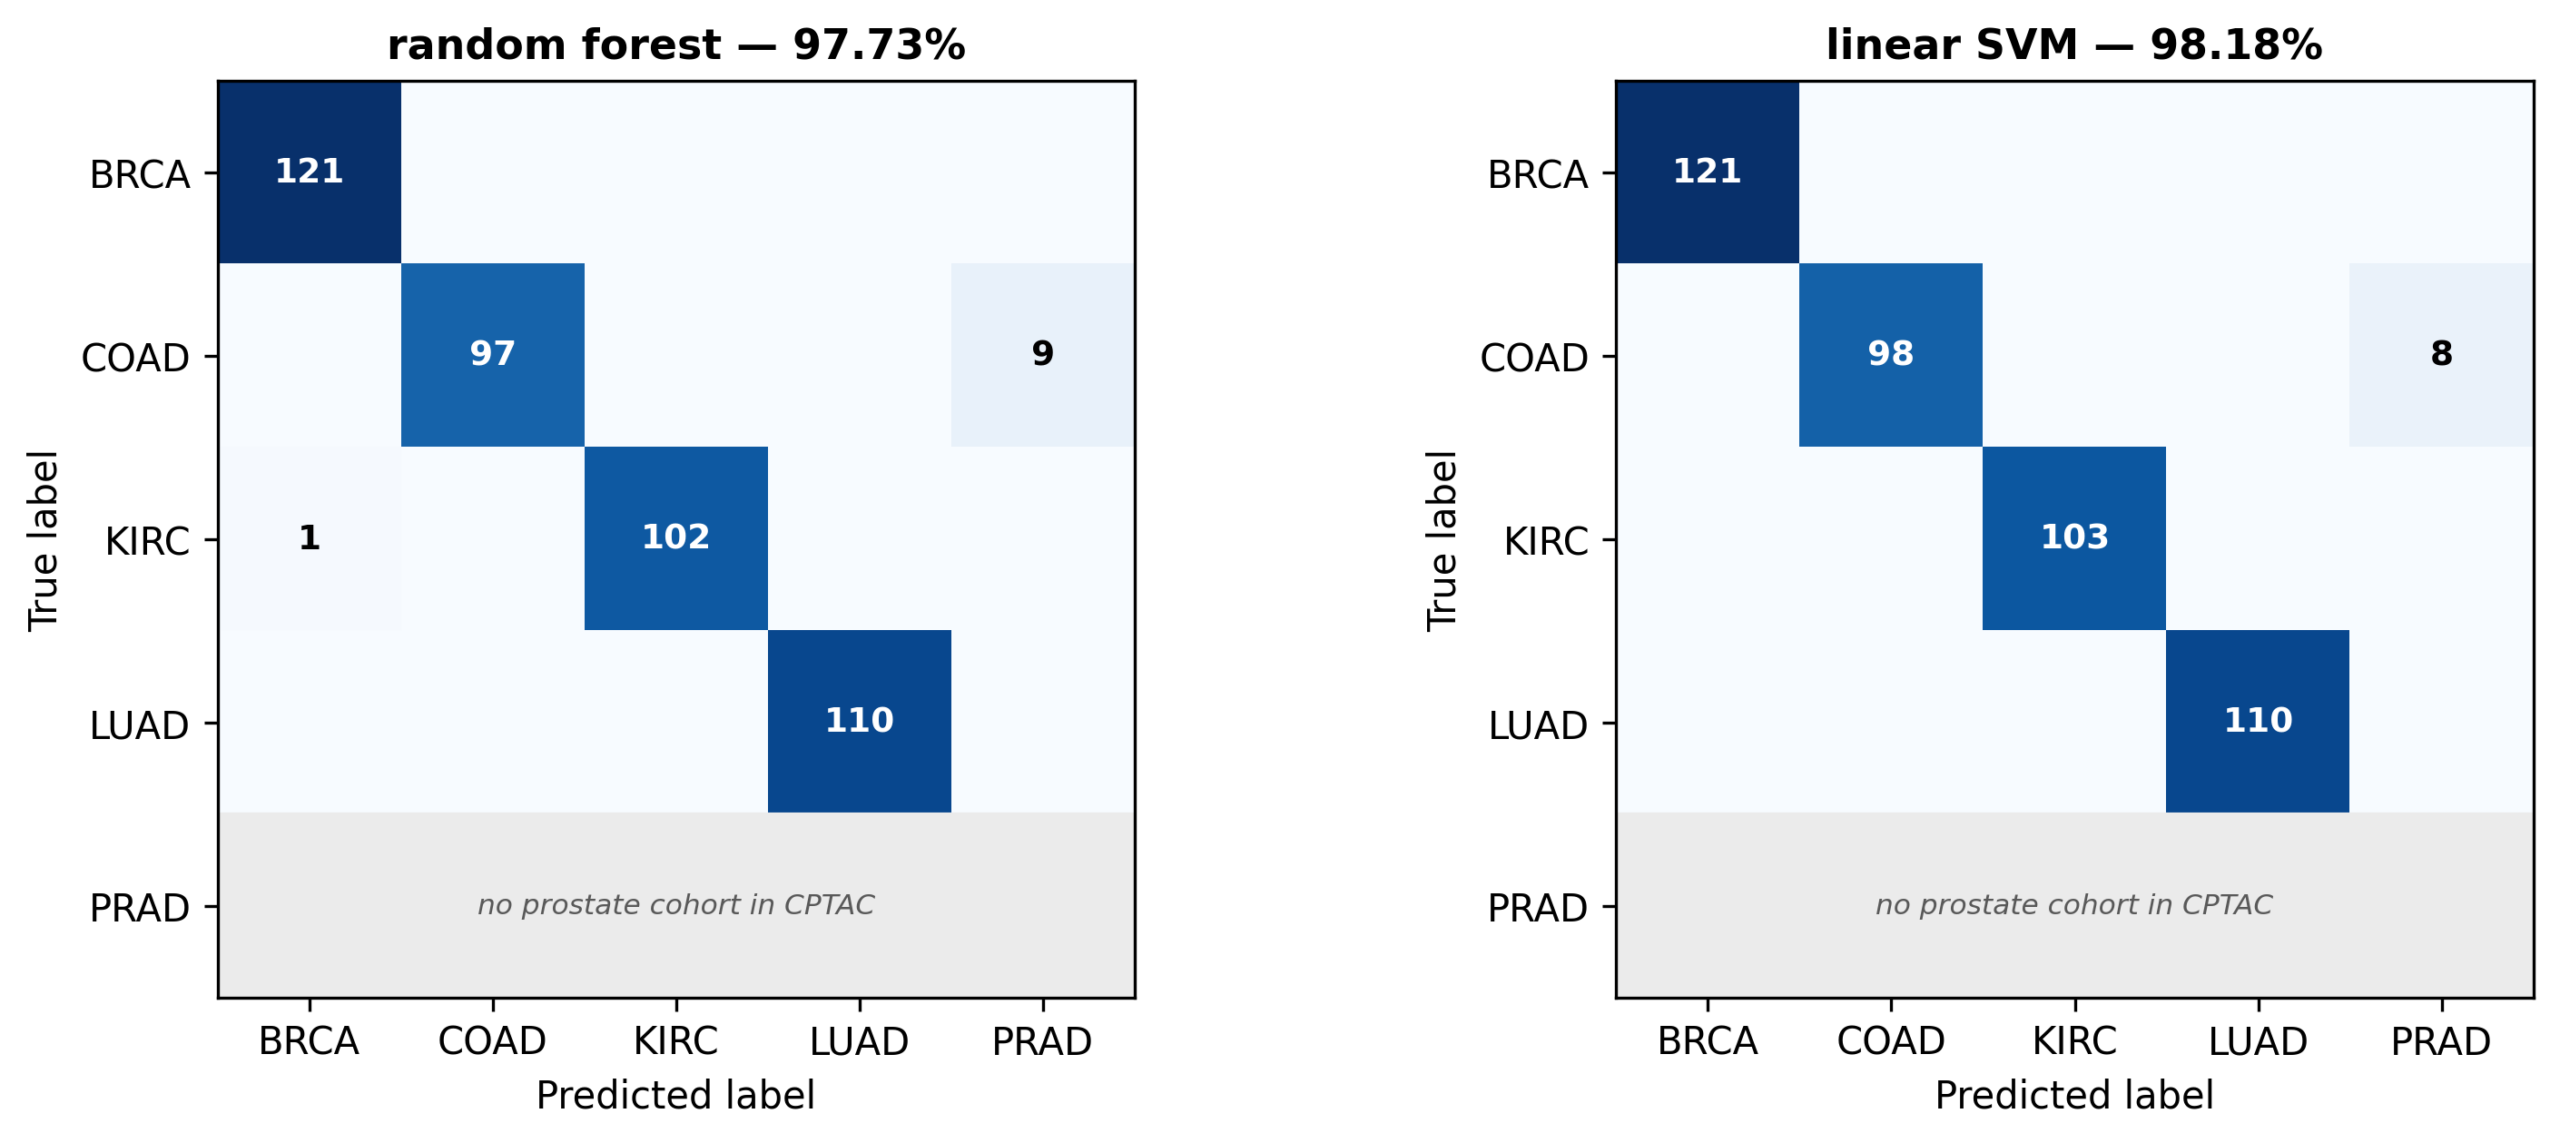
Under pooled-batch standardization, in which each gene was z-scored once across all 440 samples with no use of cohort labels, transfer succeeded: 97.73% accuracy for the random forest and 98.18% for the SVM, with macro-F1 of 98.67% and 99.02% respectively computed across the four classes represented in CPTAC. This is the realistic setting for batch-level deployment, in which a set of unlabeled tumors is normalized against itself; it does not extend to an isolated prospective sample, for which no batch statistics exist.
The error structure is highly asymmetric (Figure 5). The random forest made only 10 errors in 440 samples, and 9 of them were colon tumors assigned to PRAD — the class that cannot be correct. Breast (121/121) and lung (110/110) were classified perfectly and kidney lost a single sample. The SVM shows the same pattern in purer form: all 8 of its errors are COAD→PRAD, and the other three classes are perfect. Setting aside predictions into the empty class, the frozen panel separates the four available types with one error in 440 for the random forest and none for the SVM.
Almost the entire external shortfall is therefore attributable to one failure mode — colon tumors drawn into a class that cannot be correct — rather than to degraded discrimination among the classes present. That failure mode is a predictable consequence of applying a five-class model to a four-class cohort: with no prostate samples anchoring the boundary, the region assigned to PRAD absorbs whichever class sits nearest, here colon. This is a limitation of using a frozen panel rather than of its discriminative content.
The within-sample rank transform, which requires no batch statistics at all, reached 65.91% (random forest) and 81.14% (SVM) — better than raw values but well short of pooled-batch standardization, indicating that much of the panel’s discriminative information resides in between-sample expression levels rather than in the within-sample ordering of the genes.
An earlier version of this study applied the frozen panel to GSE54460, a cohort of 106 formalin-fixed, FPKM-quantified prostate specimens obtained from the Gene Expression Omnibus, as a deliberate cross-platform stress test. Transfer failed: recall was 0% under training-fixed normalization and 10–19% under pooled normalization. Panel genes in that cohort sit 5 to 9 log2 units below the training mean, so the frozen model reads them off-scale, while KLK2 was nonetheless correctly elevated in the prostate specimens — a failure of scale and platform rather than of biology. That observation motivated the systematic normalization comparison reported in this section, which supersedes it as a characterization of when transfer succeeds; the cross-platform cohort itself was not carried forward to the 75-gene panel.
| Normalization | Model | Accuracy (%) | Macro-F1 (%) | Predicted PRAD |
| Raw values | Random forest | 32.05 | 32.05 | 237 |
| Raw values | Linear SVM | 40.23 | 39.58 | 167 |
| Pooled batch | Random forest | 97.73 | 98.67 | 9 |
| Pooled batch | Linear SVM | 98.18 | 99.02 | 8 |
| Within-sample rank | Random forest | 65.91 | 59.44 | 0 |
| Within-sample rank | Linear SVM | 81.14 | 77.12 | 0 |
Two conclusions follow. Transfer of a frozen panel across consortia is achievable but conditional: it requires the target batch in hand for normalization, which is possible for a batch of specimens and impossible for a single prospective sample. And the success of pooled-batch transfer provides evidence against the concern that the classifier merely exploits TCGA-specific technical variation, since CPTAC is an independent consortium with a different sequencing and quantification pipeline.
The Selected Panel Is Largely Unstable
Re-deriving the top-75 panel across 60 resamples of the development data, only 14 of 75 genes were selected in at least 80% of resamples: C20ORF56, FOXF1, GATA3, HKDC1, HNF1B, LMX1B, PRLR, SFTA3, SFTPA1, SFTPA2, SFTPB, TCF21, TFAP2A and TRPS1. 381 distinct genes entered the top 75 at least once across the 60 resamples — more than five times the nominal panel size — and the mean pairwise Jaccard overlap between resampled panels was 0.319 (Kuncheva index 0.480). Overlap with the reported panel ranged from 0.250 to 0.485, mean 0.339. For comparison, the expected Jaccard overlap between independent random draws of 75 genes from 20,289 is 0.0019, so the observed overlap is far above chance: the panels are not random, but are drawn from a large constrained pool. The complete list of all 381 genes with their selection frequencies is provided in Supplementary Table S1.
Three features deserve emphasis. First, the stable core is not composed of the canonical markers: KLK2, KLK3, HOXB13, NKX3-1, PAX2, PAX8, SLC45A3 and NKX2-1 all fall below the 80% threshold, while the core is dominated by the lung surfactant block (SFTPA1, SFTPA2, SFTPB, SFTA3) and a handful of transcription factors.
Second, selection frequency bears little relation to reported importance rank. RDH11, ranked first by random-forest importance, was reselected in only 24 of 60 resamples (0.40) and does not reach the core.
Third, and most tellingly, the most reproducibly selected gene outside the reported panel in the entire analysis is NAPSA. NAPSA entered the top 75 in 52 of 60 resamples (0.87) — above the core threshold, and more frequently than 67 of the 75 reported genes. SFTPC (45/60), CHRNA2 (41/60), CPNE4 (40/60) and FXYD2 (40/60) likewise outrank most panel members. Panel membership is therefore a poor guide to which genes the procedure actually tends to select.
Stability Is Better at 75 Genes Than at 20, but Remains Poor
Because stability depends mechanically on the requested set size, the analysis was also run at k = 20 (Table 4). Membership stability is better at the larger size: the core rises from 15.0% to 18.7% of the panel, mean pairwise Jaccard from 0.215 to 0.319, and the Kuncheva index from 0.349 to 0.480. Enlarging the panel does make membership somewhat more reproducible.
The improvement does not change the conclusion. At 75 genes, 381 distinct genes still entered the panel across resamples and 61 of 75 still failed the 80% threshold. Part of the improvement is mechanical, since larger sets overlap more readily, which is why the chance-corrected index rises less steeply than raw Jaccard. A panel in which four genes in five are not reliably reselected is not a stable signature at either size.
| Panel size | Core genes (≥80%) | Core fraction | Distinct genes entering top k | Mean pairwise Jaccard | Kuncheva index | Expected random Jaccard |
| 20 | 3 | 0.150 | 149 | 0.215 | 0.349 | 0.0005 |
| 75 | 14 | 0.187 | 381 | 0.319 | 0.480 | 0.0019 |
A Note on the 20-Gene Panel
An earlier version of this analysis reported a 20-gene panel. That size was not the product of the selection rule stated in Section “Procedure: Nested Cross-Validation and Panel Selection“; it was fixed before the rule was formalized, and when a one-standard-error rule is applied to the cross-validation folds it selects 75 genes rather than 20. Table 2 shows why: 20 genes is significantly worse than 150 and 200 genes (p = 0.031), so it does not satisfy a parsimony criterion defined against all larger sizes either.
We report this explicitly because it is an instance of the phenomenon the paper describes. The choice of panel size, like the choice of panel membership, was unstable under scrutiny, and the original value survived not because it was selected but because it had been reported. Stability results for the 20-gene panel are retained in Table 4 for comparison.
Instability Reflects Rank Noise at the Selection Threshold, Not Biological Redundancy
A natural explanation for unstable membership is redundancy: if several co-expressed genes carry the same lineage signal, whichever one surfaces is arbitrary but the underlying biology is preserved. The substitution analysis does not support this explanation.
Across the 370 substitution events recorded at k = 75, the median Pearson correlation between a dropped gene and the gene that replaced it was 0.058 — essentially zero. Forty-nine percent of substitutions involved a negatively correlated replacement, and only 14% exceeded r = 0.7. Under a redundancy mechanism the distribution would be concentrated at high positive correlation; it is instead centred at approximately no relationship at all. The same analysis at k = 20 gave a median correlation of −0.124, with 58% negative.
The identity of the replacements is equally telling. Five genes — NAPSA, SFTPC, CHRNA2, CPNE4 and FXYD2 — accounted for 302 of the 370 substitution events, entering the panel whenever a slot opened regardless of which gene had left. These are not lineage-matched stand-ins for the genes they displaced; they are the genes ranked immediately below the selection cutoff.
The mechanism this supports is continuous with Section “A Compact Panel Matches Whole-Transcriptome Accuracy, and the Accuracy Surface Is Flat“. Because the accuracy surface is flat across a wide range of panel sizes, the importance ranking is correspondingly flat near the selection threshold, and small perturbations of the training data reorder genes across the cutoff essentially at random. Instability here is a property of an arbitrary threshold imposed on a nearly flat ranking, not of interchangeable biology.
Sensitivity Analyses
Ranking criterion. Repeating the stability analysis with permutation importance in place of Gini importance made membership markedly less stable, not more (Table 5). No gene reached the 80% threshold at all, so the stable core fell from three genes to zero. The number of distinct genes entering the top 20 rose from 149 to 305 — more than fifteen times the panel size — and mean pairwise Jaccard overlap fell from 0.215 to 0.053, with the Kuncheva index falling from 0.349 to 0.087.
This bears directly on the concern that the instability reported here might be an artifact of impurity-based importance. Permutation importance is the standard remedy for the known irregularity of Gini importance with correlated predictors12,13, and under it the panel does not merely remain unstable but ceases to have any reproducible membership whatever. Two differences from the primary analysis should be kept in view: this run used 30 resamples rather than 60 and permuted only the 500 highest-ranked genes. Neither accounts for a gap of this size, and fewer resamples would if anything inflate apparent stability.
There is also a plausible mechanism, continuous with Section “Instability Reflects Rank Noise at the Selection Threshold, Not Biological Redundancy“. Permutation importance measures the accuracy lost when a feature is shuffled; when the accuracy surface is as flat as Figure 3 shows, shuffling any one gene costs almost nothing, because correlated genes carry the same discriminative signal. The quantity being ranked is therefore close to noise. Rather than a separate finding, this is the threshold-noise account of Section “Instability Reflects Rank Noise at the Selection Threshold, Not Biological Redundancy” seen through a second importance measure.
| Importance measure | Resamples | Core genes (≥80%) | Distinct genes entering top 20 | Mean pairwise Jaccard | Kuncheva index |
| Gini (primary) | 60 | 3 | 149 | 0.215 | 0.349 |
| Permutation | 30 | 0 | 305 | 0.053 | 0.087 |
Class balance. With all five cohorts downsampled to n = 286 (1,430 samples), accuracy at the reported 75-gene panel was 99.86%, against 99.87% on the full imbalanced data, and the shape of the accuracy-versus-size curve was unchanged across the whole grid (73.92% at 2 genes, 96.01% at 5, 99.09% at 10, 99.86% at 50–100, 99.93% at 150–200). Classification performance therefore does not depend on the cohort size imbalance, and the concern that the classifier exploits cohort-specific batch structure is not supported.
The stable core. A classifier restricted to the fourteen stably selected genes was not evaluated in this study. Quantifying how much of the model’s performance rests on reproducibly selected genes, as opposed to genes that vary across resamples, is a direct extension of this work and is named as such in Section “Limitations“.
Discussion
Restatement of Key Findings
Four findings stand out. First, five tumor types are near-perfectly separable from expression data, and a 75-gene panel comes within 0.04 percentage points of a model using all 20,289 genes — consistent with pan-cancer analyses showing that molecular classification is dominated by cell-of-origin patterns rather than by shared oncogenic processes21. Second, the accuracy surface across panel sizes is statistically flat above 15 genes, and the prespecified nested procedure consequently failed to converge on a panel size at all. Third, the specific panel membership is largely unstable: 14 of 75 genes reach the 80% threshold, 381 genes cycle through, the canonical lineage markers are among the least stable, and a highly reproducibly selected gene, NAPSA, was not in the reported panel. Fourth, the instability is driven by rank noise at the selection threshold rather than by biological redundancy, and it is not an artifact of the importance measure, since under permutation importance the stable core disappears altogether.
Implications and Significance
With under a fifth of the panel reliably selected and 381 genes cycling through the top 75, the high accuracy clearly does not depend on this particular list; many near-equivalent panels would perform as well. It is fair to say the classification task is interpretable, since recognizable lineage markers appear among the top-ranked genes and the panel enriches for organ-identity programs. It is not fair to call this list a biomarker signature, because most of its canonical markers are not reliably selected at all.
The mechanism in Section “Instability Reflects Rank Noise at the Selection Threshold, Not Biological Redundancy” makes this more than a cautionary observation. Had instability arisen from redundancy, a reader could reasonably conclude the biology was robust even if the list was not. What the data show instead is that the selection threshold is arbitrary: genes cross it in response to noise, and frequently displace genes they are uncorrelated with. Nothing about the specific list is preserved.
This reframing, rather than the instability itself, is the contribution. The literature reviewed in Section “Prior Work on Feature-Selection Stability” established decades ago that feature selection in high-dimensional correlated data is unstable. What this study adds is a demonstration, on current RNA-seq data with a routine pipeline, that the problem arises immediately, in an easy five-class task, at near-ceiling accuracy, and would be invisible to a reader shown only the accuracy and the gene list.Connection to Objectives
The first objective was met: a compact panel reproduced whole-transcriptome accuracy to within 0.04 percentage points, benchmarked against a model actually fitted on all genes. The second was met conditionally, since transfer to an independent consortium reached 97.7% under batch normalization and failed without it. The third was met more sharply than anticipated: accuracy and selection stability came apart, the genes that came apart worst were the canonical markers, and the mechanism proved to be threshold noise rather than the redundancy expected.
Comparison with Prior Work
Prior RNA-seq classifiers have mostly pursued the harder pan-cancer problem and emphasized accuracy. Li and colleagues classified 31 TCGA types using k-nearest neighbours with genetic-algorithm selection22; Lyu and Haque classified 33 types with a convolutional neural network at 95.59%23; Mostavi and colleagues compared convolutional architectures24; and Grewal and colleagues reached 99% for primary cancers in an independent cohort, extending to cancers of unknown primary25. These many-class tasks are not directly comparable to a five-type problem, but none reports the stability of the feature set underlying the model.
Against the stability literature the positioning differs. Ein-Dor5 and Michiels6 reached an analogous conclusion for breast-cancer prognostic signatures in the microarray era, and the present results confirm that it survives the transition to RNA-seq, tree-ensemble selection, and a far easier task. Haury and colleagues11 showed selection method materially affects stability, which bounds how far this result generalizes beyond importance-based ranking.
Interpretation of the Instability
Three explanations for the observed instability can be distinguished, and the evidence bears on each differently.
Biological redundancy — many genes genuinely carrying overlapping tissue-of-origin signal — is not supported by the substitution analysis. A median dropped-to-replacement correlation of −0.124, with 58% of substitutions negatively correlated, is inconsistent with correlated genes standing in for one another. Only 13% of substitutions exceeded r = 0.7.
Statistical instability at the selection threshold — a nearly flat importance ranking, so that small perturbations reorder genes across an arbitrary cutoff — is supported, both by the concentration of substitutions in five near-threshold genes and by the flat accuracy surface documented in Section “A Compact Panel Matches Whole-Transcriptome Accuracy, and the Accuracy Surface Is Flat“. When accuracy is statistically indistinguishable from 15 to 200 genes, no strong pressure exists on which genes occupy positions 15 through 200.
Methodological artifact specific to Gini importance — the possibility that another ranking criterion would be markedly more stable — is not supported, and the evidence points the other way. Repeating the analysis under permutation importance, the standard remedy for the documented irregularity of impurity-based importance with correlated predictors12,13, eliminated the stable core entirely and more than doubled the number of genes cycling through the panel (Section “Sensitivity Analyses“). The instability is therefore not an artifact of the particular importance measure; it is at least as severe under the measure recommended to correct that measure’s known bias.
This does not establish that no selection method would yield a stable panel: approaches operating on different principles, such as stability selection10 or regularization, were not tested, and selection method is known to affect stability materially11. It does establish that switching between the two importance measures in routine use does not resolve the problem.
We therefore do not claim that canonical biomarkers are biologically unimportant. The claim is that under this widely used selection procedure their appearance in a reported top-k list is not reproducible, and that a reader cannot infer from such a list that the named genes are uniquely or even preferentially informative.
Limitations
Several limitations apply.
Near-ceiling internal accuracy reflects how distinct these five lineages are and should not be read as a general benchmark; stability in harder regimes remains untested.
The held-out test set is not strictly untouched. An earlier version of this analysis examined held-out accuracy before the panel size was finalized. The parsimony rule reported in Section “Procedure: Nested Cross-Validation and Panel Selection” is defined on cross-validation folds and makes no reference to the test set, but it was formulated after that earlier inspection. The internal figure of 99.32% should therefore be read as an internal estimate rather than a fully independent one, and the CPTAC evaluation, which was never used in any selection decision, is the cleaner external number.
Hyperparameter optimization was minimal: the SVM regularization parameter was fixed at C = 1.0 and forest sizes were fixed rather than tuned. A tuned classifier might achieve marginally higher accuracy but would not change which genes the ranking selects.
Selection stability was assessed under two importance measures, both derived from a random forest. The permutation-importance run used 30 rather than 60 resamples and permuted a 500-gene pool rather than the full transcriptome, so it is a sensitivity check rather than an exact replicate. Approaches operating on different principles — stability selection10, elastic-net regularization, ensemble feature selection — were not tested and might yield a more stable core11.
The accuracy attainable from the stable core alone was not measured, so the proportion of classification performance attributable to reproducibly selected genes remains unquantified.
External evaluation covers four of the five classes, since CPTAC has no prostate cohort; prostate transfer is not assessed in this cohort, and the earlier cross-platform test described in Section “Transfer to an Independent Cohort Depends Entirely on Normalization” failed for reasons of scale and platform. Transfer is also conditional on batch normalization, as Section “Transfer to an Independent Cohort Depends Entirely on Normalization” documents, so the generalizability claim is bounded by the availability of a target batch.
The external cohort tests prediction transfer of a frozen panel, not independent rediscovery. A full reproducibility analysis, in which the complete selection pipeline is run independently in an external cohort and gene membership compared against the TCGA panel, was outside the scope of this study and is the strongest single extension of it.
Finally, several panel genes peak in a tumor type without being established markers for it, and only a single expression modality was used.
Recommendations and Closing Thought
Two recommendations follow. Studies reporting a compact panel should report its selection frequency across resamples alongside its accuracy; the analysis is inexpensive and changes what the panel can honestly be claimed to be. And studies proposing frozen signatures should state the normalization required for transfer, since one that succeeds only when the target batch is available in advance has not been shown to work prospectively.
A compact RNA-seq panel separates five tumor types at near-ceiling accuracy and transfers to an independent consortium at 97.7% under batch normalization, yet only fourteen of its seventy-five genes survive resampling, its top-ranked gene appears in fewer than half of them, and a highly reproducibly selected gene, NAPSA, was not in the reported panel. High classification accuracy did not imply a stable gene signature. The reproducible objects here are the classification task, the accuracy, and a small stable core — not the specific gene list, and not even the size of that list. Whether a published panel is the stable kind is not visible from its accuracy, and the analysis needed to find out is short enough that there is little reason to leave it out.
Acknowledgments
This research received no external funding. The author is the sole contributor and performed all aspects of the work.
Data and code availability. TCGA data were obtained via UCSC Xena (https://xenabrowser.net) and CPTAC data via LinkedOmicsKB (https://kb.linkedomics.org); GSE54460, referenced in Section “Transfer to an Independent Cohort Depends Entirely on Normalization“, is available from the Gene Expression Omnibus. All analysis code, the gene panel, the per-gene selection-frequency table, and the environment specification are openly available under the MIT license at https://github.com/IraSirohi/isirohi-research.
Conflicts of interest. The author declares no conflict of interest.
Artificial Intelligence (AI) Disclosure
All aspects of this study, including its conceptualization, research questions, study design, methodology, data acquisition, feature-selection strategy, statistical analyses, interpretation of results, and conclusions, were developed independently by the author. The manuscript was written and revised entirely by the author without the use of generative artificial intelligence for drafting, editing, or scientific interpretation.
The author accepts full responsibility for the integrity, originality, accuracy, and scientific content of this work.
Supplementary Material
References
- T. R. Golub, D. K. Slonim, P. Tamayo, C. Huard, M. Gaasenbeek, J. P. Mesirov, H. Coller, M. L. Loh, J. R. Downing, M. A. Caligiuri, C. D. Bloomfield, E. S. Lander. Molecular classification of cancer: class discovery and class prediction by gene expression monitoring. Science. Vol. 286, pg. 531–537, 1999, https://doi.org/10.1126/science.286.5439.531. [↩]
- J. N. Weinstein, E. A. Collisson, G. B. Mills, K. R. Mills Shaw, B. A. Ozenberger, K. Ellrott, I. Shmulevich, C. Sander, J. M. Stuart. The cancer genome atlas pan-cancer analysis project. Nature Genetics. Vol. 45, pg. 1113–1120, 2013, https://doi.org/10.1038/ng.2764. [↩]
- I. Guyon, A. Elisseeff. An introduction to variable and feature selection. Journal of Machine Learning Research. Vol. 3, pg. 1157–1182, 2003. [↩]
- C. Rudin. Stop explaining black box machine learning models for high stakes decisions and use interpretable models instead. Nature Machine Intelligence. Vol. 1, pg. 206–215, 2019, https://doi.org/10.1038/s42256-019-0048-x. [↩]
- L. Ein-Dor, I. Kela, G. Getz, D. Givol, E. Domany. Outcome signature genes in breast cancer: is there a unique set? Bioinformatics. Vol. 21, pg. 171–178, 2005, https://doi.org/10.1093/bioinformatics/bth469. [↩] [↩]
- S. Michiels, S. Koscielny, C. Hill. Prediction of cancer outcome with microarrays: a multiple random validation strategy. The Lancet. Vol. 365, pg. 488–492, 2005, https://doi.org/10.1016/S0140-6736(05)17866-0. [↩] [↩]
- A. Kalousis, J. Prados, M. Hilario. Stability of feature selection algorithms: a study on high-dimensional spaces. Knowledge and Information Systems. Vol. 12, pg. 95–116, 2007, https://doi.org/10.1007/s10115-006-0040-8. [↩]
- L. I. Kuncheva. A stability index for feature selection. In Proceedings of the 25th IASTED International Multi-Conference: Artificial Intelligence and Applications. pg. 390–395, ACTA Press, Anaheim, CA, USA, 2007. [↩] [↩]
- S. Nogueira, K. Sechidis, G. Brown. On the stability of feature selection algorithms. Journal of Machine Learning Research. Vol. 18, pg. 6345–6398, 2017. [↩]
- N. Meinshausen, P. Bühlmann. Stability selection. Journal of the Royal Statistical Society: Series B (Statistical Methodology). Vol. 72, pg. 417–473, 2010, https://doi.org/10.1111/j.1467-9868.2010.00740.x. [↩] [↩] [↩]
- A.-C. Haury, P. Gestraud, J.-P. Vert. The influence of feature selection methods on accuracy, stability and interpretability of molecular signatures. PLoS ONE. Vol. 6, pg. e28210, 2011, https://doi.org/10.1371/journal.pone.0028210. [↩] [↩] [↩] [↩]
- C. Strobl, A.-L. Boulesteix, A. Zeileis, T. Hothorn. Bias in random forest variable importance measures: illustrations, sources and a solution. BMC Bioinformatics. Vol. 8, pg. 25, 2007, https://doi.org/10.1186/1471-2105-8-25. [↩] [↩] [↩] [↩] [↩]
- C. Strobl, A.-L. Boulesteix, T. Kneib, T. Augustin, A. Zeileis. Conditional variable importance for random forests. BMC Bioinformatics. Vol. 9, pg. 307, 2008, https://doi.org/10.1186/1471-2105-9-307. [↩] [↩] [↩] [↩] [↩]
- Z. He, W. Yu. Stable feature selection for biomarker discovery. Computational Biology and Chemistry. Vol. 34, pg. 215–225, 2010, https://doi.org/10.1016/j.compbiolchem.2010.07.002. [↩]
- M. J. Goldman, B. Craft, M. Hastie, K. Repečka, F. McDade, A. Kamath, A. Banerjee, Y. Luo, D. Rogers, A. N. Brooks, J. Zhu, D. Haussler. Visualizing and interpreting cancer genomics data via the Xena platform. Nature Biotechnology. Vol. 38, pg. 675–678, 2020, https://doi.org/10.1038/s41587-020-0546-8. [↩]
- S. V. Vasaikar, P. Straub, J. Wang, B. Zhang. LinkedOmics: analyzing multi-omics data within and across 32 cancer types. Nucleic Acids Research. Vol. 46, pg. D956–D963, 2018, https://doi.org/10.1093/nar/gkx1090. [↩]
- L. Breiman. Random forests. Machine Learning. Vol. 45, pg. 5–32, 2001, https://doi.org/10.1023/A:1010933404324. [↩] [↩]
- C. Cortes, V. Vapnik. Support-vector networks. Machine Learning. Vol. 20, pg. 273–297, 1995, https://doi.org/10.1007/BF00994018. [↩]
- F. Pedregosa, G. Varoquaux, A. Gramfort, V. Michel, B. Thirion, O. Grisel, M. Blondel, P. Prettenhofer, R. Weiss, V. Dubourg, J. Vanderplas, A. Passos, D. Cournapeau, M. Brucher, M. Perrot, É. Duchesnay. Scikit-learn: machine learning in Python. Journal of Machine Learning Research. Vol. 12, pg. 2825–2830, 2011. [↩]
- U. Raudvere, L. Kolberg, I. Kuzmin, T. Arak, P. Adler, H. Peterson, J. Vilo. g:Profiler: a web server for functional enrichment analysis and conversions of gene lists (2019 update). Nucleic Acids Research. Vol. 47, pg. W191–W198, 2019, https://doi.org/10.1093/nar/gkz369. [↩]
- K. A. Hoadley, C. Yau, T. Hinoue, D. M. Wolf, A. J. Lazar, E. Drill, R. Shen, A. M. Taylor, A. D. Cherniack, V. Thorsson, R. Akbani, R. Bowlby, C. K. Wong, M. Wiznerowicz, F. Sanchez-Vega, A. G. Robertson, B. G. Schneider, M. S. Lawrence, H. Noushmehr, T. M. Malta, The Cancer Genome Atlas Network, J. M. Stuart, C. C. Benz, P. W. Laird. Cell-of-origin patterns dominate the molecular classification of 10,000 tumors from 33 types of cancer. Cell. Vol. 173, pg. 291–304.e6, 2018, https://doi.org/10.1016/j.cell.2018.03.022. [↩]
- Y. Li, K. Kang, J. M. Krahn, N. Croutwater, K. Lee, D. M. Umbach, L. Li. A comprehensive genomic pan-cancer classification using the cancer genome atlas gene expression data. BMC Genomics. Vol. 18, pg. 508, 2017, https://doi.org/10.1186/s12864-017-3906-0. [↩]
- B. Lyu, A. Haque. Deep learning based tumor type classification using gene expression data. In Proceedings of the 2018 ACM International Conference on Bioinformatics, Computational Biology, and Health Informatics. pg. 89–96, ACM, New York, NY, USA, 2018, https://doi.org/10.1145/3233547.3233588. [↩]
- M. Mostavi, Y.-C. Chiu, Y. Huang, Y. Chen. Convolutional neural network models for cancer type prediction from gene expression. BMC Medical Genomics. Vol. 13, pg. 44, 2020, https://doi.org/10.1186/s12920-020-0677-2. [↩]
- J. K. Grewal, B. Tessier-Cloutier, M. Jones, S. Gakkhar, Y. Ma, R. Moore, A. J. Mungall, Y. Zhao, M. D. Taylor, K. Gelmon, H. Lim, D. Renouf, J. Laskin, M. Marra, S. Yip, S. J. M. Jones. Application of a neural network whole transcriptome-based pan-cancer method for diagnosis of primary and metastatic cancers. JAMA Network Open. Vol. 2, pg. e192597, 2019, https://doi.org/10.1001/jamanetworkopen.2019.2597. [↩]