Abstract
For decades, algorithmic music generation has been a significant focus of research in computing. However, many of the leading methods now depend heavily on deep neural networks, which can be hard to understand and often show clear biases towards Western music. In contrast, first-order Markov transition matrices present a clear, rule-based alternative that allows for direct inspection and modification. This makes them useful for studying culturally structured melodic systems, where the rules of melody are explicit. This study asks two questions: whether first-order Markov transition matrices built separately from Carnatic raga and Western chorale pitch-class sequences capture distinct tradition-level structure, and whether linearly blending these matrices produces a controllable distributional interpolation between the two traditions. We built the models from symbolic scores rather than audio. Pitch-class sequences were extracted with the music21 toolkit from 18 canonical Carnatic raga scale sequences (three per raga, across six ragas) and 22 Bach chorale soprano lines, and summarised as 12×12 first-order transition matrices. The raga and Western aggregates were blended by convex combination weighted by a parameter α, and distributional similarity within and between traditions, and between blended matrices, was measured with the Jensen–Shannon divergence (JSD). The aggregate matrices for the ragas showed a mean transition entropy of 2.07 ± 0.22, compared to 2.14 ± 0.27 for the Western corpus. Within-raga pairwise JSD was lower than between-tradition JSD; under a recording-level permutation test that accounts for the non-independence of pairwise distances, this difference was significant (p = 0.007, rank-biserial r = 0.13), while the within-Western versus between-tradition difference was not (p = 0.17). As the blending parameter α increased, the blended matrix moved monotonically from the Western aggregate toward the raga aggregate, with a crossover near α = 0.5–0.6. This interpolation is measured between transition matrices; it is distributional and does not by itself establish perceptual similarity. These findings indicate that transparent, first-order probabilistic models can represent and distinguish tradition-level melodic structure, and that blending the matrices yields a controllable interpolation between the two traditions at the distributional level. No perceptual listening evaluation was conducted, so the results speak to structural rather than aesthetic or perceptual properties. The generated sequences are best understood as distributional hybrids rather than musically authentic raga–Western fusions.
Keywords: Markov chain, transition matrix, Carnatic music, raga, algorithmic composition, Jensen-Shannon divergence, melodic style, cross-cultural music generation
Introduction
Since the mid-20th century, researchers have been using computers to create music, starting with some basic rule-based systems and probabilistic models1. Recently, the focus has shifted to deep neural networks, which can generate surprisingly realistic music2. However, they can be hard to understand; the way they learn isn’t transparent, they need a lot of training data, and studies have shown they lean heavily towards Western music styles3, leaving out a lot of the rich diversity found in global music traditions. On the other hand, Markov chains present a different approach4,5. They look at melodies as sequences of discrete states, where each state depends on the previous one. This relationship is captured in a transition matrix that you can read, understand, and adjust. Because of this clarity, Markov models are appealing for studying musical styles scientifically and for applications where it’s important to be culturally accountable.
When it comes to Carnatic raga music, it stands out as one of the most clearly defined melodic systems in any musical tradition, making it a great candidate for this kind of modeling. A raga isn’t just a scale; it defines which pitch classes can be used, how the melody should rise and fall, and includes recognizable melodic phrases that let a trained listener easily identify it. In contrast, Western tonal music is mainly organized around harmonic functions and chord progressions6, with melody serving to enhance or elaborate on that harmony. These structural differences lend themselves well to comparing probabilistic models; both traditions follow rules, but they operate on different principles and levels.
Most existing work in computational analysis of Indian classical music has been about recognizing ragas, identifying tonics, and analyzing audio7,8,9, rather than generating music. There hasn’t been much research on blending raga and Western musical structures using clear and interpretable models. Most generative projects that do look at non-Western music tend to use neural methods that treat cultural traditions as sets of data to approximate, rather than as systems of rules to express3.
This study intentionally focuses on a narrow scope. It looks at monophonic melodies using pitch-class representations that leave out octaves, dynamics, and ornaments. The dataset includes six Carnatic ragas (18 symbolic sequences) along with 22 soprano lines from Bach chorales. The models do not capture embellishments, microtonal shifts, or improvisation, and first-order Markov chains only track transitions from one note to the next. No evaluation of how listeners perceive authenticity or quality was performed. The study has two explicit goals: first, to test whether first-order pitch-class transition matrices built from the raga and Western corpora capture distinct tradition-level structure; and second, to test whether blending these matrices produces a controllable distributional interpolation between the two traditions.
To do this, pitch-class sequences were extracted from symbolic scores using the music21 toolkit10, summarised as 12×12 first-order transition matrices, compared with Jensen–Shannon divergence11, and then blended using a convex combination of the two matrices. The next sections describe the process in detail.
Methods
Corpus
The raga corpus consisted of 18 symbolic monophonic sequences across six Carnatic ragas: Bhairavi, Kalyani, Kambhoji, Mohanam, Shankarabharanam, and Todi, with three sequences per raga. Each sequence encodes the canonical ascending and descending form (aroha/avarohana) of the raga as defined in standard musicological references, rendered to MIDI with the music21 toolkit10. Because these sequences represent canonical scale forms rather than recorded performances, they exclude gamaka (ornamentation) and improvisation by construction; the consequences are addressed in the Limitations. The six ragas span a range of pitch-set sizes: Mohanam is pentatonic (five pitch classes), while Bhairavi and Todi are heptatonic with chromatic inflections. Every corpus item, with its raga or key, source, tonic, and pitch-set size, is listed in the Appendix (Table 2).
The Western corpus consisted of 22 four-part chorales from the J.S. Bach chorale collection, drawn from the music21 core corpus10 and the JSB Chorales dataset. The soprano line was extracted as the melody from each chorale. Bach chorales are widely used in computational musicology12,13 and form a well-defined set of diatonic Western melodies.
Pitch-Class Extraction and Quantisation
Each symbolic score was parsed with the music21 toolkit10. For every piece, the melody line (the soprano part for the Bach chorales) was flattened to an ordered sequence of notes, and each note was reduced to its pitch class. Pitch-class distributions and their pairwise transitions are a standard, interpretable representation for raga and for tonal melody14. This symbolic route avoids the pitch-tracking errors that audio extraction of ornamented performances would introduce; extending the pipeline to audio is left to future work.
Each note was converted to a MIDI number and reduced to a pitch class (integers 0–11) using modulo 12, removing octave information so that sequences in different registers can be compared. For the raga corpus the tonic (Sa) is fixed to pitch class 0 by construction, because the canonical sequences are written relative to Sa; automatic tonic identification, which real recordings would require15, is therefore unnecessary here. For the Western chorales, the key of each piece was estimated with the Krumhansl–Schmuckler algorithm16 as implemented in music2110, and each piece was transposed to C major or A minor before extraction. Collapsing major- and minor-mode pieces into a single Western aggregate mixes two modal distributions (for example the raised leading tone in minor); this is a deliberate simplification whose effect is noted in the Limitations.
Transition Matrix Construction
Pitch-class transition matrices were created in this way: each matrix measures 12×12, with rows and columns labeled by pitch class 0–11. For each consecutive pair of pitch classes (PCi, PCi+1) in a pitch-class sequence, the corresponding cell [i, j] was incremented by 1. Next, each row was normalized by its row sum to produce conditional probabilities P(next pitch class | current pitch class). To prevent zero rows for pitch classes that exist in the corpus but are never followed by certain transitions, Laplace smoothing (ε = 1×10⁻⁶) was applied.
A matrix was first computed for every individual file. In the raga corpus, the three matrices for each raga were averaged into one aggregate per raga, giving six raga aggregates, and these six were averaged into a single raga aggregate used for blending. For the Western corpus, all 22 matrices were averaged into one Western aggregate. Averaging reduces the influence of individual files while retaining each tradition’s dominant transition structure. Blending uses the pooled raga aggregate rather than a single raga so that the interpolation is between two traditions rather than between one specific raga and Bach; per-raga blending is a natural extension.
Blending (Alpha Parameter)
Blended matrices were created through linear interpolation between the raga aggregate and Western aggregate matrices using the following formula:
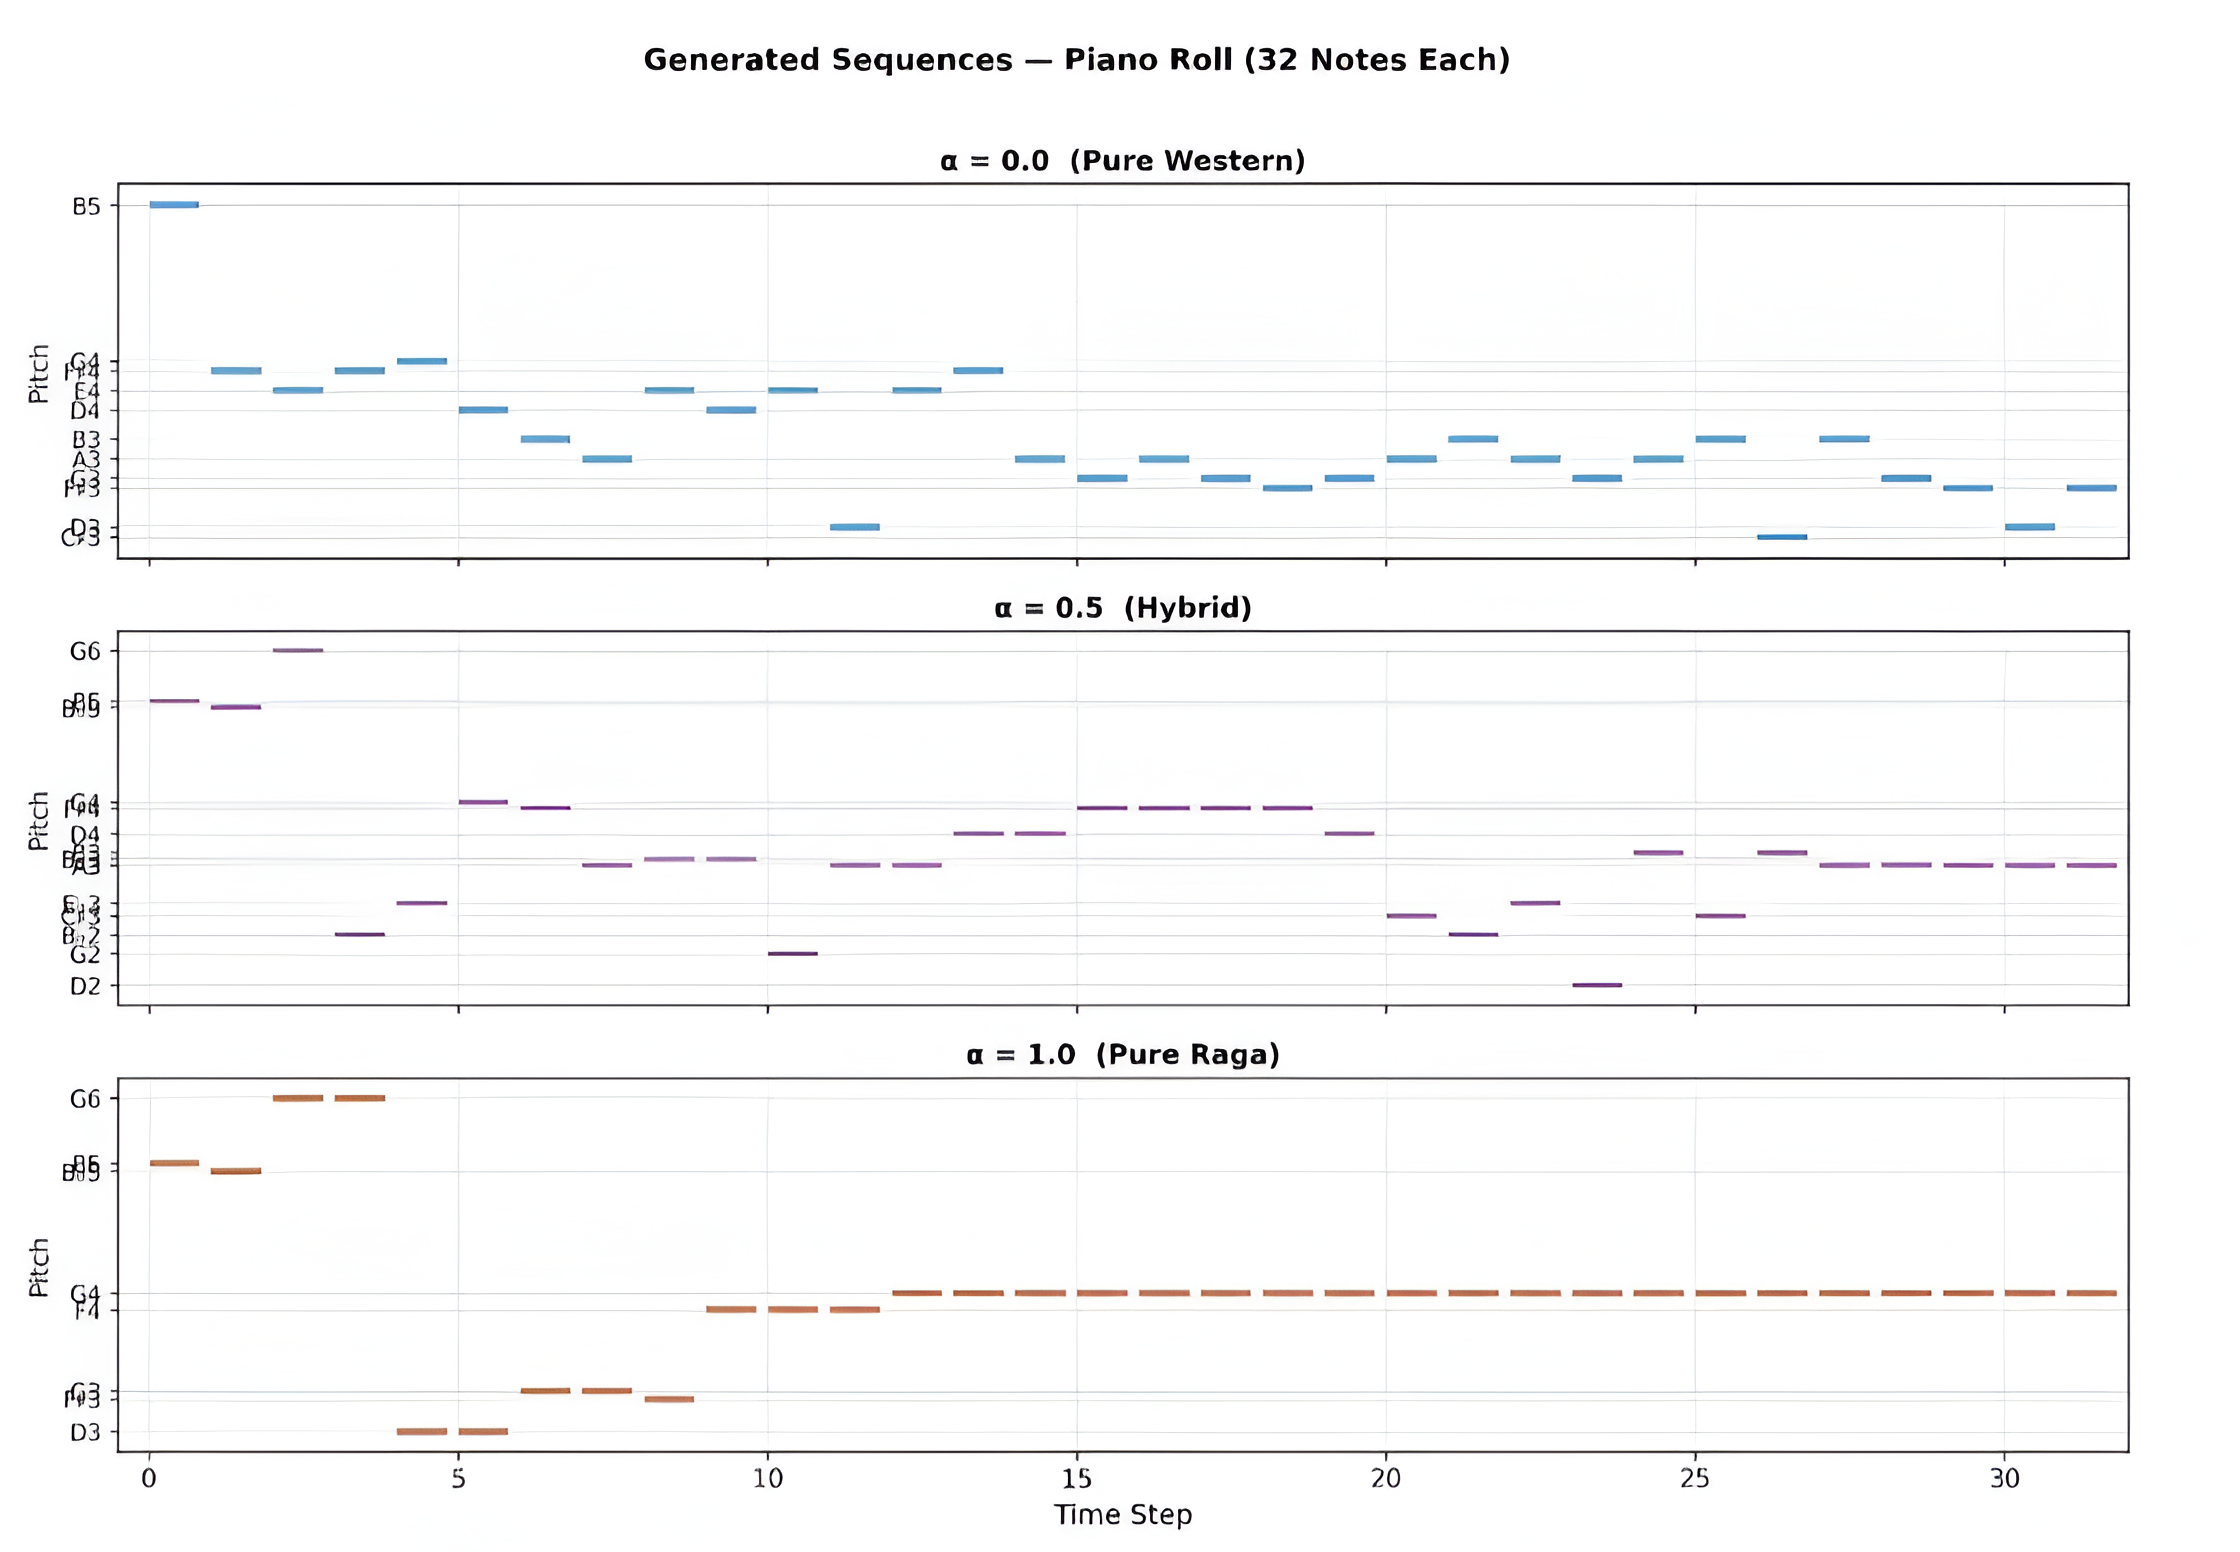
Here α is a scalar in [0, 1] that sets the mix of the blended matrix. When α = 0 the blended matrix equals the Western aggregate, and when α = 1 it equals the raga aggregate. Because the result is a convex combination of two row-stochastic matrices, every row of the blended matrix also sums to 1, so it remains a valid stochastic matrix for every α17. We evaluated six values of α (0.0, 0.2, 0.4, 0.6, 0.8, and 1.0). Sequences were generated from a blended matrix as a first-order random walk: the walk begins at pitch class 0 (Sa on the raga side, the tonic on the Western side) and draws each successive pitch class from the current row. Figure 6 reports matrix-level similarity and involves no sampling; the pitch-class distributions in Figure 7 summarise sampled 32-note sequences, and Figure 8 shows a single representative 32-note sequence per α value.
Evaluation: Jensen–Shannon Divergence
To measure similarity between matrices, and between generated sequences and their source corpora, we used the Jensen–Shannon divergence (JSD)11, a symmetric, bounded measure of the difference between two probability distributions that ranges from 0 (identical) to 1 (maximally different). Each 12×12 matrix was treated as a single distribution over its 144 entries. JSD was computed for (1) every pair of files in the 40-file corpus, giving a 40×40 pairwise distance matrix, and (2) each generated sequence at a given α against the raga and Western aggregates18.
Because every JSD is a pairwise distance that reuses the same files many times, the pairwise distances are not independent, and a test applied directly to them overstates the effective sample size. We therefore assessed the within- versus between-tradition contrast with a recording-level permutation test (20,000 permutations of the tradition labels across the 40 files), which preserves the dependence structure, and we report an effect size (rank-biserial correlation) with a file-clustered bootstrap 95% confidence interval. We also report the number of independent files, the number of pairwise distances in each group, and the Mann–Whitney U statistic for comparison with prior practice. All analyses used Python 3.10 with music2110, NumPy, SciPy, and Matplotlib, with fixed random seeds for reproducibility.
Results
Transition Matrices Across Traditions
Figure 1 presents the separate pitch-class transition matrices for the six Carnatic ragas. Each matrix has a sparse arrangement of high-probability transitions concentrated on a few pitch-class pairs, reflecting the limited note sets of these ragas. Each raga shows its own pattern: Bhairavi clusters transitions around pitch classes C, D♯, and A♯, Kalyani highlights a strong B-to-F♯ transition (its augmented fourth), and Todi centres on D♯ and G♯. These pairwise patterns track the pitch sets of each raga, but they capture only note-to-note transitions and not the characteristic phrases (pakad) that also define raga identity14,19.
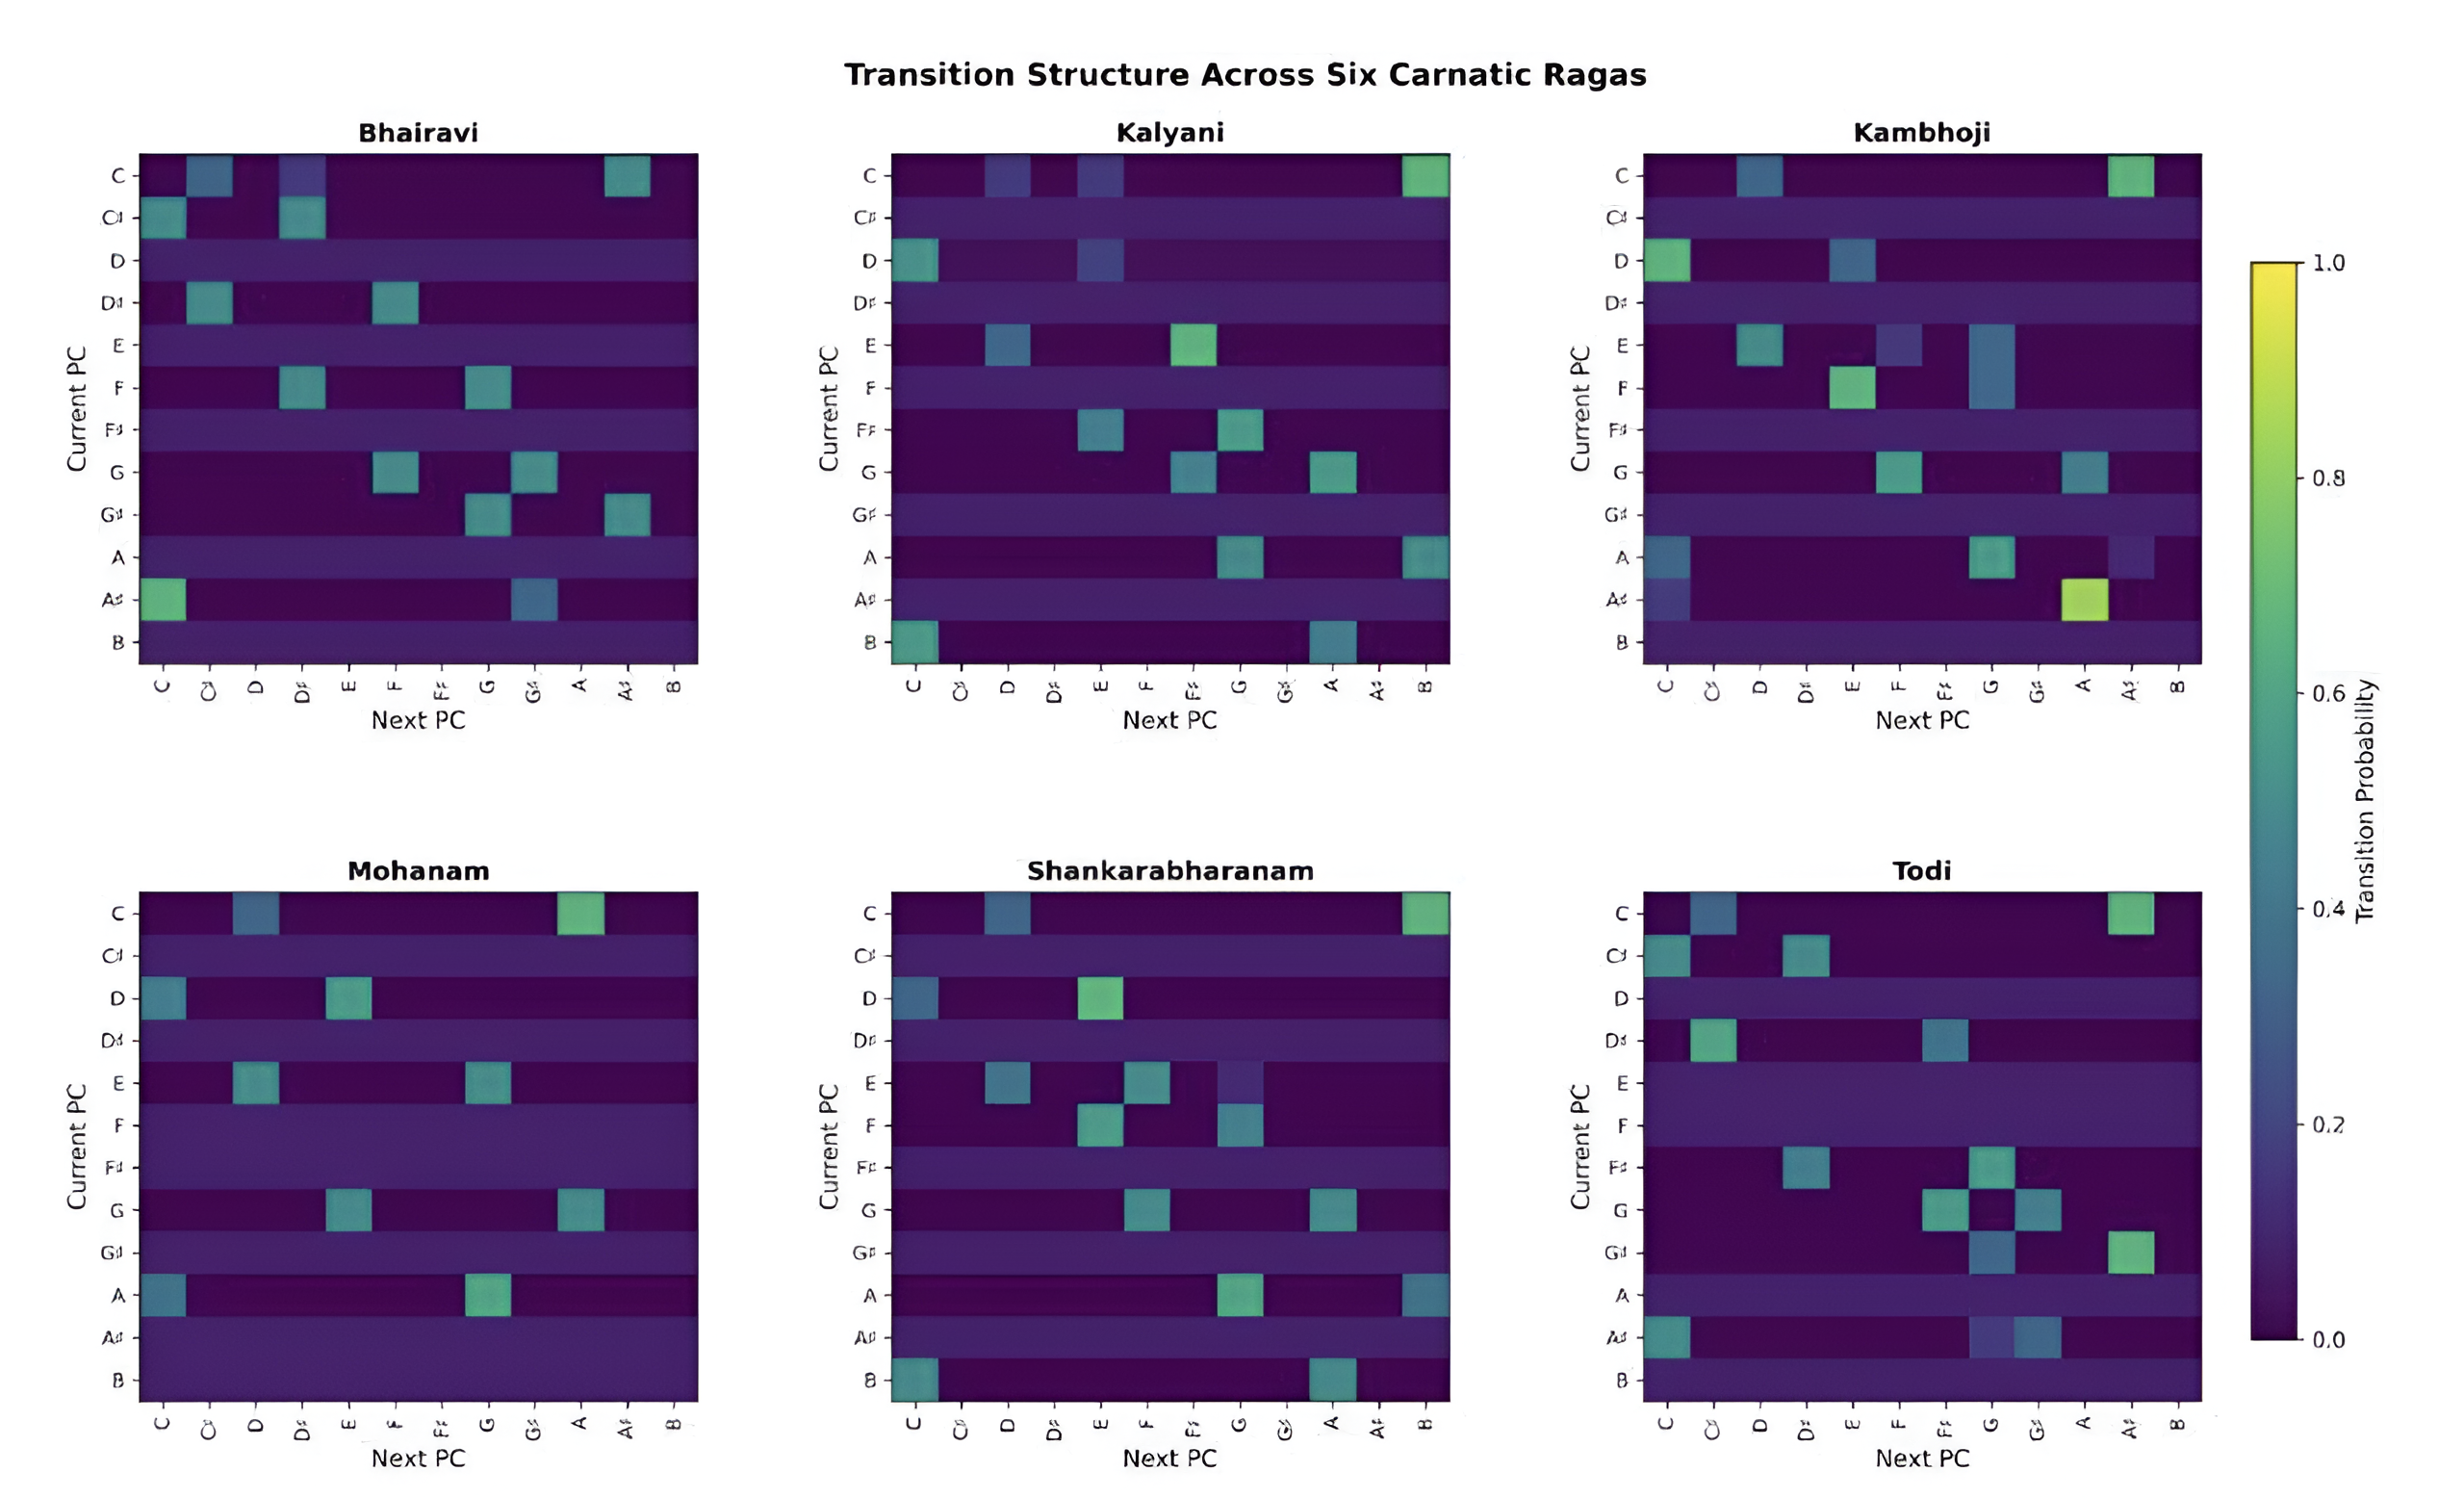
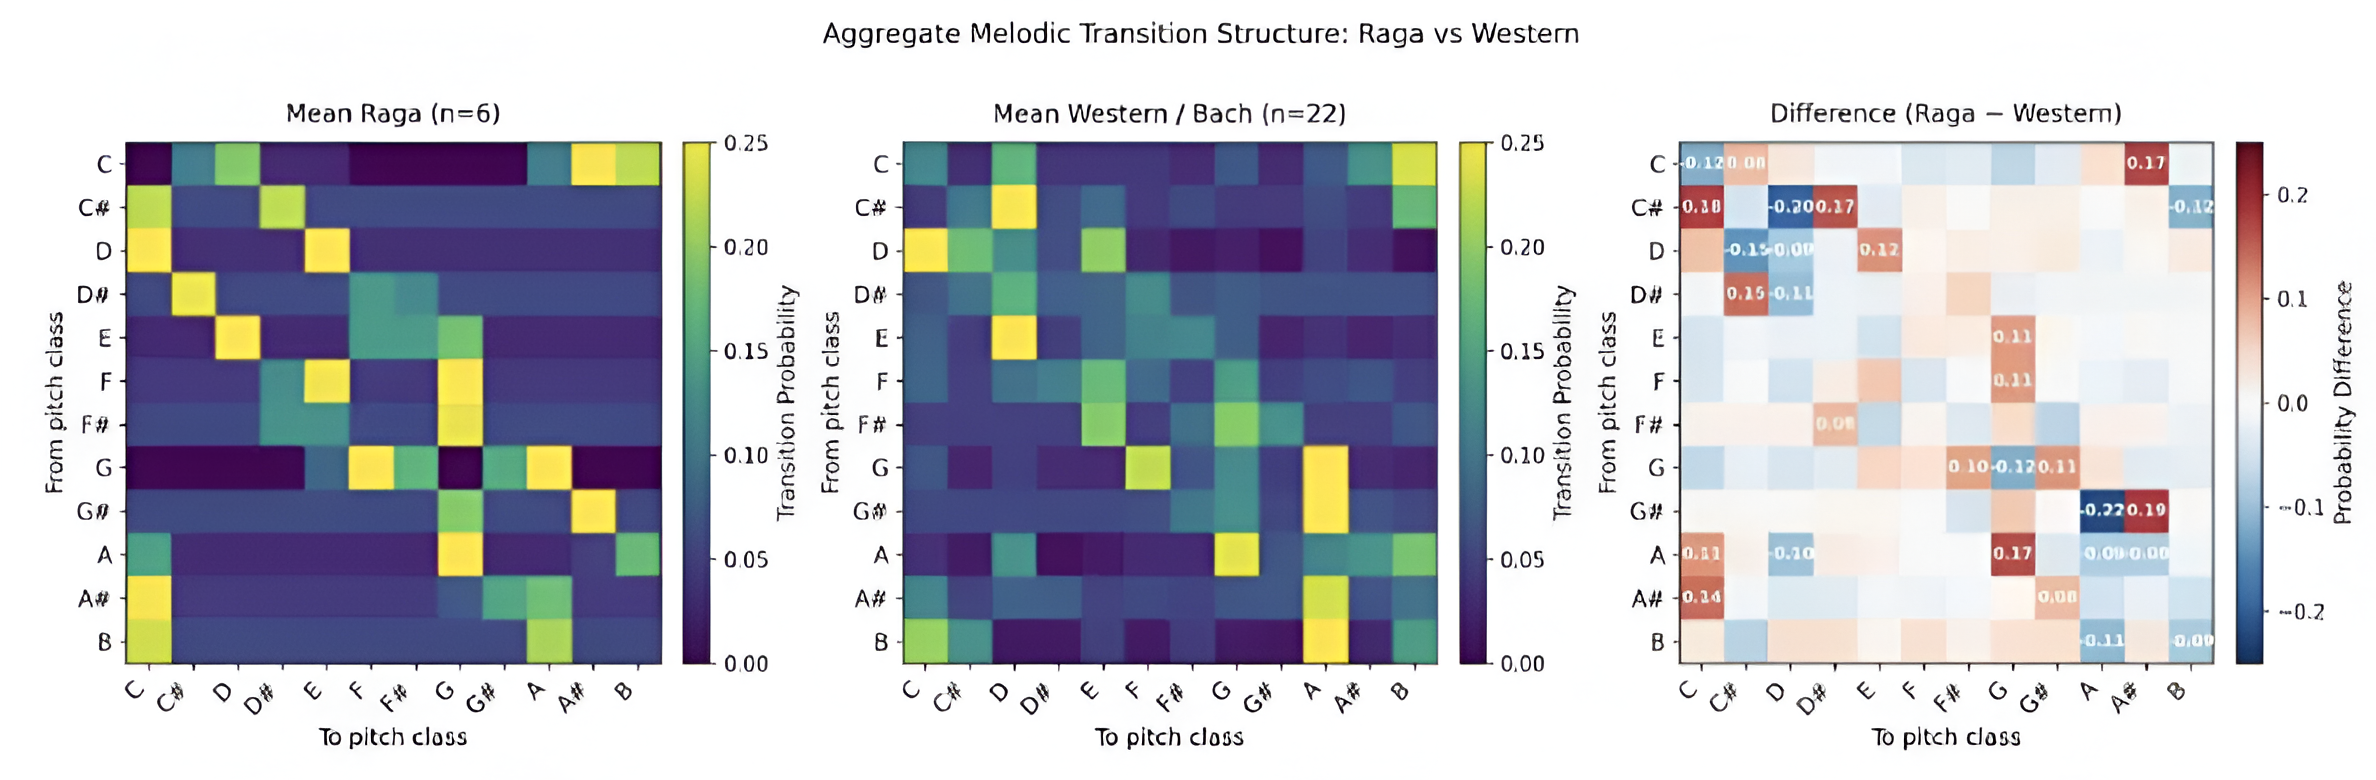
Figure 2 shows the mean raga and mean Western aggregate matrices side by side, with a difference map. The raga aggregate concentrates probability on somewhat fewer pitch-class pairs than the Western aggregate, though the difference in overall sparsity between the two is small and not statistically significant (Table 1). The difference map highlights the transitions that most distinguish the traditions: red cells are more probable in the raga corpus (clustering around C, C♯, and G♯), and blue cells are more probable in the Western corpus (stronger along the D-to-G♯ and A-to-D paths).
Consistency Within Ragas
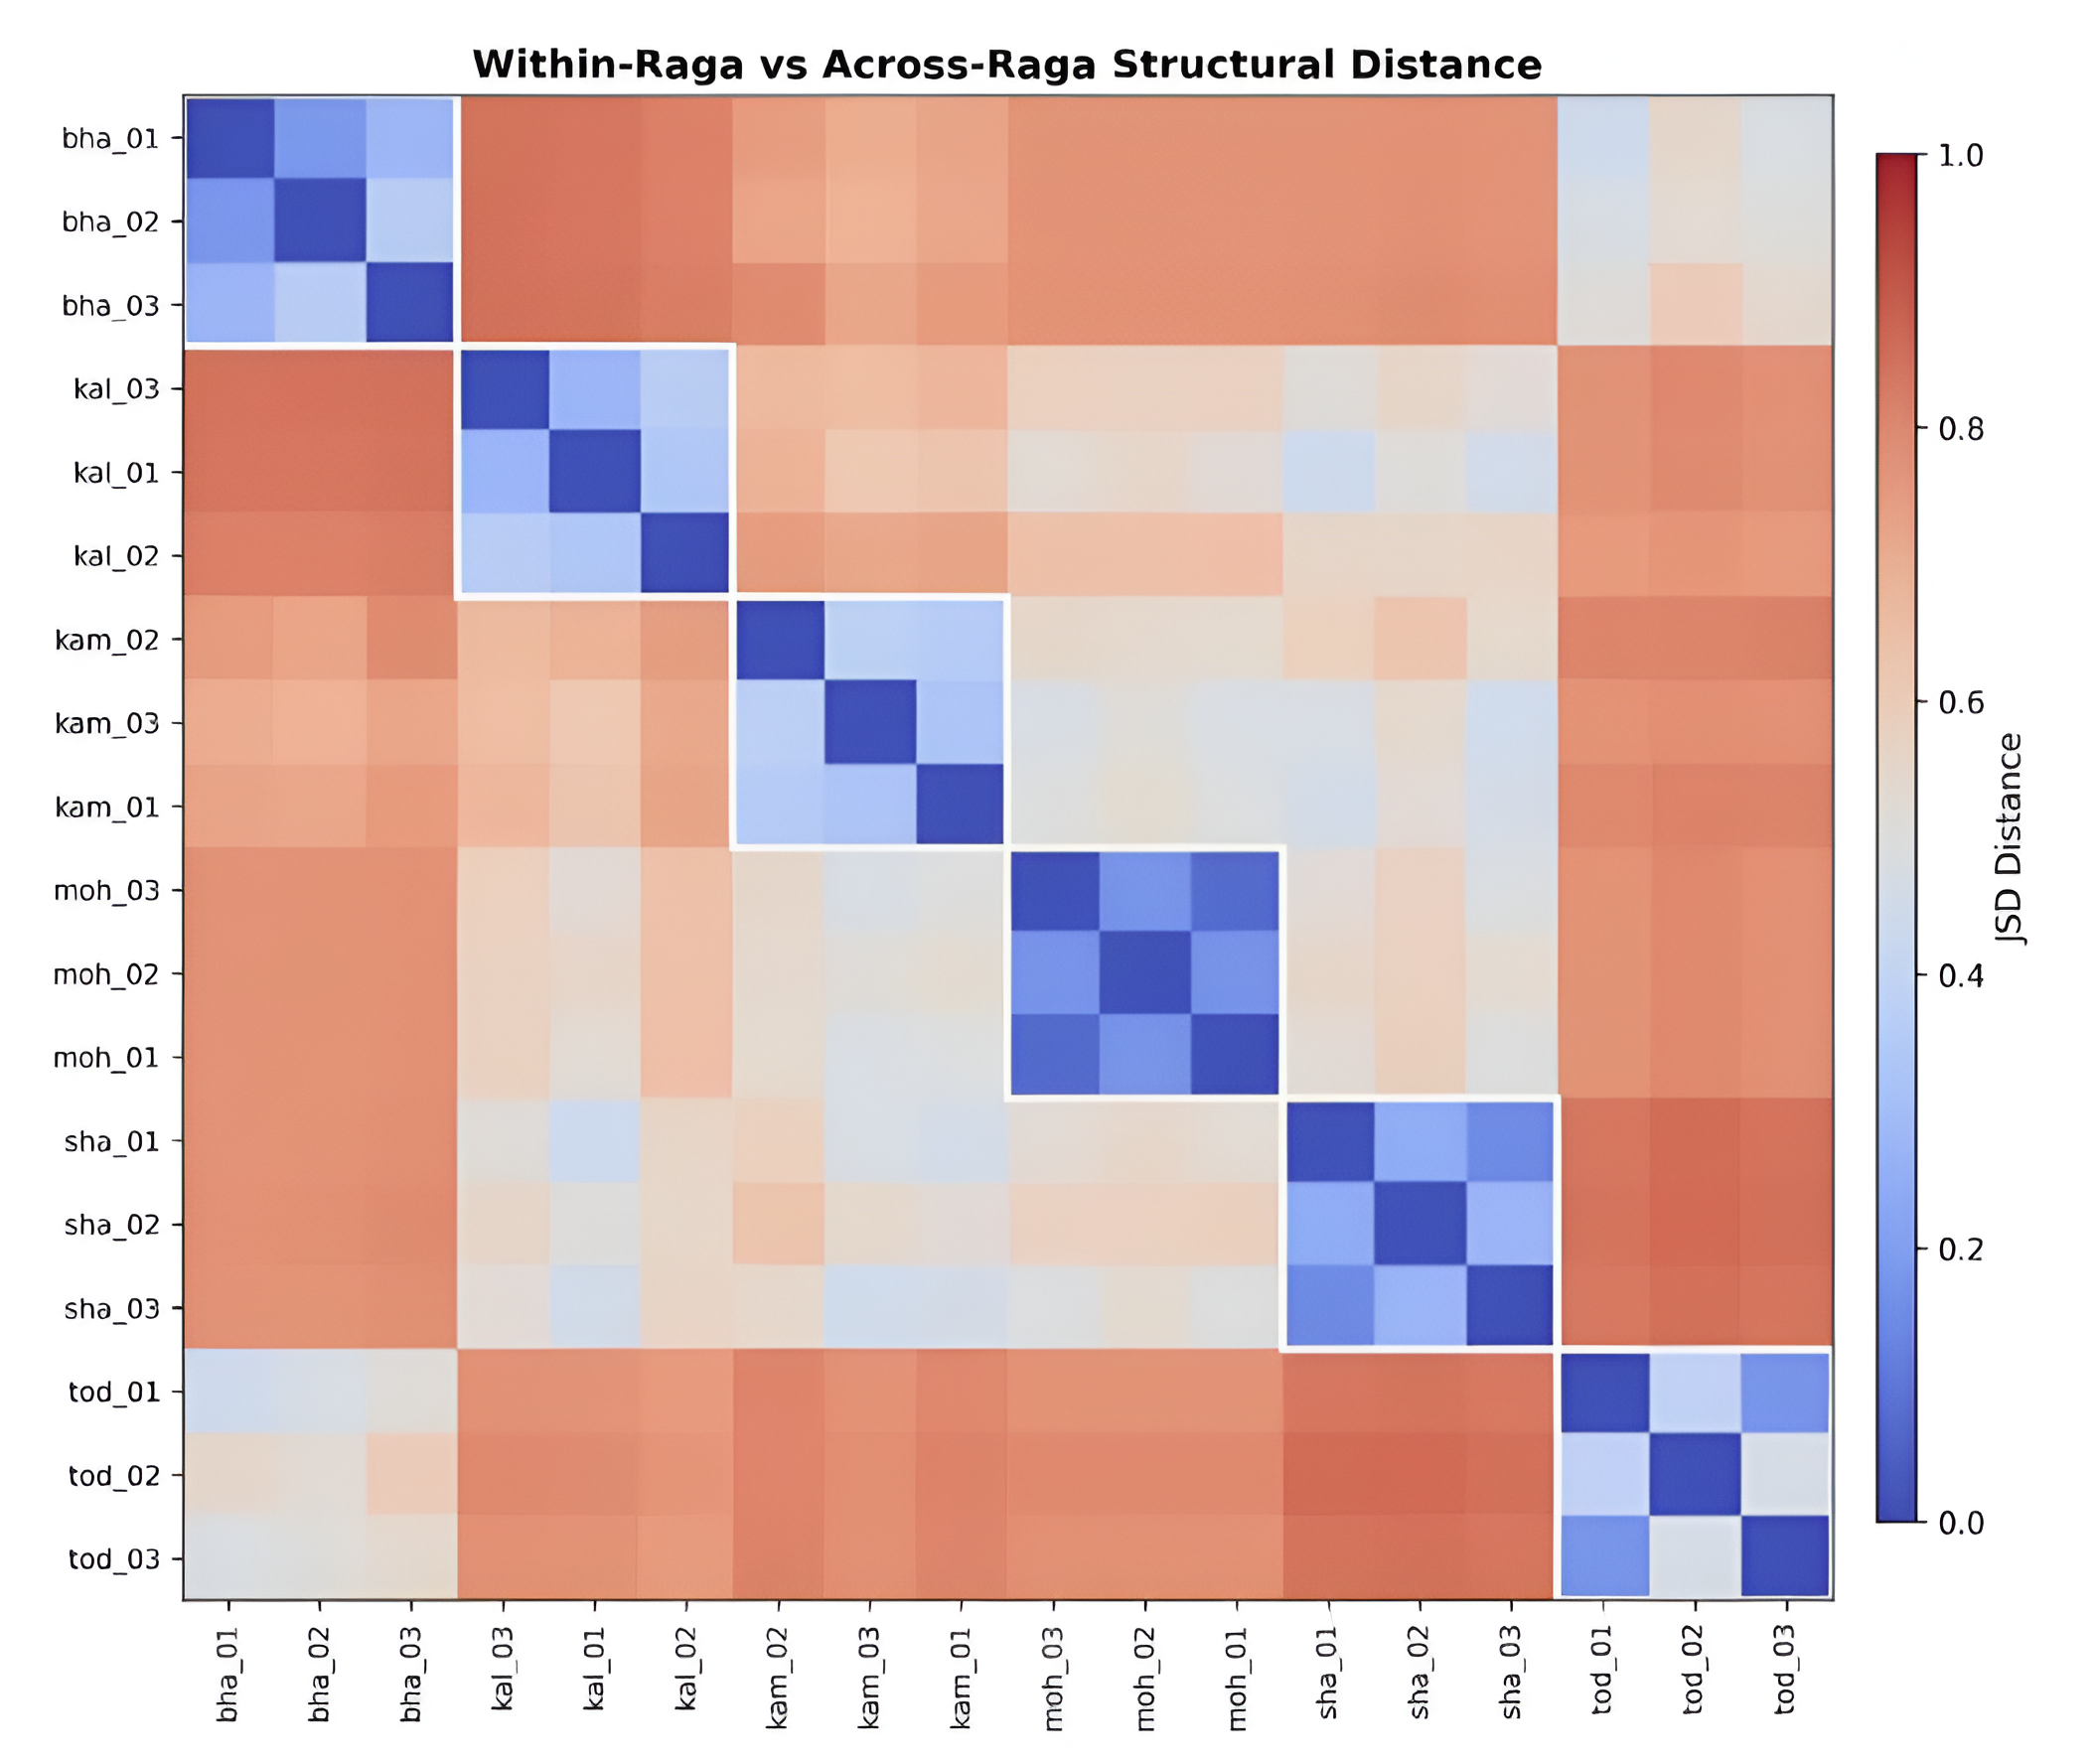
Figure 3 shows the pairwise JSD distance matrix for the 18 raga sequences (three per raga), ordered by raga so that the three sequences of each raga form a 3×3 block on the diagonal. For five of the six ragas these diagonal blocks are cooler (lower JSD), meaning the three sequences of a raga give more similar matrices than sequences from different ragas. Todi and Bhairavi overlap somewhat off-diagonal, consistent with their shared pitch classes. The within-raga distances are not small in absolute terms (mean 0.63; see below), so the model groups sequences by raga at the level of pitch-class transitions rather than reproducing a single tight raga identity.
Within-Tradition Similarity Is Greater than Between-Tradition Similarity
Figure 4 presents the complete 40×40 pairwise JSD distance matrix for all 18 raga and 22 Western files. You can clearly see two separate blocks along the diagonal: one for ragas (upper-left, 18×18) and another for Western music (lower-right, 22×22). Both blocks show much lower JSD, meaning they are more similar to each other, compared to the off-diagonal area between the two traditions, which is mostly red, indicating higher JSD and greater differences. This pattern suggests that the pitch-class distributions within each tradition are more closely grouped than those between traditions.
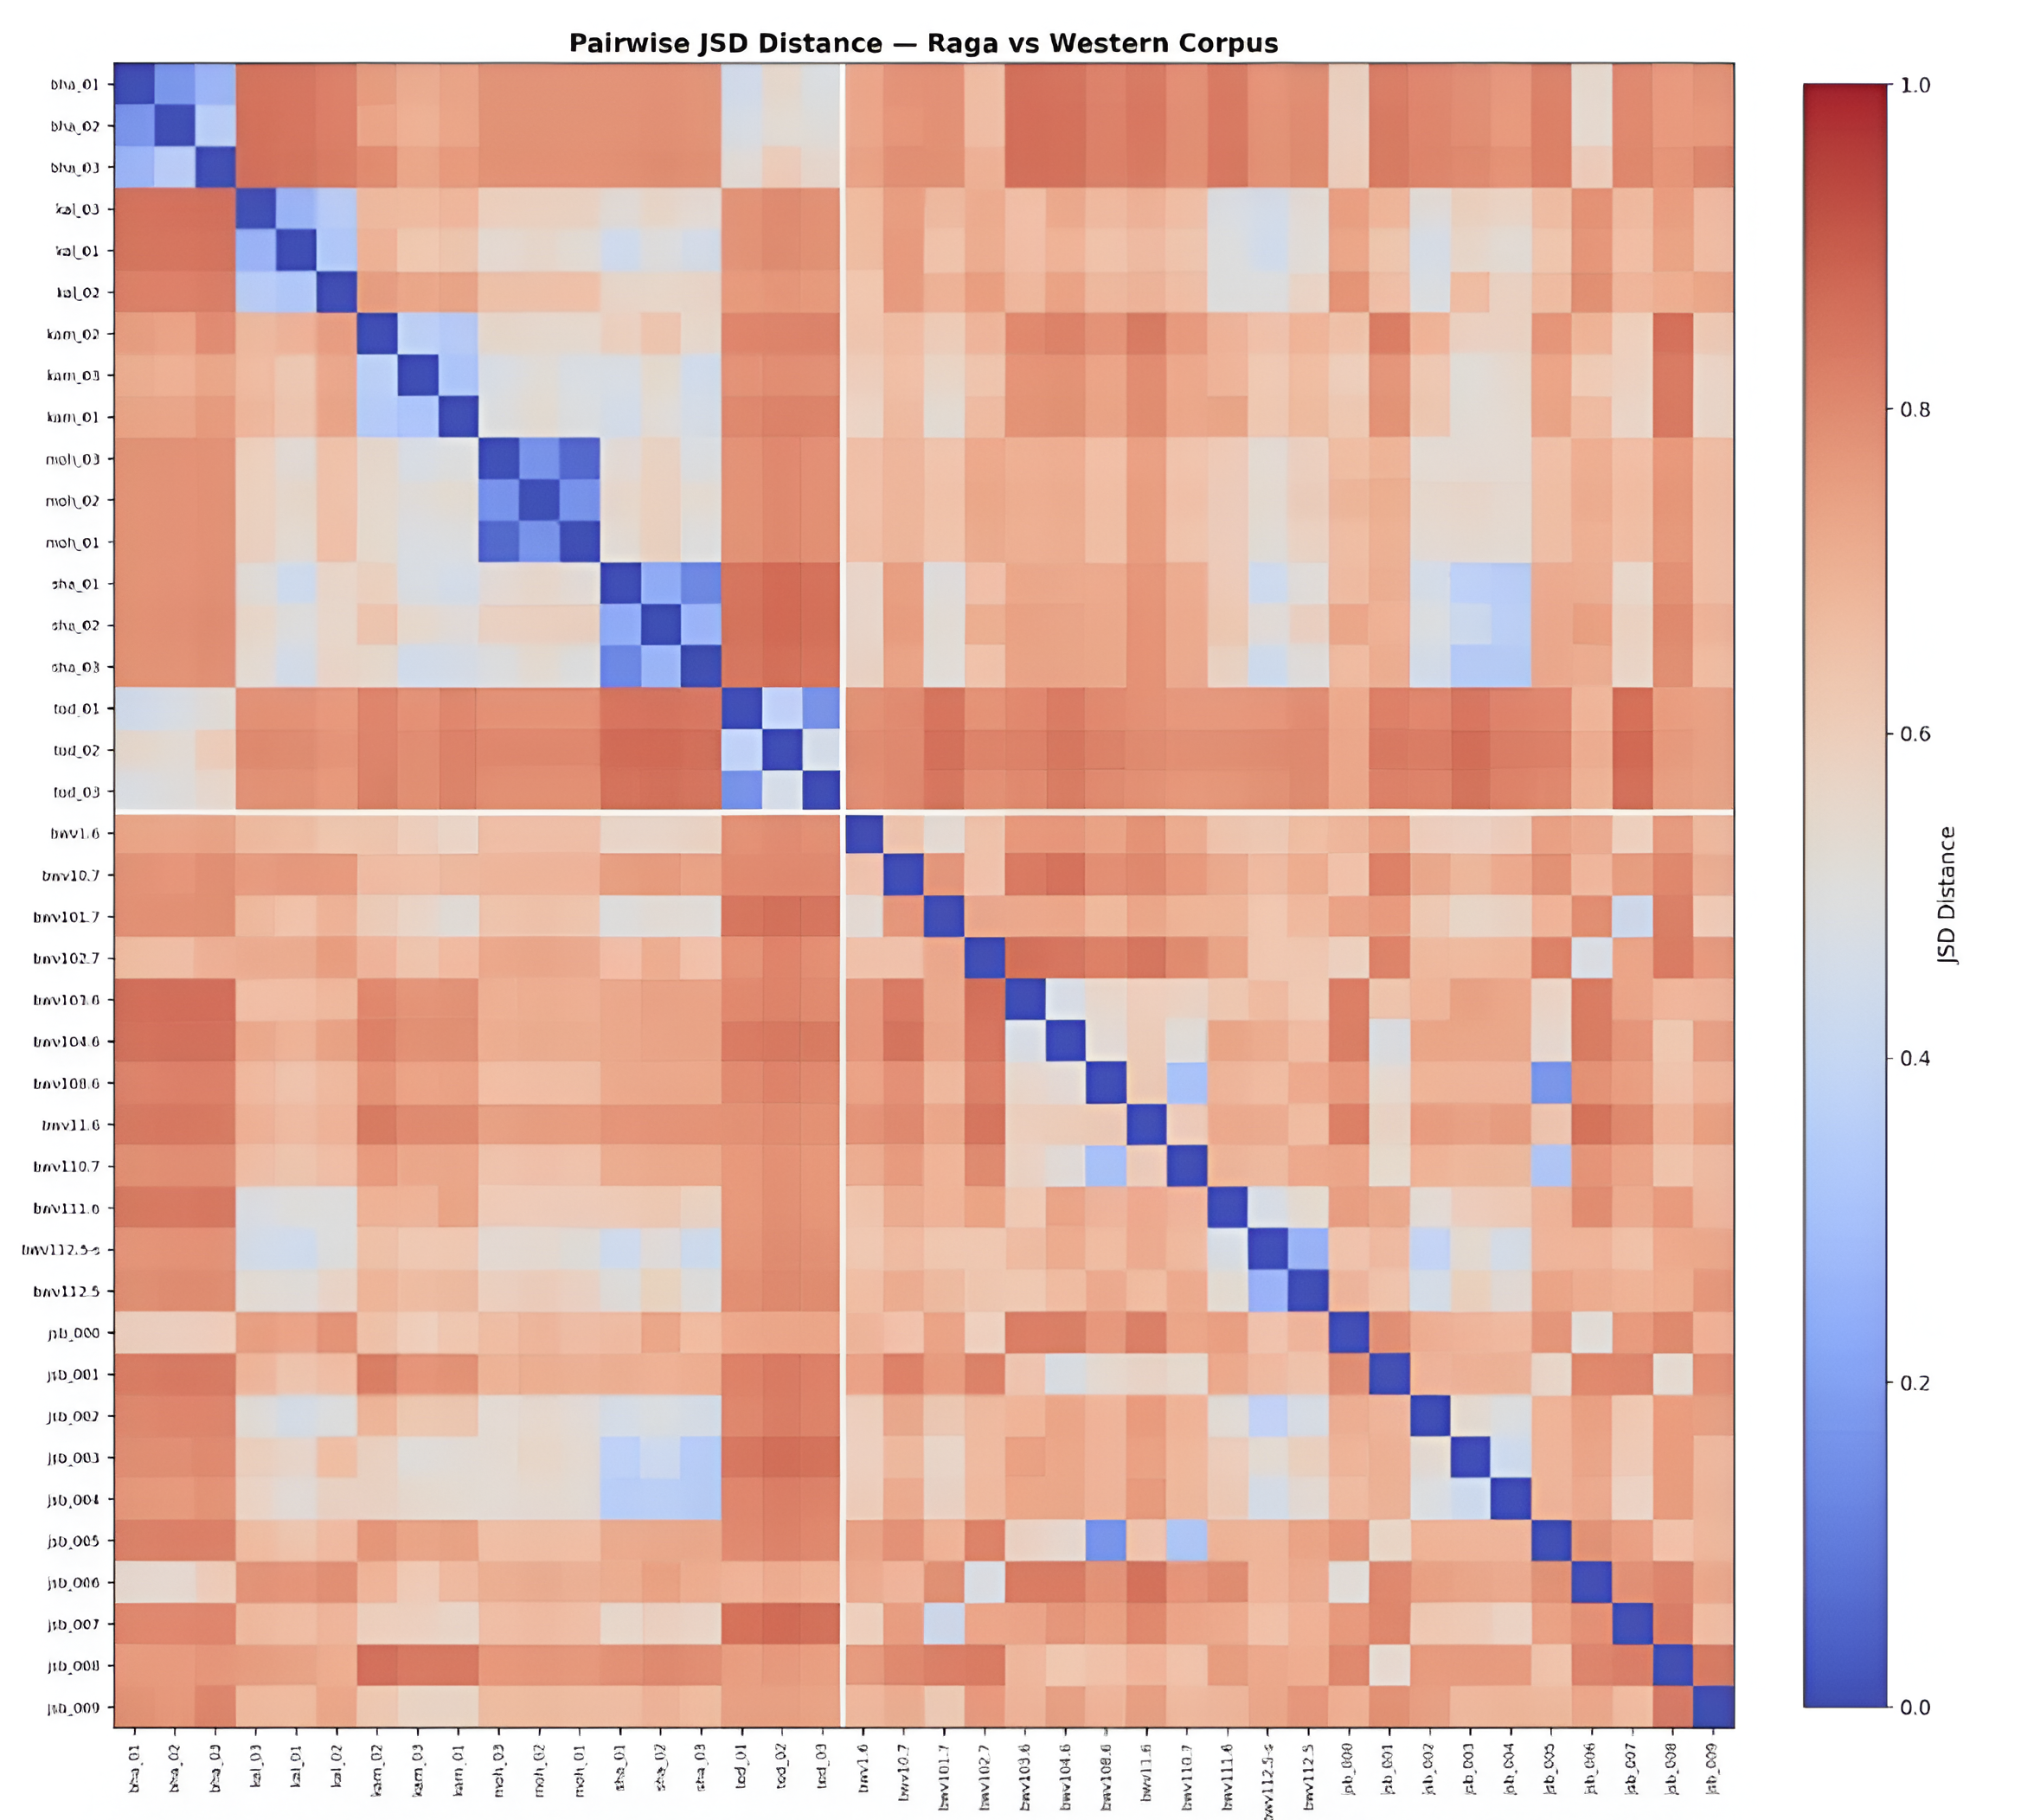
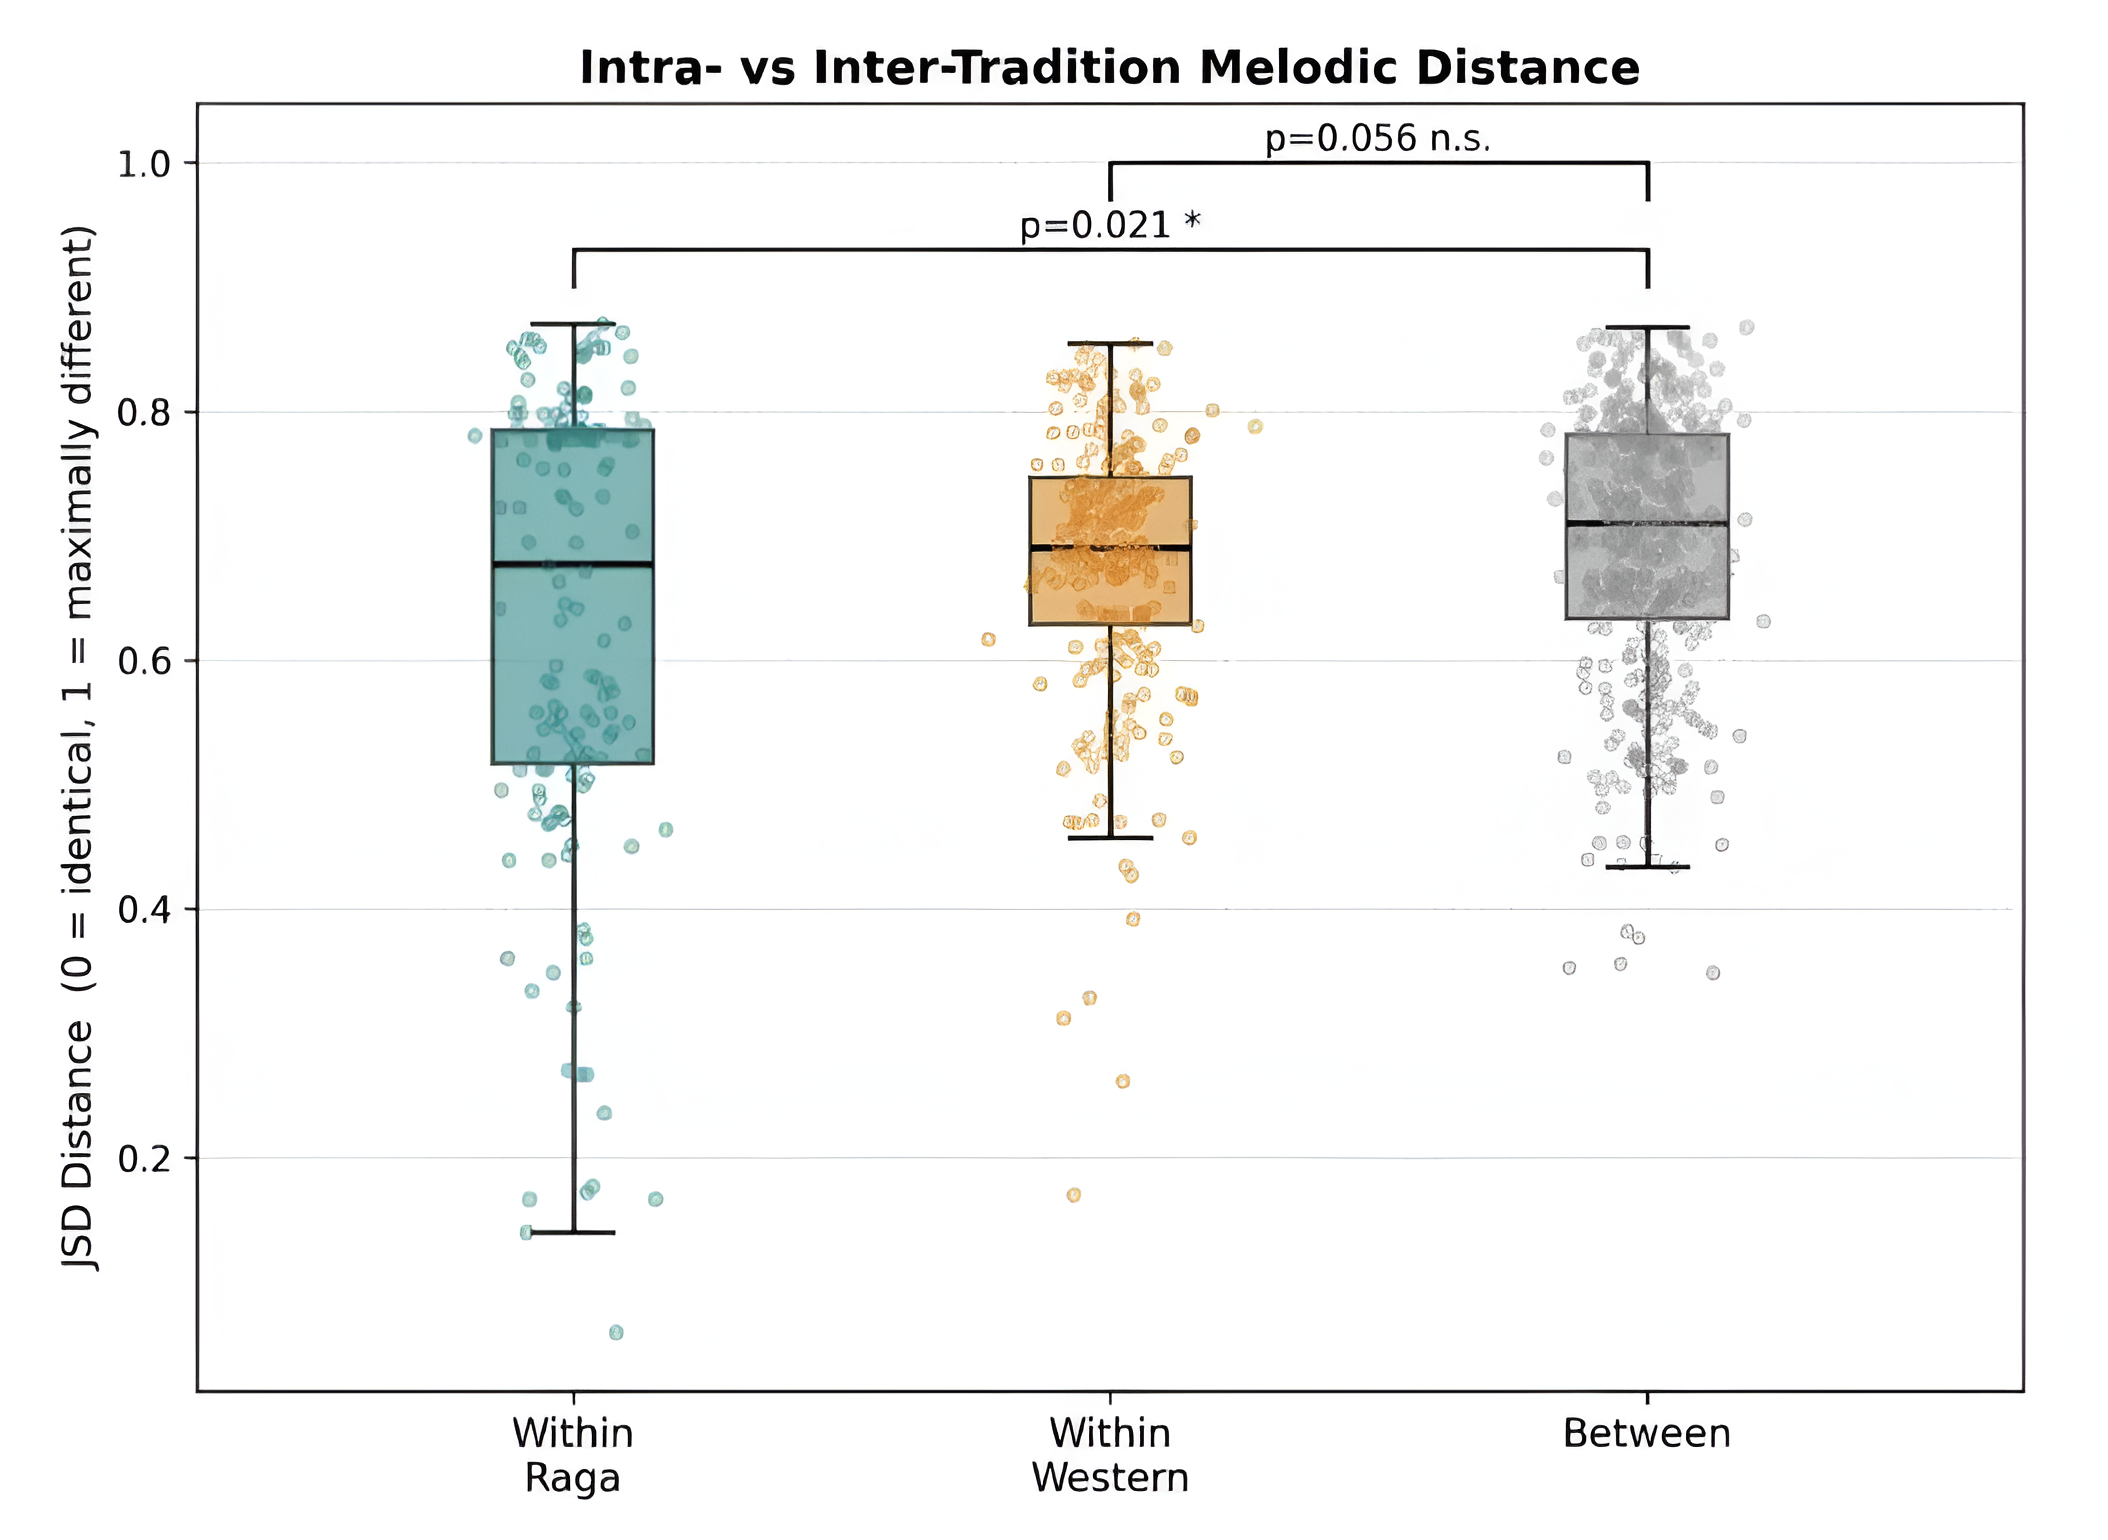
Figure 5 shows boxplots of the three pairwise JSD distributions. The mean within-raga JSD was 0.63 ± 0.19 (153 pairs among 18 files), the within-Western JSD was 0.68 ± 0.11 (231 pairs among 22 files), and the between-tradition JSD was 0.69 ± 0.12 (396 pairs). Under a recording-level permutation test, within-raga JSD was significantly lower than between-tradition JSD (p = 0.007; rank-biserial r = 0.13, file-clustered 95% CI [0.05, 0.41]), whereas within-Western JSD did not differ significantly from between-tradition JSD (p = 0.17). For reference, a naive Mann–Whitney U test on the pooled pairwise distances gives p = 0.021 and p = 0.056 respectively, but that test treats correlated distances as independent and overstates significance. Raga sequences are therefore grouped within their tradition while the Western sequences are more diffuse; the effect is real but modest. Summary statistics are in Table 1.
| Tradition | n files | Mean Entropy | SD Entropy | Mean Sparsity | Mean Within-JSD |
| Raga | 18 | 2.07 | 0.22 | 0.47 | 0.63 |
| Western | 22 | 2.14 | 0.27 | 0.46 | 0.68 |
Alpha Blending Interpolates Between Styles
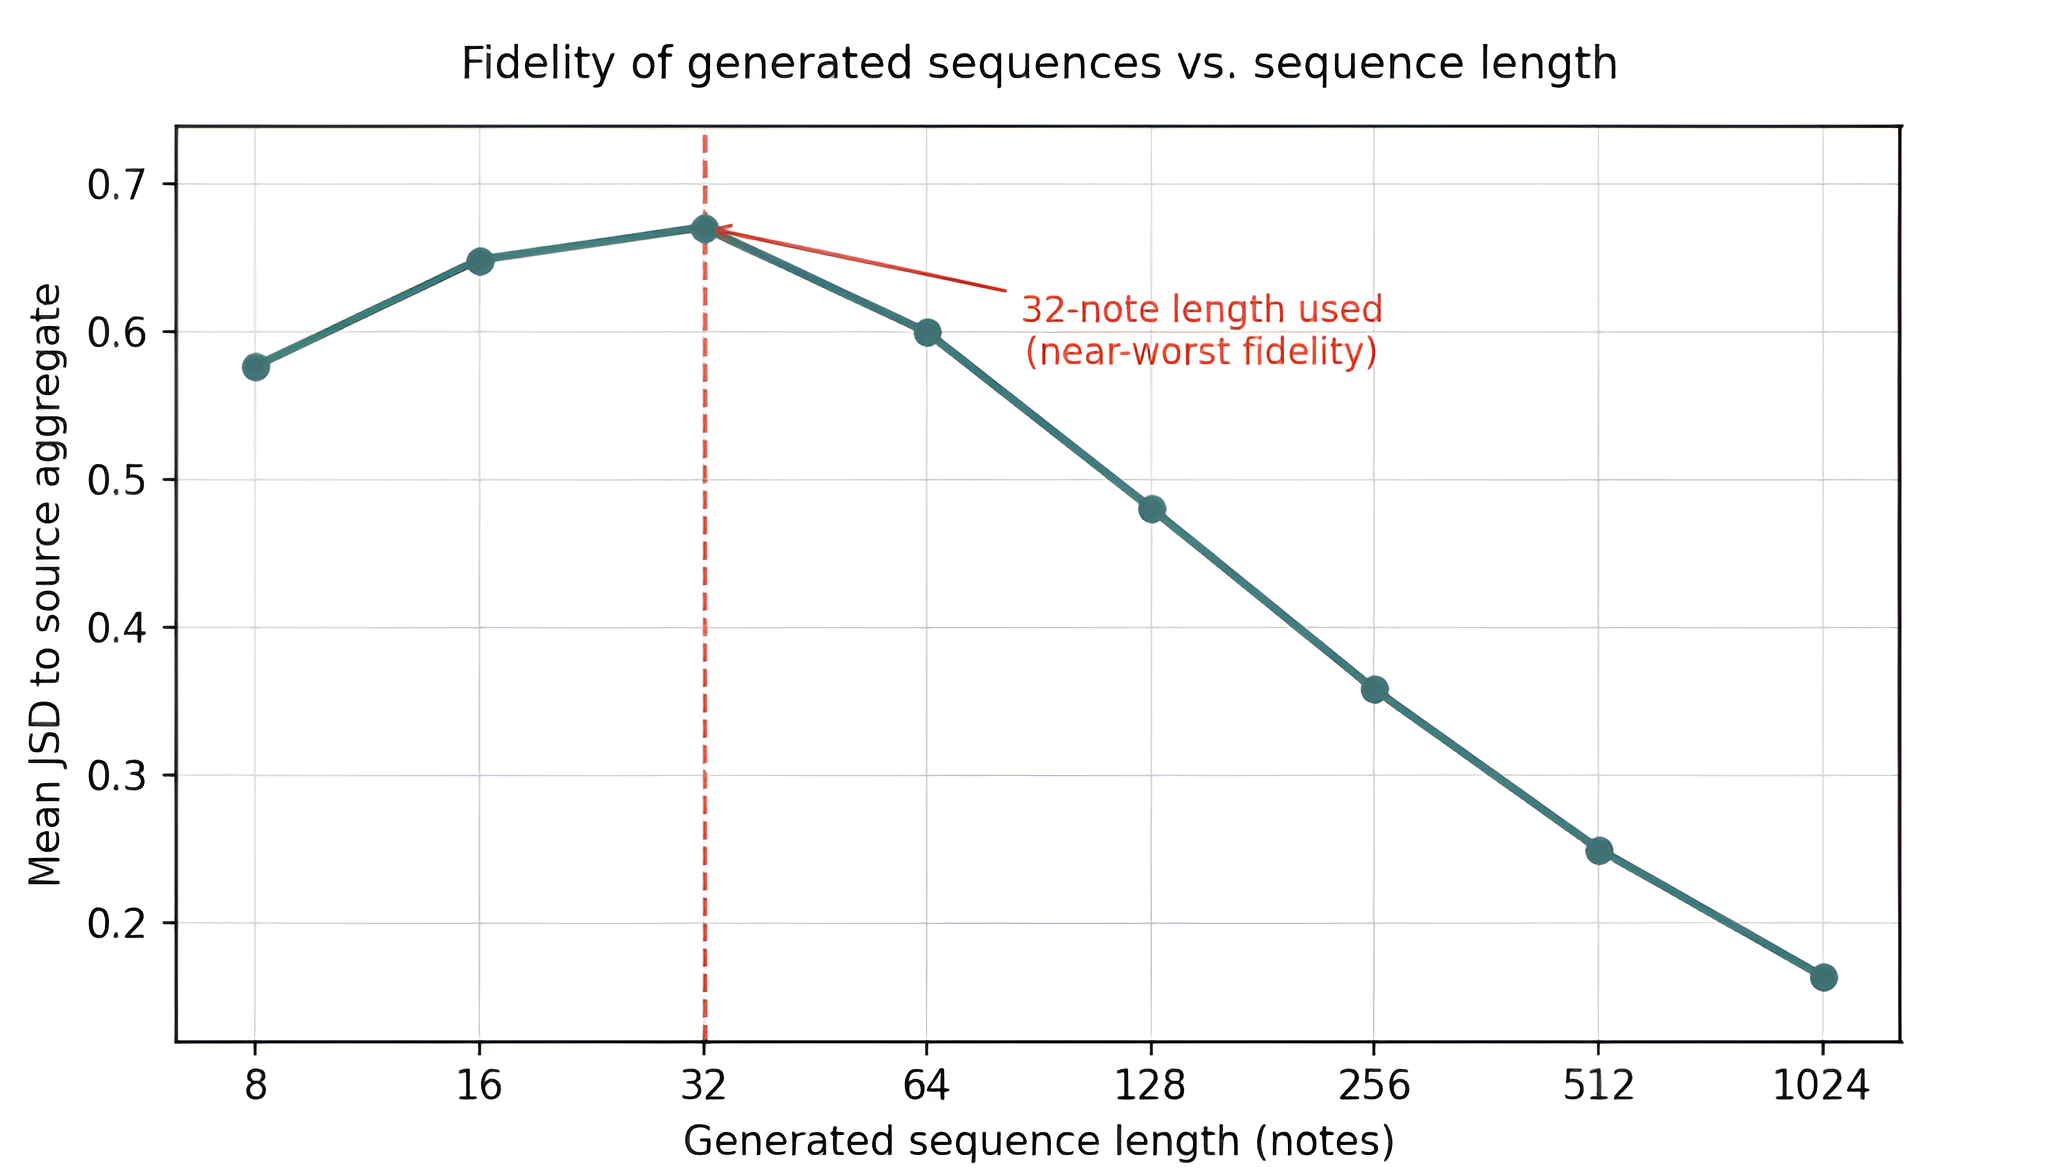
Figure 6 shows how the blended matrix compares to the raga and Western aggregates as α increases from 0.0 to 1.0 in steps of 0.2. Similarity to the raga aggregate rises steadily from 0.59 at α = 0 to 1.00 at α = 1, while similarity to the Western aggregate falls symmetrically, and the two curves cross near α = 0.5–0.6. This curve is measured between the blended matrix and the two aggregates that construct it, so a monotonic crossover is expected by construction and the endpoints reach 1.00 by definition; the curve shows controllable interpolation of the matrices, not that the generated melodies sound hybrid20,21. Two checks qualify what the blend achieves at the level of generated sequences. First, the fidelity of a sampled sequence to its source depends strongly on length: the mean JSD between a generated sequence and the source aggregate is highest near 32 notes (about 0.67) and only falls below 0.25 for sequences longer than about 512 notes (Appendix, Figure 9). The 32-note sequences shown here are therefore short illustrative samples, not converged representations of the matrices. Second, in a leave-one-out test, sequences generated from the pooled raga aggregate were on average farther from held-out raga sequences (JSD 0.77) than from the Western aggregate (0.72), so the blend interpolates distributions without preserving a held-out raga identity at the sequence level. A uniform-random transition baseline was clearly worse than the fitted model (generated-to-raga JSD 0.79 vs. 0.67), confirming that the fitted matrices carry real structure.
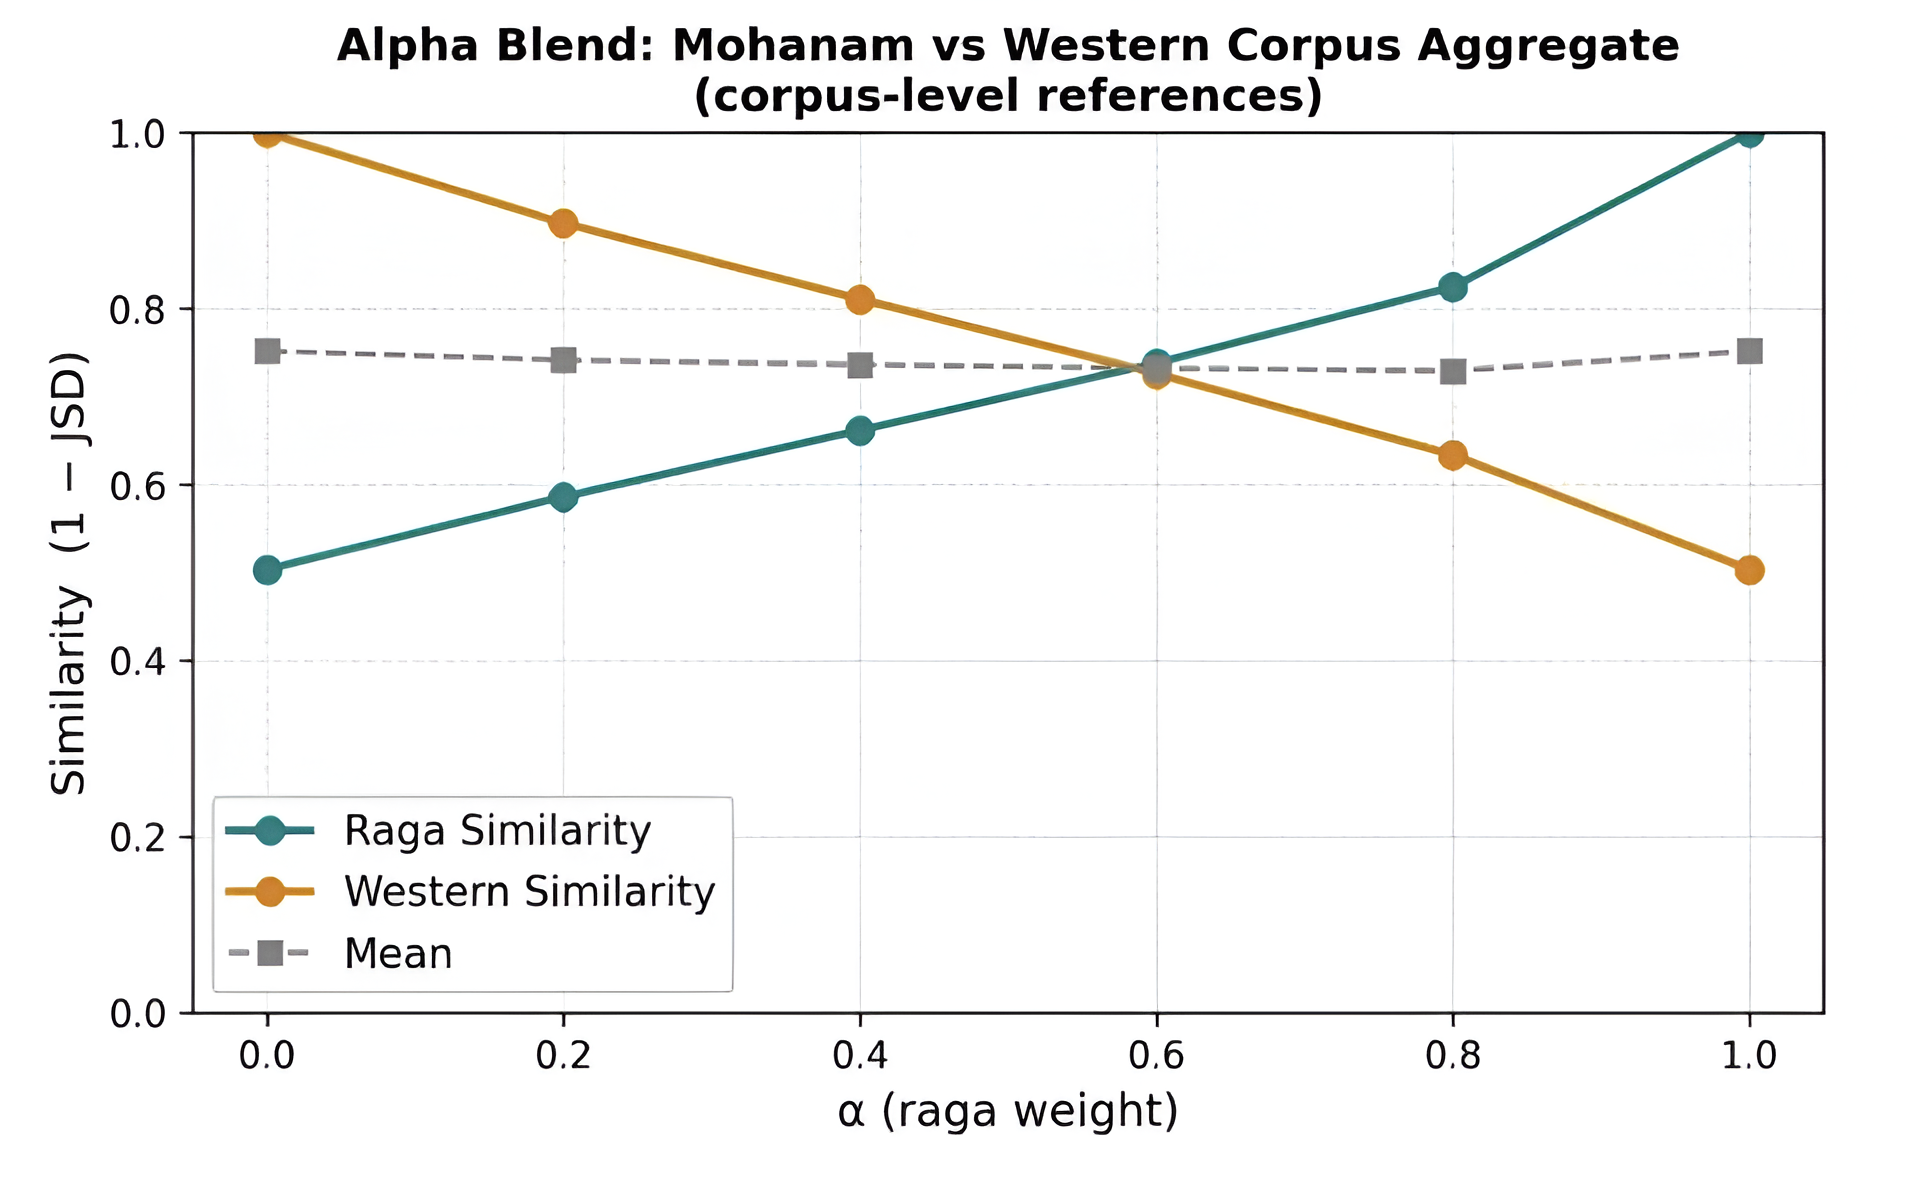
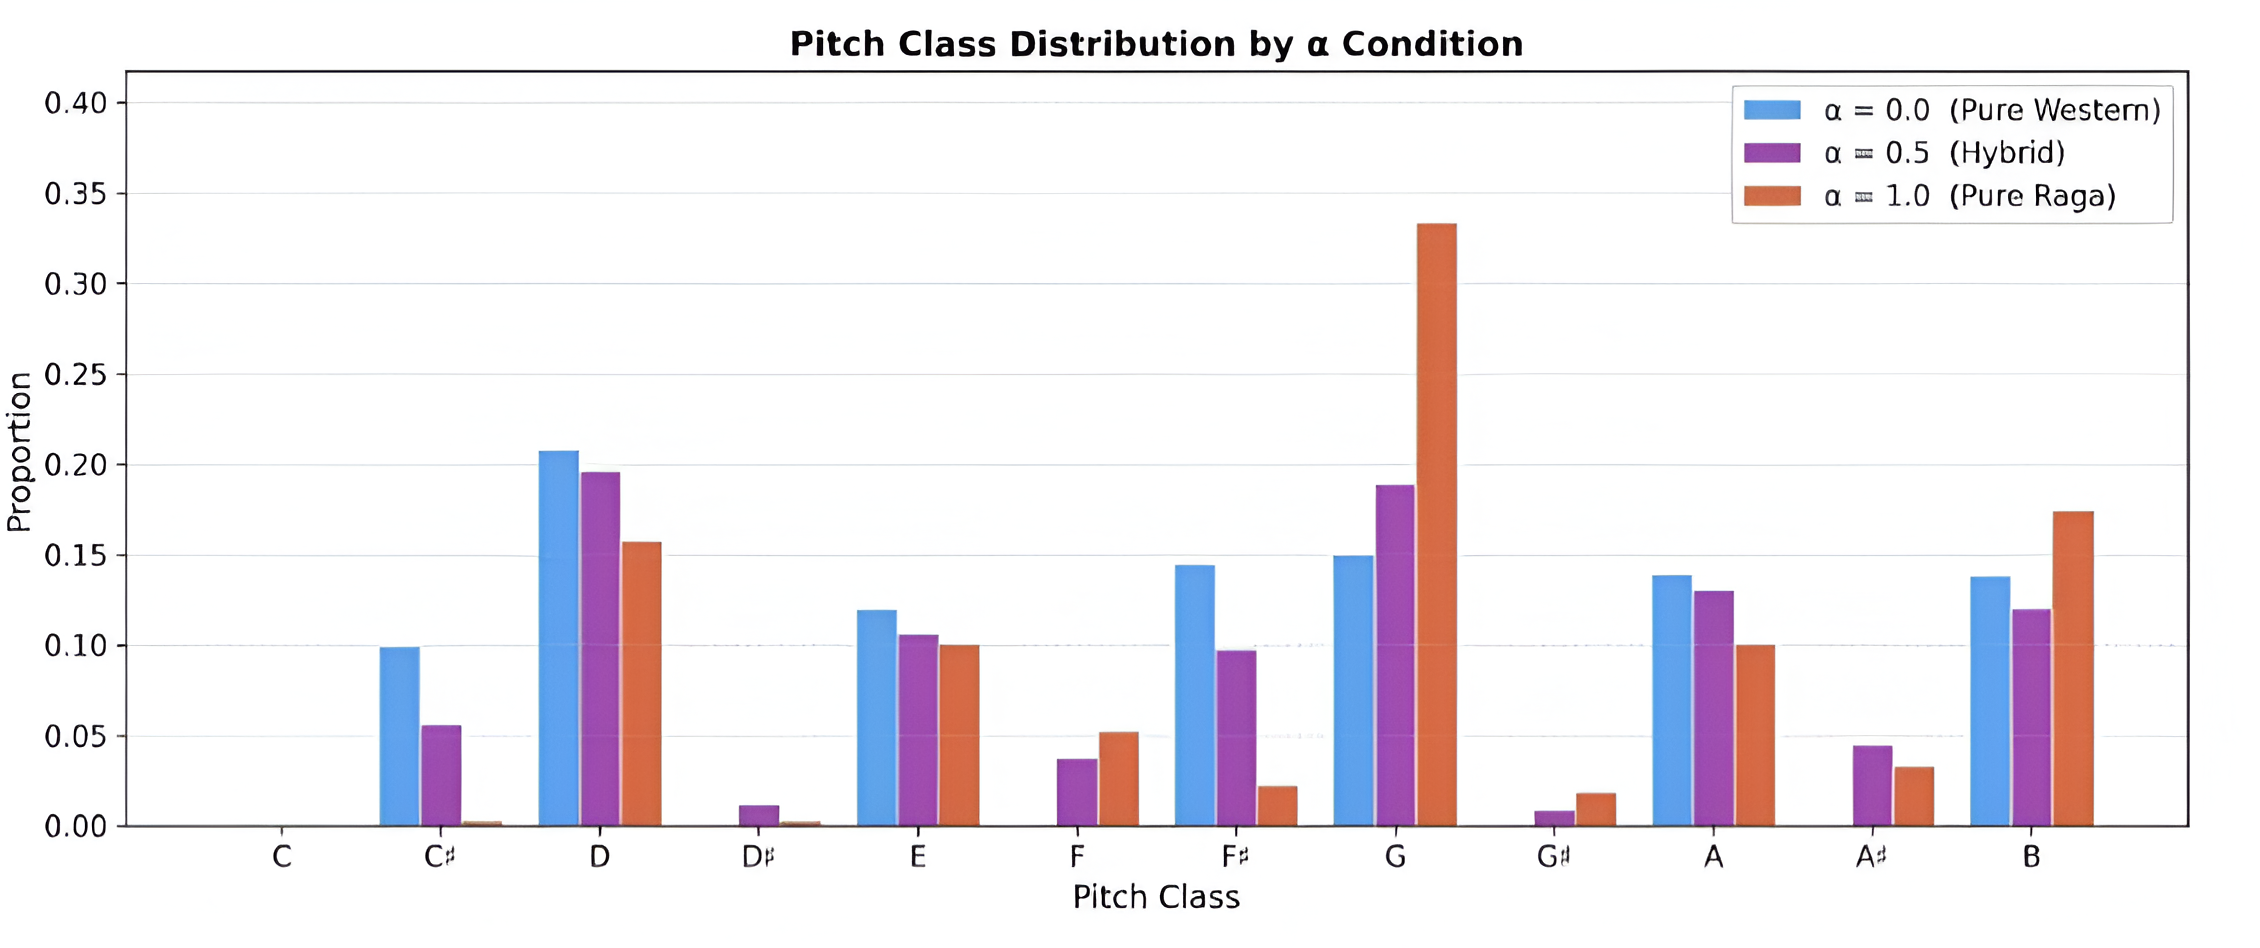
Figure 7 shows how the pitch-class distribution of the generated 32-note sequences varies across three α values. At α = 0.0 (pure Western) the distribution favours pitch classes of the Western diatonic set, with D most common. At α = 1.0 (pure raga) the distribution reflects the pooled six-raga aggregate, in which G is prominent; because this aggregate averages all six ragas, the prominence of G is a property of the aggregate statistics and should not be attributed to any single raga such as Mohanam. At α = 0.5 the distribution sits between the two, with neither set of peaks dominating.
In Figure 8, you can see piano roll visuals of 32-note sequences created with different settings: α = 0.0, 0.5, and 1.0. The sequence for α = 0, representing pure Western music, shows a smooth descent over two octaves, which is what you’d expect from traditional Western chorale music. The α = 0.5 sequence, blending styles, has a broader range of pitches and features more irregular movements, with some intervals that don’t align with standard diatonic patterns. Finally, the pure raga sequence at α = 1.0 focuses on a tight pitch area that highlights the fifth degree (G), repeatedly returning to that note throughout the sequence.
Discussion
This work has two main findings. First, first-order Markov transition matrices built from Carnatic raga and Western chorale pitch-class sequences show clear tradition-level differences: within-raga JSD is lower than between-tradition JSD under a recording-level permutation test (p = 0.007), indicating that the matrices capture structural differences between the traditions. Second, blending the matrices by convex combination produces a controllable distributional interpolation, with a crossover near α = 0.5–0.6. Both findings concern the distributional structure of pitch-class transitions; they do not establish that the generated sequences are perceived as authentic or as musical hybrids.
These findings have several implications. First, the stylistic structure of Carnatic raga melodies can be encoded, at the level of pitch-class transitions, with a simple probabilistic model and without large datasets or complex representations22. This matters because much work in computational music generation relies on large corpora and produces models that are hard to inspect2. Markov transition matrices, by contrast, can be read, edited, and compared directly; the differences between Mohanam and Bhairavi are visible in Figure 1. The blending method is also mathematically well behaved23: because the blended matrix is a convex combination of two stochastic matrices, it remains a valid stochastic matrix for every α, so the generated sequences are probabilistically coherent at every blend point24.
The two goals set out in the Introduction were partly met. The first, that the matrices capture tradition-level differences, is supported: within-raga JSD was significantly lower than between-tradition JSD under a recording-level permutation test (p = 0.007), and the block structure in Figure 4 shows the same pattern, though the effect is modest and the within-Western grouping was not significant. The second, controllable interpolation, holds at the level of the transition matrices: matrix similarity moved monotonically from 0.59 to 1.00 as α changed. As shown above, this interpolation is distributional and, at the level of sampled sequences, does not preserve a held-out raga identity, so we do not claim perceptual or musical authenticity.
Several extensions follow from these limitations. The first-order model cannot capture long-range dependencies, and higher-order context is known to improve melodic prediction23,25. We compared first- and second-order models directly on this corpus: the second-order model gave no reliable improvement (leave-one-out held-out perplexity 4.82 versus 4.75 for the raga sequences), and only 28% of possible second-order contexts were ever observed, because the canonical sequences are short (median 15 notes). Capturing phrase-level structure such as pakad26,19,27 or variable-order dependencies28 would therefore require longer, real performance data rather than a higher-order model alone. A perceptual listening study with trained Carnatic musicians would be needed to test whether the structural interpolation corresponds to perceived differences29; the present results speak only to distributional structure. Extending the representation to audio-based pitch and to rhythm and duration is a further direction, since the current pitch-class framework treats timing separately and models no rhythm.
Several limitations should be kept in mind. The corpus is symbolic and, for the ragas, consists of canonical aroha/avarohana forms rather than recorded performances; this removes the gamaka, microtonal inflection, and improvisation that are central to Carnatic identity7,8,9, so the raga matrices represent an idealised, simplified version of each raga rather than the tradition as performed. The 12-tone equal-tempered pitch-class representation discards these microtonal and ornamental features by construction. Collapsing major- and minor-mode chorales into one Western aggregate mixes two modal distributions. The first-order assumption limits the model to one-note horizons4 and misses hierarchical phrase structure. The corpus is also small (18 raga sequences, 22 chorales) and is not a representative sample of either tradition. Finally, because no listening evaluation was carried out, we cannot claim that the generated sequences sound authentic or musically meaningful29.
Overall, this study shows that simple, interpretable probabilistic models can represent and distinguish tradition-level melodic structure in a transparent and reproducible way, and that a convex blend of two transition matrices provides a controllable distributional interpolation between them. The contribution is a reproducible and inspectable groundwork for cross-cultural melodic modelling, rather than a system for generating perceptually authentic hybrids. The honest scope is structural and distributional, and the main routes forward are real performance data, higher-order or phrase-level models, and perceptual evaluation.
Appendix
| Item | n | Tradition | Source | Tonic | Pitch classes |
| Bhairavi | 3 | Carnatic raga | Canonical aroha/avarohana (musicological), MIDI via music21 | C (PC 0) | 7 (heptatonic) |
| Kalyani | 3 | Carnatic raga | Canonical aroha/avarohana (musicological), MIDI via music21 | C (PC 0) | 6–7 |
| Kambhoji | 3 | Carnatic raga | Canonical aroha/avarohana (musicological), MIDI via music21 | C (PC 0) | 7 (heptatonic) |
| Mohanam | 3 | Carnatic raga | Canonical aroha/avarohana (musicological), MIDI via music21 | C (PC 0) | 5 (pentatonic) |
| Shankarabharanam | 3 | Carnatic raga | Canonical aroha/avarohana (musicological), MIDI via music21 | C (PC 0) | 7 (heptatonic) |
| Todi | 3 | Carnatic raga | Canonical aroha/avarohana (musicological), MIDI via music21 | C (PC 0) | 7 (heptatonic) |
| Bach chorales (music21 core) | 12 | Western | music21 core Bach corpus (BWV), symbolic | C major / A minor | 7 (diatonic) |
| Bach chorales (JSB dataset) | 10 | Western | JSB Chorales dataset, symbolic | C major / A minor | 7 (diatonic) |
Each raga is represented by three canonical sequences (aroha/avarohana forms). Western pieces are transposed to C major or A minor before pitch-class extraction.
References
- Fernández JD, Vico F. AI methods in algorithmic composition: A comprehensive survey. Journal of Artificial Intelligence Research. 2013;48:513–582. https://doi.org/10.1613/jair.3908. [↩]
- Briot J-P, Hadjeres G, Pachet F-D. Deep learning techniques for music generation. Springer; 2020. https://doi.org/10.1007/978-3-319-70163-9. [↩] [↩]
- Mehta A, Chauhan S, Djanibekov A, Kulkarni A, Xia G, Choudhury M. Music for all: Representational bias and cross-cultural adaptability of music generation models. Findings of the ACL: NAACL 2025. 2025:4569–4585. https://doi.org/10.18653/v1/2025.findings-naacl.258. [↩] [↩]
- Ames C. The Markov process as a compositional model: A survey and tutorial. Leonardo. 1989;22:175–187. https://doi.org/10.2307/1575226. [↩] [↩]
- Shapiro I, Huber M. Markov chains for computer music generation. Journal of Humanistic Mathematics. 2021;11:167–195. https://doi.org/10.5642/jhummath.202102.08. [↩]
- Rohrmeier M. Towards a generative syntax of tonal harmony. Journal of Mathematics and Music. 2011;5(1):35–53. https://doi.org/10.1080/17459737.2011.573676. [↩]
- Koduri GK, Gulati S, Rao P, Serra X. Rāga recognition based on pitch distribution methods. Journal of New Music Research. 2012;41:337–350. https://doi.org/10.1080/09298215.2012.735246. [↩] [↩]
- Rao S, Rao P. An overview of Hindustani music in the context of computational musicology. Journal of New Music Research. 2014;43:24–33. https://doi.org/10.1080/09298215.2013.831109. [↩] [↩]
- Chordia P, Şentürk S. Joint recognition of raag and tonic in North Indian music. Computer Music Journal. 2013;37:82–98. https://doi.org/10.1162/COMJ_a_00194. [↩] [↩]
- Cuthbert MS, Ariza C. music21: A toolkit for computer-aided musicology and symbolic music data. Proceedings of the 11th ISMIR Conference. 2010:637–642. https://doi.org/10.5281/zenodo.1416114. [↩] [↩] [↩] [↩] [↩] [↩]
- Lin J. Divergence measures based on the Shannon entropy. IEEE Transactions on Information Theory. 1991;37:145–151. https://doi.org/10.1109/18.61115. [↩] [↩]
- Boulanger-Lewandowski N, Bengio Y, Vincent P. Modeling temporal dependencies in high-dimensional sequences: Application to polyphonic music generation and transcription. Proceedings of the 29th ICML. 2012. https://arxiv.org/abs/1206.6392. [↩]
- Hadjeres G, Pachet F, Nielsen F. DeepBach: A steerable model for Bach chorales generation. Proceedings of the 34th ICML (PMLR). 2017;70:1362–1371. https://proceedings.mlr.press/v70/hadjeres17a.html. [↩]
- Chordia P, Rae A. Raag recognition using pitch-class and pitch-class dyad distributions. Proceedings of the 8th ISMIR Conference. 2007:431–436. https://archives.ismir.net/ismir2007/paper/000431.pdf. [↩] [↩]
- Gulati S, Bellur A, Salamon J, Ranjani HG, Ishwar V, Murthy HA, Serra X. Automatic tonic identification in Indian art music: Approaches and evaluation. Journal of New Music Research. 2014;43(1):55–73. https://doi.org/10.1080/09298215.2013.875042. [↩]
- Temperley D, Marvin EW. Pitch-class distribution and the identification of key. Music Perception. 2008;25:193–212. https://doi.org/10.1525/mp.2008.25.3.193. [↩]
- Saul LK, Jordan MI. Mixed memory Markov models: Decomposing complex stochastic processes as mixtures of simpler ones. Machine Learning. 1999;37:75–87. https://doi.org/10.1023/A:1007649326333. [↩]
- Rodríguez-López ME, Volk A. Melodic segmentation using the Jensen-Shannon divergence. Proceedings of the 11th ICMLA. 2012:351–356. https://doi.org/10.1109/ICMLA.2012.65. [↩]
- Gulati S, Serrà J, Ishwar V, Şentürk S, Serra X. Phrase-based rāga recognition using vector space modeling. Proceedings of the 2016 IEEE ICASSP. 2016:66–70. https://doi.org/10.1109/ICASSP.2016.7471638. [↩] [↩]
- Brunner G, Konrad A, Wang Y, Wattenhofer R. MIDI-VAE: Modeling dynamics and instrumentation of music with applications to style transfer. Proceedings of the 19th ISMIR Conference. 2018:747–754. https://archives.ismir.net/ismir2018/paper/000204.pdf. [↩]
- Sturm BL, Santos JF, Ben-Tal O, Korshunova I. Music transcription modelling and composition using deep learning. Proceedings of the 1st Conference on Computer Simulation of Musical Creativity. 2016. https://arxiv.org/abs/1604.08723. [↩]
- Sakellariou J, Tria F, Loreto V, Pachet F. Maximum entropy models capture melodic styles. Scientific Reports. 2017;7:9172. https://doi.org/10.1038/s41598-017-08028-4. [↩]
- Conklin D, Witten IH. Multiple viewpoint systems for music prediction. Journal of New Music Research. 1995;24:51–73. https://doi.org/10.1080/09298219508570672. [↩] [↩]
- Conklin D. Chord sequence generation with semiotic patterns. Journal of Mathematics and Music. 2016;10(2):92–106. https://doi.org/10.1080/17459737.2016.1188172 Appendix Table 2. Corpus provenance. Each raga is represented by three canonical sequences (aroha/avarohana forms). Western pieces are transposed to C major or A minor before pitch-class extraction. Figure 9. Mean JSD between a generated sequence and its source (raga) aggregate as a function of sequence length (300 samples per length). Fidelity is lowest near the 32-note length used in the main text and improves only for much longer sequences. [↩]
- Pearce MT, Wiggins GA. Auditory expectation: The information dynamics of music perception and cognition. Topics in Cognitive Science. 2012;4:625–652. https://doi.org/10.1111/j.1756-8765.2012.01214.x. [↩]
- Gulati S, Serrà J, Ganguli KK, Şentürk S, Serra X. Time-delayed melody surfaces for rāga recognition. Proceedings of the 17th ISMIR Conference. 2016:185–191. https://archives.ismir.net/ismir2016/paper/000104.pdf. [↩]
- Ishwar V, Dutta S, Bellur A, Murthy HA. Motif spotting in an Alapana in Carnatic music. Proceedings of the 14th ISMIR Conference. 2013:499–504. https://archives.ismir.net/ismir2013/paper/000205.pdf. [↩]
- Begleiter R, El-Yaniv R, Yona G. On prediction using variable order Markov models. Journal of Artificial Intelligence Research. 2004;22:385–421. https://arxiv.org/abs/1107.0051. [↩]
- Yang L-C, Lerch A. On the evaluation of generative models in music. Neural Computing and Applications. 2020;32:4773–4784. https://doi.org/10.1007/s00521-018-3849-7. [↩] [↩]