
Abstract
Background/Objective: The three differential equations describing a chlorinated pool give a sanitation threshold of the form C = a/b, with a the pathogen growth rate and b the inactivation rate constant. The question is whether this threshold means anything, or is simply a result of the chosen parameters.
Method: The three differential equations for chlorine, pathogens and exposure were solved analytically. Sensitivity of the equilibrium Ceq = (r − mS)/k to each parameter was expressed as an elasticity. Two parameters were calibrated against published measurements: b against Chick–Watson CT data, and the per-bather depletion rate m against a measured consumption of 4,120 mg per bather. Uncertainty was propagated by Monte Carlo.
Results: Table 2 shows the threshold moves by orders of magnitude once b is calibrated per organism, from 0.13 ppm for Giardia to 44.3 ppm for Cryptosporidium parvum; none fall inside the 1–10 ppm regulatory band. The value b = 0.005 ppm-1 min-1 implies a 3-log CT of 1,382 ppm·min, matching no documented organism. Table 3 shows m is uncalibrated too: the value used corresponds to a 13.7 m3 volume, and correcting it raises the equilibrium above the regulatory maximum. The parameters r and m offset one another, so the 3.90 ppm equilibrium is coincidental.
Conclusions: The threshold simply represents a ratio of constants that have not been determined, and the value chosen happens to fall within a typical regulated range. No output was verified against data.
Keywords: differential equations, swimming pool chlorination, Chick–Watson kinetics, parameter calibration, sensitivity analysis, model identifiability, recreational water
Introduction
Background and Context
While disinfectants other than chlorine are being used in increasing numbers for public swimming pools, chlorine remains by far the most commonly used water disinfectant. For that reason, regulation of the concentration of chlorine in the water of public pools is typically restricted to a defined “operating band”. In the United States, the Model Aquatic Health Code (MAHC), published by the Centers for Disease Control and Prevention (CDC) as a voluntary technical standard for the public health protection of aquatic facilities, sets a minimum “free available chlorine” (FAC) concentration of 1.0 ppm for pools not using cyanuric acid as a chlorine stabilizer, and 2.0 ppm for those that do. The maximum concentration of chlorine in the water of public pools, while bathers are present, is specified as 10.0 ppm, although typical operating ranges are generally considerably more restricted (1–4 ppm), with 1 ppm being the minimum allowed for health reasons and 4 ppm the upper end of a comfort range1.
Surveillance data motivate the regulation of chlorine concentration in pool water. From 2015 through 2019 the CDC identified 208 outbreaks of illness associated with treated recreational water including pools, hot tubs and water play grounds. Of the 208 outbreaks of illness identified by CDC among treated recreational water there were 71 outbreaks associated with hotels and resorts, with the vast majority of these related to hot tubs. All 13 reported deaths were attributed to Legionella. The largest number of cases and illnesses were attributed to Cryptosporidium2. The organisms responsible for most pool-associated illness are therefore chlorine-tolerant protozoa and biofilm-associated bacteria rather than fast-growing bacteria.
Literature Review
Disinfection kinetics and the CT framework. The inactivation of waterborne organisms by free chlorine is commonly described by the Chick–Watson relationship which states that the logarithm of survival decreases in proportion to the product of free-chlorine concentration and time. This results in a “CT value” that is specified by the regulator. The dilution coefficient that describes how the inactivation rate changes with concentration of free-chlorine has also been modelled. Deviations from this log-linear relationship, such as shoulders and tails, have been observed and modeled using for example the Hom model3. For this study the Chick–Watson model is important because it relates the removal rate (measured in the lab) to the quantity that is specified by the regulator, the CT value.
Protozoan inactivation. Cryptosporidium is by far the most common cause of gastrointestinal illness linked to swimming pools, and is very chlorine tolerant. Chlorination conditions that gave CT values for a 3-log reduction in viability of two isolates were 10,400 and 15,300 ppm·min at pH 7.5. These numbers are above the CDC-recommended value for remediation of 9,600 ppm·min4,1. Of note, cyanuric acid (stabilizer) is very effective at inhibiting the chlorine inactivation of oocysts under hyperchlorination conditions, and so oocysts are very resistant at all normal operating chlorine concentrations5,6. Consequently, the main control for oocysts is provided by means of filtration of pool water, and management of human fecal shed events rather than reliance on the chlorine residual in the pool water7,8. In terms of outbreak prevention and control, this is essentially a problem of external regulation, plus good practice by pool staff and measures to control human behavior that could lead to an outbreak7.
Bacterial inactivation and tolerance. Bacteria are inactivated orders of magnitude faster than protozoa. However, the range for inactivation of any group of organisms can be very large for individual strains. Using the Chick–Watson model six chlorine-tolerant gram-negative bacteria were fit from a chlorinated distribution system. All six isolates survived 0.5–1 mg/L residual free chlorine for 30 minutes of contact, with the most resistant requiring 180 minutes at 5 mg/L for a 2-log reduction9. Biofilm forming organisms, such as Legionella pneumophila, have been found to be tolerant of chlorine concentrations above those typically used to operate pools and have been found to be persisters that regrow after treatment10. Therefore, the single set of growth and inactivation rate constants for any organism will not accurately reflect the multitude of organisms that are found in a pool. Legionella has been detected on numerous occasions in pool and hot tub water during routine surveillance of aquatic recreational facilities. Legionella was found to predominate in samples from indoor hot tubs11.
Chlorine balance and bather load. The mass balance of residual chlorine in an operating pool has been measured directly. A study of two pools of very different bather load found that trial-and-error chlorination failed to maintain an adequate level of residual within the set limits, and derived a chlorine consumption coefficient of 4,120 mg per bather12. Bather-derived material is a major sink for chlorine in pool water, and the chlorine-reactive particulate matter released into the water by bathers has been characterised directly13. Also, a single swimmer loading event in bench-scale pool water was found to consume 70–75% of the residual free chlorine instantaneously, with the corresponding decay rate constant increasing with water temperature14. Measured water and air chemistry from long-term monitoring at an indoor swimming facility through changes in water-treatment practice showed the large impact that various different operational choices have on both15.
Exposure and microbial risk assessment. A quantitative microbial risk assessment (QMRA) provides exposure information that a dose-based model requires. Estimates of ingestion volumes, swim durations and frequencies of visits by adults and children to bathing sites have been made, yielding a mean risk of Cryptosporidium infection of 2.6 × 10⁻⁴ per swim event16. Similar exposure assessments have been made for bathers in pool and natural bathing waters17. Reverse QMRA has been used to set targets for treatment of pools without a disinfectant residual to achieve acceptable risk following heavy bather loads. More than 24 hours of treatment would be required to achieve acceptable risk following heavy bather loads18. The risk studies referenced here are dose-based as opposed to threshold-based and thus provide additional information regarding the risks associated with pathogens not meeting the criterion of pathogen extinction.
Combined chlorine and swimmer irritation. Perceptions that pools are heavily chlorinated relate more to combined chlorine than to free chlorine. The irritant trichloramine is produced when free chlorine reacts with nitrogenous material from bathers19, and real-time measurement of gas-phase trichloramine above an indoor pool shows concentrations to rise with numbers of active swimmers and reach peak values of 116–226 ppb20. Airborne trichloramine has been associated with ocular and respiratory irritation in pool workers21,22,23, and it has been implicated as a cause of occupational asthma24. However, considerable variation exists with respect to time and space of exposure within and between venues25. Moreover, in order to obtain an accurate estimate of chloramine concentrations present in the air above a pool, sampling strategy must be taken into account26. The principal means of control of airborne chloramines is by means of ventilation design27,28. Pools that are stabilized with trichloroisocyanuric acid also generate a range of inorganic byproducts of potential toxicological concern29. The pool odor and associated irritation indicates insufficient free chlorine to deal with the present nitrogen load rather than an overabundance of it.
The gap. In the reviewed literature, inactivation rates are measured while risks are expressed as doses. To date, there is no published work where these measured inactivation rates and corresponding risks are used to test whether or not the threshold behavior obtained by using models, such as coupled differential equations for chlorination of a pool, translates into real information. While models, often used as teaching tools to introduce students to particular features of water treatment, easily generate threshold behavior, the issue here is whether such statements also carry information.
Problem Statement and Rationale
The coupled ODE system forms the basis for modeling the dynamics of the three pool constituents: the chlorine concentration, the pathogen density and the cumulative bather exposure. Within this framework a simple threshold, of the form C = a/b, separates a coexistence regime from an extinction regime of the pathogens.
The problem is that a/b is simply the ratio of two constants. Both constants are fixed before the run, and neither is observable in a pool. So, if the constants are chosen without independent calibration, the threshold is fixed by that choice, and any agreement with a regulatory figure is coincidental. Note that this is not a problem specific to pool water chemistry and occurs every time a model outputs a ratio of unmeasured rate constants. The problem is quantified in this paper where independent data are used for the calibration of the constants.
Significance and Purpose
The primary contribution of this work is structural as opposed to predictive. That is, this work does not set a chlorination standard, and no quantity in the model is measured. Rather, the threshold for chlorination in the simple model outlined is a pure function of the inactivation constant b for a fixed growth rate a. For example, using published data on CT values for various pathogens, the threshold value for chlorination is shown to vary over almost three orders of magnitude, far below the MAHC operating standard as well as far above it. The per-bather depletion rate is also uncalibrated, and correcting it against measured consumption results in an equilibrium concentration greater than the MAHC maximum allowed value for disinfectant residuals. The baseline configuration, which is the one a modeller would most naturally choose, does not satisfy the model’s own condition for effective sanitation.
Objectives
This study has five primary objectives. The first is to set up three interconnecting ODEs (a model) and provide a closed-form solution to each of the three variables, including the pathogen variable which is a Bernoulli equation so it can be solved analytically. The second objective is to provide an analysis of the risk function R(C) and test whether its optimum is consistent with the pathogen equation. The third objective is to perform a sensitivity analysis of all model parameters and provide the results in terms of the associated elasticities rather than percentages at a single set of operating conditions. The fourth objective is to calibrate two of the model parameters (the inactivation constant b and the per-bather rate of depletion m) against measured values, and to provide an analysis of the consequences of the modeled results. The fifth objective is to use Monte Carlo methods to propagate uncertainties in model parameters.
Scope and Limitations
The model is for a single indoor pool. It is assumed that the pool is well mixed, that cyanuric acid is not added, and that the pool is not equipped with automatic chlorine control. Only free chlorine is included as a chemical species in the model, and thus combined chlorine is not included as a chemical species. The bather load, S, is held constant in these simulations. None of the quantities modeled were measured in this study. All of the model parameters were chosen from the published literature or set as constants for this model. Verification and confirmation of the model are confined to verifying numerical solutions against analytical solutions and not against chlorine time series, bacterial plate counts, or other pool measurements.
Theoretical Framework
The chlorine balance describes a continuously stirred tank with constant inflow and first-order outflow, the same kind of structure used in published pool mass-balance studies12. The pathogen equation is a logistic growth curve with a Chick–Watson inactivation term. Since the dilution coefficient is set equal to 1, the removal rate equals bCP and b thus is equal to the Chick–Watson rate constant for inactivation of pathogens by chlorine3,9. This enables the use of chlorine CT data from previous studies for calibration, and thus to analytically transfer the findings of these studies. The exposure integral is calculated as the area under the curve of accumulated chlorine contact over time, corresponding to the dose-based perspective of exposure studies on chlorine16,17.
Methodology Overview
Three ODEs are defined and solved in closed form. Numerical integration by Euler’s method is benchmarked against the analytical solutions. Sensitivity is assessed analytically through elasticities and numerically through Monte Carlo propagation. Two parameters are calibrated against published measurements. All computation was performed in Python 3.
Methods
Research Design
This is a theoretical modelling study with no experimental component, no human participants and no collected data. There is accordingly no sample, no data-collection procedure and no institutional review requirement. The objects of analysis are the three differential equations and their parameters.
Variables and Parameters
The model contains eight parameters that have been provided in Table 1 with corresponding values and units. With respect to provenance, r is not a measurable quantity, it is a function of the volume of the pool and the capacity of the feeder and thus cannot be obtained from regulatory guidance. The decay constants k have been derived from free-chlorine half-life measurements. The value for indoor was obtained using a free-chlorine half-life of 90 minutes, whereas the value for outdoor was obtained using a free-chlorine half-life of 45 minutes under ultraviolet exposure. Measured decay in actual operating pools is strongly affected by bather load and temperature14,13. The values of a, b and m were assumptions in the original formulation and their calibration using published data is addressed in separate analyses below.
| Parameter | Value | Units | Provenance |
| r (chlorine input) | 0.080 | ppm min-1 | Assumption. Depends on pool volume and feeder capacity; not available from regulatory guidance. |
| k (decay, indoor) | 0.0077 | min-1 | Derived from t½ = 90 min as ln2/t1/2. |
| k (decay, outdoor) | 0.0154 | min-1 | Derived from t½ = 45 min under UV exposure as ln2/t1/2. |
| S (bather load) | 10 | bathers | Assumption. |
| m (depletion/bather) | 0.005 | ppm bather-1 min-1 | Assumption; calibrated here against a measured 4,120 mg per bather. See Table 3. |
| C₀ (initial chlorine) | 2.5 | ppm | Assumption, mid-range of the 1–4 ppm industry band. |
| P₀ (initial pathogens) | 5.0 × 10³ | CFU mL-1 | Assumption. Not a low value; far above any acceptable pool density. |
| a (growth rate) | 0.02 | min-1 | Assumption; doubling time 34.7 min. Not calibrated; no suitable published data located. |
| b (inactivation) | 0.005 | ppm-1 min-1 | Assumption; calibrated here against published CT data. See Table 2. |
| N (carrying capacity) | 1.0 × 10⁶ | CFU mL-1 | Assumption. |
| α, β (risk weights) | 1, 0.1 | dimensionless | Assumptions. Only the ratio α/β affects the optimum. |
System 1: Chlorine Balance
Chlorine is added to the water at a constant rate r. It decays at a rate that is proportional to the concentration, with constant k. The chlorine is also used up by the bathers at a rate that is proportional to the number of bathers, S, with constant m.
![\[ \mathrm{\frac{dC}{dt} = r - kC - mS} \]](https://nhsjs.com/wp-content/ql-cache/quicklatex.com-15e14597cac3072a3858ba868d80517b_l3.png "Rendered by QuickLaTeX.com")
Separation of variables gives
![\[ \mathrm{C(t) = \frac{(r - mS)}{k} + \left[C_0 - \frac{(r - mS)}{k}\right] e^{(-kt)}}\]](https://nhsjs.com/wp-content/ql-cache/quicklatex.com-4234201e5b9cb33b65160a8f72483947_l3.png "Rendered by QuickLaTeX.com")
with equilibrium Ceq = (r − mS)/k. Ceq is the concentration reached when chlorine is added at the constant rate r, and should not be confused with the risk-minimizing concentration Copt introduced below.
System 2: Pathogen Dynamics
System 2 is a logistic growth model of the pathogen concentration that includes a Chick–Watson inactivation term3:
![\[ \mathrm{\frac{dP}{dt} = aP\left(1 - \frac{P}{N}\right) - bCP} \]](https://nhsjs.com/wp-content/ql-cache/quicklatex.com-c5651cd87cbefb33d52f777147cee2fd_l3.png "Rendered by QuickLaTeX.com")
For constant C, the equilibria for P of System 2 are P* = 0 and P* = N(1 − bC/a). So long as C ≥ a/b, then P* ≤ 0, and so the only admissible equilibrium is extinction; below a/b the system admits a coexistence regime. It is of course important to realize that a/b is a ratio of two constants in the model, and writing out the above expression for P* does not give a quantity that is measured or predicted by the model.
System 2 has a closed-form solution for the time-dependent concentration C(t) = Ceq + (C0 − Ceq)·e(−kt) obtained from System 1. The resulting differential equation for P is a Bernoulli equation. It can be solved by a change of variable u = 1/P, leading to the linear equation
![\[\mathrm{\frac{du}{dt} + (a - bC(t))u = \frac{a}{N}}\]](https://nhsjs.com/wp-content/ql-cache/quicklatex.com-e4ff6bbddf0adf29c1277ea7ab1b5fe6_l3.png "Rendered by QuickLaTeX.com")
which is solved with integrating factor exp[Φ(t)], where Φ(t) = (a − bCeq)t − (b(C0 − Ceq)/k)(e^(−kt) − 1). The solution P(t) = exp[Φ(t)] / (1/P0 + (a/N)∫0t exp[Φ(s)] ds) can also be approximated using Euler’s method. This numerical method is still useful in the case where S varies with time, as no closed-form solution exists then.
System 3: Cumulative Exposure
Cumulative bather exposure over a session of length T is
![\[ \mathrm{E(T) = \int_0^T C(t)\ dt = C_{eq} . T + (C_0 - C_{eq})\frac{(1 - e^{(-kT)})}{k}}\]](https://nhsjs.com/wp-content/ql-cache/quicklatex.com-a1bf4ddb2e5c3d0c4cb11208e03bbd50_l3.png "Rendered by QuickLaTeX.com")
The constraint E(T) ≤ 4T, or time averaged concentration E(T)/T ≤ 4, is a weaker constraint than C(t) ≤ 4 for all t, i.e., pointwise concentration, not a stronger one. The mean constraint is kept in the problem statement because exposure is a measure of a cumulative dose of disinfectant16,17, however, a mean constraint is not a substitute for a pointwise concentration constraint. For example, a pool operating at 8 ppm for 30 minutes and then at 0 ppm for the remaining 30 minutes of the session complies with the constraint E(T) ≤ 4T, since E(60) = 240 = 4T, while failing to meet the pointwise concentration constraint for the first half of the session and failing to provide any disinfection for the second half of the session.
Risk Function
A combined risk function for infection risk and chemical exposure (chemical harm) is written as:
![\[\mathrm{R(C) = \frac{\alpha}{C} + \beta. H(C),\ H(C) = 0\ for\ C < 4,\ H(C) = (C - 4)^2\ for\ C \geq 4}\]](https://nhsjs.com/wp-content/ql-cache/quicklatex.com-28113b82d01e61ed34bb4e7efd1f2a12_l3.png "Rendered by QuickLaTeX.com")
There are two relevant aspects to note with respect to this function. First, in addition to the already noted embedding of the regulatory value of 4 ppm into the function H(C), the value of 4 ppm is also embedded into the constraint set for exposure. In contrast, System 2’s threshold value depends only on the two parameters a and b, so System 2 is the only part of the model free of an imported regulatory value. Furthermore, the term α/C for infection is inconsistent with the above behavior for System 2, in that the P* value for C ≥ a/b is 0. Thus, the “interior optimum” computed below derives from this inconsistency and not from any unique properties of the above function or the pool used to establish it.
Note that only the ratio α/β enters into the stationary condition, and so a sensitivity analysis is conducted over this ratio rather than over the individual parameters α and β.
Numerical Methods
Euler’s method for the coupled system is given by Cn+1 = Cn + (dC/dt)Δt. Here, the parameter values for the indoor situation and an initial concentration of C0 = 2.5 ppm are used in the working example. The three subsequent steps of the iteration are given by dC/dt = 0.010750 and C1 = 2.502150 ppm; dC/dt = 0.010733 and C2 = 2.504297 ppm; dC/dt = 0.010717 and C3 = 2.506440 ppm. Convergence of the iteration for C(t) is checked against the corresponding analytical solution at time steps of Δt = 0.4 min, Δt = 0.2 min, Δt = 0.1 min, Δt = 0.05 min, Δt = 0.025 min, and Δt = 0.0125 min.
Calibration of the Inactivation Constant
bCP is a term in the Chick–Watson equation with n = 13. As a result, b can be determined from published CT values, and a simple integration of dP/dt = −bCP at constant C gives ln(P0/P) = bCT. This can be rearranged to give b = 6.9078/CT for a 3-log removal. These constants can then be determined for individual organisms, using measured CT values for Cryptosporidium parvum4 as well as reported CT values for remediation of Cryptosporidium and Giardia from the CDC1. The resulting organism-specific constants are presented in Table 2.
Calibration of the Per-Bather Depletion Rate
This approach was also used to calculate m. A measured chlorine consumption by one bather of 4,120 mg12 was used to calculate the total amount of chlorine removed by one bather in one visit to a pool of volume V litres. Over a session of length T minutes at depletion rate m, the chlorine removed is mT ppm, equivalent to mTV mg. Setting this equal to 4,120 mg gives m = 4120/(TV). Values for m for a number of realistic pool volumes were calculated and are shown in Table 3. The resulting Ceq values for these scenarios are shown in Figure 3.
Uncertainty Propagation
A Monte Carlo simulation with 2 × 10⁵ draws of the parameter uncertainties was performed using lognormal distributions with coefficient of variation of 30% for a and b and 20% for r, k, and m. The biological constants were the least constrained. Since all parameters are strictly positive, lognormal distributions were used for the simulation results of a/b and Ceq. The resulting distributions are represented as medians with 95% intervals. These intervals describe the consequences of the assumed uncertainties. They are not empirical confidence intervals, since no measurements were taken to establish the uncertainties.
Results
Analytical Solutions and Baseline Behavior
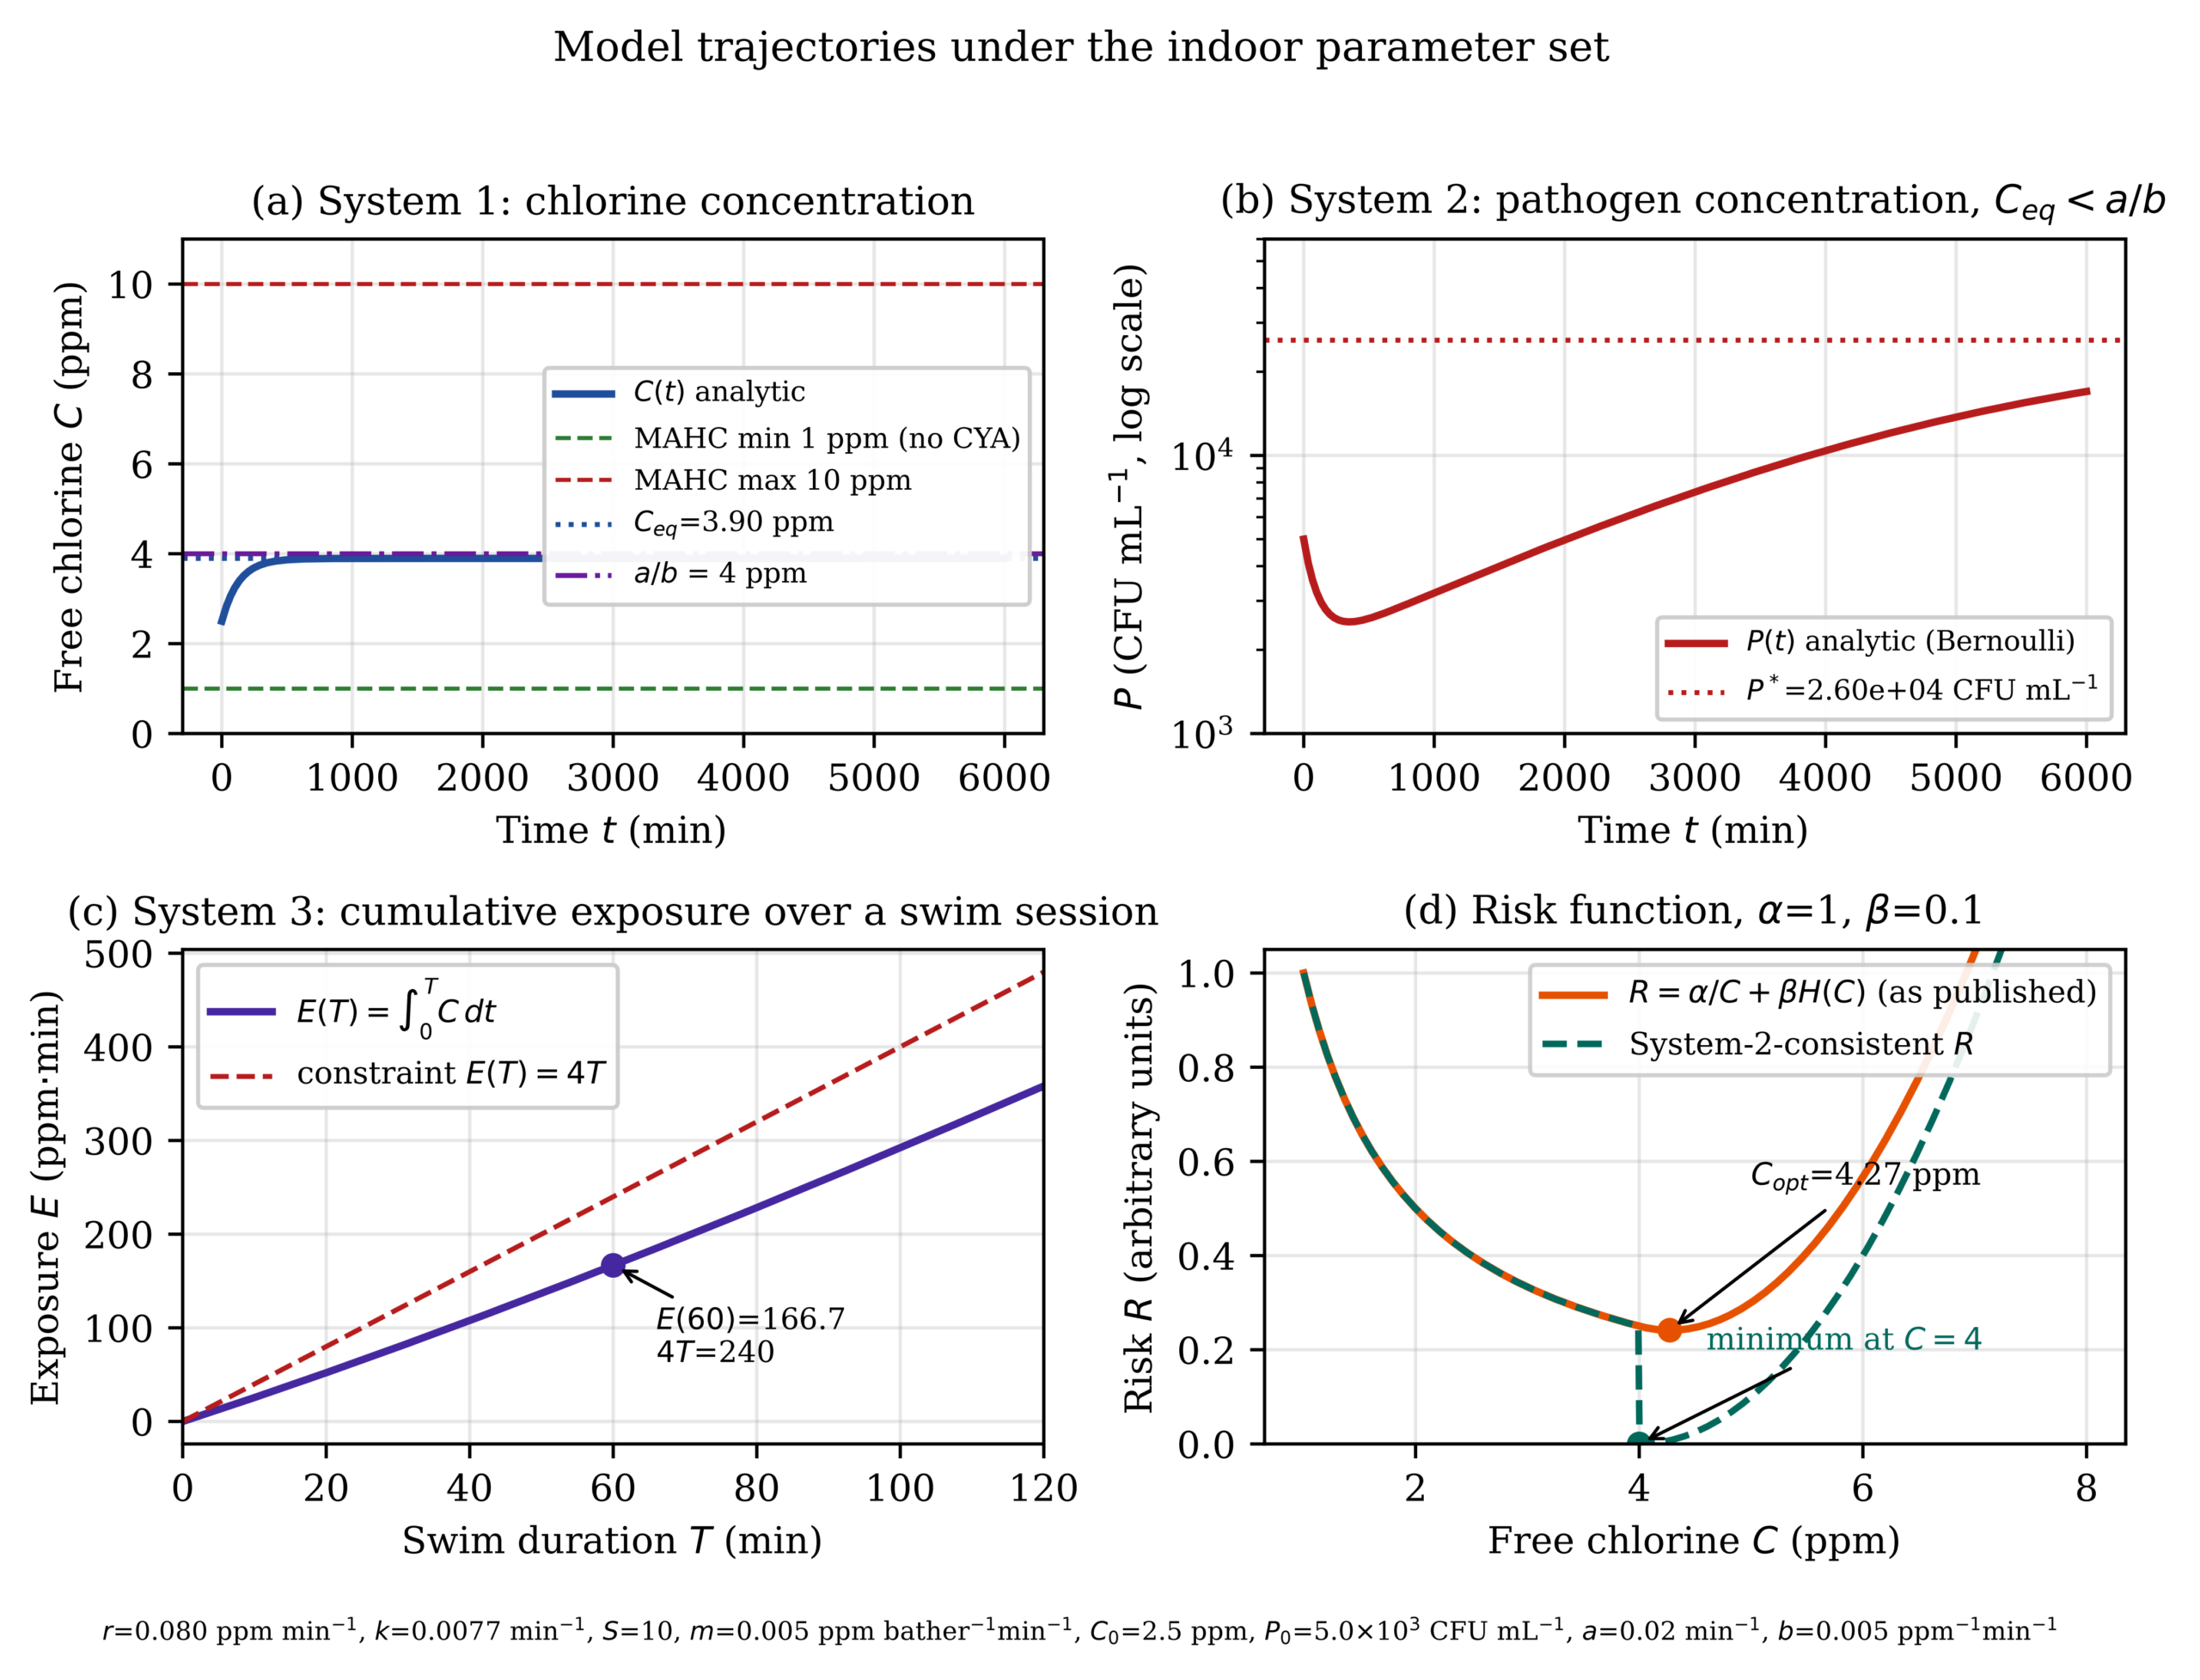
Under the indoor parameter set, Ceq = (0.080 − 0.050)/0.0077 = 3.896 ppm, inside the MAHC operating range of 1–10 ppm1. Figure 1 shows all three states together with the risk function.
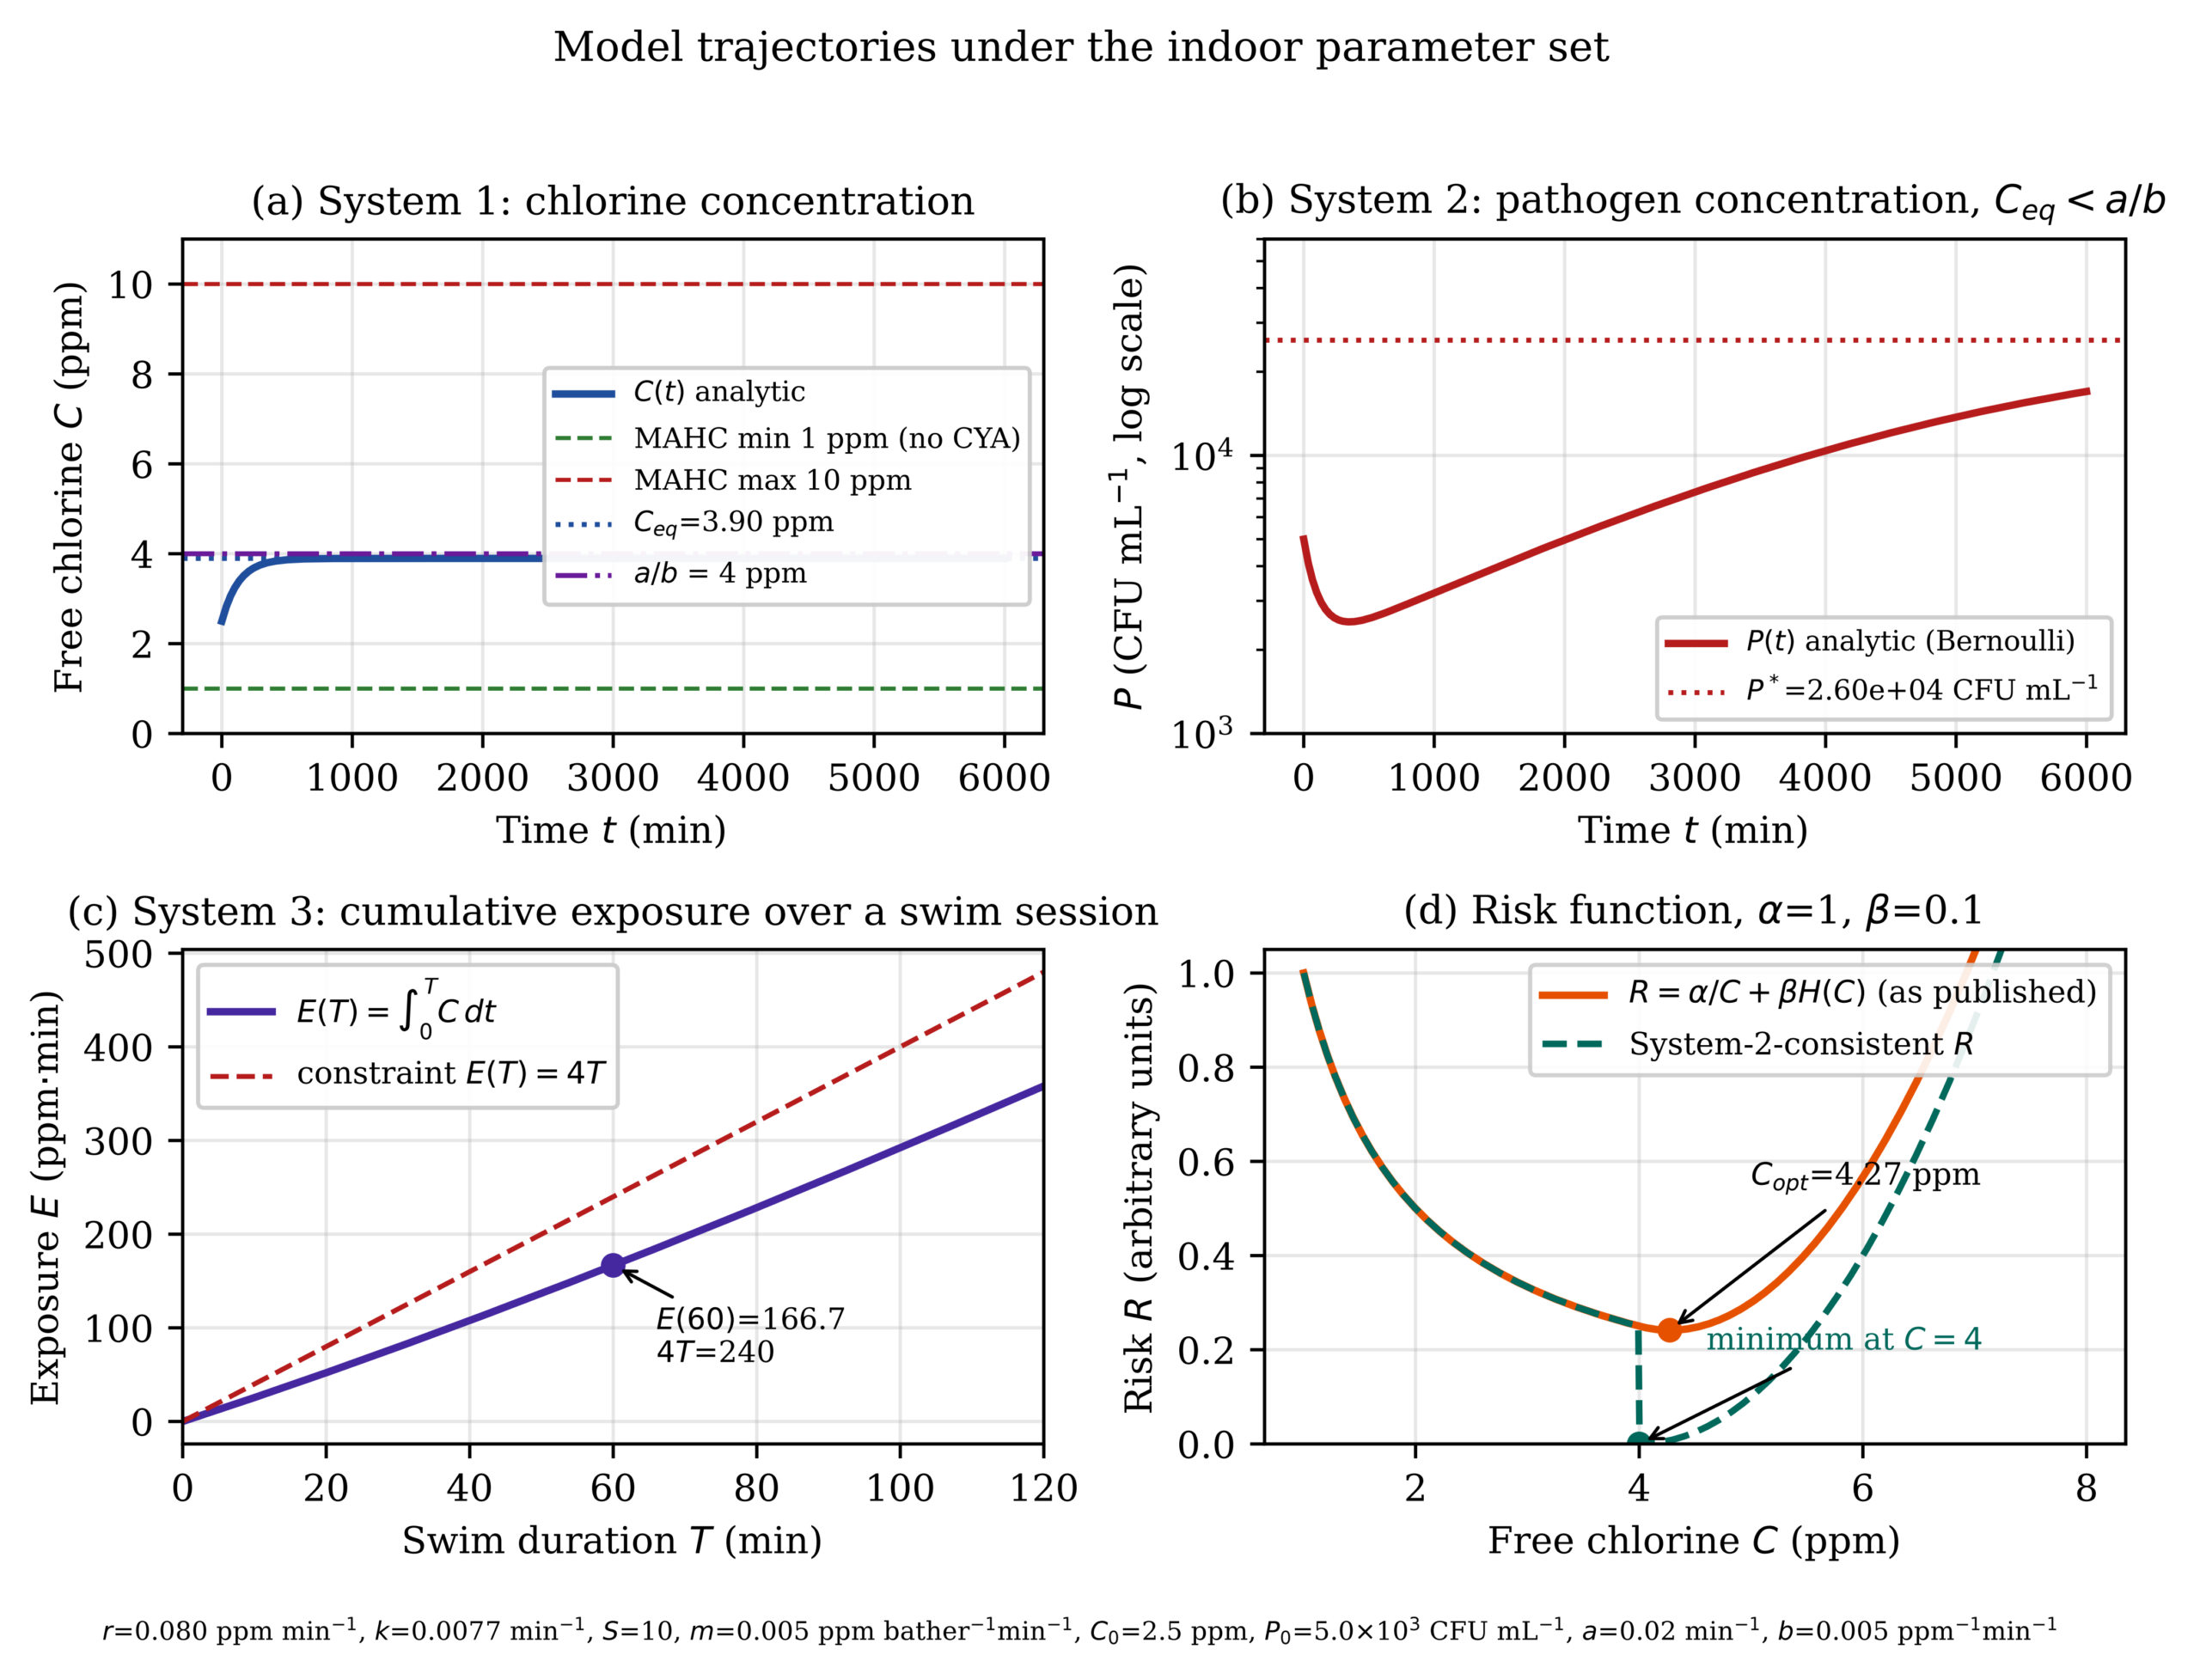
The given baseline case does not fulfill the model’s own sanitation condition, since Ceq = 3.896 ppm is below the value of a/b = 4 ppm. Consequently, the only admissible equilibrium is the coexistence solution P* = N(1 − bCeq/a). Using the above numbers, this gives P* = 106 × (1 − 0.005 × 3.896/0.02) = 2.60 × 10⁴ CFU mL-1. Lying inside the regulatory operating range and meeting the extinction condition are separate criteria, and the baseline meets only the first.
The cumulative exposure is E(60) = 166.7 ppm·min, which is below the constraint of 4T = 240 ppm·min and corresponds to an average concentration of 2.78 ppm.
The Threshold Depends Only on a and b
The ratio a/b, defining the threshold for System 2, is independent of all parameters in System 1, i.e. the dosing rate, decay constant, bather load and initial concentration. Perturbing a by ±10% moves the threshold to 3.60–4.40 ppm, perturbing b by ±10% moves it to 3.64–4.44 ppm, and perturbing both adversely gives 3.27–4.89 ppm.
A ±10% range is far too narrow to represent the real uncertainty in b. Organism-specific values are given in Table 2 and Figure 2.
| Organism and source | CT (ppm·min) | b (ppm-1 min-1) | Implied a/b (ppm) | Inside MAHC range? |
| Giardia, CDC remediation value | 45 | 1.535 × 10⁻¹ | 0.13 | No — below minimum |
| Cryptosporidium, CDC remediation value | 9,600 | 7.196 × 10⁻⁴ | 27.8 | No — above maximum |
| C. parvum, Iowa isolate, pH 7.5 | 10,400 | 6.642 × 10⁻⁴ | 30.1 | No — above maximum |
| C. parvum, Maine isolate, pH 7.5 | 15,300 | 4.515 × 10⁻⁴ | 44.3 | No — above maximum |
| Value assumed in this model | 1,382 | 5.000 × 10⁻³ | 4.00 | Yes — but matches no organism |
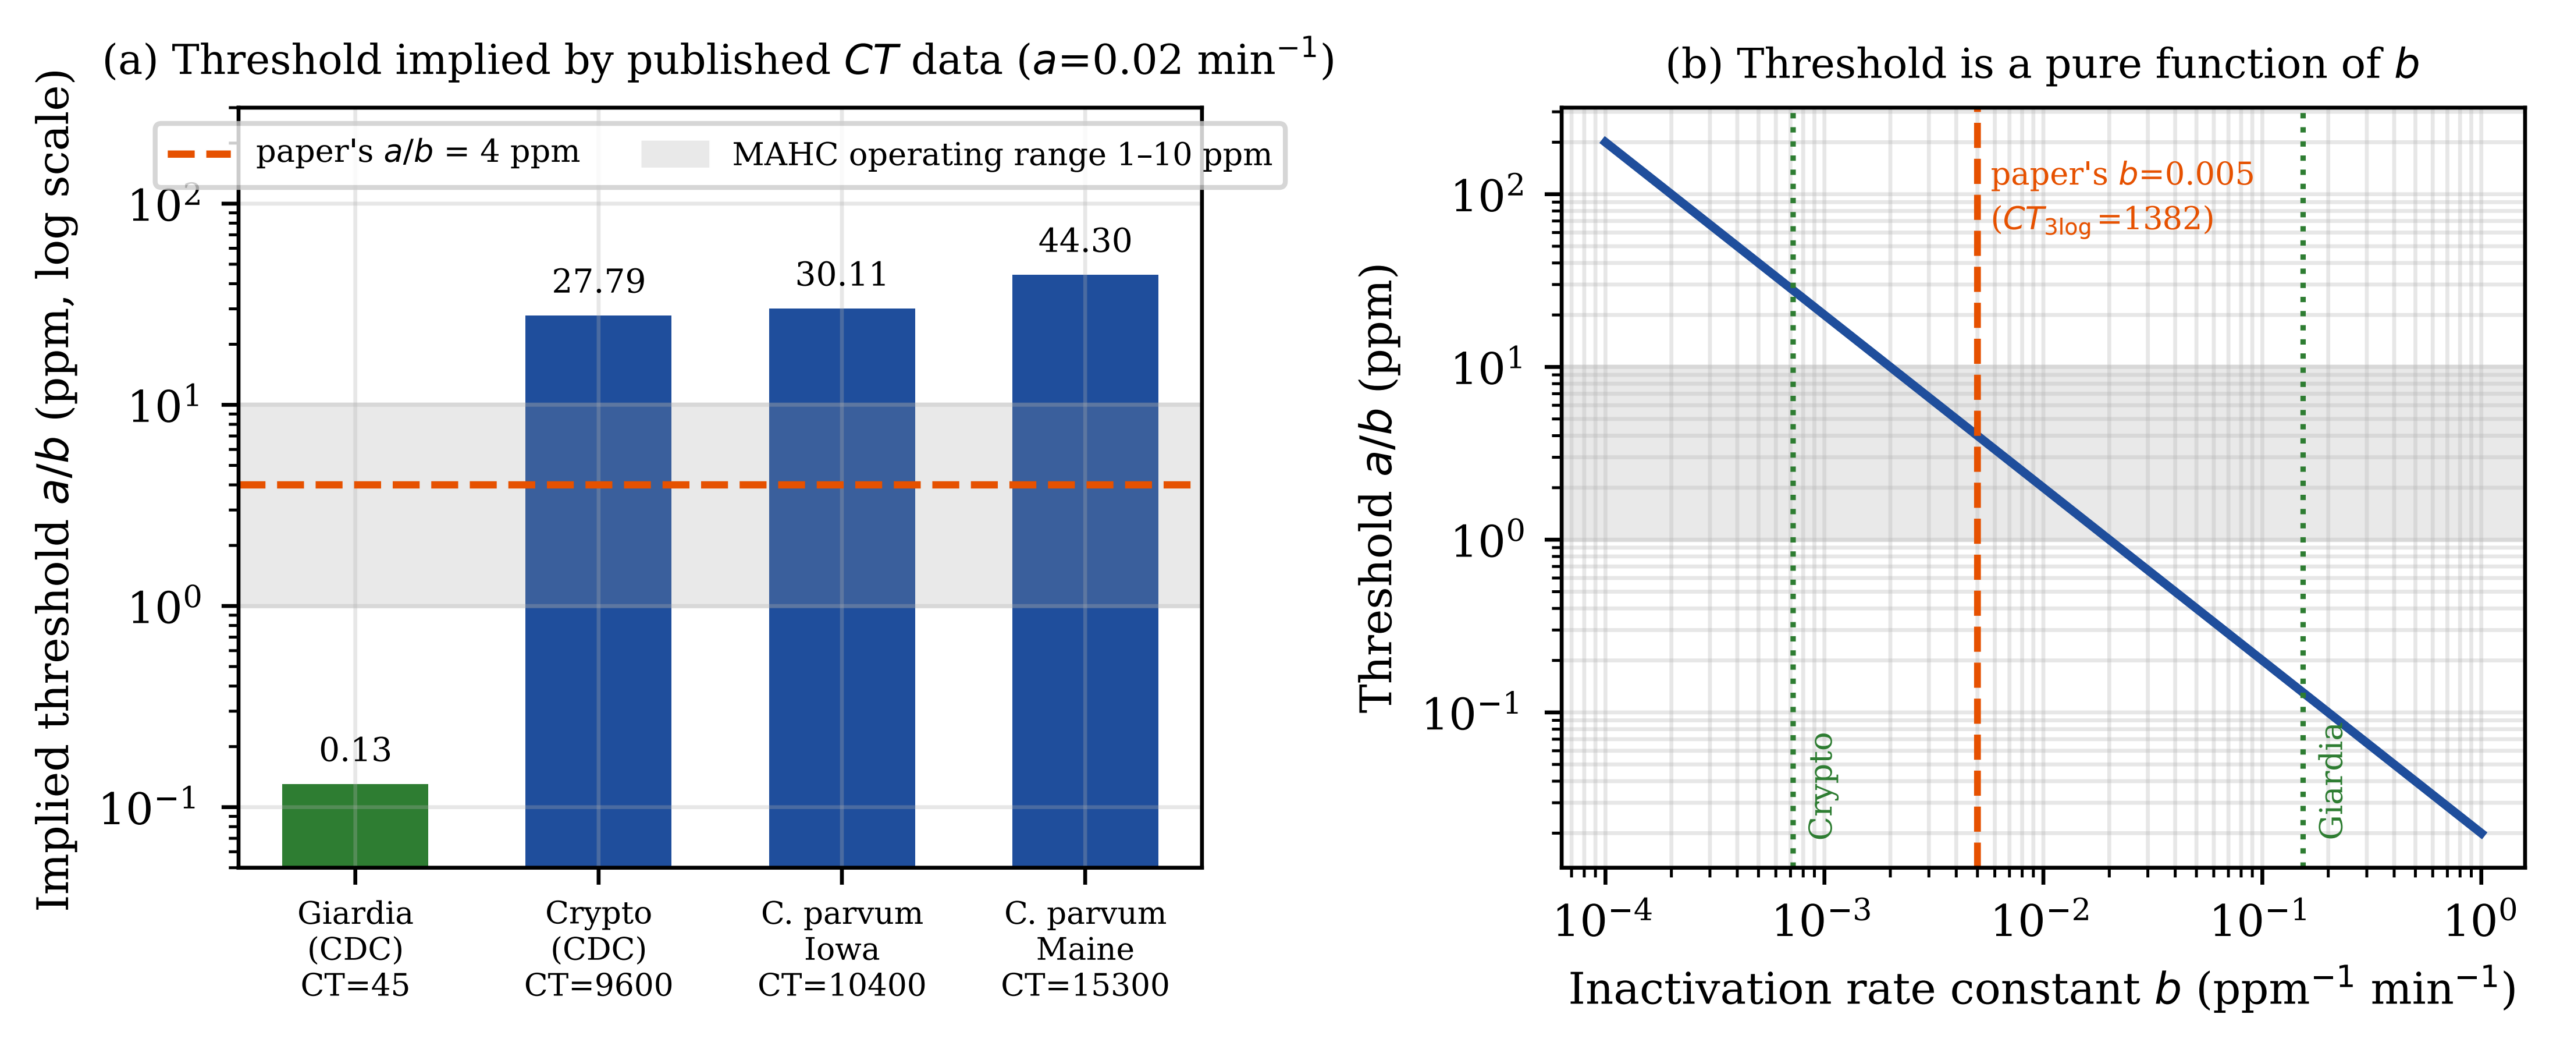
Calibration therefore spreads the threshold over a range of about 340 fold (0.13 ppm for Giardia to 44.3 ppm for the Maine isolate of Cryptosporidium parvum). The lower end of this range is far below the minimum of the MAHC concentrations, and the upper end of the range for Cryptosporidium is several fold above the upper end of the MAHC concentrations for presence of bathers. The value for b of 0.005 ppm-1 min-1 implies a 3-log CT of 1,382 ppm·min. This value corresponds to no organism in the cited literature, and is about an order of magnitude removed from the protozoan thresholds in either direction. For chlorine-tolerant gram-negative bacteria, reported to survive 0.5–1 mg/L for 30 min and in the most resistant organism require 180 min at 5 mg/L for a 2-log reduction9, the value b = 0.005 ppm-1 min-1 implies that these organisms are outside the modeled concentrations as well.
Furthermore, although it is documented that treated recreational water can cause illness in pool users, the largest proportion of which has been attributed to Cryptosporidium2, in fact this protozoan organism does not replicate in pool water. Thus for this organism, the parameter representing growth rate a would be approximately zero and thus the corresponding term in the model would not merely be mis-parameterized but actually inapplicable as structurally incorrect. The model as constructed describes a fast-growing organism suppressed by chlorine, and no such organism has been identified as the dominant cause of the documented outbreaks of illness from treated recreational water in pools and other such facilities2,7.
The Depletion Rate Is Also Uncalibrated
Note that the same calibration of m to measured bather consumption in mg per bather12, i.e., m = 4120/(TV), gives a second indication that the chosen set of parameters was selected to produce a plausible result rather than derived. This is illustrated for the case of T = 60 min for which m = 0.005 ppm bather-1 min-1 corresponds to a consumption in a domestic spa of volume 13.7 m3 as opposed to that in a swimming pool. For the volume of a public bath of 250 m3 to 1,000 m3, m is 6.9 × 10⁻⁵ ppm bather-1 min-1 to 2.8 × 10⁻⁴ ppm bather-1 min-1 or 18 times lower to 73 times lower than the value used in this work (Table 3).
| Pool volume (m³) | Implied m (ppm bather-1 min-1) | Ratio to assumed m | Resulting Ceq (ppm) | Inside MAHC range? |
| 13.7 | 5.00 × 10⁻³ | 1.0 (exact match) | 3.90 | Yes — but this is a spa volume |
| 250 | 2.75 × 10⁻⁴ | 18× smaller | 10.03 | No — above maximum |
| 500 | 1.37 × 10⁻⁴ | 36× smaller | 10.21 | No — above maximum |
| 1,000 | 6.87 × 10⁻⁵ | 73× smaller | 10.30 | No — above maximum |
| 2,000 | 3.43 × 10⁻⁵ | 146× smaller | 10.35 | No — above maximum |
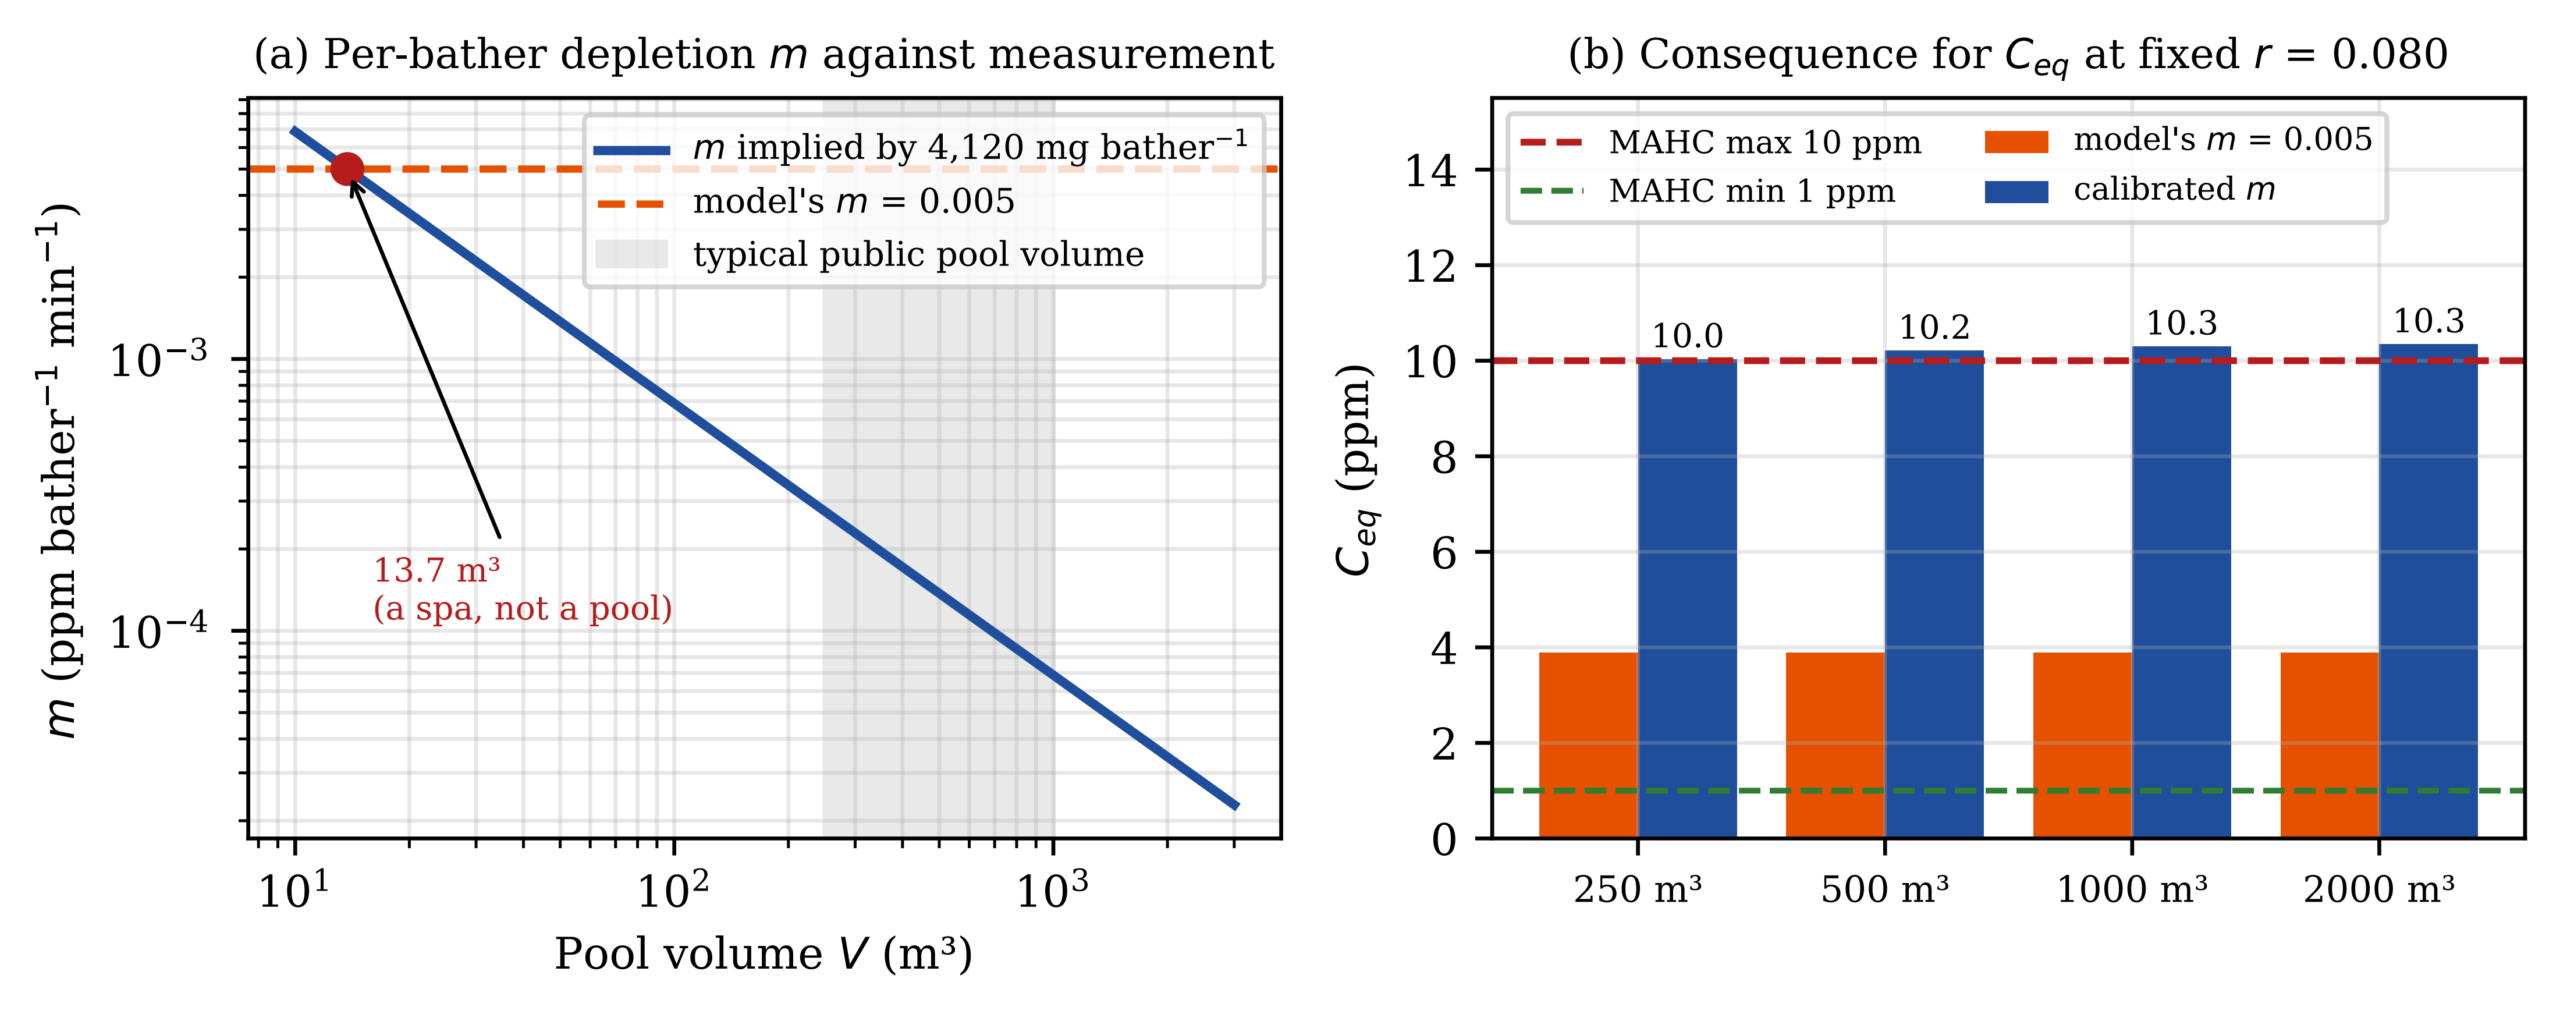
The consequence of this is substantial. If r is held at 0.080 ppm min-1 then Ceq increases to between 10.0 ppm and 10.3 ppm over the range of realistic volumes, thus exceeding the MAHC maximum allowable concentration of 10.0 ppm1. The only way that Ceq can be reduced to 3.90 ppm is by reducing r to 0.031 ppm min-1, a factor of 2.6 below the value currently used. The two uncalibrated parameters offset each other: m was large enough to absorb an r that was correspondingly large, and the product of the two errors provided an equilibrium concentration within the desired band. However, they are not individually supported and their agreement with the band is by chance.
At the calibrated m the elasticity of Ceq with respect to r falls from 2.667 to 1.017, because r − mS is no longer a small difference between comparable quantities. The finding that the dosing rate dominates sensitivity is therefore an artefact of the uncalibrated depletion rate, not a property of pool chlorination.
Sensitivity of the Equilibrium Concentration
For Ceq the elasticities are exact and analytic. Writing Ex for the elasticity of Ceq with respect to a parameter x, Er = r/(r − mS) = 2.667, ES = Em = −mS/(r − mS) = −1.667 and Ek = −1 at the original parameter values. The 26.7% change in Ceq per 10% change in r reported is the elasticity evaluated at a particular operating point. For instance the elasticity falls to 1.5 at r = 0.15 ppm min⁻¹ with the same mS value, and to 1.017 at the calibrated m value. Thus, by expressing sensitivities as elasticities instead of as a change in a percentage value, the degree of change in the other variables is explicitly shown.
| Parameter | Elasticity of Ceq | Ceq at −10% (ppm) | Ceq at +10% (ppm) | E(60) at +10% (ppm·min) |
| r | +2.667 | 2.86 | 4.93 | Increases with Ceq |
| S | −1.667 | 4.54 | 3.25 | Decreases with Ceq |
| m | −1.667 | 4.54 | 3.25 | Decreases with Ceq |
| k | −1.000 | 4.33 | 3.54 | Decreases with Ceq |
| C0 | 0 | 3.90 (no effect) | 3.90 (no effect) | 178.7 (+7.2%) |
| P0 | 0 | 3.90 (no effect) | 3.90 (no effect) | 166.7 (no effect) |
| a | 0 | 3.90 (no effect) | 3.90 (no effect) | 166.7 (no effect) |
| b | 0 | 3.90 (no effect) | 3.90 (no effect) | 166.7 (no effect) |
There are two structural implications. First, S and m are only combined as the product mS and thus bather load and depletion per bather are not separately identifiable from Ceq. Second, r is kept constant, so the model is open-loop. Therefore, by setting S = 0, Ceq = r/k = 10.39 ppm which is above the MAHC maximum1. A properly designed facility would be controlled via an oxidation–reduction potential controller, making r a function of C. The behavior of this model at very low bather loads should not be physically interpreted.
Risk Optimum
Solving the above equation for R(C) numerically, for the given values of α and β, puts the optimum concentration at Copt = 4.274 ppm (with R″(C) > 0 for this minimum as 2α/C3 + 2β > 0). The risk at the optimum concentration found above for this example is improved only marginally over the risk at 4.0 ppm, namely from R(4.00) = 0.2500 to R(4.27) = 0.2415 (a decrease of 3.4%).
The optimum is a function of the weight ratio of the two risk functions. Since this ratio was chosen without any empirical basis the numerical results have to be interpreted as examples for the procedure and not as a suggestion for an optimal concentration. For example, for a weight ratio of α/β = 1 the optimum is Copt = 4.03 ppm, for α/β = 10 it is 4.27 ppm and for α/β = 100 it is 5.60 ppm.
Note that by making the infection term consistent with System 2, i.e. zero for C ≥ a/b, the interior optimum disappears entirely. The risk function on that interval is simply β(C − 4)2 (Figure 1d) and it is minimized exactly at C = 4 with risk R = 0.
Numerical Convergence
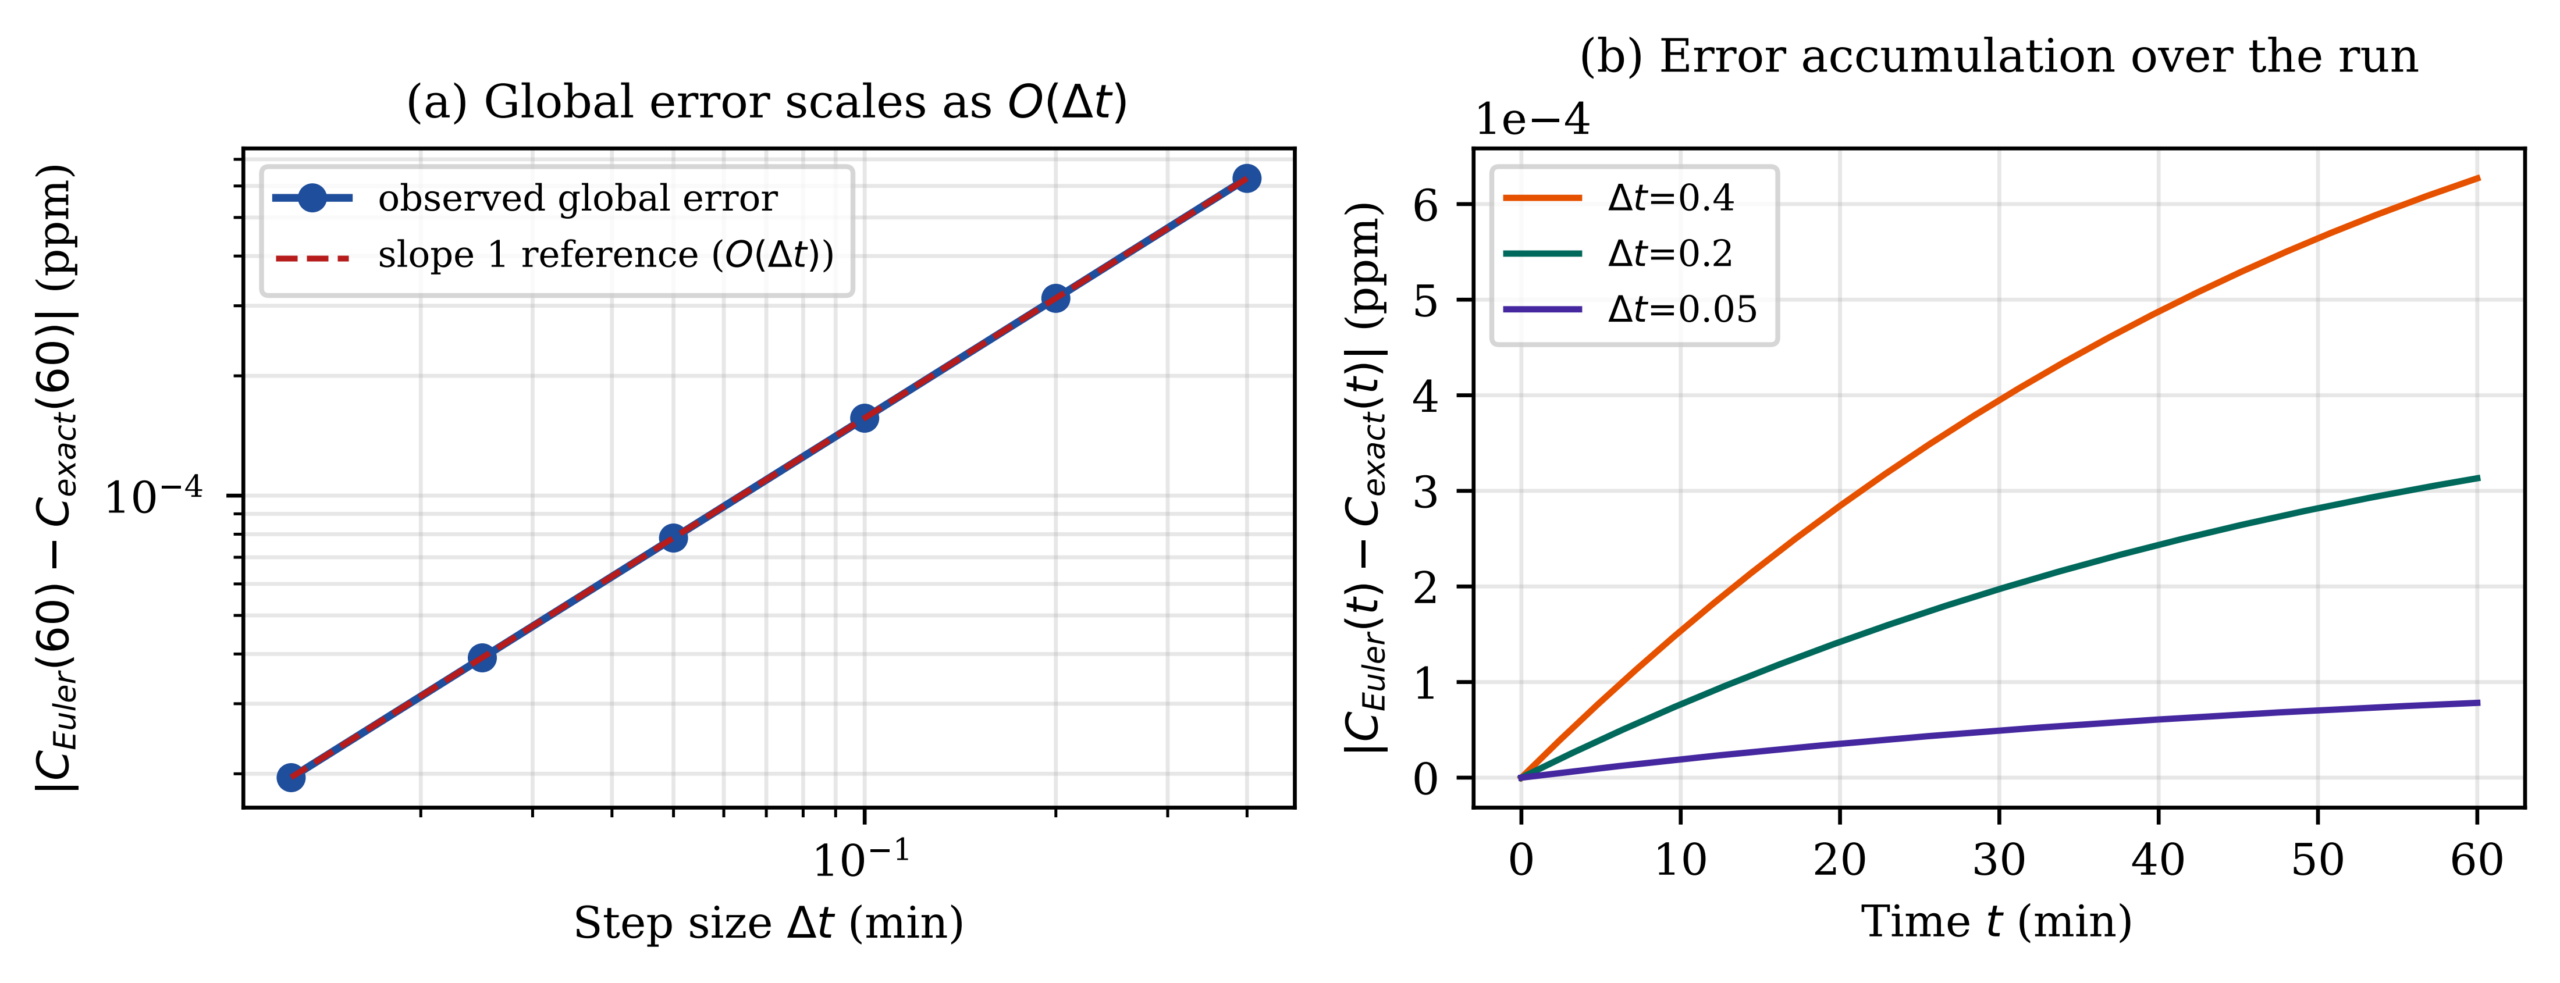
The absolute error of the Euler solution vs. analytical solution C(t) at time t = 60 min is 6.27 × 10⁻⁴ ppm for a time step Δt of 0.4 min, and 3.91 × 10⁻⁵ ppm for a time step Δt of 0.025 min. The successive error ratio is 2.00 throughout, confirming the first-order global convergence of the Euler method. The relative error at the operating step size Δt of 0.2 min is 1.0 × 10⁻²%. The convergence rate and the error accumulation are shown for a single run in Figure 4.
Uncertainty Propagation
The Monte Carlo propagation of these parameters produces a median value for the threshold of 4.00 ppm with interquartile range [3.03 ppm, 5.28 ppm] and 95% interval [1.78 ppm, 9.02 ppm]. The median value for Ceq is 3.81 ppm with a 95% interval of [−0.64 ppm, 10.13 ppm]. Note that the lower bound of this interval is less than zero for a small set of draws where mS is greater than r and the model is no longer physical. Under these assumptions the probability that Ceq exceeds the threshold, so that the pool is predicted to be sterile, is 45.4%. The distributions for the threshold and Ceq are shown in Figure 5.
This interval does not show everything, however. The 95% interval for the threshold mostly falls within the MAHC values. But the interval was created by adding variations to the values of a and b around their means, which were chosen to set the threshold at 4 ppm. The more informative calibrations for the threshold and the equilibrium concentration are found in Tables 2 and 3. They show that both the threshold and the equilibrium concentration are outside the operational range for these calibrations.
Discussion
Restatement of Key Findings
Calibrating b against published CT values puts the threshold anywhere between 0.13 ppm and 44.3 ppm, with no calibrated value inside the MAHC operating range. Calibrating m against a measured consumption rate shows the value used corresponds to a 13.7 m3 spa, and correcting it drives the equilibrium past the maximum allowed disinfectant concentration. The baseline therefore misses the extinction criterion and settles at 2.60 × 10⁴ CFU/mL instead, while the interior risk optimum turns out to be an artifact of the mismatch between the risk function and the pathogen equation.
Implications and Significance
A model of this form can be made to produce just about any threshold within the physically meaningful range by assigning the unobservable input parameters whatever values are needed to get the desired threshold. These values will all appear in the algebra for the threshold, so that the threshold will appear to have been derived from an equilibrium point, even though the necessary input values were assigned arbitrarily. The algebra is correct, but it cannot remove arbitrariness in the parameter values. Agreement between such a threshold and a regulatory figure therefore does not imply that the regulation is dynamically reasonable.
The calibration of m raises a further issue. Two parameters were set wrongly in compensating directions, yet their product placed the equilibrium in the working regime. Anyone checking the output alone would have found it reasonable. Where parameters enter as a difference or a ratio, plausible output is no evidence of correct parameterization; only checking each parameter against independent data reveals the problem. The same check applies to other coupled-ODE models of public health trade-offs: identify the parameters the threshold depends on, determine which can be calibrated externally, and report the range that calibration implies. Here that was possible because the Chick–Watson form gives access to a large body of CT measurements4,9,3, and because pool mass-balance studies supply a comparable target for m12.
This study began from the perception that pools vary in chlorine smell and in how badly they sting the eyes, and the model attributes that irritation to free chlorine through H(C). The literature does not support the attribution. Most pool odour and irritation comes from combined chlorine, particularly trichloramine, formed when free chlorine reacts with nitrogenous material from bathers19 and released into the air above the water, where concentrations rise with active swimmer load20. Trichloramine irritates the eyes and the upper and lower respiratory tract and has been linked to occupational asthma among pool workers21,24,22,23, with exposure depending on ventilation and on sampling method26,25,27,28. Elevated trichloramine signals too little free chlorine for the nitrogen load, not too much. H(C) therefore represents direct free-chlorine irritation only, and the phenomenon that prompted this work lies outside a model with no combined-chlorine state.
Connection to Objectives
The first, third, fourth and fifth objectives were met. All three systems were solved in closed-form, including System 2 using the Bernoulli substitution. Elasticities were determined for all parameters and two parameters were calibrated using published data. The fourth objective was extended to m by analogy with b, and the result proved equally consequential. As for the second objective of analyzing the risk function, its optimum is determined by an internal inconsistency of the model and not by any trade-off between variables as had been intended. That inconsistency is itself informative, so it is reported rather than patched over.
Recommendations
Three practices can be straightforwardly applied to quantitative modeling. First, any threshold expressed as a ratio of rate constants must be fully calibrated against independent data, or the paper must state that no attempt was made to do so. Second, all parameters on which the headline result depends must be analyzed. Third, instead of reporting a percentage change at a single operating point, report elasticity, as the change in Er from 2.667 to 1.017 under calibration demonstrates.
Some possible extensions of the model are: 1) A combined-chlorine state, defined by the bather-derived nitrogen loading, that is used to redefine the term for irritation in order to represent the correct species20,19; 2) A closed-loop dosing rule in which r is a function of C; 3) A chlorine-tolerant pathogen class with a ≈ 0 and small b, for which the threshold for extinction does not apply at the typical levels of chlorine found in pools and recreation areas4,7; 4) Treatment of cyanuric acid, which alters the rate of inactivation of microorganisms substantially5,6. No recommendation can be made for the pool operator based on the present model. The model does not predict any measured quantity and thus is not useful for any operational purpose.
Limitations
First, establishing a threshold from a model requires knowledge of quantities that the model itself does not supply, namely the ratio of the growth rate of the model organism to its inactivation rate constant. Calibration places plausible alternative values outside the model’s operating range in both directions. Second, all outputs from the model were not validated against measured data. Instead the numerical solution of the model equations was compared with the analytical solution of the same equations (Figure 4). Third, the growth rate of the model organism, a, remained uncalibrated, since no published measurements of the growth rates of relevant organisms in pool water under relevant conditions were located. In consequence, the threshold derived here remains as uncertain as the constants on which it depends. Fourth, the model does not contain a chlorine-tolerant pathogen class although such organisms cause the largest number of documented cases of disease, and the organism responsible does not replicate in pool water2,4, so the logistic term does not describe this organism. Fifth, combined chlorine has not been included in the model. Sixth, the model is non-spatial, i.e. it assumes that the water in a pool is homogeneous. However, in reality there are, inevitably, concentration gradients in pools, particularly in the region of inflows and bather clusters. Seventh, the model is open-loop, i.e. it does not contain any feedback mechanisms, and gives rise to concentration values outside the range of meaningful values at low bather loads. Eighth, the model does not include cyanuric acid, which is used as a stabiliser in some pools, so the model is limited to unstabilised swimming pools5,6. Ninth, a single measured consumption value from two pools was used to calibrate m over a single 60-minute session12, so it constrains the order of magnitude rather than the precise value.
The model reports no fatality index. A case fatality ratio computed from outbreak-associated cases cannot be multiplied by a bather count without committing a category error, and the available ratio derives from Legionella-associated deaths2, which the model does not represent.
Nor is 235 CFU per 100 mL used as a comparator. That figure is a Beach Action Value for Escherichia coli in ambient freshwater bathing areas30, while chlorinated pools fall under the MAHC1 and are governed by disinfectant residuals and CT values rather than pathogen densities. The two kinds of standard are not commensurable, which is part of why a model like this one would be needed to relate them, and part of why it fails to.
A model of this form cannot recover the boundaries of a chlorination standard from the dynamics the standard governs. What it can do is say which measurements would be needed before the attempt is worth making.
Acknowledgments
The author thanks Mr. Miller of The Peddie School for guidance throughout this project and Annie Wang for peer review of the mathematical framework. An anonymous reviewer identified the reversed regulatory claim, circularity in the threshold derivation, and several arithmetic errors in this work. The reviewer also suggested engagement with the disinfection kinetics literature, and the corresponding calibration analyses comprise the central content of this work. Generative artificial intelligence tools (Claude, Anthropic) were used for coding assistance in Python. All content was independently verified by the author, all numerical results were regenerated from the analysis code, and all references were verified against the original published sources.
References
- Centers for Disease Control and Prevention. Model aquatic health code, 4th edition. 2023, https://www.cdc.gov/model-aquatic-health-code/media/pdfs/2023-MAHC-508.pdf. [↩] [↩] [↩] [↩] [↩] [↩] [↩]
- M. C. Hlavsa, J. E. Aluko, A. M. Miller, J. Person, E. N. Gerdes, S. Fischer, J. R. Laco, J. L. Kramer, M. J. Beach, V. A. Roberts. Outbreaks associated with treated recreational water — United States, 2015–2019. Morbidity and Mortality Weekly Report. Vol. 70, pg. 733–738, 2021, https://doi.org/10.15585/mmwr.mm7020a1. [↩] [↩] [↩] [↩] [↩]
- J. N. Jensen. Disinfection model based on excess inactivation sites: implications for linear disinfection curves and the Chick-Watson dilution coefficient. Environmental Science and Technology. Vol. 44, pg. 8162–8168, 2010, https://doi.org/10.1021/es101818z. [↩] [↩] [↩] [↩] [↩]
- J. M. Shields, V. R. Hill, M. J. Arrowood, M. J. Beach. Inactivation of Cryptosporidium parvum under chlorinated recreational water conditions. Journal of Water and Health. Vol. 6, pg. 513–520, 2008, https://doi.org/10.2166/wh.2008.068. [↩] [↩] [↩] [↩] [↩]
- J. M. Shields, M. J. Arrowood, V. R. Hill, M. J. Beach. The effect of cyanuric acid on the disinfection rate of Cryptosporidium parvum in 20-ppm free chlorine. Journal of Water and Health. Vol. 7, pg. 109–114, 2009, https://doi.org/10.2166/wh.2008.115. [↩] [↩] [↩]
- J. L. Murphy, M. J. Arrowood, X. Lu, M. C. Hlavsa, M. J. Beach, V. R. Hill. Effect of cyanuric acid on the inactivation of Cryptosporidium parvum under hyperchlorination conditions. Environmental Science and Technology. Vol. 49, pg. 7348–7355, 2015, https://doi.org/10.1021/acs.est.5b00962. [↩] [↩] [↩]
- U. Ryan, S. Lawler, S. Reid. Limiting swimming pool outbreaks of cryptosporidiosis — the roles of regulations, staff, patrons and research. Journal of Water and Health. Vol. 15, pg. 1–16, 2017, https://doi.org/10.2166/wh.2016.160. [↩] [↩] [↩] [↩]
- B. T. Croll, C. R. Hayes, S. Moss. Simulated Cryptosporidium removal under swimming pool filtration conditions. Water and Environment Journal. Vol. 21, pg. 149–156, 2007, https://doi.org/10.1111/j.1747-6593.2006.00058.x. [↩]
- P. K. Roy, M. Ghosh. Inactivation kinetics of gram-negative bacteria in the presence of residual free chlorine. Desalination and Water Treatment. Vol. 210, pg. 222–230, 2021, https://doi.org/10.5004/dwt.2021.26552. [↩] [↩] [↩] [↩]
- A. Assaidi, M. Ellouali, H. Latrache, H. Zahir, A. Karoumi, E. M. Mliji. Chlorine disinfection against Legionella pneumophila biofilms. Journal of Water, Sanitation and Hygiene for Development. Vol. 10, pg. 885–893, 2020, https://doi.org/10.2166/washdev.2020.151. [↩]
- D. Vukić Lušić, V. Piškur, A. Cenov, D. Tomić Linšak, D. Broznić, M. Glad, Ž. Linšak. Surveillance of Legionella pneumophila: detection in public swimming pool environment. Microorganisms. Vol. 10, pg. 2429, 2022, https://doi.org/10.3390/microorganisms10122429. [↩]
- A. P. Berg, T. A. Fang, H. L. Tang. Variability of residual chlorine in swimming pool water and determination of chlorine consumption for maintaining hygienic safety of bathers with a simple mass balance model. Journal of Water and Health. Vol. 17, pg. 227–236, 2019, https://doi.org/10.2166/wh.2018.217. [↩] [↩] [↩] [↩] [↩] [↩]
- M. Maréchal, O. Correc, C. Demelas, A. Couzinet, N. Cimetière, L. Vassalo, F. Gérardin, J.-L. Boudenne. Characterization and chlorine reactivity of particulate matter released by bathers in indoor swimming pools. Chemosphere. Vol. 313, pg. 137589, 2023, https://doi.org/10.1016/j.chemosphere.2022.137589. [↩] [↩]
- M. Jia, X. Chen, B. Liu, K. Hur, S. Dong. Persistence kinetics of a novel disinfectant peracetic acid for swimming pool disinfection. Journal of Hazardous Materials. Vol. 457, pg. 131792, 2023, https://doi.org/10.1016/j.jhazmat.2023.131792. [↩] [↩]
- L. T. Lee, E. R. Blatchley. Long-term monitoring of water and air quality at an indoor pool facility during modifications of water treatment. Water. Vol. 14, pg. 335, 2022, https://doi.org/10.3390/w14030335. [↩]
- L. M. Suppes, R. A. Canales, C. P. Gerba, K. A. Reynolds. Cryptosporidium risk from swimming pool exposures. International Journal of Hygiene and Environmental Health. Vol. 219, pg. 915–919, 2016, https://doi.org/10.1016/j.ijheh.2016.07.001. [↩] [↩] [↩]
- F. M. Schets, J. F. Schijven, A. M. de Roda Husman. Exposure assessment for swimmers in bathing waters and swimming pools. Water Research. Vol. 45, pg. 2392–2400, 2011, https://doi.org/10.1016/j.watres.2011.01.025. [↩] [↩] [↩]
- D. C. Shoults, Q. Li, S. Petterson, S. P. Rudko, L. Dlusskaya, M. Leifels, C. Scott, C. Schlosser, N. J. Ashbolt. Pathogen performance testing of a natural swimming pool using a cocktail of microbiological surrogates and QMRA-derived management goals. Journal of Water and Health. Vol. 19, pg. 629–641, 2021, https://doi.org/10.2166/wh.2021.015. [↩]
- J. Li, E. R. Blatchley. Volatile disinfection byproduct formation resulting from chlorination of organic-nitrogen precursors in swimming pools. Environmental Science and Technology. Vol. 41, pg. 6732–6739, 2007, https://doi.org/10.1021/es070871+. [↩] [↩] [↩]
- T. Wu, T. Földes, L. T. Lee, D. N. Wagner, J. Jiang, A. Tasoglou, B. E. Boor, E. R. Blatchley. Real-time measurements of gas-phase trichloramine (NCl3) in an indoor aquatic center. Environmental Science and Technology. Vol. 55, pg. 8097–8107, 2021, https://doi.org/10.1021/acs.est.0c07413. [↩] [↩] [↩]
- J. H. Jacobs, S. Spaan, G. B. G. J. van Rooy, C. Meliefste, V. A. C. Zaat, J. M. Rooyackers, D. Heederik. Exposure to trichloramine and respiratory symptoms in indoor swimming pool workers. European Respiratory Journal. Vol. 29, pg. 690–698, 2007, https://doi.org/10.1183/09031936.00024706. [↩] [↩]
- J. Westerlund, L. Phil, I.-L. Bryngelsson, L. Fornander, H. Löfstedt, P. Graff. Occupational exposure to trichloramine and endotoxins: adverse health effects among personnel in adventure and rehabilitation swimming pool facilities. Journal of Occupational and Environmental Medicine. Vol. 64, pg. 361–369, 2022, https://doi.org/10.1097/JOM.0000000000002483. [↩] [↩]
- G. Fantuzzi, E. Righi, G. Predieri, P. Giacobazzi, K. Mastroianni, G. Aggazzotti. Prevalence of ocular, respiratory and cutaneous symptoms in indoor swimming pool workers and exposure to disinfection by-products. International Journal of Environmental Research and Public Health. Vol. 7, pg. 1379–1391, 2010, https://doi.org/10.3390/ijerph7041379. [↩] [↩]
- K. M. Thickett, J. S. McCoach, J. M. Gerber, S. Sadhra, P. S. Burge. Occupational asthma caused by chloramines in indoor swimming-pool air. European Respiratory Journal. Vol. 19, pg. 827–832, 2002, https://doi.org/10.1183/09031936.02.00232802. [↩] [↩]
- E. Ahmadpour, S. Hallé, I. Valois, P. E. Ryan, S. Haddad, M. Rodriguez, B. El Aroussi, S. Simard, I. Delpla, F. Proulx, R. Tardif, M. Debia. Temporal and spatial variations in the levels of prominent airborne disinfection by-products at four indoor swimming pools. Journal of Occupational and Environmental Hygiene. Vol. 19, pg. 185–196, 2022, https://doi.org/10.1080/15459624.2022.2035741. [↩] [↩]
- E. Ahmadpour, S. Hallé, I. Valois, P. E. Ryan, S. Haddad, M. Rodriguez, R. Tardif, M. Debia. Comparison of sampling collection strategies for assessing airborne trichloramine levels in indoor swimming pools. Environmental Science and Pollution Research. Vol. 30, pg. 36012–36022, 2023, https://doi.org/10.1007/s11356-022-24790-z. [↩] [↩]
- H. Proulx, S. Hallé. A numerical study of the impacts of outdoor air intake and air changes per hour on the trichloramine concentrations in a swimming pool enclosure. Frontiers in Built Environment. Vol. 8, pg. 957973, 2022, https://doi.org/10.3389/fbuil.2022.957973. [↩] [↩]
- B. Lévesque, L. Vézina, D. Gauvin, P. Leroux. Investigation of air quality problems in an indoor swimming pool: a case study. Annals of Occupational Hygiene. Vol. 59, pg. 1085–1089, 2015, https://doi.org/10.1093/annhyg/mev038. [↩] [↩]
- J. Li, J. Chen, Z. Hu, X. Li, M. Li, Y. Wang, Z. Zhang, X. Liang. Overlooked inorganic DBPs in trichloroisocyanuric acid (TCCA) disinfected indoor swimming pool: evidences from concentration, cytotoxicity, and human health risk. Chemosphere. Vol. 335, pg. 139061, 2023, https://doi.org/10.1016/j.chemosphere.2023.139061. [↩]
- United States Environmental Protection Agency. Recreational water quality criteria. EPA-820-F-12-058, 2012, https://www.epa.gov/wqc/recreational-water-quality-criteria. [↩]