
Abstract
Alzheimer’s disease is a progressive neurodegenerative disorder that remains the leading cause of dementia and currently has no cure. Early detection is imperative to slow the disease’s onset, which remains challenging without widely accessible screening technologies. Machine learning offers a promising approach to classifying Alzheimer’s disease using patterns in cognitive, functional, behavioral, medical, and lifestyle-related data collected through non-invasive health evaluations. Interpretable machine learning models were used to identify Alzheimer’s disease from the non-invasive health data collected from 2,149 patients. Four different models – Logistic Regression, K-Nearest Neighbors, Decision Trees and Random Forest – were built and tested. The Random Forest model achieved the highest accuracy (95.58%) and precision (95.86%), outperforming other models. Additionally, SHapley Additive Explanations (SHAP), an algorithm that illustrates how each input feature impacts a prediction in a model, found memory complaints, behavioral problems, Activities of Daily Living (ADL) scores, and Mini-Mental State Examination (MMSE) scores as key features. These feature patterns were consistent with clinical expectations and supported the interpretability of the model. The results illustrate the potential of applying explainable artificial intelligence to Alzheimer’s disease classification using accessible health evaluation data. However, because the dataset contains only binary diagnostic labels and does not include disease stage, these findings should be interpreted as classification results rather than proof of early-stage detection. This work may support future research toward more accessible Alzheimer’s disease classification methods, but additional validation on independent clinical datasets is necessary before claims can be made about real-world screening use, reliability, or cost-effectiveness.
Introduction
Alzheimer’s Disease — a degenerative neurological disorder causing loss of memory, ability to perform cognitive functions, and independent function — has affected over 55 million people globally1. This condition is the leading cause of dementia and is primarily identified through the formation of amyloid beta-plaque and tau protein deposits within the brain cells and subsequent death of neurons throughout the brain2,3.
Despite decades of research, Alzheimer’s disease continues to present significant challenges to medical professionals. It continues to present significant challenges to medical professionals. A primary reason for this challenge is the lack of noticeable symptoms during the early stages of the disease and the absence of an effective cure. Currently, available diagnostic tools include MRI/PET scanning technology to demonstrate abnormality in brain tissue and structure; however, these technologies require a substantial amount of resources and access is limited compared to non-invasive assessments. Because imaging-based diagnostic methods can be resource-intensive, researchers have investigated accessible factors such as diet, physical activity, self-reported cognitive concerns, clinical health status, behavior, and medical history as potential indicators of Alzheimer’s disease risk4.
The objective of this study is to investigate the differences between various Machine Learning (ML) models used for classifying binary Alzheimer’s disease diagnosis labels and to determine which features most affect model predictions. To accomplish these objectives, numerical data representing cognitive evaluations, medical histories, lifestyle options, and behaviors from 2,149 patients was analyzed5. Four machine learning models – Logistic Regression, K-Nearest Neighbor (KNN), Decision Trees, and Random Forest – were trained and evaluated based on the accuracy, precision, and recall metrics6,7. SHapley Additive Explanations (SHAP) were used to determine how individual features pushed model predictions toward positive or negative diagnosis labels, improving model interpretability8,9,10.
It was hypothesized that Random Forest will produce the greatest level of accuracy among all four ML models. Because Random Forest combines predictions across multiple decision trees, it was expected to generalize better than the other tested models. Furthermore, it was hypothesized that clinical assessment parameters, parameters assessing patients’ daily functioning capabilities and memory complaints, will be the most influential features contributing to the model’s final predictions of Alzheimer’s disease. By focusing on variables that can be obtained through non-invasive methods, this research aims to evaluate whether explainable machine learning can reliably classify Alzheimer’s disease labels11,8.
Literature Review
Prior literature demonstrates that Alzheimer’s disease classification may be improved through a combination of cognitive, functional, behavioral, medical, and demographic factors rather than the reliance solely upon any single category of factors. The Mini-Mental State Examination (MMSE), which assesses important aspects of memory, orientation, attention, and language functions, is frequently utilized in the screening for dementia due to its ease of administration and ability to effectively summarize relevant cognitive characteristics12. However, the MMSE score does not account for declines in functional capacity, behavioral manifestations, or impairments in performing activities of daily living that are also clinically significant in the context of Alzheimer’s disease1. Patient reported subjective memory complaints have been found to be associated with an elevated risk of dementia, indicating that the utilization of patient-reported cognitive concerns in conjunction with standardized cognitive testing may provide valuable information in the development of Alzheimer’s disease classification models13.
Previous studies have also demonstrated that machine learning techniques such as support vector machine algorithms, decision tree-based models, ensemble-based models, and deep learning architectures could be used to extract patterns in clinical and cognitive features associated with Alzheimer’s11,10. In particular, Wang et al. demonstrated that non-image based features such as cognitive and clinical variables could support the identification of individuals at risk for dementia10. Similarly, Alatrany et al. employed explainable machine learning techniques to identify important predictive features within clinical and cognitive data sets to inform Alzheimer’s disease classification11.
Recent studies have also highlighted the benefits of incorporating multimodal data into Alzheimer’s disease classification. Specifically, Golovanevsky et al. developed a multimodal attention-based deep learning architecture and demonstrated that it can enhance the model’s performance in the detection of Alzheimer’s disease4. In similar fashion, Qiu et al. developed a multimodal deep learning framework for assessing dementia risk in individuals with Alzheimer’s disease using routinely collected clinical information, neuropsychological testing, neuroimaging and functional assessments14. Xue et al., built upon previous research by developing an AI-based system to perform differential diagnosis among various dementia etiologies using multimodal data15. A key drawback of these studies, however, is that most multimodal models rely heavily on image or biomarker-based data, which is not readily available in many clinical environments.
More recently, researchers have sought to develop imaging-based or biomarker-based machine learning approaches. For example, AlMansoori et al. demonstrated that blood biomarkers and clinical features could be combined to predict early-stage Alzheimer’s disease16. Similar findings were identified by Jiang et al. who developed machine learning models to diagnose Alzheimer’s disease using brain cortical complexity and related variables17. Kang et al. employed interpretable machine learning techniques along with imaging biomarkers for diagnosing Alzheimer’s disease18. Additionally, recent studies have examined amyloid-related prediction and comorbidity-based Alzheimer’s disease classification. All these show how machine learning can be applied to diverse sets of biological, imaging-derived, and medical history variables under various diagnostic contexts19,20.
Another body of research involves distinguishing Alzheimer’s disease from mild cognitive impairment. This distinction is critical since mild cognitive impairment can represent a transitional stage between normal age-related cognitive changes and dementia. Tascedda et al. employed advanced artificial intelligence methodologies to classify Alzheimer’s disease and mild cognitive impairment21. Vlontzou et al. developed an interpretable machine learning methodology for mild cognitive impairment and Alzheimer’s disease diagnoses, illustrating that interpretable models can elucidate meaningful patterns while preserving predictive accuracy22.
In Alzheimer’s disease research, explainability and SHAP values allow for the confirmation that models are based on clinically meaningful criteria, such as cognitive impairment, functional decline, and memory complaints, and are not driven by criteria that are difficult to justify from a clinical standpoint8,9. Using explainable artificial intelligence methods along with deep transfer learning, Mahmud et al. improved interpretability in Alzheimer’s disease diagnosis23. Building on this foundation, Govindarajan et al. utilized explainable machine learning to develop a model for predicting Alzheimer’s disease via clinical and behavioral features24. More recently, there have been several studies utilizing explainable artificial intelligence for the purposes of classifying Alzheimer’s disease, including a study assessing the reliability of XAI markers and multimodal prediction approaches25,26,27.
However, there still exist many limitations within the current body of literature. While there are many high performing Alzheimer’s disease classification models currently being developed, they utilize imaging, genetic, blood biomarker, and/or multimodal data sets that may not be readily available to clinicians14,16,17,15. Other studies use advanced deep learning methods that may achieve strong performance but can be difficult to interpret without additional explanation tools4,23. Additionally, while many studies have employed advanced deep learning techniques to obtain strong results, they can oftentimes be difficult to understand without additional explanation tools4,23. Due to the nature of Alzheimer’s disease classification studies, it is essential to consider metrics beyond just accuracy such as recall, precision-recall performance, threshold behavior, validation strategy, and subgroup performance28,10,22.
This study extends prior research in this domain by comparing Logistic Regression, K-Nearest Neighbors, Decision Tree, and Random Forest models using a Kaggle Alzheimer’s disease dataset that includes cognitive function, functionality, behaviors, medical history, demographics, and lifestyle information5. Through comparisons of model performance as well as evaluations of threshold behavior and cross-validation stability; as well as through assessments using SHAP of the degree to which each variable contributed to model predictions; this study seeks to contribute to the larger literature of using interpretable machine learning for Alzheimer’s disease classification.
Methods
The dataset used in this study was obtained from Kaggle and contains 2,149 individual patient records with variables related to cognitive function, functional ability, demographics, lifestyle habits, behavioral symptoms, and medical history. Each row represents one patient, and the target variable is a binary diagnosis column, where 1 indicates an Alzheimer’s disease diagnosis and 0 indicates a healthy control label. Of the patients represented in the data base, 34.5% have been identified as having Alzheimer’s Disease while 65.5% have been classified as healthy controls. The distributions of the classes, and the correlations among all features are presented in Figures 1A and 1B. The dataset does not include metadata about the country of origin, clinical setting, recruitment procedures, diagnostic criteria, or clinician assessment processes. Therefore, the diagnosis labels were accepted as provided and are not independently verifiable in this study5.
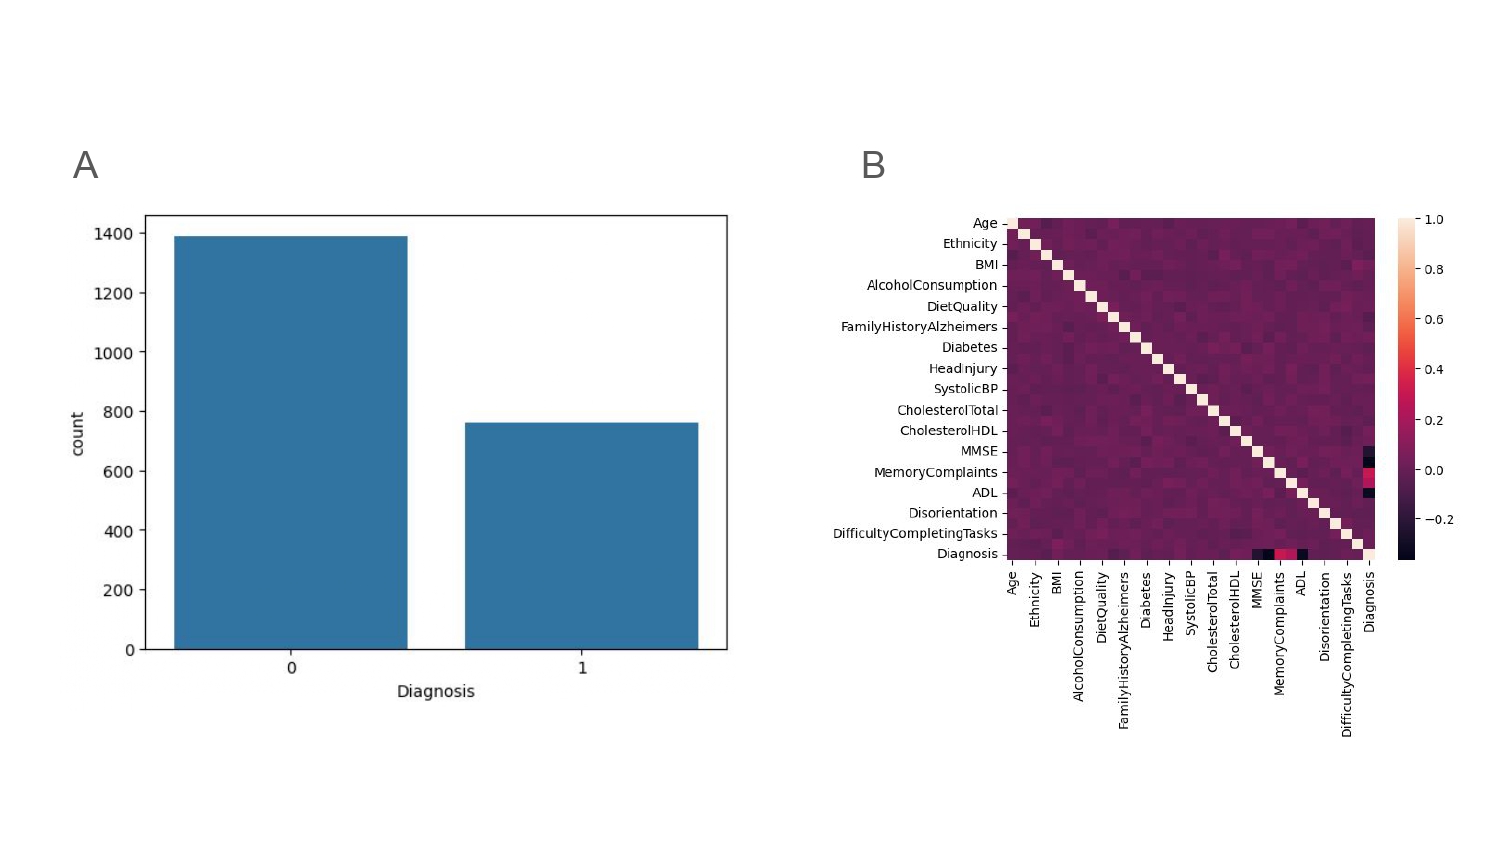
Prior to modeling, the non-predictive ID columns Patient ID and Doctor In Charge were removed. The Diagnosis variable was then separated into the target variable, while the remaining non-id columns were applied as input features for each of the models developed. A summary table is included in Appendix 1 that summarizes the characteristics of each variable group including their encoding, observed ranges, and their role in this study.
| Variable Group | Variables Included | Encoding / Observed Range | Role in Study |
| Demographic variables | Age, Gender, Ethnicity, EducationLevel | Age: 60–90; Gender: 0/1; Ethnicity and EducationLevel: categorical integer encoded as 0–3 | Input features |
| General health variable | BMI | 15.01–39.99 | Input feature |
| Lifestyle variables | Smoking, AlcoholConsumption, PhysicalActivity, DietQuality, SleepQuality | Smoking: 0/1; AlcoholConsumption: 0.002–19.99; PhysicalActivity: 0.004–9.99; DietQuality: 0.009–10.00; SleepQuality: 4.00–10.00 | Input features |
| Medical history variables | FamilyHistoryAlzheimers, CardiovascularDisease, Diabetes, Depression, HeadInjury, Hypertension | Binary encoded as 0/1 | Input features |
| Blood pressure variables | SystolicBP, DiastolicBP | SystolicBP: 90–179; DiastolicBP: 60–119 | Input features |
| Cholesterol variables | CholesterolTotal, CholesterolLDL, CholesterolHDL, CholesterolTriglycerides | Total: 150.09–299.99; LDL: 50.23–199.97; HDL: 20.00–99.98; Triglycerides: 50.41–399.94 | Input features |
| Cognitive assessment variable | MMSE | 0.005–29.99 | Input feature |
| Functional assessment variables | FunctionalAssessment, ADL | FunctionalAssessment: 0.0005–10.00; ADL: 0.001–10.00 | Input features |
| Cognitive and behavioral symptom variables | MemoryComplaints, BehavioralProblems, Confusion, Disorientation, PersonalityChanges, DifficultyCompletingTasks, Forgetfulness | Binary encoded as 0/1 | Input features |
| Target variable | Diagnosis | Binary encoded as 0/1 | Target variable |
The dataset had no missing values, so no imputation was performed. Binary variables, such as gender, and those that are categorized but have multiple levels (integer coded categorical), like race/ethnicity and educational attainment, were treated numerically. Continuous variables were left in their original numeric state. Outliers were not removed because there was no evidence that extreme values were a result of error.
An 80/20 stratified split with a random seed of 21 was used to split the data into training and testing sets. Stratification ensured that the classes were not imbalanced after splitting, and the random seed ensured replicability. All models were trained on the same preprocessed training data, evaluated using the same evaluation metrics, and underwent hyperparameter tuning within each model’s respective range.
The analysis was conducted in Google Colab using Python 3.12.13, pandas 2.2.2, NumPy 2.0.2, scikit-learn 1.6.1, matplotlib 3.10.0, and SHAP 0.51.0. All four classifiers were implemented using scikit-learn, and SHAP values were generated for the final random forest model.
To assess whether model performance was stable beyond a single train/test split, a five fold stratified cross-validation analysis was conducted. The same 32 input features were used and the best hyperparameter combinations as identified in the original model comparison pipeline. Stratified folds were used to keep the ratio of Alzheimer’s positive and healthy controls constant throughout the cross-validation process. Accuracy, precision, and recall were reported as mean ± standard deviation across the five folds. Cross-validation was run as an additional measure of model robustness rather than as a direct substitute for the original held-out test-set results.
Given the size of the dataset, hyperparameter ranges were selected to compare simple, interpretable model settings while avoiding overly complex models. Logistic Regression max_iter values from 25 to 500, KNN odd neighbor values from 3 to 101, Decision Tree depths from 1 to 21, and Random Forest depths from 2 to 16 with 10 to 200 estimators were tested. Since this is primarily an exploratory model comparison study, the same train-test pipeline was used to identify hyperparameters rather than a separate validation set or nested cross-validation. Thus, test-set results presented here should be viewed as estimates of internal performance rather than completely independent measures of validation.
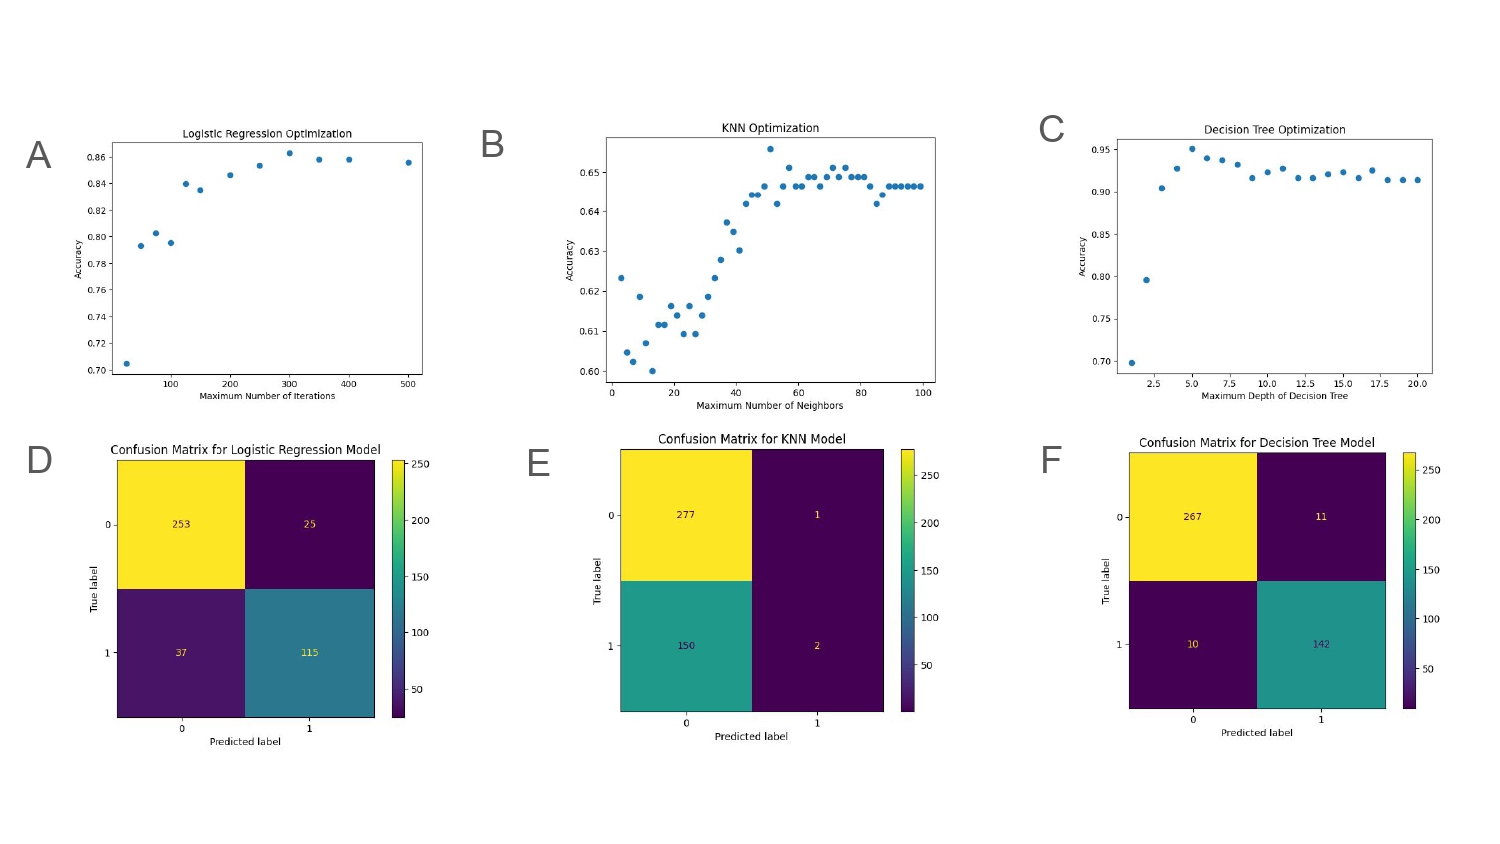
Logistic Regression is a linear classification algorithm that calculates probability scores by applying a sigmoid function to a weighted sum of input features. The model iteratively updates its coefficients in order to minimize the binary cross entropy loss7. The maximum number of iterations (max_iter) was optimized from a range of 25 to 500 and it was found that the parameter of 250 iterations yielded the best accuracy. Due to the fact that the best value was below the upper boundary of the tested range, the iteration limit was not increased beyond the limit. Refer to Figure 2A for a schematic of the logistic regression model.
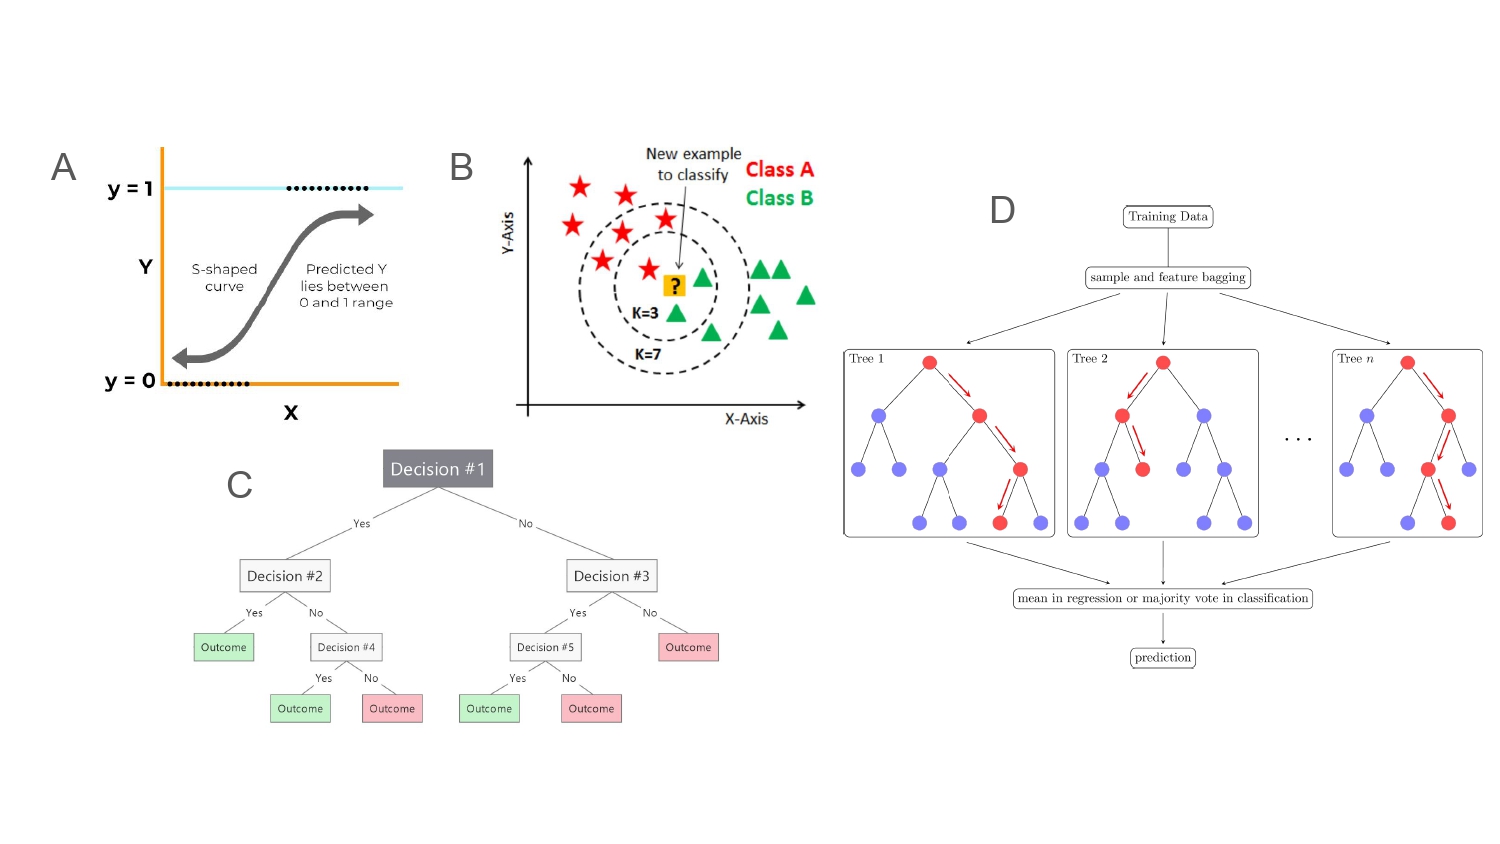
K-Nearest Neighbors (KNN) is a non-parametric, instance-based machine learning model. An instance-based model does not build a fixed equation for use in predicting new data points. Instead, it calculates how similar the new data point is to other previously labeled data points in the training set and then assigns it the label of the most similarly related data points6. KNN models are sensitive to feature scaling because variables with large numerical scales can dominate the calculation of similarity between the data points. Additionally, KNN models can suffer from the “curse of dimensionality,” meaning that as the number of features increases, distance-based comparisons can become less reliable. The number of neighbors (n_neighbors) for K-Nearest Neighbors was varied from 3 to 101. Of the values tested for n_neighbors, 55 produced the greatest accuracy. However, this accuracy-based selection did not produce a clinically useful balance between identifying Alzheimer’s-positive and healthy cases. Because KNN models label a subject according to the majority vote among their nearest neighbors, having a higher number of neighbors can help to create a smoother representation of class boundaries and increase the likelihood of classifying a test sample as belonging to the majority class in the training set. Refer to Figure 2B for a schematic of the KNN model.
Decision Trees classify data by recursively splitting a dataset along feature thresholds that optimize information gain at each node. Once a feature threshold and split point are chosen, the resulting child nodes are further partitioned based on this process until either a pre-specified maximum depth is achieved or another predefined stopping criterion is met6. For the Decision Tree classifier, the maximum tree depth (max_depth) was optimized from a range of 1 to 21. The max_depth parameter that resulted in the best accuracy was 6. Since the upper bound of the range was 21 and 6 is within the tested range, additional splits did not add additional predictive accuracy. Refer to Figure 2C for a schematic of the decision tree model.
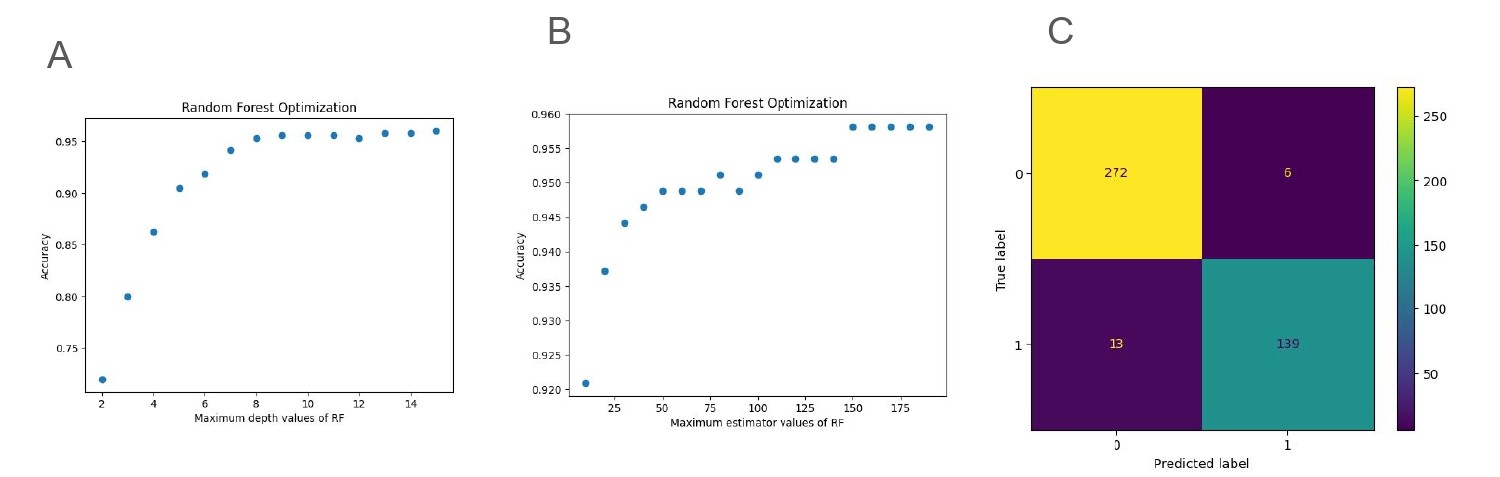
Random Forest is an ensemble method consisting of multiple decision trees trained on bootstrap samples of data. Each decision tree is additionally randomized through the process of feature bagging. Feature bagging involves randomly sampling a subset of features at each split6. The final model prediction is determined by majority voting among all trees. Random Forest improves generalization, reduces variance, and provides intrinsic feature importance scores, making it well‑suited for medical datasets with mixed types of features11. For Random Forest, two parameters were tuned: maximum depth (max_depth) optimized from a range of 2 to 16 and number of estimators (n_estimators) optimized from a range of 10 to 200. The best parameters for maximizing accuracy were found to be 150 trees and a maximum depth of 13, while limiting model complexity. These values were within the tested ranges rather than at the lowest or highest tested settings, suggesting that model performance did not simply improve by increasing complexity to the boundary of the search space. Refer to Figure 2D for a schematic of the random forest model.
Model performance was evaluated using several metrics including accuracy, precision, recall, confusion matrices, ROC-AUC, and precision-recall AUC. Accuracy is defined as the ratio of correctly predicted instances to total number of instances across all classes. Precision reflects the ratio of true positives to total number of positive predictions, indicating the model’s ability to minimize false positives. Recall, or sensitivity, defines the ratio of correct positive identifications to total number of actual positive cases which represents the model’s ability to minimize false negatives. Confusion matrices were generated for each model to illustrate the breakdowns between true and false positives classifications across both classes. ROC-AUC was calculated for each model to compare their ability to differentiate Alzheimer’s-positive and healthy controls across various classification thresholds. Precision-recall AUC was also calculated because it provides supplementary insight regarding model performance when class distribution impacts interpretation.
A baseline Random Forest model was trained on only MMSE and Functional Assessment score data to determine whether a simpler clinical model could provide equivalent predictive capability as a full Random Forest model using all available data. These two variables were chosen because they represented cognitive and functional status and had the highest SHAP scores. The baseline model utilized the same 80/20 stratified train-test split and the same Random Forest hyperparameters as the full model, allowing performance to be compared directly.
To convert predicted probabilities from the binary classification to class labels a default threshold of 0.50 was used. A key consideration in setting this threshold is that it will influence the trade-off between Precision and Recall. Therefore, an additional threshold analysis was also performed on the Random Forest Model to assess how accuracy, precision, and recall values would change at thresholds of 0.30, 0.40, 0.50, 0.60 and 0.70.
To evaluate whether model performance differed across demographic subgroups, a subgroup analysis was conducted on the final Random Forest model utilizing the held-out test data. Performance was evaluated through accuracy, precision, and recall for each gender and age group. The gender attribute in the dataset was encoded such that “Male” is represented by 0 and “Female” is represented by 1. The age attribute was grouped into three categories; 60-69, 70-79, and 80-90.
To increase model transparency to aid in clinical interpretation, SHAP (SHapley Additive Explanations) was applied. SHAP utilizes cooperative game theory to generate a contribution score for each variable to the individual predictions by taking the average marginal contribution for each attribute over all possible combinations of features8. Both global and local interpretations are provided through SHAP: global feature importance was visualized via beeswarm plots and local prediction breakdowns were visualized using waterfall plots8,9. These visualization tools enable clinicians to understand how cognitive scores, medical history and behavioral factors contribute to the model’s predictions18. This is important in the context of the model’s clinical relevance and ethical applicability.
Results
| Model | Parameter Optimized | Best Value | Accuracy | Precision | Recall |
| Logistic | Number of iterations | 250 | 85.58% | 81.69% | 76.32% |
| KNN | Number of neighbors | 55 | 62.33% | 66.67% | 1.32% |
| Decision Tree | Maximum Depth Value | 6 | 90.70% | 92.81% | 93.42% |
| Random Forest | Maximum Depth, n_estimators | 13; 150 | 95.58% | 95.86% | 91.45% |
| Model | CV Accuracy, Mean ± SD | CV Precision, Mean ± SD | CV Recall, Mean ± SD |
| Logistic Regression | 83.90% ± 0.49% | 80.31% ± 2.08% | 72.37% ± 3.33% |
| KNN | 64.40% ± 0.39% | 36.67% ± 33.99% | 0.53% ± 0.26% |
| Decision Tree | 92.97% ± 1.41% | 90.21% ± 2.94% | 90.00% ± 1.83% |
| Random Forest | 94.09% ± 1.12% | 95.03% ± 1.57% | 87.89% ± 2.23% |
Tables 2 & 3 show both held out test set data & Five Fold Cross Validation Stability for all four algorithms. The Random Forest Optimization Results as well as the Random Forest Confusion Matrix are illustrated in Figures 3A–C. Figures 4A–F illustrate the Logistic Regression, KNN & Decision Tree Optimization Results along with their respective confusion matrices.
Random Forest obtained the greatest Held-Out Accuracy & Precision, while Decision Tree produced the greatest Recall. Despite its reasonable accuracy, KNN was only able to identify 2 positive Alzheimer’s cases and missed a 150, ultimately producing a recall of 1.32%.
| Probability Threshold | Accuracy | Precision | Recall |
| 0.30 | 93.95% | 89.38% | 94.08% |
| 0.40 | 95.58% | 93.46% | 94.08% |
| 0.50 | 96.05% | 95.30% | 93.42% |
| 0.60 | 95.58% | 95.24% | 92.11% |
| 0.70 | 94.42% | 95.07% | 88.82% |
Table 4 shows that threshold choice affected the balance between precision and recall. Lower thresholds maintained higher recall but reduced precision, while higher thresholds maintained high precision but lowered recall.
| Model | ROC-AUC | PR-AUC |
| Logistic Regression | 0.9166 | 0.8674 |
| KNN | 0.5591 | 0.4010 |
| Decision Tree | 0.9111 | 0.8115 |
| Random Forest | 0.9571 | 0.9394 |
Table 5 reports ROC-AUC and precision-recall AUC values. Random Forest achieved the highest ROC-AUC and PR-AUC, while KNN performed substantially worse, further supporting that KNN struggled to identify Alzheimer’s-positive cases.
| Model | Accuracy | Precision | Recall | Confusion Matrix |
| Baseline Random Forest using MMSE + Functional Assessment | 77.67% | 68.92% | 67.11% | [[232, 46], [50, 102]] |
| Full Random Forest using all 32 input features | 95.58% | 95.86% | 91.45% | [[272, 6], [13, 139]] |
Table 6 presents comparison data for the Random Forest model and a simple baseline model that uses only MMSE and Functional Assessment. It appears that the full Random Forest model outperformed the baseline model, suggesting that the larger feature set provided greater predictive utility compared to simply assessing MMSE and Functional Assessment alone.
| Subgroup Type | Subgroup | N | Accuracy | Precision | Recall |
| Gender | Female | 215 | 96.74% | 95.71% | 94.37% |
| Gender | Male | 215 | 95.35% | 94.94% | 92.59% |
| Age Group | 60–69 | 132 | 94.70% | 91.11% | 93.18% |
| Age Group | 70–79 | 153 | 95.42% | 97.83% | 88.24% |
| Age Group | 80–90 | 145 | 97.93% | 96.55% | 98.25% |
Table 7 reports performance data for the Random Forest model when stratified by sex and age. Performance was similar between males and females but recall varied across age groups. Specifically, recall rates are lowest for the age group 70-79 years old and highest for the 80-90 year olds.
To gain insight into which features had the most influence on the model’s predictions, a SHAP beeswarm plot was generated using the final Random Forest model. The top five most influential features were: Functional Assessment Score, Activities of Daily Living (ADL), Memory Complaints, Mini Mental State Examination (MMSE), and Behavioral Problems as shown in Figure 5A.
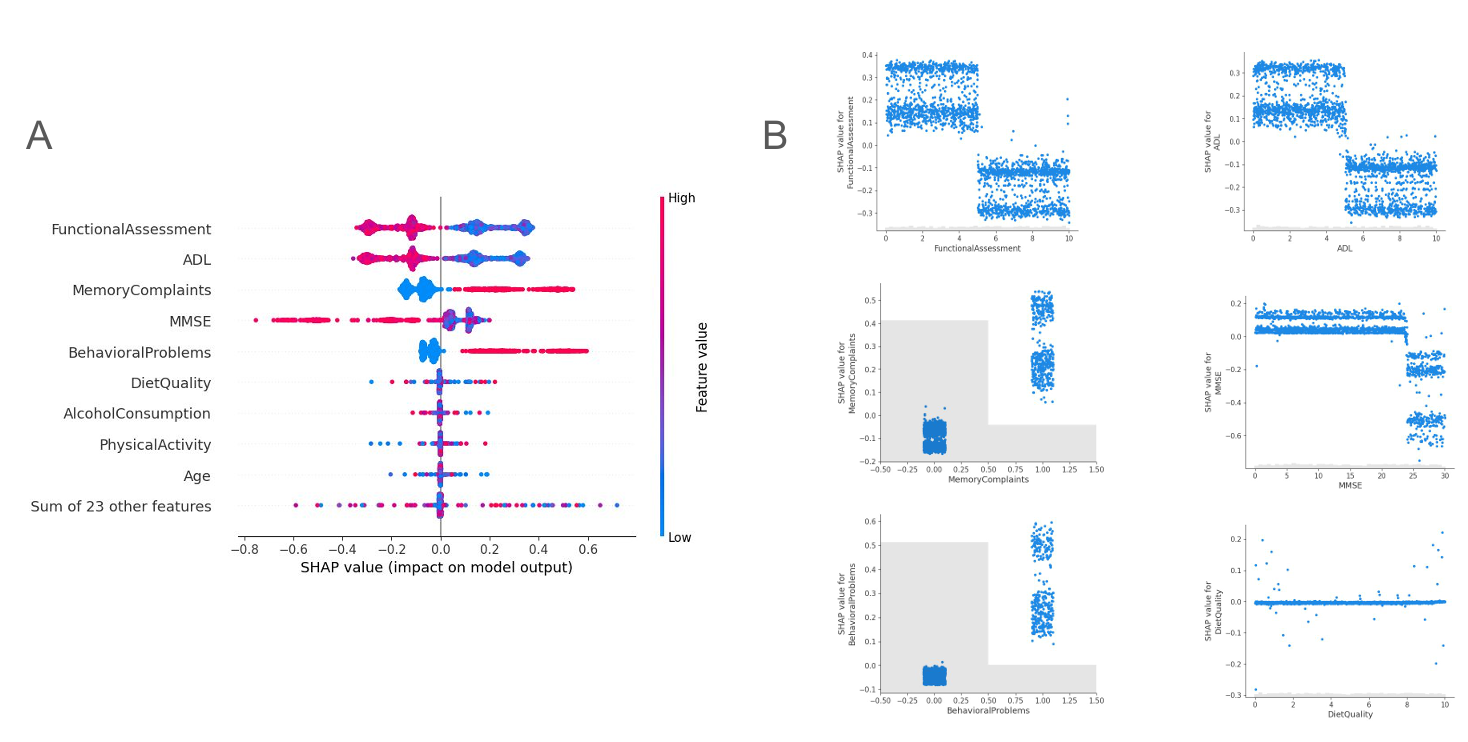
with color representing feature values. (B) SHAP dependency plots for selected features, showing how changes in feature values influence
model predictions
Lower Functional Assessment and ADL scores, along with the presence of Memory Complaints, were associated with a higher likelihood of an Alzheimer’s-positive prediction. Conversely, higher MMSE scores indicate an increased likelihood of a healthy individual. Other input features such as diet quality and alcohol consumption have much lower SHAP importance values indicating that they contribute less to this particular model’s predictions than do input features like functional assessment, ADL, MMSE, and Memory Complaints. That said, the fact that diet quality and alcohol consumption have low SHAP importance values in this particular Random Forest model does not mean that these lifestyle factors are clinically unimportant, particularly since no details are available on how diet quality and alcohol consumption were measured in this dataset.
Multiple input features ranked high by SHAP measure related dimensions of cognitive, functional and behavioral status. However, in cases where there are strong correlations between certain input features, SHAP values can assign greater importance to one variable over others based solely upon their statistical relationship with each other. This is important to note when looking at the Functional Assessment, ADL, MMSE, Memory Complaints, and Behavioral Problems variables, which, while all yielding high SHAP values, reflect overlapping dimensions of Alzheimer’s progression. While the SHAP results do provide insight into which groups of clinically relevant variables most influence the fitted Random Forest model’s predictions, they do not necessarily imply that any single variable has independent or causal significance over another. Therefore, the SHAP results are best understood as showing which groups of clinically related variables most influenced the fitted Random Forest model’s predictions specifically.
In addition to global feature importances, SHAP waterfall plots were generated to understand how different features contributed to the Random Forest model’s prediction of two specific patients8. See figure 6A for an example selected from the healthy control class and figure 6B for an example selected from the Alzheimer’s positive class. These examples were selected to illustrate how different features contribute to opposite diagnostic directions rather than represent statistically representative borderline or extreme cases for the full dataset.
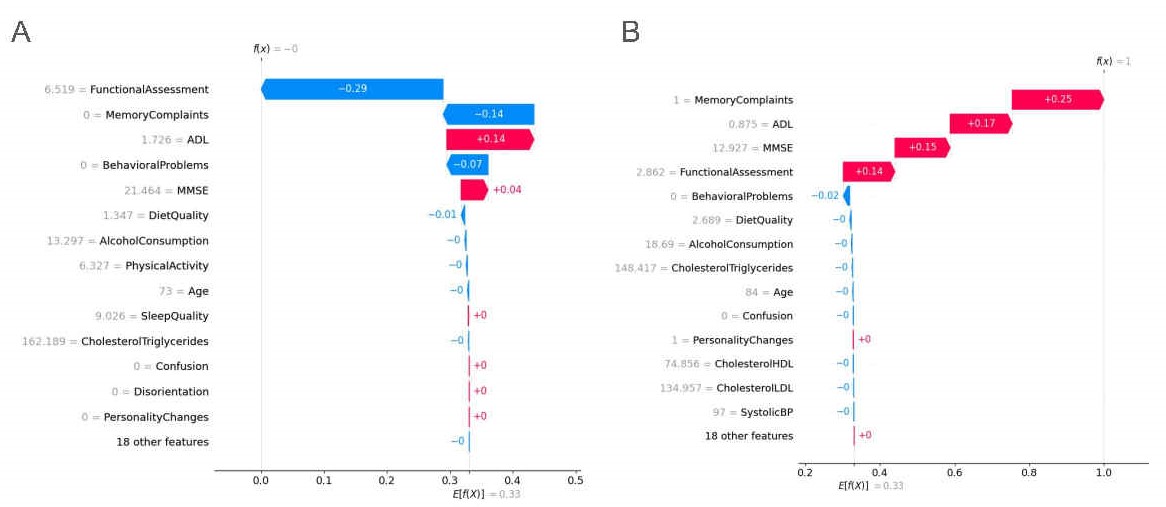
See Figure 6A for information of how individual feature contributions influenced the model’s prediction. A higher functional assessment value pushed the model away from an Alzheimer’s classification by approximately –0.29. Additionally, the absence of Memory Complaints also pushed the prediction away from an Alzheimer’s classification by approximately –0.14. Conversely, the patient’s ADL value contributed in the opposite direction by approximately +0.14. See figure 6b for an example showing how individual feature contributions pushed the model output toward diagnosing a patient as having Alzheimer’s. The presence of Memory Complaints pushed the model toward an Alzheimer’s classification by approximately +0.25. Additionally, lower ADL, lower MMSE, and lower functional assessment values also pushed the prediction toward Alzheimer’s disease. SHAP translates the model’s prediction into a contribution of each feature for a single patient. However, as only two patient-level cases are shown here, these plots serve as examples of local explainability and do not provide evidence that this pattern of explanation will be the same for all cases in the dataset.
Limitations
These models were trained and evaluated on one single dataset which contained the medical information of 2,149 patients. Although convenient for model comparison, it does not provide insight into how this model was developed including the methods used to select these patients, the country of origin, what procedure was used for diagnosis, and if there were any clinical validation processes5. In addition, the data source does not provide information regarding potential biases due to selection or labeling of the patients in this study. Thus, it is not known to what extent this model would be valid in other hospitals, countries, and populations. Additionally, this data source uses only two possible classifications of Alzheimer’s disease, whereas it is more accurate to assess the stage of Alzheimer’s disease, the length of time symptoms have been present, whether a person exhibits signs of mild cognitive impairment, and if their condition has worsened over time. Thus, the current study’s results should be interpreted as concerning the accuracy of classifying Alzheimer’s disease cases versus controls, not for early detection of the disease.
Several additional limitations affected the interpretation of the results. The correlation between the functional assessment, ADL, MMSE, memory complaints, and behavioral problems variables can complicate SHAP interpretation, so feature rankings should be viewed as explanations of the fitted model rather than independent clinical importance rankings. No feature normalization was performed, which could have affected the performance of the logistic regression and k-NN algorithms, as these rely heavily on scaling. Hyperparameter tuning was done using an exploratory train-test pipeline rather than a separate validation set or nested cross-validation; hence, the performance estimates presented here may be optimistically biased. Finally, although subgroup analyses indicated good performance for both genders and age groups, the subgroup samples were smaller than the whole testing set sample and thus cannot be interpreted as evidence of generalizability.
Discussion
This investigation used noninvasive cognitive, functional, behavioral, medical, demographic, and lifestyle data to compare the predictive performance of four machine learning algorithms. Overall, Random Forest was the best performing model with the highest accuracy and precision rates for the identification of individuals with Alzheimer’s disease; however, decision trees produced the best recall rate. The ROC-AUC, PR-AUC, cross-validation, and baseline model comparison results further supported the superiority of Random Forest over the other three models. Although the KNN model had moderate accuracy, it had extremely low recall and missed most positive Alzheimer’s cases demonstrating why accuracy alone is insufficient in the context of clinical classification. Although Logistic Regression performed better than KNN, its linear nature limits its ability to capture complex nonlinear relationships that characterize medical and cognitive data10, leading to its underperformance relative to tree-based methods7.
While there was no extreme imbalance between healthy controls and Alzheimer’s-positive cases, there were more controls than positive cases which affected the interpretation of the KNN results. The cross-validation demonstrated that the average recall of KNN across folds was approximately 0.53% ± 0.26%, indicating that even if the train-test splits differed, KNN would still fail to accurately identify Alzheimer’s-positive cases. There are several reasons for this poor recall including: the high-dimensionality of the input data, the lack of scaling of the input data, and the potential for oversmoothing class boundaries in the decision boundary due to the selection of too many neighbors (i.e., 55). For these reasons, although KNN exhibited moderate accuracy, it was deemed clinically unusable in this study.
SHAP analysis indicated that the most influential features in the Random Forest model included: Functional Assessment scores, Activities of daily Living (ADL) scores, Memory Complaints, Mini-Mental State Examination (MMSE) scores, and Behavioral Problems. These features represent functionally related areas of cognitive and behavioral impairment; therefore, SHAP rankings should be viewed as model-specific importance patterns rather than independent effects of each decision made by the model.
These findings are consistent with previously reported clinical observations regarding Alzheimer’s disease classification. The SHAP analysis conducted found Functional Assessment and ADL scores to be consistent with higher Alzheimer’s probability which matches existing evidence that states impaired daily functioning is a sign of decline1. Similar to previous research identifying subjectively reported Memory Complaints as early indicators, the presence of Memory Complaints shifted the Random Forest model towards a positive prediction as indicated by the SHAP analysis13. Additionally, behavior problems such as agitation and depression were indicated as influential variables in the model’s output which is consistent with symptoms commonly observed in progressed Alzheimer’s2,3.
SHAP values are specific to this model and reflect the contribution of the variables to its predictions; they do not directly measure the actual biological and clinical importance of each. This is particularly important in light of the low SHAP importance of diet quality, alcohol consumption, and lifestyle variables, all of which may be relevant but may not be captured well in this dataset or measured with sufficient precision to have the same impact. Although these variables may have appeared less influential, it should not be automatically concluded that these variables do not carry importance as it may be due to being measured less precisely, limited variability, or the nature of the dataset.
These results suggest that machine-learning models can classify Alzheimer’s disease labels using cognitive, functional, behavioral, medical, demographic, and lifestyle variables11,6,18. However, due to differences in datasets, feature sets, model types, and validation methods, direct performance comparisons should be approached cautiously. The reported 95.58% Random Forest accuracy is indicative of performance within the internal dataset only and is not an indicator of performance in a broader clinical application.
Conclusion
The objective of this research was to compare Logistic Regression, K-Nearest Neighbor, Decision Tree, and Random Forest in their ability to classify Alzheimer’s disease labels using non-invasive cognitive, functional, behavioral, medical, demographic, and lifestyle-related variables from a Kaggle dataset. The results indicate that Random Forest is the best performing classifier algorithm and SHAP analysis revealed that Functional Assessment, ADLs, memory complaints, MMSE scores, and behavioral symptoms were identified as being most influential in determining Alzheimer’s disease classifications.
However, it is necessary to interpret these results cautiously due to limitations associated with the dataset utilized. This study demonstrates that explainable machine learning can classify Alzheimer’s disease labels within this dataset and can identify the features most influential to those predictions. Further research will need to assess if models developed utilizing this type of data will perform equivalently when tested against other independent clinical datasets. In addition, future research will need to investigate if performance varies significantly across different demographic groups and if the model is able to differentiate among healthy aging, mild cognitive impairment, early-stage Alzheimer’s disease, and late-stage dementia. This work supports the broader development of accessible and transparent machine learning approaches for Alzheimer’s disease classification.
References
- G. Livingston, J. Huntley, A. Sommerlad, D. Ames, C. Ballard, S. Banerjee, C. Brayne, A. Burns, J. Cohen-Mansfield, C. Cooper, S. G. Costafreda, A. Dias, N. Fox, L. N. Gitlin, R. Howard, H. C. Kales, M. Kivimäki, E. B. Larson, A. Ogunniyi, N. Mukadam. Dementia prevention, intervention, and care: 2020 report of the lancet commission. The Lancet. Vol. 396, pg. 413–446, 2020, https://doi.org/10.1016/s0140-6736(20)30367-6. [↩] [↩] [↩]
- National Institute on Aging. What happens to the brain in alzheimer’s disease? n.d. https://www.nia.nih.gov/health/what-happens-brain-alzheimers-disease. [↩] [↩]
- National Institute on Aging. What causes alzheimer’s disease? n.d. https://www.nia.nih.gov/health/alzheimers-causes-and-risk-factors/what-causes-alzheimers-disease. [↩] [↩]
- M. Golovanevsky, C. Eickhoff, R. Singh. Multimodal attention-based deep learning for alzheimer’s disease diagnosis. Journal of the American Medical Informatics Association. Vol. 29, No. 12, pg. 2014–2022, 2022, https://doi.org/10.1093/jamia/ocac168 [↩] [↩] [↩] [↩]
- R. E. Kharoua. Alzheimer’s disease dataset. https://www.kaggle.com/datasets/rabieelkharoua/alzheimers-disease-dataset. 2023. [↩] [↩] [↩] [↩]
- Scikit-learn. User guide. https://scikit-learn.org/stable/user_guide.html. [↩] [↩] [↩] [↩] [↩]
- D. W. Hosmer, R. X. Sturdivant, S. Lemeshow. Applied logistic regression. John Wiley & Sons. 2013. [↩] [↩] [↩]
- S. Lundberg, S.-I. Lee. A unified approach to interpreting model predictions. arXiv. 2017. https://arxiv.org/abs/1705.07874. [↩] [↩] [↩] [↩] [↩] [↩]
- V. Vimbi, N. Shaffi, M. Mahmud. Interpreting artificial intelligence models: a systematic review on the application of LIME and SHAP in alzheimer’s disease detection. Brain Informatics. 2024. https://doi.org/10.1186/s40708-024-00222-1. [↩] [↩] [↩]
- H. Wang, L. Sheng, S. Xu, Y. Jin, X. Jin, S. Qiao, Q. Chen, W. Xing, Z. Zhao, J. Yan, G. Mao, X. Xu. Develop a diagnostic tool for dementia using machine learning and non-imaging features. Frontiers in Aging Neuroscience. Vol. 14, 945274, 2022, https://doi.org/10.3389/fnagi.2022.945274 [↩] [↩] [↩] [↩]
- A. S. Alatrany, W. Khan, A. Hussain, H. Kolivand, D. Al-Jumeily. An explainable machine learning approach for alzheimer’s disease classification. Scientific Reports. Vol. 14, 2024, https://doi.org/10.1038/s41598-024-51985-w. [↩] [↩] [↩] [↩] [↩]
- I. Arevalo-Rodriguez, N. Smailagic, M. Roqué I Figuls, A. Ciapponi, E. Sanchez-Perez, A. Giannakou, O. L. Pedraza, X. Bonfill Cosp, S. Cullum. Mini-mental state examination (MMSE) for the detection of alzheimer’s disease and other dementias in people with mild cognitive impairment (MCI). Cochrane Database of Systematic Reviews. 2015. https://www.ncbi.nlm.nih.gov/pmc/articles/PMC6464748/. [↩]
- E. L. Abner, R. J. Kryscio, A. M. Caban-Holt, F. A. Schmitt. Baseline subjective memory complaints associate with increased risk of incident dementia: the preadvise trial. Journal of Prevention of Alzheimer’s Disease. 2015. https://www.ncbi.nlm.nih.gov/pmc/articles/PMC4500536/. [↩] [↩]
- S. Qiu, M. I. Miller, P. S. Joshi, J. C. Lee, C. Xue, Y. Ni, Y. Wang, I. De Anda-Duran, P. H. Hwang, J. A. Cramer, B. C. Dwyer, H. Hao, M. C. Kaku, S. Kedar, P. H. Lee, A. Z. Mian, D. L. Murman, S. O’Shea, A. B. Paul, M. Saint-Hilaire, E. A. Sartor, A. R. Saxena, L. C. Shih, J. E. Small, M. J. Smith, A. Swaminathan, C. E. Takahashi, O. Taraschenko, H. You, J. Yuan, Y. Zhou, S. Zhu, M. L. Alosco, J. Mez, T. D. Stein, K. L. Poston, R. Au, V. B. Kolachalama. Multimodal deep learning for Alzheimer’s disease dementia assessment. Nature Communications. Vol. 13, 3404, 2022, https://doi.org/10.1038/s41467-022-31037-5. [↩] [↩]
- C. Xue, S. S. Kowshik, D. Lteif, S. Puducheri, et al. AI-based differential diagnosis of dementia etiologies on multimodal data. Nature Medicine. Vol. 30, pg. 2977–2989, 2024, https://doi.org/10.1038/s41591-024-03118-z [↩] [↩]
- M. E. AlMansoori, S. Jemimah, F. Abuhantash, A. AlShehhi. Predicting early Alzheimer’s with blood biomarkers and clinical features. Scientific Reports. Vol. 14, 6039, 2024, https://doi.org/10.1038/s41598-024-56489-1. [↩] [↩]
- S. Jiang, S. Yang, K. Deng, R. Jiang, Y. Xue. Machine learning models for diagnosing Alzheimer’s disease using brain cortical complexity. Frontiers in Aging Neuroscience. Vol. 16, 1434589, 2024, https://doi.org/10.3389/fnagi.2024.1434589 [↩] [↩]
- W. Kang, B. Li, J. M. Papma, L. C. Jiskoot, P. P. De Deyn, G. J. Biessels, J. A. H. R. Claassen, H. A. M. Middelkoop, W. M. van der Flier, I. H. G. B. Ramakers, S. Klein, E. E. Bron. An interpretable machine learning model with deep learning-based imaging biomarkers for diagnosis of alzheimer’s disease. arXiv. 2023. https://arxiv.org/abs/2308.07778. [↩] [↩] [↩]
- Y. Momota, T. H. Kim, M. Yamashita, K. Yoshida, H. Iwata, K. Hirata. Amyloid-β prediction machine learning model using source-based morphometry. Scientific Reports. Vol. 14, 7673, 2024, https://doi.org/10.1038/s41598-024-58223-3. [↩]
- F. Abuhantash, M. E. AlMansoori, S. Jemimah, A. AlShehhi. Comorbidity-based framework for Alzheimer’s disease classification using machine learning. Scientific Reports. Vol. 14, 22978, 2024, https://doi.org/10.1038/s41598-024-72321-2. [↩]
- S. Tascedda, M. Malaguarnera, M. Di Mauro, S. Benfatto, G. Motta, A. Rampello, R. Ferri, F. Basile, G. R. Giardina, G. Malaguarnera. Advanced AI techniques for classifying Alzheimer’s disease and mild cognitive impairment. Frontiers in Aging Neuroscience. Vol. 16, 1488050, 2024, https://doi.org/10.3389/fnagi.2024.1488050. [↩]
- M. E. Vlontzou, M. Athanasiou, K. V. Dalakleidi, I. Skampardoni, C. Davatzikos, K. Nikita. A comprehensive interpretable machine learning framework for mild cognitive impairment and Alzheimer’s disease diagnosis. Scientific Reports. Vol. 15, 8410, 2025, https://doi.org/10.1038/s41598-025-92577-6. [↩] [↩]
- T. Mahmud, K. Barua, S. U. Habiba, N. Sharmen, M. S. Hossain, K. Andersson. An explainable AI paradigm for Alzheimer’s diagnosis using deep transfer learning. Diagnostics. Vol. 14, 345, 2024, https://doi.org/10.3390/diagnostics14030345. [↩] [↩] [↩]
- R. Govindarajan, K. Thirunadanasikamani, K. K. Napa, S. Sathya, J. Senthil Murugan, K. G. Chandi Priya. Development of an explainable machine learning model for Alzheimer’s disease prediction using clinical and behavioural features. MethodsX. Vol. 15, 103491, 2025, https://pubmed.ncbi.nlm.nih.gov/40697328/. [↩]
- S. Leandrou, D. Lamnisos, H. Bougias, N. Stogiannos, E. Georgiadou, K. G. Achilleos, C. S. Pattichis. A cross-sectional study of explainable machine learning in Alzheimer’s disease: diagnostic classification using MR radiomic features. Frontiers in Aging Neuroscience. Vol. 15, 1149871, 2023, https://doi.org/10.3389/fnagi.2023.1149871 [↩]
- Y. Zhang, Y. Weng, J. Lund. Applications of explainable artificial intelligence in diagnosis and surgery. Diagnostics. Vol. 12, 237, 2022, https://doi.org/10.3390/diagnostics12020237 [↩]
- I. Kononenko. Machine learning for medical diagnosis: history, state of the art and perspective. Artificial Intelligence in Medicine. Vol. 23, pg. 89–109, 2001, https://doi.org/10.1016/s0933-3657(01)00077-x [↩]
- T. Saito, M. Rehmsmeier. The precision-recall plot is more informative than the ROC plot when evaluating binary classifiers on imbalanced datasets. PLOS ONE. Vol. 10, 2015, https://doi.org/10.1371/journal.pone.0118432 [↩]