
Abstract
Celiac disease is an autoimmune disorder triggered by gluten intake. The gliadin molecule, which is a substructure of gluten, induces an immune response by CD4+ T-cells when deamidated by the transglutaminase 2 enzyme. This reaction damages the small intestine lining, resulting in villous atrophy. Diagnosis is known to be invasive due to the use of an intestinal biopsy as the gold standard. This systematic review assessed the accuracy of using the differential gene expression profile in peripheral blood mononuclear cells as a diagnostic tool for celiac disease. Medline, Embase, and Cochrane databases were searched for the following keywords: celiac disease, celiac sprue, sprue, gene expression, genetic expression testing, genetic association study, genetic association studies, gene burden test, quantitative trait locus, quantitative trait loci, eQTLcolocalization, leukocyte, Leukocytes, peripheral blood mononuclear cell, peripheral blood mononuclear cells, transcriptome–wide association studies. Study selection was conducted based on the inclusion criteria, which included studies that encompass celiac disease patients diagnosed with the gold standard or high serological values and evaluated whether PBMC-associated gene expression or related immune-expression signatures could discriminate patients from controls, either through formal diagnostic metrics, (sensitivity/specificity/AUC) or classification/discriminatory modelling approaches with diagnostic performance interpreted according to the metric reported by each study. The review showed promising diagnostic performance for some differential gene expression profiles in celiac disease patients compared to controls. Some of the gene expression profiles showed promise for implementation in clinical practice in addition to the gold standard. However, further studies need to address key limitations by validating these results in larger cohorts with representative populations
Index Terms – celiac disease (CeD), gluten challenge, biopsy, gene expression, peripheral blood mononuclear cells (PBMCs), sensitivity, specificity.
Introduction
Celiac (coeliac) disease (CeD), also known as gluten-sensitive enteropathy, is an autoimmune disorder triggered by the ingestion of prolamins of gluten, resulting in specific peptides that can trigger an inflammatory response. Gluten is composed of prolamins and glutelins1 and is found naturally in wheat, barley, and rye2. Prolamins are plant storage proteins that are high in proline and glutamine1. Prolamins of wheat, barley and rye are gliadins, secalins, and hordeins, respectively. Gluten can also be found in oats due to cross-contamination. Nevertheless, some CeD patients may be triggered by avenins, the prolamins found naturally in oats3,4. Pathogenesis of CeD involves deamidation of gluten peptides by transglutaminase 2 enzyme. These deamidated gluten peptides presented by HLADQ2/DQ8 molecules on antigen presenting cells induce an Th1 response by CD4+ T cells2,2. This process is known as an autoimmune response, and it leads to the production of antigliadin antibodies and anti-transglutaminase antibodies along with damaging the lining of the small intestine. An autoimmune response occurs when the body’s immune cells mistakenly attack the body’s own tissue and healthy cells. The condition causes villous atrophy, which is the shortening of the villi of the small intestine. This shortening results in malabsorption and maldigestion.
In addition to the intestinal damage, CeD presents through multiple symptoms that vary widely depending on factors such as the patient’s age and duration of gluten exposure2. The most common symptoms include diarrhea, steatorrhea, extreme lethargy, bloating, edema, and villous atrophy.
HLA-DQ2 or HLA-DQ8 haplotypes are considered mandatory for someone to develop CeD. However, these haplotypes are found in 30-40% of the general population. Someone having these haplotypes does not necessarily mean that the disease will be expressed. Instead, these haplotypes indicate a higher risk of developing CeD5, complicating the diagnostic process.
Subtypes of CeD include classic, non-classic, silent, potential, and refractory. The non-classic, silent, and potential subtypes are harder to diagnose due to the variation in their presentation and symptoms compared to the classic or active subtype2. It is important to note that these subtypes develop from the same autoimmune response discussed earlier, but their progression and presentation can vary.
The classic subtype presents with the most typical symptoms, which include chronic diarrhea and weight loss. The classic subtype occurs more frequently in children than in adults. The non-classic subtype is more prevalent than the classic one and includes more severe symptoms like iron deficiency anemia. This is due to malabsorption of iron in the jejunum, the second part of the small intestine.
The silent subtype has few to no symptoms but severe intestinal damage. Potential subtype refers to someone who has positive serological tests but still does not have any intestinal damage. The person might develop villous atrophy if gluten ingestion continued.
The refractory subtype of CeD is the most severe one, as malabsorptive symptoms and villous atrophy still persist even after going on a strict Gluten-Free Diet (GFD) for over 12 months and other potential causes for intestinal damage have been excluded6. The patients with this subtype can be put in two categories: Primary Refractory CeD and Secondary Refractory CeD. Primary refractory CeD patients do not respond well to a GFD. Secondary refractory CeD patients respond well, but a relapse occurs after treatment.
The gold standard for diagnosing CeD is the performance of an intestinal (duodenal) biopsy. The procedure involves obtaining a small tissue sample from the patient’s duodenum for histopathological examination. The patient must undergo a Gluten Challenge (GC) before the procedure to assess the effect of gluten on the small intestine and avoid a false diagnosis2. The main concern with using the gold standard is that it is invasive. Serological tests, while most of the time effective, require a GC. In addition, the accuracy of serological tests depends on the severity of the intestinal damage. This implies not capturing early signs of the disease, which may lead to false negatives.
Over the past few years, multiple studies have examined differences in gene expression profiles in Peripheral Blood Mononuclear Cells (PBMCs) in CeD patients compared to healthy individuals. PBMCs refer to immune cells with a single nucleus and include monocytes and lymphocytes. This approach has shown great promise in diagnosing the disease and potentially being used in clinical practice in addition to the gold standard.
This systematic review assesses studies examining the accuracy of using differential gene expression profiles in PBMCs of CeD patients for diagnosis. The aim of this systematic review is to evaluate the diagnostic potential of leveraging differential gene expression profiles by:
- Comparing diagnostic metrics such as sensitivity and specificity or discriminatory values of the differential gene expression profiles
- Discussing the genes’ role in CeD pathogenesis
- Discussing the gaps in the literature of the current understanding of the genes’ roles in the pathogenesis of the disease
- Discussing the limitations and future directions of using the differential gene expression profiles in clinical diagnosis.
This study holds significance for advancing CeD diagnostics and potentially for the differential gene expression profile tool to be implemented in clinical practice in addition to the gold standard. This systematic review follows PRISMA 2020 guidelines. Limitations of this study include small number of studies found and some included studies evaluated discriminatory/classification potential rather than formal diagnostic-test performance7,8. Thus, some sections in the quality assessment tool for diagnostic accuracy studies (QUADAS-2) may not apply perfectly to these exploratory biomarker/mechanistic studies.
Methodology
Study Design
The objectives, review question, search strategy, inclusion/exclusion criteria, data extraction, and risk of bias assessment outlines were established prior to the conduct of the review. Two reviewers independently agreed on selection of eligible studies and data extraction criteria and achieved consensus on which studies to include. The Preferred Reporting Items for Systematic Reviews and Meta-Analyses (PRISMA) 2020 guidelines were followed9.
Data Sources and Search Strategy
A comprehensive search of the databases Medline, Embase, and Cochrane was conducted on the April 16, 2026. The intervention, population, outcome, inclusion and exclusion criteria are shown in Table 1. The following keywords were used: Celiac disease, celiac sprue, sprue, gene expression, genetic expression testing, genetic association study, genetic association studies, gene burden test, quantitative trait locus, quantitative trait loci, eQTLcolocalization, leukocyte, leukocytes, peripheral blood mononuclear cell, peripheral blood mononuclear cells, transcriptome-wide association studies, human. Language restrictions include studies that are written in English and are peer-reviewed. Studies that included human participants were included; animal studies were excluded. Observational studies, case-control studies, quasi-experimental studies, longitudinal studies, and mendelian randomization studies were included. The rationale for including these study designs is the presence of diagnostic accuracy metrics, whether formal sensitivity/specificity values, or discriminatory/classification ones. Abstracts that were not published as full texts or are conference papers were excluded The reference lists of included studies were hand-searched to identify additional literature for inclusion.
Inclusion Criteria
Studies were included if they involved CeD patients of any age, diagnosed by the gold standard or high serological values, with silent, classic, or nonclassic subtypes. Studies were included if they evaluated whether PBMC-associated gene expression or related immune-expression signatures could discriminate CeD patients from controls, either through formal diagnostic metrics (sensitivity/specificity/AUC) or classification/discriminatory modelling approaches Studies with the absence of healthy control groups were excluded
Data Extraction
Data were extracted using an Excel sheet. The following data were gathered: author/year, sample size, control group characteristics and diagnosis, diet of CeD patients, technique used, genes with diagnostic power, the differences in gene expression in PBMCs, diagnostic metrics (sensitivity, specificity, AUC values), HLA-haplotype of patients, HLA-haplotype of controls, study design, and subtype of CeD.
Synthesis method
A combination of narrative synthesis and thematic analysis was used to present findings and identify patterns, gaps, and directions for future studies.
| Intervention | Diagnostic testing based on gene expression differences in PBMCs. |
| Population | Diagnosed CeD patients using the gold standard or high serological values with either silent, classic, or non-classic subtypes. |
| Outcome | Evaluating the diagnostic accuracy compared to the gold standard. |
| Search terms | Celiac disease, celiac sprue, sprue, gene expression, genetic expression testing, genetic association study, genetic association studies, gene burden test, quantitative trait locus, quantitative trait loci, eQTL colocalization, leukocyte, leukocytes, peripheral blood mononuclear cell, peripheral blood mononuclear cells, transcriptome-wide association, human. |
| Exclusion | Animal studies were excluded. Abstracts that were not published as full texts or are conference papers were excluded. |
| Comparison | Gold standard and serological tests such as antigliadin test, anti-endomysial test, anti-tissue transglutaminase (tTG) test, IgA-DGP test, and IgG-DGP test. |
Quality Assessment
Quality assessment was performed by two independent reviewers using the QUADAS-2 tool for assessing diagnostic test accuracy studies. QUADAS-2 is composed of 4 key domains that are assessed in terms of the risk of bias and the concern regarding applicability to the review question. Each key domain has a set of signaling questions to help reach one of these three judgements in each domain: High, low, or unclear risk of bias. Although some included studies were exploratory biomarker studies rather than conventional diagnostic accuracy studies, QUADAS-2 was considered the most appropriate available framework to systematically evaluate methodological quality and potential sources of bias across the included studies. Results from the quality assessment for each study are shown in Table 2.
| Author/year | Patient selection risk of bias | Index test risk of bias | Reference standard risk of bias | Flow and Timing risk of bias | Patient selection applicability concerns | Index test applicability concerns |
| (Gómez-Aguililla et al., 2025)10 | ? | ☹ | 😊 | ☹ | 😊 | ? |
| (Galatola et al., 2013)11 | ☹ | ☹ | ? | ? | ☹ | ☹ |
| (Galatola et al., 2017)12 | ☹ | ☹ | 😊 | ☹ | ☹ | ☹ |
| (Khalkhal et al., 2022)13 | ☹ | ? | 😊 | ? | ? | 😊 |
| (Fernandez-Jimenez & Bilbao, 2019)14 | ? | ☹ | 😊 | ☹ | ? | ? |
| (Sangineto et al., 2018)15 | ☹ | ☹ | 😊 | ☹ | 😊 | ? |
Results
| Author/year | Sample Size | Control group characteristics and diagnosis | Diet of CeD patients | Study design | HLA -Haplotype of CeD patients | HLA-Haplotype of controls | Subtype of CeD |
| (Gómez-Aguililla et al., 2025)10 | 19 CeD patients and 13 healthy controls | All controls were confirmed by negative test for anti-TG2 for the absence of CeD. Some of them has Suspected Gluten Related Symptoms (SGRS) | GFD | Multicenter prospective quasi experimental | Not specified | Not specified | Not specified |
| (Galatola et al., 2013)11 | 17 CeD patients, 5 CeD patients on a GFD, 18 healthy controls and 9 Crohn disease patients | 18 healthy controls confirmed by a biopsy for the absence of CeD | Two groups: CeD on a GFD and untreated CeD patients | Case Control | Not specified | Not specified | Active CeD |
| (Galatola et al., 2017)12 | 9 CeD and 13 healthy controls | Some controls were confirmed by negative serological tests for the absence of CeD and in 6 out of 13 controls, the absence of CeD was confirmed by a biopsy due to clinical and serological suspicion. The controls were age and sex-matched with the CeD patients | Untreated (before CeD diagnosis) | Longitudinal prospective cohort | DQ2.5/DQ7 (n=1) DQ2.2/X (n=1) DQ2.5/DQ2.2 (n=3) DQ2.2/DQ7 (n=1) DQ2.5/X (n=3) | DQ2.5/DQ7 (n=2) DQ2.2/X (n=3) DQ2.5/DQ2.2 (n=1) DQ8/X (n=2) DQ2.2/DQ7 (n=3) DQ2.2/DQ2.2 (n=1) DQ2.5/DQ8 (n=1) | Not specified |
| (Khalkhal et al., 2022)13 | 30 CeD patients and 30 healthy controls | 30 controls confirmed by negative serology tests for CeD.The controls were age and sex-matched with the CeD patients | Untreated | Case Control | Not specified | Not specified | Not specified |
| (Fernandez-Jimenez & Bilbao, 2019)14 | One dataset consisted of 17 CeD patients on a GFD and 20 healthy controls. Another set consisted of 42 healthy controls and 59 Crohn’s disease and 26 ulcerative colitis patients | 20 healthy controls confirmed by serological tests for the absence of CeD | GFD | Mendelian Randomization | Not specified | Not specified | Not specified |
| (Sangineto et al., 2018)15 | 17 CeD patients and 20 healthy controls | 20 healthy controls confirmed by serological tests for the absence of CeD | GFD for at least 2 years | Case Control | DQ2 (n=12) DQ8 (n=5) | HLA/DQ2 and HLA/DQ8 negative | Not specified |
| Author/year | Genes with diagnostic power | The differences in PBMCs gene expression | Technique used |
| (Gómez-Aguililla et al., 2025)10 | UBE2L3 | UBE2L3 expression was higher in CeD patients compared to controls | RT-qPCR |
| (Galatola et al., 2013)11 | c-REL, LPP, TNFAIP3, and KIAA1109 | KIAA1109 expression was higher in CeD patients, CeD patients on a GFD, and Crohn patients compared to controls c-REL expression was lower in CeD patients compared to controls, but higher in CeD patients on a GFD and Crohn’s patients compared to controls LPP expression was lower in CeD patients compared to controls, but its expression in CeD patients on a GFD and in Crohn’s patients was similar to that in controls TNFAIP3 gene expression was lower in CeD patients but was higher in Crohn patients compared to controls TNFAIP3 expression was normalized in CeD patients after one year of a GFD | RT-qPCR Glucoronidase (GUSb) was used as a housekeeping gene |
| (Galatola et al., 2017)12 | RGS1, TAGAP, SH2B3 and TNFSF14 | TAGAP and SH2B3 expression were higher in patients compared to controls before CeD diagnosis TNFSF14 and RGS1 expression were lower in patients compared to controls before CeD diagnosis | RT-qPCR Glucoronidase (GUSb) was used as a housekeeping gene |
| (Khalkhal et al., 2022)13 | IL-15, IL-17A, IL-23A, GzmB, TBX21, and TNFAIP3 | IL15 , IL17A , IL23A, GzmB , TBX21 , and TNFAIP3 expression was higher in CeD patients compared with controls | RT-qPCR Beta-2 microglobulin (B2M) was used as a housekeeping gene |
| (Fernandez-Jimenez & Bilbao, 2019)14 | UBE2L3 | UBE2L3.1 (coding isoform) expression was higher in CeD patients on a GFD compared to controls. UBE2L3.2 (non-coding isoform) expression was lower in CeD patients on a GFD and its expression was strongly and negatively correlated with the expression of the coding isoform | Gene expression microarray analysis GAPDH was used as a housekeeping gene |
| (Sangineto et al., 2018)15 | HSPA1A, TNFSF10, MAPK1, NFE2, TLR5, ABCA1, CCL2, CD83, TREM1 and NR4A2 | HSPA1a, TNFSF10, MAPK1, NFE2 and TLR5 expressions were higher in CeD patients compared to controls ABCA1, CCL2, CD83, TREM1and NR4A2 expression were lower in CeD patients compared to controls | RT-qPCR Cyclophilin was used as a housekeeping gene |
| Author/year | Genes with diagnostic power | Sensitivity | Specificity | AUC |
| (Gómez-Aguililla et al., 2025)10 | UBE2L3 | 52.90% | 100% | 0.79 |
| (Khalkhal et al., 2022)13 | IL-15 | 57% | 93% | 0.73 |
| (Khalkhal et al., 2022)13 | IL-17A | 37% | 50% | 0.71 |
| (Khalkhal et al., 2022)13 | IL-23A | 91% | 85% | 0.90 |
| (Khalkhal et al., 2022)13 | GzmB | 95% | 69% | 0.83 |
| (Khalkhal et al., 2022)13 | TBX21 | 42% | 92% | 0.56 |
| (Khalkhal et al., 2022)13 | TNFAIP3 | 80% | 93% | 0.90 |
| (Fernandez-Jimenez & Bilbao, 2019)14 | UBE2L3 | 100% | 100% | 1 |
| (Sangineto et al., 2018)15 | HSPA1A | 100% | 99% | 0.99 |
| (Sangineto et al., 2018)15 | TNFSF10 | 93% | 90% | 0.92 |
| (Sangineto et al., 2018)15 | MAPK1 | 100% | 85% | 0.95 |
| (Sangineto et al., 2018)15 | NFE2 | 93% | 90% | 0.96 |
| (Sangineto et al., 2018)15 | TLR5 | 100% | 90% | 0.95 |
| (Sangineto et al., 2018)15 | ABCA1 | 75% | 88% | 0.88 |
| (Sangineto et al., 2018)15 | CCL2 | 87% | 100% | 0.95 |
| (Sangineto et al., 2018)15 | CD83 | 87% | 95% | 0.96 |
| (Sangineto et al., 2018)15 | TREM1 | 87% | 90% | 0.94 |
| (Sangineto et al., 2018)15 | NR4A2 | 100% | 85% | 0.97 |
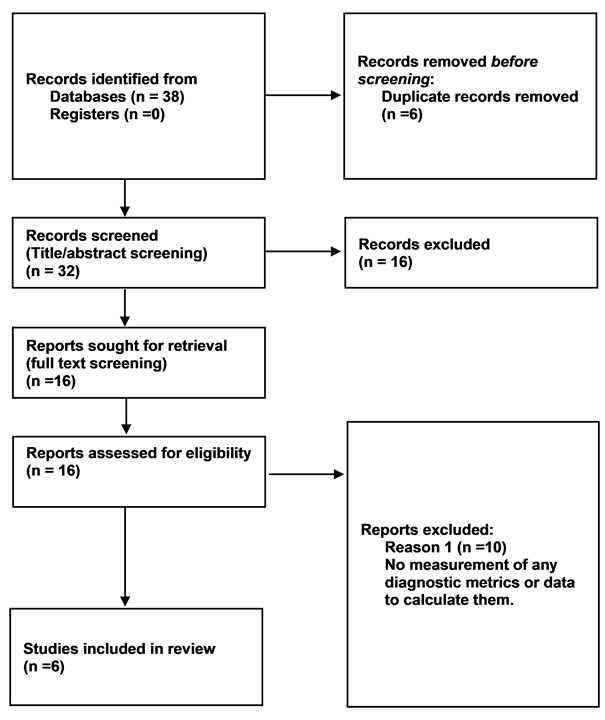
Six studies were analyzed after applying the inclusion criteria in the literature search, spanning the period from 2013 to 2025. Some of the included studies were funded16,17,18 while others did not receive fund19 or the status of funding was not reported20,21. The article selection process, accompanied by the reasons for exclusion, is presented in Figure 1.
Most studies analyzed CeD patients on a GFD without mentioning its duration. Most studies did not report the HLA haplotypes of either CeD patients or controls, nor was the CeD subtype included in the study specified, as shown in Table 3. One study addressed the diagnosis of CeD at least nine months before clinical symptoms. This finding shows potential in diagnosing early cases of CeD, not only the active subtype. Reverse Transcription-quantitative Polymerase Chain Reaction (RT-qPCR), normalized to a housekeeping gene, was the most common technique used to measure gene expression differences, except in one study22, which did not perform normalization. Most studies worked on PBMCs, except for one study which worked on peripheral blood monocytes (PBMs) only, a subpopulation of PBMCs. This marked heterogeneity among the six studies complicates the results and their real-world clinical applicability.
Notably, some genes were examined in more than one study, but findings were inconsistent. For example, the UBE2L3 gene was examined in two studies, but with different sensitivity values (100% vs 52.9%), as shown in Table 5. Similarly, TNFAIP3 was examined in two studies with different patterns of expression. One study reported that TNFAIP3 expression in PBMs was moderately lower in CeD patients compared to controls and CeD patients on a GFD. Whereas in another study, TNFAIP3 expression in PBMCs of CeD patients was higher compared to controls, as shown in Table 4.
The sensitivity of the genes with diagnostic power varied significantly, with some genes showing as high as 100% sensitivity. These include MAPK1, TLR5, NR4A2 and the relative expression score of UBE2L3 combined. In contrast to these results, some genes showed low sensitivity. For example, IL-17A displayed a low sensitivity of only 37%, as shown in Table 5.
The specificity also varied among studies, with some genes showing as high as 100% specificity. These include CCL2, the relative expression score of UBE2L3, and the UBE2L3 expression in22. In contrast, some genes had low specificity. For example, the differential expression of IL-17A had 50% specificity, as shown in Table 5.
Some studies combined the expression of multiple genes for diagnosis instead of relying on the expression of a single gene. Although these studies did not use formal diagnostic metrics (sensitivity/specificity) to test the diagnostic accuracy of the gene expression profiles, these gene expression profiles showed a accuracy values in differentiating between CeD patients compared to controls using classification/discriminatory metrics. For example, the combination of c-REL, LPP, TNFAIP3, and KIAA1109 genes was able to correctly classify 95.5% of patients (91% of controls and 100% of CeD patients). In addition, the combination of the expression of RGS1, TAGAP, SH2B3 and TNFSF14 genes was able to correctly classify 95% of patients (92.3% of controls and 100% of CeD patients).
One study combined SH2B3 genotype, RGS1 genotype, c-REL expression, TNFRSF14 genotype, SH2B3 expression, and TNFSF14 genotype in a model to test its diagnostic accuracy. The model was able to classify 100% of patients before the appearance of clinical symptoms23. However, it should be noted that these were shown by testing on an at-risk family cohort, meaning they cannot be generalized to the broader population. Thus, when it was tested in a validation set, it was only able to correctly classify 77.8% of CeD patients and 84.6% of controls.
UBE2L3, HSPA1a, TNFSF10, NFE2, and TLR5 differential expression profiles were shown to be the most promising due to their high accuracy (>90%) and being measured in GFD individuals.
Discussion
In the context of CeD diagnosis, several factors must be carefully evaluated to determine the feasibility and robustness of the diagnostic tool for implementation in clinical practice.
First, the diet of patients during diagnosis is important. Most studies that used differential gene expression profiles for CeD diagnosis included patients on a GFD. This shows a great advantage compared to a biopsy, which requires a GC that can harm patients by increasing the severity of symptoms.
Second, the accuracy of the test. Diagnostic accuracy can be broken down into two parameters: Sensitivity and Specificity. Sensitivity refers to the test’s ability in identifying whether someone has the disease or not. Specificity refers to the test’s ability in differentiating between healthy individuals and people with the disease. Some differential gene expression profiles showed both high values of sensitivity and specificity in diagnosing CeD, as reported previously in the result’s section. These findings suggest comparable or potentially greater than diagnostic performance to the standardized clinical serological tests like the antigliadin test (sensitivity: 75-90%, specificity: 82-95%), anti-endomysial test (sensitivity: 85-98%, specificity: 97%-100%), anti-tissue transglutaminase (tTG) test (sensitivity: 90-98%, specificity: 94-97%), IgA-DGP test (sensitivity: 75-78%, specificity: 95-100%), and IgG-DGP test (sensitivity: 65-71%, specificity: 85-95%)2.
Third, the feasibility and safety of the diagnostic procedure must be considered. Most studies utilized an RT-qPCR technique, which is used to quantify RNA. This technique requires only a blood sample and is relatively inexpensive compared to a biopsy. This shows minimal invasiveness and feasibility compared to the gold standard.
Fourth and most importantly, the test reflects underlying biological mechanisms that are directly involved in the pathogenesis of CeD. This criterion is used to demonstrate that the test measures biologically meaningful changes rather than mere numerical variations. It is important to note that biological relevance does not necessarily equal diagnostic accuracy; rather this systematic review discusses the biological relevance of the genes both with and without diagnostic power because it is an important parameter for any clinically useful diagnostic test. Thus, only PBMCs differential gene expression profile studies can inform about the diagnostic accuracy of a specific gene expression profile. Therefore, citations from other studies are there to explain biological relevance to CeD and not necessarily diagnostic accuracy.
The observed differential gene expression profiles align well with established biological mechanisms of CeD pathogenesis. For instance, a study investigating multiple common genetic variants in CeD demonstrated that several genes examined (UBE2L3, LPP, TNFAIP3, RGS1, TAGAP, SH2B3) are located in regions significantly associated with CeD24. Many of these genes were also reported to be involved in immune function. Significantly, when CeD genetic risk regions were compared to those found in other immune diseases, a region near the LPP gene was identified in one of nine regions distinctively associated with CeD.
UBE2L3 codes for a ubiquitin ligase that was shown to be located within a risk locus associated with CeD25. UBE2L3 playsa major role in the activation ofthe NF-κB complexin B cells & monocytes26. This relation suggests the significant functional role of UBE2L3 in CeD pathogenesis. This can be attributed to the crucial role of NF-κB complex in the gliadin-induced inflammatory response in the mucosa. However, further studies need to confirm this in the context of CeD.
In the context of CeD diagnosis, one important advantage of the expression of UBE2L327 is its low diagnostic power in other diseases. In the study, an Affymetrix microarray was used to determine whether the UBE2L3 expression can diagnose Ulcerative Colitis (UC). Remarkably, none of the probes used in the array was able to distinguish UC from controls, showing low AUC values that ranged between 0.452 and 0.752. These results were also present with Crohn’s subjects showing low values that ranged between 0.528 and 0.699. This suggests that the diagnostic potential of UBE2L3 may be unique to CeD.
c-REL and TNFAIP3 are genes both involved in the regulation of the NF-κB complex. c-REL encodes a subunit of the complex and activates the transcription of pro-inflammatory genes. TNFAIP3 is a negative regulator of this complex and reduces transcription to prevent excessive inflammation. This reflects the functional relevance of both c-REL and TNFAIP3 in gliadin-induced immune dysregulation and pathogenesis of CeD8. This is supported by the finding of a higher methylation profile of TNFAIP3 and higher gene expression of c-REL in the lamina propria of CeD patients compared to controls28. c-REL was shown to be down-regulated in PBMs of untreated CeD patients and up-regulated in PBMs of treated CeD patients, showing an unexpected pattern of expression.
LPP codes for a cytoskeletal protein that modulates cell adhesion and cell migration8. LPP was one of the 5 candidate genes whose genotype was shown to increase the risk of developing CeD by over 90%23. The downregulation of LPP in PBMs of CeD patients compared to controls is known to be relevant in the pathogenesis of CeD. This is due to the decrease in cell integrity of the intestinal barrier, which enhances the inflammatory response28.
KIAA1109 is located in a cluster region on chromosome 4 that is known to have a role in the differentiation of naïve human CD4+ T cells into Th17 cells. These cells produce inflammatory cytokines such as IL-17A, IL-17F, IL-21, and IL-22, which is crucial in enhancing inflammation in the pathogenesis of CeD8. KIAA1109 was shown to be elevated in PBMs of untreated and treated CeD patients compared to controls, showing an unexpected pattern of expression in treated subjects.
RGS1 helps control the activity of intestinal intraepithelial lymphocytes (IELs), which are involved in the death of gut wall cells and the worsening of villous atrophy. This biological relevance aligns with the lower expression pattern of RGS1 in PBMs of CeD patients compared to controls. It is important to note that this biological relevance and expression pattern does not necessarily mean high diagnostic accuracy. Moreover, RGS1 co-expression with the HLA component of CeD, along with other genes in B cell lymphoma, liver tissue, skeletal muscles, and cancer cells, was shown to be crucial in triggering T cell autoimmune activation29. This further shows significance in the progression of CeD.
TAGAP is a GTPase-activating protein that was shown to be associated with multiple autoimmune diseases, including CeD. TAGAP is invloved in Th17 differentiation, which is known to be involved in the gliadin-induced immune response in the pathogenesis of CeD. This role in Th17 differentiation also explains its upregulation in CeD patients compared to controls30.
The SH2B3 gene encodes a protein from the Src homology 2-Binding (SH2-B) protein family. SH2B3 is a negative regulator of T cell receptors and is known to be involved in regulating T cell signaling28. These findings show the gene’s biological relevance in the pathogenesis of the disease. SH2B3 expression is also involved in regulating integrin protein signaling, which is crucial for the adhesion of endothelial cells31. Importantly, SH2B3 expression was shown to be significantly upregulated in the intestinal epithelial cells and PBMCs of CeD patients compared to controls before the appearance of CeD28. This suggests an early role of this gene in the pathogenesis of the disease, as shown by its methylation in CeD compared to controls.
TNFSF14 is involved in the activation of Natural Killer (NK) intestinal and CD4+ T cells. TNFSF14 is also involved in regulating the inflammatory response, contributing to the pathogenesis of CeD28. Notably, TNFSF14 was indicated to be downregulated in the lamina propria of CeD patients compared to controls. It was also downregulated in PBMCs of CeD patients compared to controls28. However, in a more recent study, TNFSF14 protein levels were shown to be increased in pediatric CeD patients compared to HLA-matched controls32. Further studies need to clarify these inconsistent findings and provide an explanation for these unexpected patterns of expression.
IL-23A is a subunit of the heterodimeric cytokine IL-2333. IL-23, along with IL-1β, has been shown to be elevated in PBMCs of CeD patients in response to gliadin34. Importantly, the study also showed that IL-1β induced the secretion of IL-23. IL-23 was also shown to play a role in the Th17-mediated immune response, a key driver of the pathogenesis of CeD35,36,37.
HSPA1a is a gene located in the Major Histocompatibility Complex (MHC) class III region that encodes a heat shock protein called HSP70-138. The study found that the HSP70-1 protein was produced in higher amounts in CACO cells after exposure to gliadin. CACO cells are an in vitro model used to study the intestinal barrier. This finding suggests the involvement of this gene in disrupting the adhesion of intestinal epithelial cells after gliadin exposure. Furthermore, genetic polymorphisms of the HSPA1a gene were shown to be associated with CeD susceptibility39. Notably, HSPA1a was shown to be overexpressed in PBMCs of CeD patients on GFD compared to controls, showing an unexpected pattern of expression.
In a single transcriptomics analysis in the immune, parenchymal, and epithelial cells of CeD patients, TNFSF10 was shown to be highly expressed in the villus tip regions in the small intestine of CeD patients40. Moreover, in a single-cell RNA sequencing study, TNFSF10-encoded cytokine TRAIL was upregulated in gluten-specific CD4+ T cells of CeD patients41. The results of the two studies suggest the in vivo activation of TNFSF10 by gliadin. Notably, TNFSF10 expression was shown to be elevated in PBMCs of CeD patients on a GFD compared to controls, showing an unexpected expression pattern.
MAPK1 is a key component of the MAPK signaling cascade, which regulates multiple cellular functions and signaling, such as proliferation and inflammation. MAPK1 was shown to be overexpressed in PBMCs of CeD patients on a GFD compared to controls42,38. This is relevant to the pathogenesis of the disease as MAP kinase cascade regulates the innate and adaptive immune responses. MAPK1 has also been shown to be associated with active CeD disease43. Thus, the overexpression of MAPK1 despite a GFD suggests persistent immune activation, which shows its significant role in driving the pathogenesis of the disease.
Toll-like receptors (TLRs) are a family of receptors that are expressed on immune cells such as monocytes, dendritic cells, B cells, macrophages, and certain types of T cells44. In a 2012 study, the TLR5 gene was shown to be expressed in the small intestinal mucosa in a comparable manner between treated CeD patients, untreated CeD patients, and healthy controls, not showing a statistically significant differential gene expression profile45. However, in a more recent study, TLR5 was shown to be overexpressed in PBMCs of CeD patients on a GFD compared to controls38. Thus, further studies need to confirm and clearly define the role of TLR5 in the pathogenesis of CeD.
CCL2 is a monocyte chemoattractant protein that has been reported in a previous study with other chemokines and cytokines to be elevated in response to a GC in CeD patients compared to controls46. While in another study, CCL2 expression was downregulated in CeD-GFD patients compared to controls47. These patterns of expression were suggested to come from the involvement of CCL2 in the innate immune response triggered by gliadin ingestion. This biological relevance suggests an explanation for the downregulation of CCL2 in CeD patients on a GFD.
CD83 is a marker of dendritic cells that was shown to be downregulated in CeD patients on GFD compared to controls. CD83 is involved in the innate immune response triggered by ingesting gliadin38. CD83 was also shown to be overexpressed in lamina propria mononuclear cells (LPMCs) in both treated and untreated CeD patients compared to controls48. In one study, alterations were shown in the morphology and actin cytoskeleton of dendritic cells in both treated and untreated CeD patients49. This finding shows a cellular phenotype specific to CeD independent of gluten intake. It also shows the relevance of CD83 as a dendritic maturation marker in CeD. In another study, CD83 was shown to be strongly expressed in response to gliadin stimulation on dendritic cells, independent of whether these dendritic cells were from CeD patients or controls50. Moreover, the study also showed that gliadin-stimulated dendritic cells from active CeD patients were able to activate autologous T cells compared to controls and treated CeD patients.
TREM-1 is a member of the Triggering receptor expressed on myeloid cells (TREM). TREM is a family of pattern recognition receptors (PRRs) that are expressed on the surface of multiple immune cells such as T cells and B cells51. TREM-1 was shown to amplify inflammation through the activation of other pathways that include TLR2 and TREML2. TLR2 is indicated to have a role in CeD pathology due to its high expression in both active and treated CeD52. TREML2, another member of the TREM family, is known to be associated with amplification of inflammation in CeD53. It is important to note that further functional studies need to investigate this relation in the context of CeD. In an in-silico study, the role of TREM-1 was suggested to be in recognizing alpha gliadin peptides, boosting intestinal inflammation and playing a role in the pathogenesis of CeD51.
The role of NR4A2 in CeD pathogenesis and the reason behind its downregulation in CeD patients is not specifically reported in the literature. However, NR4A2 is one of the nuclear receptors of the NR4a family that plays a role in the activation and maintenance of T-regulatory cells54. This suggests the role of NR4A2 in influencing the attacking of T-cells on the intestinal barrier.
While some genes showed remarkable accuracy, certain genes showed below 50% sensitivity. For example, IL-17A showed 37% sensitivity and TBX21 showed 42% sensitivity. This does not necessarily mean they are not relevant in the pathogenesis of CeD; rather, their differential expression in PBMCs might not reflect their role in the pathogenesis of CeD.
IL-17A is a crucial proinflammatory cytokine secreted by Th17 cells in response to gluten in the context of CeD. In addition, IL-17A elevation in the intestinal mucosa has been shown to be related to villous atrophy in CeD patients, showing its relevance in the pathogenesis of the disease55. Moreover, high levels of IL-17A expression have been shown in duodenal biopsies in treated patients with CeD compared to controls56 and also in PBMCs55.
The TBX21 gene encodes for T-bet, a transcription factor responsible for the differentiation of Th1 cells. This transcription factor is induced by IL-15, an important cytokine for the development of villous atrophy. The induction of this transcription factor leads to the release of IFN-γ, which is relevant to the T helper 1 cell response55. This biological relevance was supported by studies in which the expression of T-bet was higher in PBMCs of CeD patients on a GFD57,55. The elevation of T-bet in CeD patients compared to controls was also shown in mucosal samples58.
IL-15 upregulation in the intestinal mucosa has been known to be the hallmark of CeD due to its multiple roles in the pathogenesis of the disease59. Due to its overexpression in the gut epithelium and in the lamina propria, IL-15 acts on multiple immune cells. For example, IL-15 blocks the ability of Foxp3+ regulatory T cells to regulate the immune response. In addition, IL-15 triggers cytotoxic T cells to kill epithelial cells. IL-15 is also associated with certain genes involved in pathways such as IgA production, T-cell receptor signaling, and antigen presentation. These pathways are relevant because they play a crucial role in the pathogenesis of CeD. It is worth noting that in the context of refractory CeD, IL-15 enhances the survival of NK-reprogrammed intraepithelial lymphocytes. This is done by IL-15 activating anti-apoptotic pathways and increasing their cell-killing ability. All these findings show the biological relevance of IL-15 in the pathogenesis of CeD. Moreover, they can explain the overexpression of IL-15 in PBMCs of CeD patients compared to controls55.
GzmB codes for a serine protease that is mainly stored in the granules of cytotoxic T cells and NK cells. It is also known to be transcriptionally regulated by IL-1560. GzmB was shown to be upregulated in PBMCs of CeD patients compared to controls55 as well as in CeD biopsies60. It is worth noting that the expression of GzmB inhibitor (protease inhibitor 9) was shown to be decreased in duodenal samples from CeD patients, increasing apoptosis of enterocytes mediated by GzmB61. These findings show the biological relevance of GzmB in the pathogenesis of CeD.
Certain genes, such as KIAA1109, TNFSF10, c-REL, TNFAIP3, TNFSF14, and HSPA1a, exhibited unexpected expression patterns that do not align with their roles in the pathogenesis of CeD. Currently, there is no literature out there that explains these unexpected gene expression patterns. Further functional studies are needed to understand their differential gene expression profile pattern and its relevance in the pathogenesis of CeD. In addition, further investigation needs to evaluate the impact of a gluten-free diet on differential gene expression profile. One possible explanation for some of these unexpected patterns of expression is the lack of strict adherence to a GFD. This may be due to the fact that most CeD patients have an incomplete awareness about which foods contain gluten62.
Despite the promise of this approach, major limitations need to be addressed for implementation in clinical practice. The most notable one is the inconsistency in cutoff values and testing procedure, which can cause different values of sensitivity for the same gene examined, such as in the case of UBE2L3. This gene had 2 different sensitivity values in two different studies (100% vs 52.9% in63,22, respectively). One of the likely reasons for this difference includes the normalization to a housekeeping gene in the RT-qPCR procedure. The UBE2L3 relative expression score was calculated from the intensity units of the two UBE2L3 probes and the GAPDH housekeeping gene using this formula:
2^((UBE2L3.1-UBE2L3.2)/GAPDH)
where UBE2L3.1 represents exon 5, common to all UBE2L3 variants, and UBE2L3.2 represents exon 4, which is found only for the UBE2L3 non-coding variant 2.
While in the second study22, they used a different formula:
(UBE2L3 Ct exon 4/Ct exon 5)
without normalization to a housekeeping gene. A housekeeping gene is a gene essential for cellular function and its expression should be sufficiently stable under the experimental conditions and cell types studied.64. Normalization is an important step to account for potential sources of variation, which likely caused the significant difference in sensitivity between the two studies.
Another gene, the TNFAIP3, was reported in two studies with different regulation patterns in CeD patients. In one study, TNFAIP3 mRNA expression was moderately lower in CeD patients than in controls and CeD patients on a GFD. While in another study, TNFAIP3 expression was higher in the PBMCs of CeD patients compared with controls. This is likely due to the different population of PBMCs addressed. One study addressed the PBMCs, while the other one focused solely on PBMs. The difference in the RT-qPCR technique, in which one study used a SYBR green master mix while the other study used TaqMan PCR, also accounts for the difference in expression patterns. Using a different housekeeping gene is another reason that may have led to this difference.
Not all studies reported the biological relevance of the genes tested or why the specific combination of certain genes was successful in diagnosis on the biological level. One example of this is NFE2, a key regulator of many genes involved in the differentiation of blood cells65. NFE2 was shown to be upregulated in PBMCs of CeD patients on GFD compared to controls. However, NFE2’s specific role in CeD pathogenesis is not clear and needs further investigation. Also, ABCA1 is a gene that stimulates cholesterol efflux from cholesterol-loaded macrophages, leading to High Density Lipoprotein (HDL) production. ABCA1 is also expressed in enterocytes66. ABCA1 was shown to be downregulated in PBMCs of CeD patients on a GFD compared to controls. However, the role and specific association of ABCA1 with CeD are not clear. This highlights gaps that need to be investigated for further reinforcement of the diagnostic approach.
Only two studies used Crohn’s patients as positive controls for further testing. More studies need to test the diagnostic approach on other disease controls, such as UC and Crohn’s disease. This is due to the similarity in clinical manifestations between these diseases and CeD.
The small sample sizes and, in some cases, non-representative populations, such as relatives used in the prospective study23, remain important limitations. Further studies need to use larger populations and consider the subtype of CeD studied, as most selected studies did not specify the subtype of CeD patients included. Not mentioning the duration of the GFD can affect the interpretation of the diagnostic accuracy results. This can be attributed to the effect of the duration of GFD on the patterns of gene expression profile. Thus, findings should be interpreted as preliminary evidence rather than definitive evidence of diagnostic accuracy till further studies address these limitations. Furthermore, standardization of the RT-qPCR technique and the housekeeping gene used is required for consistent and robust results. Further testing needs to be done on other subtypes of CeD and patients with the less frequent HLA–DQ8 haplotype in order to account for biological variability. Another important limitation that needs to be addressed is the lack of external validation, which might affect the interpretation of the results and their validity. Without independent confirmation, even high sensitivity/specificity can be unstable and misleading.
Overall, while leveraging differences in gene expression profiles offers significant promise in diagnosing CeD, key limitations need to be addressed for clinical practice implementation. Despite knowledge of its multiple contributions, the full complexity of gene regulation in the development of CeD remains to be fully discovered. Further functional studies will help us elucidate gene regulation’s role in CeD pathogenesis. They will also contribute to a more personalized and, importantly, less invasive approach to diagnose CeD.
Conclusion
Gene profiling of selected CeD-associated genes has demonstrated promising sensitivity and specificity in preliminary studies as a transformative tool for CeD diagnosis. Importantly, the differential gene expression profiles do not only have promising diagnostic performance but also align with key biological mechanisms that drive the pathogenesis of CeD. Nevertheless, addressing key limitations and gaps in knowledge is crucial for implementing the approach in clinical practice and maintaining reproducibility.
Acknowledgements
I would like to thank Luisa Fernandez, mentor from Oxford University for the guidance in the development of this research paper and for applying the search strategy across the databases Embase, Medline and Cochrane. I would also like to thank Konstantinos Mantzios, MD for the contribution of for being a second-reviewer during the study selection process, quality assessment, and manuscript revision.
Funding Sources
The author has no funding sources that supported the research and preparation of this article.
Declaration of Conflict of Interests
The author declares that there are no conflicts of interest regarding the publication of this article.
Registration and Protocol
This review has not been registered. The review protocol can be accessed in S1.
Supplementary Material
References
- L. Day. Proteins from land plants – potential resources for human nutrition and food security. Trends in Food Science & Technology. Vol. 32, pg. 25–42, 2013 https://doi.org/10.1016/j.tifs.2013.05.005 [↩] [↩]
- C. Salazar, J. M. García-Cárdenas, C. Paz-y-Miño. Understanding celiac disease from genetics to the future diagnostic strategies. Clinical Medicine Insights: Gastroenterology. Vol. 10, pg. 1179552217712249, 2017 https://doi.org/10.1177/1179552217712249 [↩] [↩] [↩] [↩] [↩] [↩] [↩]
- J.-M. Anaya, Y. Shoenfeld, A. Rojas-Villarraga, R. Levy, R. Cervera. Autoimmunity. From Bench to Bedside. 2013 [↩]
- M. Y. Hardy, A. K. Russell, L. M. Henneken, G. Tanner, F. Bekes, I. Brown, A. Motyer, S. W. Z. Olechnowicz, H. H. Reid, J. Rossjohn, J. A. Tye-Din. Purified oat protein can trigger acute symptoms linked to immune activation in coeliac disease patients but not histological deterioration. Gut. Vol. 74, pg. 906–917, 2025 https://doi.org/10.1136/gutjnl-2024-333589 [↩]
- B. Lebwohl, D. S. Sanders, P. H. R. Green. Coeliac disease. The Lancet. Vol. 391, pg. 70–81, 2018 https://doi.org/10.1016/S0140-6736(17)31796-8 [↩]
- Nijeboer, P., van Wanrooij, R. L. J., Tack, G. J., Mulder, C. J. J., & Bouma, G. (2013). Update on the diagnosis and management of refractory coeliac disease. Gastroenterology Research and Practice, 2013, 518483. https://doi.org/10.1155/2013/518483 [↩]
- M. Galatola, D. Cielo, C. Panico, P. Stellato, B. Malamisura, L. Carbone, C. Gianfrani, R. Troncone, L. Greco, R. Auricchio. Presymptomatic diagnosis of celiac disease in predisposed children: the role of gene expression profile. Journal of Pediatric Gastroenterology and Nutrition. Vol. 65, pg. 314–320, 2017 https://doi.org/10.1097/MPG.0000000000001519 [↩]
- M. Galatola, V. Izzo, D. Cielo, M. Morelli, G. Gambino, D. Zanzi, C. Strisciuglio, M. P. Sperandeo, L. Greco, R. Auricchio. Gene expression profile of peripheral blood monocytes: a step towards the molecular diagnosis of celiac disease? PLOS ONE. Vol. 8, pg. e74747, 2013 https://doi.org/10.1371/journal.pone.0074747 [↩] [↩] [↩] [↩]
- Page, M. J., McKenzie, J. E., Bossuyt, P. M., Boutron, I., Hoffmann, T. C., Mulrow, C. D., et al. (2021). The PRISMA 2020 statement: An updated guideline for reporting systematic reviews. BMJ, 372, n71. https://doi.org/10.1136/bmj.n71 [↩]
- S. Gómez-Aguililla, S. Farrais, N. López-Palacios, B. Arau, C. Senosiain, M. Corzo, N. Fernandez-Jimenez, Á. Ruiz-Carnicer, F. Fernández-Bañares, B. P. González-García, E. Tristán, A. Montero-Calle, M. Garranzo-Asensio, I. Casado, M. Pujals, J. M. Hernández, J. Infante-Menéndez, G. Roy, C. Sousa, C. Núñez. Diagnosis of celiac disease on a gluten-free diet: a multicenter prospective quasi-experimental clinical study. BMC Medicine. Vol. 23, pg. 182, 2025 https://doi.org/10.1186/s12916-025-04008-y [↩] [↩] [↩] [↩]
- M. Galatola, V. Izzo, D. Cielo, M. Morelli, G. Gambino, D. Zanzi, C. Strisciuglio, M. P. Sperandeo, L. Greco, R. Auricchio. Gene expression profile of peripheral blood monocytes: a step towards the molecular diagnosis of celiac disease? PLOS ONE. Vol. 8, pg. e74747, 2013 https://doi.org/10.1371/journal.pone.0074747 [↩] [↩] [↩]
- M. Galatola, D. Cielo, C. Panico, P. Stellato, B. Malamisura, L. Carbone, C. Gianfrani, R. Troncone, L. Greco, R. Auricchio. Presymptomatic diagnosis of celiac disease in predisposed children: the role of gene expression profile. Journal of Pediatric Gastroenterology and Nutrition. Vol. 65, pg. 314–320, 2017 https://doi.org/10.1097/MPG.0000000000001519 [↩] [↩] [↩]
- E. Khalkhal, M. Rezaei-Tavirani, N. Asri, F. Nobakht, S. Jahani-Sherafat, M. H. Haidari, M. Rostami-Nejad. Introducing new potential biomarkers for celiac disease among the genes extracted from general databases. Middle East Journal of Digestive Diseases. Vol. 14, pg. 192–199, 2022 https://doi.org/10.34172/mejdd.2022.272 [↩] [↩] [↩] [↩] [↩] [↩] [↩] [↩] [↩]
- N. Fernandez-Jimenez, J. R. Bilbao. Mendelian randomization analysis of celiac gwas reveals a blood expression signature with diagnostic potential in absence of gluten consumption. Human Molecular Genetics. Vol. 28, pg. 3037–3042, 2019 https://doi.org/10.1093/hmg/ddz113 [↩] [↩] [↩] [↩]
- M. Sangineto, G. Graziano, S. D’Amore, R. Salvia, G. Palasciano, C. Sabbà, M. Vacca, M. Cariello. Identification of peculiar gene expression profile in peripheral blood mononuclear cells (pbmc) of celiac patients on gluten free diet. PLOS ONE. Vol. 13, pg. e0197915, 2018 https://doi.org/10.1371/journal.pone.0197915 [↩] [↩] [↩] [↩] [↩] [↩] [↩] [↩] [↩] [↩] [↩] [↩] [↩]
- M. Galatola, V. Izzo, D. Cielo, M. Morelli, G. Gambino, D. Zanzi, C. Strisciuglio, M. P. Sperandeo, L. Greco, R. Auricchio. Gene expression profile of peripheral blood monocytes: a step towards the molecular diagnosis of celiac disease? PLOS ONE. Vol. 8, pg. e74747, 2013, https://doi.org/10.1371/journal.pone.0074747 [↩]
- . S. Gómez-Aguililla, S. Farrais, N. López-Palacios, B. Arau, C. Senosiain, M. Corzo, N. Fernandez-Jimenez, Á. Ruiz-Carnicer, F. Fernández-Bañares, B. P. González-García, E. Tristán, A. Montero-Calle, M. Garranzo-Asensio, I. Casado, M. Pujals, J. M. Hernández, J. Infante-Menéndez, G. Roy, C. Sousa, C. Núñez. Diagnosis of celiac disease on a gluten-free diet: a multicenter prospective quasi-experimental clinical study. BMC Medicine. Vol. 23, pg. 182, 2025, https://doi.org/10.1186/s12916-025-04008-y [↩]
- G. Trynka, K. A. Hunt, N. A. Bockett, J. Romanos, V. Mistry, A. Szperl, S. F. Bakker, M. T. Bardella, L. Bhaw-Rosun, G. Castillejo, E. G. De La Concha, R. C. De Almeida, K. R. M. Dias, C. C. Van Diemen, P. C. A. Dubois, R. H. Duerr, S. Edkins, L. Franke, K. Fransen, J. Gutierrez, G. A. R. Heap, B. Hrdlickova, S. Hunt, L. P. Izurieta, V. Izzo, L. A. B. Joosten, C. Langford, M. C. Mazzilli, C. A. Mein, V. Midah, M. Mitrovic, B. Mora, M. Morelli, S. Nutland, C. Núñez, S. Onengut-Gumuscu, K. Pearce, M. Platteel, I. Polanco, S. Potter, C. Ribes-Koninckx, I. Ricaño-Ponce, S. S. Rich, A. Rybak, J. L. Santiago, S. Senapati, A. Sood, H. Szajewska, R. Troncone, J. Varadé, C. Wallace, V. M. Wolters, A. Zhernakova, B. K. Thelma, B. Cukrowska, E. Urcelay, J. R. Bilbao, M. L. Mearin, D. Barisani, J. C. Barrett, V. Plagnol, P. Deloukas, C. Wijmenga, D. A. Van Heel. Dense genotyping identifies and localizes multiple common and rare variant association signals in celiac disease. Nature Genetics. Vol. 43, pg. 1193–1201, 2011, https://doi.org/10.1038/ng.998. [↩]
- J. Gopalakrishnan, K. L. Tessneer, Y. Fu, S. Pasula, R. C. Pelikan, J. A. Kelly, G. B. Wiley, P. M. Gaffney. Variants on the ube2l3/ydjc autoimmune disease risk haplotype increase ube2l3 expression by modulating ccctc-binding factor and yy1 binding. Arthritis & Rheumatology (Hoboken, N.J.). Vol. 74, pg. 163–173, 2022, https://doi.org/10.1002/art.41925. [↩]
- M. Galatola, D. Cielo, C. Panico, P. Stellato, B. Malamisura, L. Carbone, C. Gianfrani, R. Troncone, L. Greco, R. Auricchio. Presymptomatic diagnosis of celiac disease in predisposed children: the role of gene expression profile. Journal of Pediatric Gastroenterology and Nutrition. Vol. 65, pg. 314–320, 2017, https://doi.org/10.1097/MPG.0000000000001519. [↩]
- P. C. A. Dubois, G. Trynka, L. Franke, K. A. Hunt, J. Romanos, A. Curtotti, A. Zhernakova, G. A. R. Heap, R. Ádány, A. Aromaa, M. T. Bardella, L. H. Van Den Berg, N. A. Bockett, E. G. De La Concha, B. Dema, R. S. N. Fehrmann, M. Fernández-Arquero, S. Fiatal, E. Grandone, P. M. Green, H. J. M. Groen, R. Gwilliam, R. H. J. Houwen, S. E. Hunt, K. Kaukinen, D. Kelleher, I. Korponay-Szabo, K. Kurppa, P. MacMathuna, M. Mäki, M. C. Mazzilli, O. T. McCann, M. L. Mearin, C. A. Mein, M. M. Mirza, V. Mistry, B. Mora, K. I. Morley, C. J. Mulder, J. A. Murray, C. Ñez, E. Oosterom, R. A. Ophoff, I. Polanco, L. Peltonen, M. Platteel, A. Rybak, V. Salomaa, J. J. Schweizer, M. P. Sperandeo, G. J. Tack, G. Turner, J. H. Veldink, W. H. M. Verbeek, R. K. Weersma, V. M. Wolters, E. Urcelay, B. Cukrowska, L. Greco, S. L. Neuhausen, R. McManus, D. Barisani, P. Deloukas, J. C. Barrett, P. Saavalainen, C. Wijmenga, D. A. Van Heel. Multiple common variants for celiac disease influencing immune gene expression. Nature Genetics. Vol. 42, pg. 295–302, 2010, https://doi.org/10.1038/ng.543. [↩]
- S. Gómez-Aguililla, S. Farrais, N. López-Palacios, B. Arau, C. Senosiain, M. Corzo, N. Fernandez-Jimenez, Á. Ruiz-Carnicer, F. Fernández-Bañares, B. P. González-García, E. Tristán, A. Montero-Calle, M. Garranzo-Asensio, I. Casado, M. Pujals, J. M. Hernández, J. Infante-Menéndez, G. Roy, C. Sousa, C. Núñez. Diagnosis of celiac disease on a gluten-free diet: a multicenter prospective quasi-experimental clinical study. BMC Medicine. Vol. 23, pg. 182, 2025 https://doi.org/10.1186/s12916-025-04008-y [↩] [↩] [↩] [↩]
- M. Galatola, D. Cielo, C. Panico, P. Stellato, B. Malamisura, L. Carbone, C. Gianfrani, R. Troncone, L. Greco, R. Auricchio. Presymptomatic diagnosis of celiac disease in predisposed children: the role of gene expression profile. Journal of Pediatric Gastroenterology and Nutrition. Vol. 65, pg. 314–320, 2017 https://doi.org/10.1097/MPG.0000000000001519 [↩] [↩] [↩]
- P. C. A. Dubois, G. Trynka, L. Franke, K. A. Hunt, J. Romanos, A. Curtotti, A. Zhernakova, G. A. R. Heap, R. Ádány, A. Aromaa, M. T. Bardella, L. H. Van Den Berg, N. A. Bockett, E. G. De La Concha, B. Dema, R. S. N. Fehrmann, M. Fernández-Arquero, S. Fiatal, E. Grandone, P. M. Green, H. J. M. Groen, R. Gwilliam, R. H. J. Houwen, S. E. Hunt, K. Kaukinen, D. Kelleher, I. Korponay-Szabo, K. Kurppa, P. MacMathuna, M. Mäki, M. C. Mazzilli, O. T. McCann, M. L. Mearin, C. A. Mein, M. M. Mirza, V. Mistry, B. Mora, K. I. Morley, C. J. Mulder, J. A. Murray, C. Ñez, E. Oosterom, R. A. Ophoff, I. Polanco, L. Peltonen, M. Platteel, A. Rybak, V. Salomaa, J. J. Schweizer, M. P. Sperandeo, G. J. Tack, G. Turner, J. H. Veldink, W. H. M. Verbeek, R. K. Weersma, V. M. Wolters, E. Urcelay, B. Cukrowska, L. Greco, S. L. Neuhausen, R. McManus, D. Barisani, P. Deloukas, J. C. Barrett, P. Saavalainen, C. Wijmenga, D. A. Van Heel. Multiple common variants for celiac disease influencing immune gene expression. Nature Genetics. Vol. 42, pg. 295–302, 2010 https://doi.org/10.1038/ng.543 [↩]
- G. Trynka, K. A. Hunt, N. A. Bockett, J. Romanos, V. Mistry, A. Szperl, S. F. Bakker, M. T. Bardella, L. Bhaw-Rosun, G. Castillejo, E. G. De La Concha, R. C. De Almeida, K. R. M. Dias, C. C. Van Diemen, P. C. A. Dubois, R. H. Duerr, S. Edkins, L. Franke, K. Fransen, J. Gutierrez, G. A. R. Heap, B. Hrdlickova, S. Hunt, L. P. Izurieta, V. Izzo, L. A. B. Joosten, C. Langford, M. C. Mazzilli, C. A. Mein, V. Midah, M. Mitrovic, B. Mora, M. Morelli, S. Nutland, C. Núñez, S. Onengut-Gumuscu, K. Pearce, M. Platteel, I. Polanco, S. Potter, C. Ribes-Koninckx, I. Ricaño-Ponce, S. S. Rich, A. Rybak, J. L. Santiago, S. Senapati, A. Sood, H. Szajewska, R. Troncone, J. Varadé, C. Wallace, V. M. Wolters, A. Zhernakova, B. K. Thelma, B. Cukrowska, E. Urcelay, J. R. Bilbao, M. L. Mearin, D. Barisani, J. C. Barrett, V. Plagnol, P. Deloukas, C. Wijmenga, D. A. Van Heel. Dense genotyping identifies and localizes multiple common and rare variant association signals in celiac disease. Nature Genetics. Vol. 43, pg. 1193–1201, 2011 https://doi.org/10.1038/ng.998 [↩]
- J. Gopalakrishnan, K. L. Tessneer, Y. Fu, S. Pasula, R. C. Pelikan, J. A. Kelly, G. B. Wiley, P. M. Gaffney. Variants on the ube2l3/ydjc autoimmune disease risk haplotype increase ube2l3 expression by modulating ccctc-binding factor and yy1 binding. Arthritis & Rheumatology (Hoboken, N.J.). Vol. 74, pg. 163–173, 2022 https://doi.org/10.1002/art.41925 [↩]
- N. Fernandez-Jimenez, J. R. Bilbao. Mendelian randomization analysis of celiac gwas reveals a blood expression signature with diagnostic potential in absence of gluten consumption. Human Molecular Genetics. Vol. 28, pg. 3037–3042, 2019 https://doi.org/10.1093/hmg/ddz113 [↩]
- D. Cielo, M. Galatola, N. Fernandez-Jimenez, L. De Leo, K. Garcia-Etxebarria, C. Loganes, A. Tommasini, T. Not, R. Auricchio, L. Greco, J. R. Bilbao. Combined analysis of methylation and gene expression profiles in separate compartments of small bowel mucosa identified celiac disease patients’ signatures. Scientific Reports. Vol. 9, pg. 1–12, 2019 https://doi.org/10.1038/s41598-019-46468-2 [↩] [↩] [↩] [↩] [↩] [↩]
- B. Banaganapalli, O. Rashidi, O. I. Saadah, J. Wang, I. A. Khan, J. Y. Al-Aama, N. A. Shaik, R. Elango. Comprehensive computational analysis of gwas loci identifies ccr2 as a candidate gene for celiac disease pathogenesis. Journal of Cellular Biochemistry. Vol. 118, pg. 2193–2207, 2017 https://doi.org/10.1002/jcb.25864 [↩]
- N. Tamehiro, K. Nishida, R. Yanobu-Takanashi, M. Goto, T. Okamura, H. Suzuki. T-cell activation rhogtpase-activating protein plays an important role in t h 17-cell differentiation. Immunology and Cell Biology. Vol. 95, pg. 729–735, 2017 https://doi.org/10.1038/icb.2017.27 [↩]
- N. V. Ribeiro, S. Anwar, S. Withoff, I. H. Jonkers. Shared genetics in celiac disease and inflammatory bowel disease specify a greater role for intestinal epithelial cells. International Journal of Molecular Sciences. Vol. 26, pg. 2982, 2025 https://doi.org/10.3390/ijms26072982 [↩]
- R. Mandile, M. F. Di Tolla, M. Carpinelli, J. N. Samsom, R. De Cegli, M. V. Barone, R. Troncone, P. Formisano, L. Greco, R. Auricchio. A set of serum proteomic biomarkers differentiates celiac children from age and human leukocyte antigen‐matched healthy controls. Journal of Pediatric Gastroenterology and Nutrition. Vol. 82, pg. 508–515, 2026 https://doi.org/10.1002/jpn3.70261 [↩]
- B. Oppmann, R. Lesley, B. Blom, J. C. Timans, Y. Xu, B. Hunte, F. Vega, N. Yu, J. Wang, K. Singh, F. Zonin, E. Vaisberg, T. Churakova, M. Liu, D. Gorman, J. Wagner, S. Zurawski, Y.-J. Liu, J. S. Abrams, K. W. Moore, D. Rennick, R. De Waal-Malefyt, C. Hannum, J. F. Bazan, R. A. Kastelein. Novel p19 protein engages il-12p40 to form a cytokine, il-23, with biological activities similar as well as distinct from il-12. Immunity. Vol. 13, pg. 715–725, 2000 https://doi.org/10.1016/S1074-7613(00)00070-4 [↩]
- K. M. Harris, A. Fasano, D. L. Mann. Cutting edge: il-1 controls the il-23 response induced by gliadin, the etiologic agent in celiac disease. Journal of Immunology (Baltimore, Md. : 1950). Vol. 181, pg. 4457–4460, 2008 https://doi.org/10.4049/jimmunol.181.7.4457 [↩]
- Hisamatsu T, Erben U, Kühl AA. The role of T-cell subsets in chronic inflammation in celiac disease and inflammatory bowel disease patients: more common mechanisms or more differences? Inflamm Intest Dis. 2016;1(2):52-62. 10.1159/000445133. [↩]
- Harris KM, Fasano A, Mann DL. Cutting Edge: IL-1 controls the IL-23 response induced by gliadin, the etiologic agent in celiac disease. J Immunol. 2008;181(7):4457-4460. 10.4049/jimmunol.181.7.4457. [↩]
- Lim KS, Yong ZWE, Wang H, Tan TZ, Huang RYJ, Yamamoto D, et al. Inflammatory and mitogenic signals drive interleukin 23 subunit alpha (IL23A) secretion independent of IL12B in intestinal epithelial cells. J Biol Chem. 2020;295(19):6387-6400. 10.1074/jbc.RA120.012943. [↩]
- M. Sangineto, G. Graziano, S. D’Amore, R. Salvia, G. Palasciano, C. Sabbà, M. Vacca, M. Cariello. Identification of peculiar gene expression profile in peripheral blood mononuclear cells (pbmc) of celiac patients on gluten free diet. PLOS ONE. Vol. 13, pg. e0197915, 2018 https://doi.org/10.1371/journal.pone.0197915 [↩] [↩] [↩] [↩]
- J. Partanen, C. Milner, R. D. Campbell, M. Mäki, V. Lipsanen, S. Koskimies. HLA‐linked heat‐shock protein 70 (hsp70–2) gene polymorphism and celiac disease. Tissue Antigens. Vol. 41, pg. 15–19, 1993 https://doi.org/10.1111/j.1399-0039.1993.tb01971.x [↩]
- M. E. B. FitzPatrick, A. Antanaviciute, M. Dunstan, K. Künnapuu, D. Trzupek, N. M. Provine, K. Dooley, J.-Y. Zhang, S. L. Irwin, L. C. Garner, J. I. Pernes, R. C. Ferreira, S. C. Sasson, D. Aschenbrenner, D. Agarwal, A. Rodrigues, L. Howarth, O. Brain, D. Ruane, E. Soilleux, S. A. Teichmann, C. A. Dendrou, A. Simmons, H. H. Uhlig, J. A. Todd, P. Klenerman. Immune–epithelial–stromal networks define the cellular ecosystem of the small intestine in celiac disease. Nature Immunology. Vol. 26, pg. 947–962, 2025 https://doi.org/10.1038/s41590-025-02146-2 [↩]
- Y. Yao, Ł. Wyrozżemski, K. E. A. Lundin, G. K. Sandve, S.-W. Qiao. Differential expression profile of gluten-specific t cells identified by single-cell rna-seq. PLOS ONE. Vol. 16, pg. e0258029, 2021 https://doi.org/10.1371/journal.pone.0258029 [↩]
- E. M. Domsa, I. Berindan-Neagoe, L. Budisan, C. Braicu, I. Para, A. I. Tantau, O. H. Orasan, L. Ciobanu, T. A. Pop, G. A. Filip, N. Leach, V. Negrean, D. Matei, V. Andreica. Expression of selected genes and circulating micrornas in patients with celiac disease. Medicina (Lithuania). Vol. 58, 2022 https://doi.org/10.3390/medicina58020180 [↩]
- E. Broide, E. Scapa, O. Bloch, M. Shapiro, N. A. Kimchi, G. Ben-Yehudah, M. J. Rapoport. Evidence for aberrant regulation of map kinase signal transduction pathway in peripheral blood mononuclear cells in patients with active celiac disease. Digestive Diseases and Sciences. Vol. 54, pg. 1270–1275, 2009 https://doi.org/10.1007/s10620-008-0480-y [↩]
- D. Talipova, A. Smagulova, D. Poddighe. Toll-like receptors and celiac disease. International Journal of Molecular Sciences. Vol. 24, pg. 265, 2022 https://doi.org/10.3390/ijms24010265 [↩]
- M. Kalliomäki, R. Satokari, H. Lähteenoja, S. Vähämiko, J. Grönlund, T. Routi, S. Salminen. Expression of microbiota, toll-like receptors, and their regulators in the small intestinal mucosa in celiac disease. Journal of Pediatric Gastroenterology and Nutrition. Vol. 54, pg. 727–732, 2012 https://doi.org/10.1097/MPG.0b013e318241cfa8 [↩]
- G. Goel, A. J. M. Daveson, C. E. Hooi, J. A. Tye-Din, S. Wang, E. Szymczak, L. J. Williams, J. L. Dzuris, K. M. Neff, K. E. Truitt, R. P. Anderson. Serum cytokines elevated during gluten-mediated cytokine release in coeliac disease. Clinical and Experimental Immunology. Vol. 199, pg. 68–78, 2019 https://doi.org/10.1111/cei.13369 [↩]
- M. Sangineto, G. Graziano, S. D’Amore, R. Salvia, G. Palasciano, C. Sabbà, M. Vacca, M. Cariello. Identification of peculiar gene expression profile in peripheral blood mononuclear cells (pbmc) of celiac patients on gluten free diet. PLOS ONE. Vol. 13, pg. e0197915, 2018https://doi.org/10.1371/journal.pone.0197915 [↩]
- A. Di Sabatino, K. M. Pickard, J. N. Gordon, V. Salvati, G. Mazzarella, R. M. Beattie, A. Vossenkaemper, L. Rovedatti, N. A. B. Leakey, N. M. Croft, R. Troncone, G. R. Corazza, A. J. Stagg, G. Monteleone, T. T. MacDonald. Evidence for the role of interferon-alfa production by dendritic cells in the th1 response in celiac disease. Gastroenterology. Vol. 133, pg. 1175–1187, 2007 https://doi.org/10.1053/j.gastro.2007.08.018 [↩]
- V. Discepolo, G. Lania, M. L. G. Ten Eikelder, M. Nanayakkara, L. Sepe, R. Tufano, R. Troncone, S. Auricchio, R. Auricchio, G. Paolella, M. V. Barone. Pediatric celiac disease patients show alterations of dendritic cell shape and actin rearrangement. International Journal of Molecular Sciences. Vol. 22, pg. 2708, 2021 https://doi.org/10.3390/ijms22052708 [↩]
- M. Rakhimova, B. Esslinger, A. Schulze-Krebs, E. G. Hahn, D. Schuppan, W. Dieterich. In vitro differentiation of human monocytes into dendritic cells by peptic–tryptic digest of gliadin is independent of genetic predisposition and the presence of celiac disease. Journal of Clinical Immunology. Vol. 29, pg. 29–37, 2009 https://doi.org/10.1007/s10875-008-9228-x [↩]
- A. De Oliveira Matos, P. Henrique Dos Santos Dantas, J. Rodrigues Do Carmo Neto, M. T. Contreras Colmenares, A. G. Felice, S. De Castro Soares, M. Silva-Sales, H. Sales-Campos. Uncovering the role of trem-1 in celiac disease: in silico insights into the recognition of gluten-derived peptides and inflammatory mechanisms. Computers in Biology and Medicine. Vol. 189, pg. 109981, 2025 https://doi.org/10.1016/j.compbiomed.2025.109981 [↩] [↩]
- H. Ghasiyari, M. Rostami-Nejad, D. Amani, K. Rostami, M. A. Pourhoseingholi, H. Asadzadeh-Aghdaei, M. R. Zali. Diverse profiles of toll-like receptors 2, 4, 7, and 9 mrna in peripheral blood and biopsy specimens of patients with celiac disease. Journal of Immunology Research. Vol. 2018, pg. 7587095, 2018 https://doi.org/10.1155/2018/7587095 [↩]
- J. W. Ford, D. W. McVicar. TREM and trem-like receptors in inflammation and disease. Current Opinion in Immunology. Vol. 21, pg. 38–46, 2009 https://doi.org/10.1016/j.coi.2009.01.009 [↩]
- A. Yoshimura, D. Aki, M. Ito. Socs, spred, and nr4a: negative regulators of cytokine signaling and transcription in immune tolerance. Proceedings of the Japan Academy Series B: Physical and Biological Sciences. Vol. 97, pg. 277–291, 2021 https://doi.org/10.2183/pjab.97.016 [↩]
- E. Khalkhal, M. Rezaei-Tavirani, N. Asri, F. Nobakht, S. Jahani-Sherafat, M. H. Haidari, M. Rostami-Nejad. Introducing new potential biomarkers for celiac disease among the genes extracted from general databases. Middle East Journal of Digestive Diseases. Vol. 14, pg. 192–199, 2022 https://doi.org/10.34172/mejdd.2022.272 [↩] [↩] [↩] [↩] [↩] [↩]
- M. Faghih, M. Rostami-Nejad, D. Amani, A. Sadeghi, M. A. Pourhoseingholi, A. Masotti, M. R. Zali. Analysis of il17a and il21 expression in the small intestine of celiac disease patients and correlation with circulating thioredoxin level. Genetic Testing and Molecular Biomarkers. Vol. 22, pg. 518–525, 2018 https://doi.org/10.1089/gtmb.2018.0128 [↩]
- G. Frisullo, V. Nociti, R. Iorio, A. K. Patanella, D. Plantone, A. Bianco, A. Marti, G. Cammarota, P. A. Tonali, A. P. Batocchi. T-bet and pstat-1 expression in pbmc from coeliac disease patients: new markers of disease activity. Clinical and Experimental Immunology. Vol. 158, pg. 106–114, 2009 https://doi.org/10.1111/j.1365-2249.2009.03999.x [↩]
- I. Monteleone, G. Monteleone, G. Del Vecchio Blanco, P. Vavassori, S. Cucchiara, T. T. MacDonald, F. Pallone. Regulation of the t helper cell type 1 transcription factor t-bet in coeliac disease mucosa. Gut. Vol. 53, pg. 1090–1095, 2004 https://doi.org/10.1136/gut.2003.030551 [↩]
- V. Abadie, B. Jabri. IL ‐15: a central regulator of celiac disease immunopathology. Immunological Reviews. Vol. 260, pg. 221–234, 2014 https://doi.org/10.1111/imr.12191 [↩]
- J.-J. Mention, M. Ben Ahmed, B. Bègue, U. Barbe, V. Verkarre, V. Asnafi, J. Colombel, P. Cugnenc, F. M. Ruemmele, E. Mcintyre, N. Brousse, C. Cellier, N. Cerf-Bensussan. Interleukin 15: a key to disrupted intraepithelial lymphocyte homeostasis and lymphomagenesis in celiac disease. Gastroenterology. Vol. 125, pg. 730–745, 2003 https://doi.org/10.1016/S0016-5085(03)01047-3 [↩] [↩]
- V.-M. Pohjanen, T. S. Kokkonen, M. Arvonen, M. A. Augustin, M. Patankar, S. Turunen, P. Vähäsalo, T. J. Karttunen. Decreased expression of protease inhibitor 9, a granzyme b inhibitor, in celiac disease: a potential mechanism in enterocyte destruction and villous atrophy. International Journal of Immunopathology and Pharmacology. Vol. 26, pg. 897–905, 2013 https://doi.org/10.1177/039463201302600408 [↩]
- J. A. Silvester, D. Weiten, L. A. Graff, J. R. Walker, D. R. Duerksen. Is it gluten-free? relationship between self-reported gluten-free diet adherence and knowledge of gluten content of foods. Nutrition. Vol. 32, pg. 777–783, 2016 https://doi.org/10.1016/j.tig.2013.05.010 [↩]
- N. Fernandez-Jimenez, J. R. Bilbao. Mendelian randomization analysis of celiac gwas reveals a blood expression signature with diagnostic potential in absence of gluten consumption. Human Molecular Genetics. Vol. 28, pg. 3037–3042, 2019 https://doi.org/10.1093/hmg/ddz113 [↩]
- E. Eisenberg, E. Y. Levanon. Human housekeeping genes, revisited. Trends in Genetics. Vol. 29, pg. 569–574, 2013 https://doi.org/10.1016/j.tig.2013.05.010 [↩]
- J. J. Gasiorek, V. Blank. Regulation and function of the nfe2 transcription factor in hematopoietic and non-hematopoietic cells. Cellular and Molecular Life Sciences. Vol. 72, pg. 2323–2335, 2015 https://doi.org/10.1007/s00018-015-1866-6 [↩]
- A. R. Tall, N. Wang. New insights into cholesterol efflux via abca1. Nature Cardiovascular Research. Vol. 1, pg. 198–199, 2022 https://doi.org/10.1038/s44161-022-00036-6 [↩]