
Abstract
Many California high schools have started offering data science classes. However, there is uncertainty about whether offering these classes at high schools makes a difference when applying to college. We studied whether a high school offering data science courses increases the rate at which its students are admitted to the University of California (UC). We analyzed admissions data from hundreds of California public high schools from 2020 to 2024. First, a hierarchical bootstrap model was used to adjust for school differences, including GPA and demographics. Second, a difference-in-differences analysis compared admission rates before and after schools started offering data science classes. Finally, a machine learning model was used to make admissions predictions beyond those provided by explanatory models. We found that schools offering data science courses had higher UC admission rates. Offering high school data science classes may be linked to improved university admissions across the school.
Keywords: Data Science, University Admissions, High School Courses, Machine Learning
Introduction
Data science skills have become increasingly important for college readiness and success1. However, most high schools still focus on traditional math courses, such as Algebra and Calculus, which may not fully prepare students for the analytical demands of modern college. Traditional math pathways may provide less direct exposure to skills such as analyzing real-world data, coding, and working with large datasets, which universities have increasingly valued2’3. Previous research has shown how these gaps in math education can negatively affect students’ readiness for college-level science, technology, engineering, and mathematics (STEM) programs4’5.
Recently, many high schools across California have started offering data science courses as an addition to traditional math pathways6’7. These classes emphasize quantitative skills, including data analysis, coding, and using technology to solve problems8’9. Previous research suggests that early exposure to these courses could boost student engagement and academic performance in STEM subjects. Some studies suggest these courses benefit students from groups that have historically struggled to access advanced STEM education10. Additionally, due to the broader reach that data science has for career paths, it provides students with skills that can help in any field beyond just STEM fields, which current mathematics is built for.
Yet, we still need clear evidence on how much adding these data science classes to a school’s curriculum helps students when they apply to college6. This makes it difficult for schools to prioritize data science and justify curricular changes. To better understand this, we examine California high schools and their students’ admission rates to the UC system.
Because our treatment is measured at the school level (whether a high school offers an A–G approved data science course) and our outcome is the UC admission rate among that school’s UC applicants, we interpret course adoption as a change in the school’s academic opportunity set rather than as an individual-level measure of course-taking. Offering data science could influence the admission rate among applicants through several non-mutually-exclusive pathways: it may directly strengthen the academic profile of students who enroll (for example through demonstrated quantitative preparation and project-based work), it may generate spillovers and pathway effects that shape course planning and quantitative preparation for a broader group of UC-bound students beyond the enrolled section, it may change application behavior and the composition of the applicant pool (for example who applies and how prepared applicants are), and it may co-occur with other school improvements that affect applicant outcomes.
We focused on answering three key questions:
- Are schools that offer data science courses associated with higher UC admission rates, even after controlling for factors like student GPA, demographics, and socioeconomic status?
- Do schools experience higher UC admission rates after introducing data science courses, relative to schools that do not?
- Can the presence of data science courses and other school characteristics predict future university admission outcomes?
These three questions map to complementary explanatory, quasi-causal, and predictive analyses that we use to triangulate the role of data science course availability11.
Our findings can inform curriculum decisions at schools and provide context for students and counselors considering how data science fits into a college-preparatory pathway. The goal of our study is to help schools understand whether offering data science courses improves admission rates. Given the limitations in available data and potential biases in school-level data collection, our findings will specifically focus on observable admission outcomes rather than individual student experiences. We applied a combined analytical approach, using hierarchical modeling, difference-in-differences analyses, and machine learning techniques, to robustly examine these questions.
Methods
For our study, we aim to determine whether offering data science courses in high school affects school-wide college application admissions, particularly to the UC system. To achieve this, we examine high schools across California, as the state provides detailed data on schools, courses, and college admissions. California’s diversity also allows us to consider equity implications in our findings.
Data Sources
First, we employ data from the California Department of Education and the University of California Office of the President:
- California Department of Education (CDE)12’13’14:
- School Directory Data: School-level demographic data.Enrollment Data: Student enrollment counts.
- Percentage Eligible for Free or Reduced-Price Meals Data: An indicator of socioeconomic status (SES).
- University of California Office of the President (UCOP)15’16:
- Admissions Data: School-level numbers of applicants and admitted students.
- Course Data: Detailed listings of A–G approved high school courses.
The CDE records are from the 2023–2024 academic year. The UCOP data cover the academic years 2020–2021 through 2023–2024, except that we include course-offering records from 2017–2018 through 2023–2024 to match every admissions year with four years of data science offerings. Each admissions cohort reflects students who applied in the previous fall, received decisions in the spring, and enrolled in the fall. For example, the 2023–2024 cohort applied in fall 2023, received decisions in spring 2024, and enrolled in fall 2024.
Our dataset has 682 high schools from 155 districts, resulting in 2,649 observations, as each school has data for multiple years. We only include California public high schools serving grades 9 through 12 that had at least one student apply to UC each year, excluding juvenile court schools, adult education programs, and continuation schools. We remove any records with missing demographic, grade point average (GPA), SES, or enrollment data. Our unit of analysis is a school in a given year. We only have access to school-wide information as individual student records are unavailable.
Data Preparation
We calculate our primary variable, the UC admission rate, by dividing the number of students from each high school who were admitted by the number of students who applied. To analyze this data better, we transform it mathematically using where is the proportion of applicants admitted to UC from each school.
We identify whether each school offered data science courses, as well as other rigorous courses such as Engineering, Robotics, Cybersecurity, Biotechnology, and Entrepreneurship, based on the UC-approved course lists. UCOP does not provide data on the number of sections or how many students took these courses. We specifically include these courses to measure the unique impact of data science classes accurately. We also control for factors that influence admission rates, such as average GPA, charter school status, school size, ethnicity, and socioeconomic status. Additionally, we account for changes over time, like policy updates or impacts from the COVID-19 pandemic17.
We group our observations by school district because districts oversee staffing, curriculum choices, resource use, and how programs are started—factors that significantly impact both courses offered and admission outcomes. Grouping by districts helps us capture these systematic influences more accurately, allowing us to draw more specific and relevant conclusions.
Ethics
We ensure compliance with ethical standards throughout our study. We strictly adhere to privacy guidelines by anonymizing all school-level data. We use no individual student data, ensuring confidentiality and privacy protection. All data comply with ethical guidelines and privacy regulations. The UCOP provides course data in bulk under an agreement that restricts sharing, although individual course listings remain publicly accessible.
Analysis
We analyze the data in three ways:
- Bootstrap Analysis: We employ hierarchical mixed-effects models to assess whether data science courses relate to higher admission rates while carefully controlling for the clustering of schools within districts (research question 1).
- Difference-in-Differences Analysis: We compare schools before and after they introduced data science courses, relative to those that never offered such courses, to see if admissions rates improved specifically because of the new courses (research question 2).
- Machine learning: We use a Random Forest regression model to see how accurately we can predict UC admission rates based on school characteristics and courses offered (research question 3).
By using multiple methods, we ensure that our findings are robust and and can inform discussions about whether high schools may benefit from offering data science courses to better support students’ college applications.
Reproducibility details
To reproduce the results, begin with the UCOP school-by-year admissions data, the UC A–G course list by school and year, and school covariates from the California Department of Education, merged by CDS code as described in Sections 2.1–2.3. The outcome is the UC admission rate at the school-year level (admits/applicants); for the hierarchical model, we use a logit transform, log(adm_rate/(1−adm_rate)). For the mixed-effects model, we estimate a random-intercept model with districts as the grouping unit (random intercept at the district level) and the fixed-effect covariates plus year indicators. Bootstrap confidence intervals are based on 10,000 successful bootstrap repetitions, where a repetition is counted as successful only if the model converges; the reported 95% intervals use the empirical 2.5th and 97.5th percentiles of the bootstrap coefficient distribution. For the DiD analysis, “treated” indicates schools that ever adopt data science during the panel, “post” indicates years at or after the first adoption year for treated schools, and the DiD estimator is the treated × post interaction; standard errors are clustered at the district level. For the predictive model, we fit a Random Forest regressor and evaluate performance using nested cross-validation; the outer loop produces the reported mean and standard deviation of R², RMSE, and MAE across folds. Due to data-use restrictions on UCOP-provided files, raw data cannot be posted publicly.
Results
Descriptive Statistics
| Variable | Mean | Std Dev | Median | Minimum | Maximum |
| University Admission Rate | 0.68 | 0.10 | 0.67 | 0.35 | 1.00 |
| Course Offerings | |||||
| Data Science Course Offered | 0.18 | 0.39 | 0.00 | 0.00 | 1.00 |
| Biotechnology Course Offered | 0.17 | 0.38 | 0.00 | 0.00 | 1.00 |
| Cybersecurity Course Offered | 0.26 | 0.44 | 0.00 | 0.00 | 1.00 |
| Engineering Course Offered | 0.68 | 0.47 | 1.00 | 0.00 | 1.00 |
| Entrepreneurship Course Offered | 0.29 | 0.45 | 0.00 | 0.00 | 1.00 |
| Robotics Course Offered | 0.28 | 0.45 | 0.00 | 0.00 | 1.00 |
| School Characteristics | |||||
| Average School GPA | 3.81 | 0.15 | 3.83 | 3.12 | 4.17 |
| Charter School Status | 0.11 | 0.32 | 0.00 | 0.00 | 1.00 |
| Enrollment Size (Hundreds) | 16.15 | 7.34 | 16.85 | 0.55 | 44.64 |
| Percent Asian Students | 0.10 | 0.14 | 0.04 | 0.00 | 0.80 |
| Percent Black Students | 0.05 | 0.06 | 0.02 | 0.00 | 0.53 |
| Percent Hispanic Students | 0.57 | 0.26 | 0.56 | 0.04 | 0.99 |
| Percent Female Students | 0.48 | 0.04 | 0.48 | 0.20 | 0.78 |
| Socioeconomic Status | 0.61 | 0.25 | 0.65 | 0.05 | 0.99 |
Descriptive statistics (mean, standard deviation, median, min, max) for UC admission rates, course offerings, and school covariates across the analytic school-year sample.
Table 1 presents basic information about the variables we studied, including average admission rates and the frequency of different courses offered. For example, about 18% of the schools offered data science courses.
Bootstrap Analysis
We use hierarchical mixed-effects models to investigate the relationship between offering data science courses and UC admission rates18. This type of model enables us to account for the fact that schools within the same district often share similar characteristics, such as resources, curriculum, and student demographics. To ensure the reliability of our findings, we repeat our analysis 10,000 times (i.e., a bootstrap analysis), thereby estimating the accuracy of our results19.
Mathematically, the model is specified as:
![\[{logit}(p_{ij}) = \beta_0 + \beta_1 X_{ij} + u_j + \varepsilon_{ij}\]](https://nhsjs.com/wp-content/ql-cache/quicklatex.com-eeda52c547979c461496e0b5216f8fdf_l3.png "Rendered by QuickLaTeX.com")
where:
 is the logit-transformed admission rate for the school,
 represents the set of control variables (course offerings, demographics, GPA, etc.),
 and
and  are the intercept and fixed-effect regression coefficients,
 captures randomness at the district level, and
 is the residual error term.
Table 2 shows these results. We find that schools offering data science courses have higher UC admission rates. The coefficient 0.15 corresponds to an odds ratio (OR) of 1.16 (about 16% higher odds of admission among UC applicants at the school level), indicating a positive association between offering data science and higher admission rates. The 95% confidence interval on the log-odds scale (CI [0.04, 0.26]) corresponds to ORs of approximately [1.04, 1.29], which implies roughly 4% to 29% higher odds of admission. Most factors, such as Biotechnology or Robotics courses, do not show significant effects (meaning they likely do not influence UC admission rates significantly compared to data science courses). However, factors such as average school GPA, percentages of Asian, Black, and Hispanic students, Socioeconomic Status, Enrollment Size, and specific years (2021-2022, 2023-2024) are significantly associated with admission rates. The year indicators, including the notable shifts in 2021–2022 and 2023–2024, are included to absorb statewide, time-varying shifts in UC admissions competitiveness and policy context that may have affected all schools, such as COVID-era disruptions that were especially salient for 2021–2022 cohorts20 and UC’s systemwide suspension of SAT/ACT use through fall 2024, as well as systemwide changes in admission offers in the fall 2024 cycle21; accordingly, we do not interpret these coefficients as causal effects of any single external event. UC’s comprehensive review evaluates applicants in the context of opportunities available at their high school, which is consistent with treating these year indicators as controls for systemwide context rather than causal effects22’23.
We find that approximately 9.5% of the differences in UC admission rates are attributed to variations between districts (intraclass correlation coefficient = 0.095). This means that grouping by district is vital because schools within a district are more alike, which helps make our findings more accurate. Our model also has good fit statistics, indicating that it was reliable and accurately represented the data. Specifically, our model’s fixed effects explain about 25.2% of the variation in admission rates (marginal R²), and when including district-level random effects, our model accounts for 32.9% of the variation (conditional R²). We also examine whether factors such as student demographics or school GPA influenced the impact of data science courses on admissions. None of these interactions is significant, indicating that the positive effect of offering data science courses is consistent across different school characteristics, such as race, socioeconomic status, and gender24. This suggests no evidence of meaningful effect heterogeneity across these school characteristics in the interaction models, although we explore subgroup estimates descriptively in Section 3.4.
| Variable | UnstandardizedCoefficients | Bootstrap SE | 95% CI Lower Bound | 95% CI Upper Bound |
| Intercept | -1.72 | 3.62 | -10.73 | 0.00 |
| Course Offerings | ||||
| Data Science Course Offered | 0.15* | 0.06 | 0.04 | 0.26 |
| Biotechnology Course Offered | -0.06 | 0.04 | -0.14 | 0.03 |
| Cybersecurity Course Offered | 0.04 | 0.06 | -0.07 | 0.17 |
| Engineering Course Offered | -0.01 | 0.06 | -0.13 | 0.10 |
| Entrepreneurship Course Offered | 0.02 | 0.06 | -0.09 | 0.14 |
| Robotics Course Offered | -0.01 | 0.06 | -0.12 | 0.13 |
| School Characteristics | ||||
| Average School GPA | 2.25* | 0.30 | 1.66 | 2.86 |
| Charter School Status | 0.20 | 0.14 | -0.07 | 0.49 |
| Enrollment Size (Hundreds) | -0.02* | 0.01 | -0.03 | -0.01 |
| Percent Asian Students | 1.24* | 0.32 | 0.67 | 1.91 |
| Percent Black Students | 0.96* | 0.26 | 0.48 | 1.50 |
| Percent Hispanic Students | 1.69* | 0.86 | 0.52 | 3.89 |
| Percent Female Students | 1.31 | 1.26 | -0.79 | 4.20 |
| Socioeconomic Status | 0.70* | 0.21 | 0.23 | 1.07 |
| Year and Group Variables | ||||
| Year (2021-2022) | -0.22* | 0.04 | -0.30 | -0.12 |
| Year (2022-2023) | -0.06 | 0.06 | -0.16 | 0.07 |
| Year (2023-2024) | 0.07* | 0.03 | 0.00 | 0.14 |
| Group: District-Level Variance | 0.03* | 0.07 | 0.00 | 0.21 |
*Statistically significant.
Hierarchical (district random-intercept) mixed-effects model estimates of the association between offering an A–G approved data science course and UC admission rates, reported on the logit scale with bootstrap standard errors and 95% confidence intervals.
Difference-in-Differences
We also want to know if introducing a data science course improved college admission rates at individual schools. To do this, we compare changes in admission rates before and after introducing data science courses at certain schools, and then compare these changes with those at schools that never introduced the courses. This approach helps us estimate the change in admission rates associated with the introduction of a data science course using a quasi-causal difference-in-differences approach25’26.
The Difference-in-Differences (DiD) model is specified mathematically as:
![\[p_{it} = \beta_0 + \beta_1 Treated_i + \beta_2 Post_t \beta_3 (Treated_i \times Post_t) + \varepsilon_{it}\]](https://nhsjs.com/wp-content/ql-cache/quicklatex.com-2e24d03b00f06dca5d0ae0eb2754e949_l3.png "Rendered by QuickLaTeX.com")
 is the admission rate for school
  in year
  .
. is a binary indicator that equals 1 if the school offered a data science course up to year , and 0 otherwise.
 is a binary indicator for year after the adoption of a data science course at treated schools.
- The interaction term (
 ) captures the DiD estimator, representing the differential effect of offering data science courses.
  is the school-year level residual.
Standard errors are clustered at the district level to account for within-district correlations among schools.
Table 3 presents these DiD results. We observe a 2% increase in admission rates for schools after they introduced data science courses, compared to schools that did not. Although this may seem like a small number, it represents a significant improvement in university admissions, consistent with a positive effect of adding data science classes to course options for students, especially considering our data are at the school level and do not capture individuals who took the data science classes.
| Variable | Coefficient | Std. Error | z /t-statistic | p-value | 95% CI Lower Bound | 95% CI Upper Bound |
| Intercept | 0.68 | 0.01 | 129.69 | <0.001 | 0.67 | 0.69 |
| Treatment (Offered Data Science Course) | -0.03 | 0.01 | -3.57 | <0.001 | -0.05 | -0.02 |
| Post (After Data Science Introduction) | 0.02 | 0.004 | 4.50 | <0.001 | 0.01 | 0.02 |
| DiD Estimator (Interaction) | 0.02 | 0.004 | 4.50 | <0.001 | 0.01 | 0.02 |
Difference-in-differences estimates comparing changes in UC admission rates before vs. after data science adoption in treated schools relative to non-adopting comparison schools.
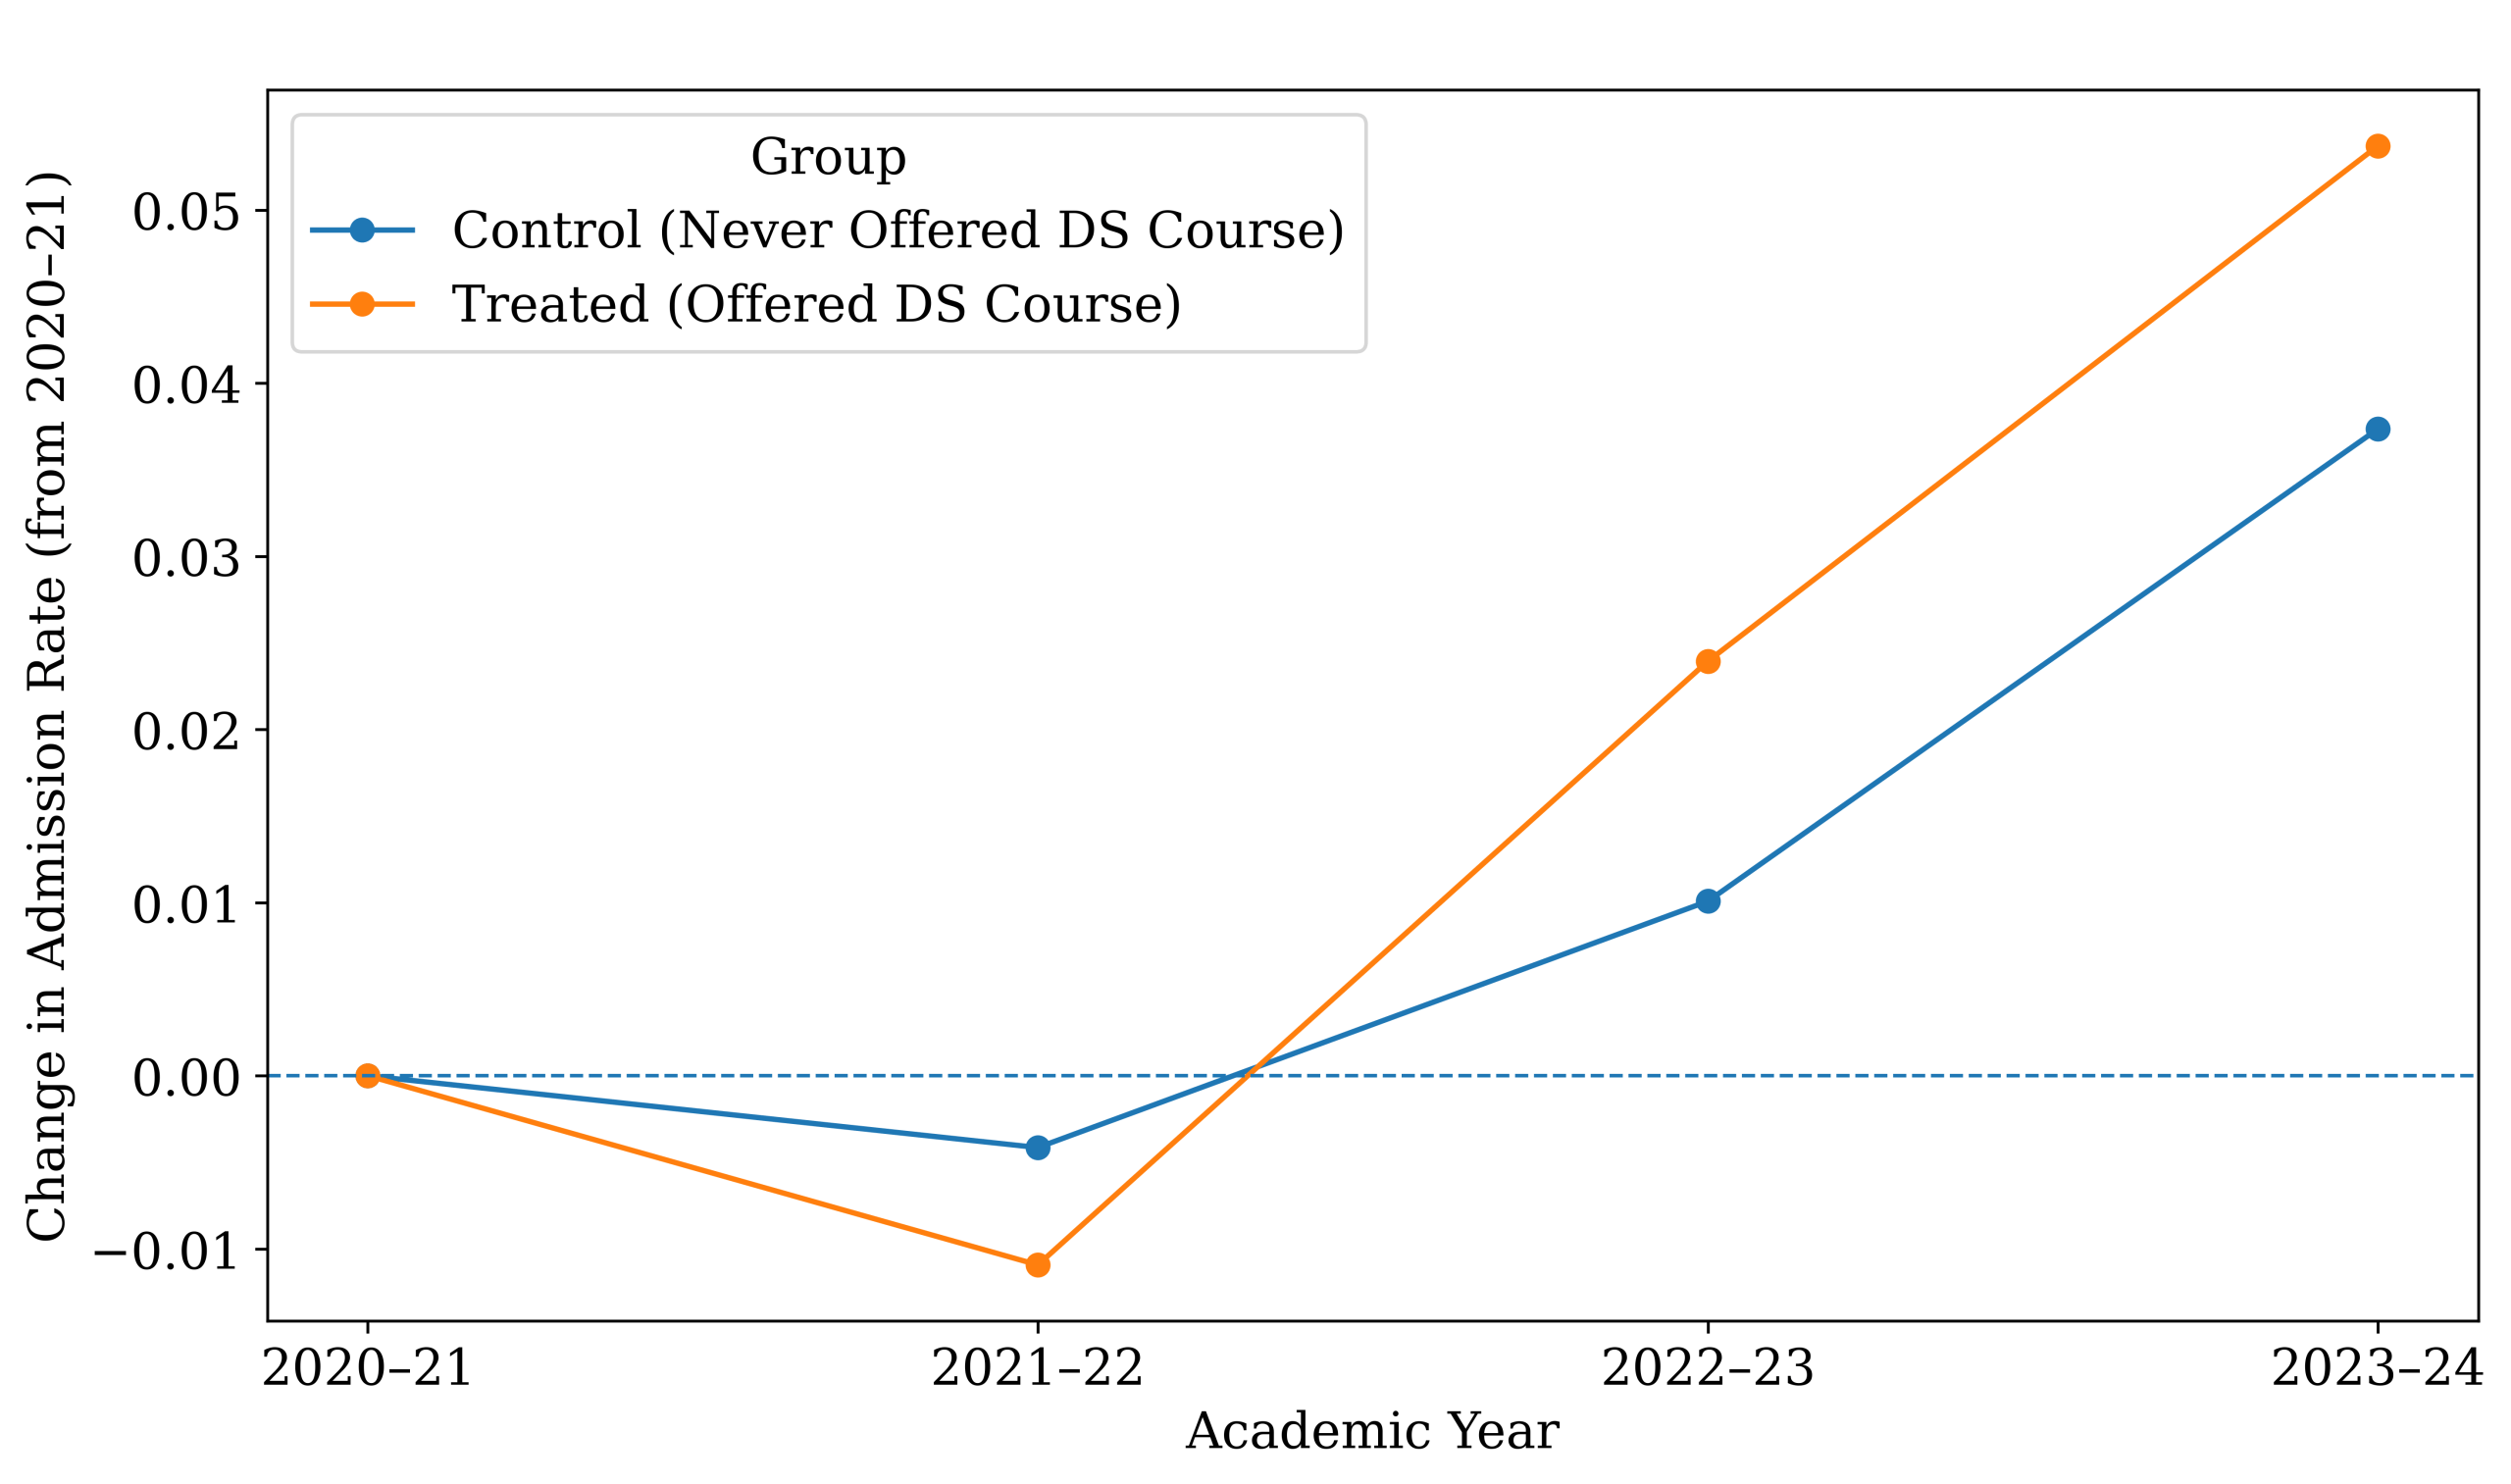
Average UC admission rates over time for schools that eventually offered a data science course versus schools that never did. Admission rates increased after the introduction of data science.
Figure 1 illustrates the average UC admission rates for schools that did and did not offer data science across the study years. The lines move largely in parallel before course adoption and begin to diverge afterward, visually supporting the difference-in-differences design and highlighting the timing of data science introduction relative to school-level admission changes. Specifically, the figure compares the changes in UC admission rates over time for two groups of schools: those that never offered a Data Science (DS) course (blue line) and those that eventually did (orange line). It shows the change in admission rates relative to each group’s starting point in the 2020–2021 period. Looking at the first year after the baseline (2021–2022), we don’t see much improvement. Starting in 2022–2023, the orange line rises faster than the blue line. This timing is important because many schools started offering DS in exactly those years: 159 schools began offering DS by 2021, another 195 joined in 2022, and 244 more added it in 2023. By 2023–2024, most treated schools had recently started teaching DS, and this was when we saw the significant improvement. The more pronounced divergence beginning in 2022–2023 is consistent with initial course offerings and admissions cycles, since applicants submit UC applications in the fall and newly offered coursework may not appear in the evaluated record until a subsequent cohort. Implementation and take-up may also ramp up over the first few years. This lag is also consistent with UC calculating UC GPA from A–G coursework completed through the summer after 11th grade, while senior-year coursework is evaluated primarily as courses in progress or planned; therefore, a data science course introduced in 2021–2022 may not be reflected in the evaluative academic record for many applicants until later cohorts take it earlier in high school or until implementation and take-up expand27.
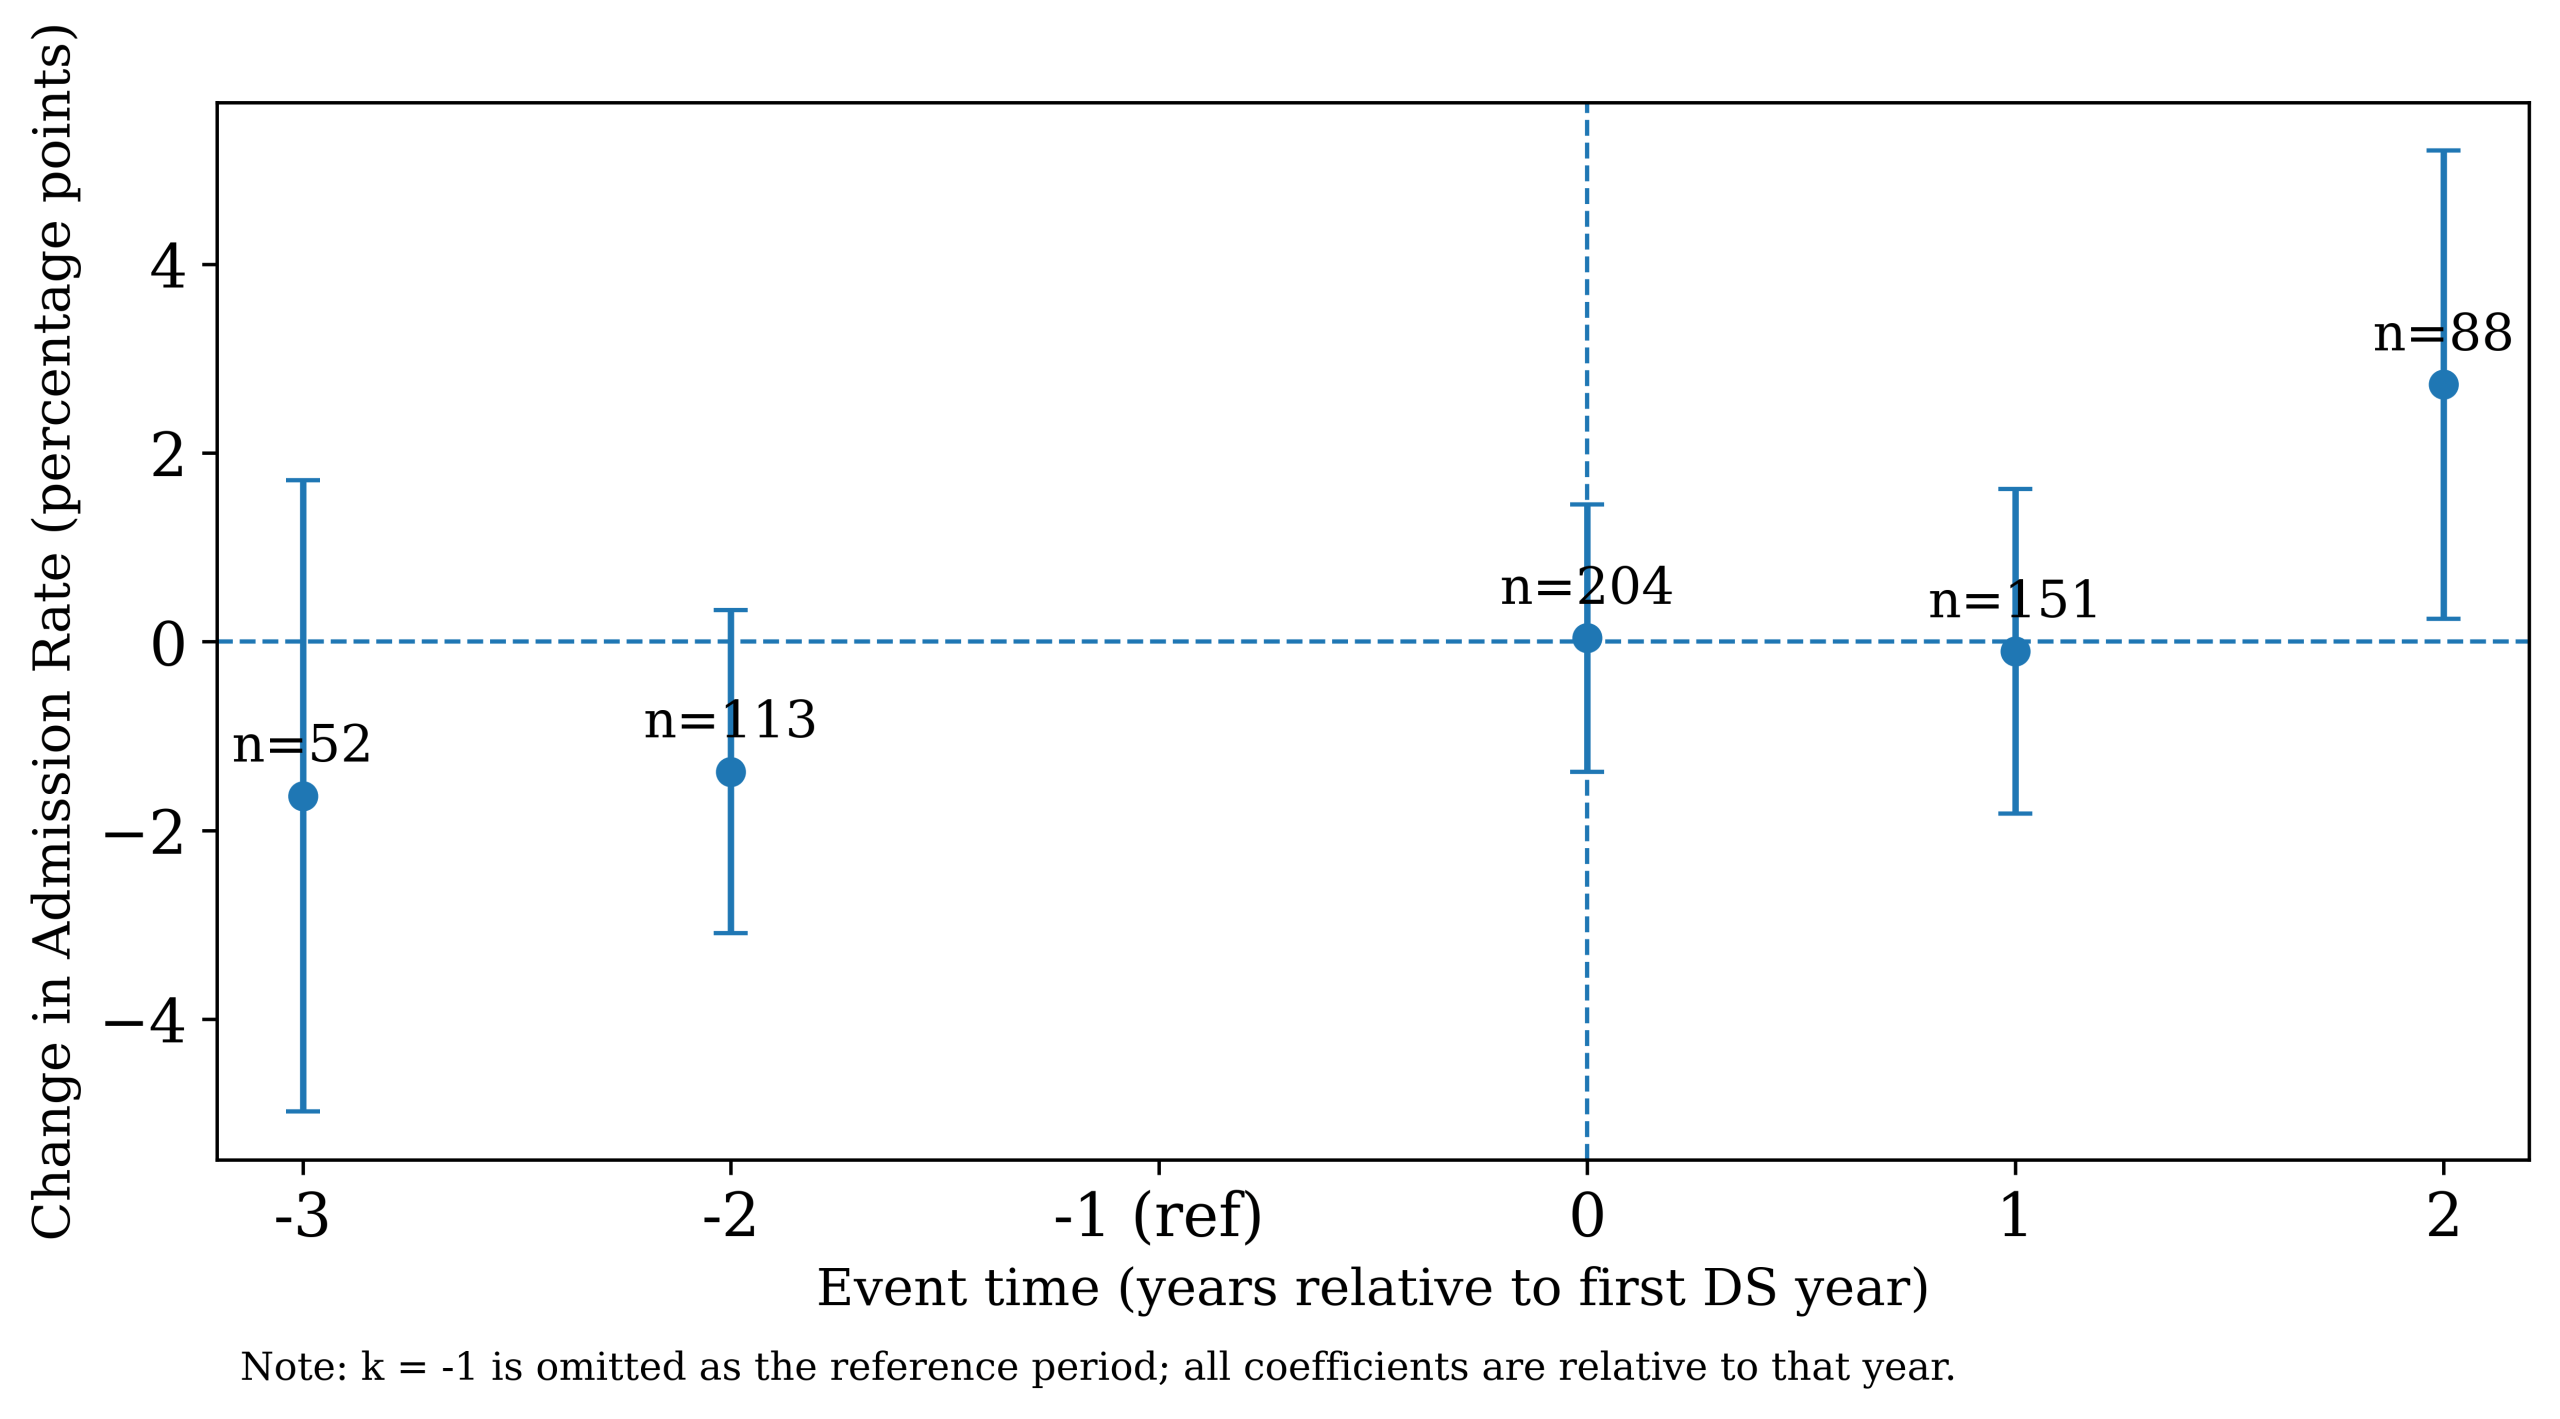
Event-study (DiD) estimates testing pre-trends and post-adoption changes in UC admission rates. Pre-treatment effects are near zero, supporting the parallel-trends assumption underlying the DiD results.
Figure 2 assesses the parallel trends assumption using an event-study specification with school and year fixed effects, testing for differential pre-treatment trends (reference period k = −1)28. The estimated pre-treatment lead coefficients (𝑘 = −3 and 𝑘 = −2) are small and are not jointly different from zero (joint Wald test: 𝜒2 = 2.88, df = 2, 𝑝 = 0.24; lead bin counts: 𝑘 = −3, 𝑛 = 52; 𝑘 = −2, 𝑛 = 113), providing support for parallel trends over the observed pre-treatment window. Because the panel includes only a limited number of pre-adoption years, these checks have limited power. If treated schools were already on a different trajectory before adoption, the DiD estimate could be biased (for example, upward if treated schools were improving faster even without data science). As a diagnostic, we assessed multicollinearity among predictors using variance inflation factors (VIFs)29. The VIF for the focal data science indicator was 1.27, indicating low multicollinearity for the treatment variable.
Subgroup Analyses
Table 4 reports subgroup estimates from re-estimating our main hierarchical model and DiD specification within strata defined by the following splits: high- vs. low-SES schools (median split on FRPM), large vs. small schools (median split on enrollment), initially high vs. low admission-rate schools (median split on baseline UC admission rate), and charter vs. traditional public schools. Across most strata, the estimated association between offering data science and UC admission outcomes remains positive, suggesting the main result is not driven by a single school type. At the same time, the magnitude and precision vary across subgroups, which is expected given smaller sample sizes within strata and differences in baseline admissions environments. These subgroup analyses complement the earlier interaction tests. While interaction terms in the full-sample models were not statistically significant, stratified re-estimation can still reveal descriptive differences in magnitude and precision across groups, especially when subgroup sample sizes vary.
The most substantial heterogeneity appears by baseline UC admission rate and by charter status. In the DiD estimates, the effect is statistically distinguishable from zero for schools with initially low UC admission rates but not for schools with initially high admission rates. In contrast, the hierarchical odds-ratio estimates show the opposite pattern (a larger odds ratio in the initially high-baseline group). The hierarchical model relies more on between-school variation and may be more sensitive to residual confounding. On the other hand, DiD emphasizes within-school changes around adoption and may better capture where gains are largest. Accordingly, we interpret heterogeneity primarily through the DiD results and view cross-framework differences as a reminder that subgroup patterns are descriptive rather than definitive evidence of effect modification. Charter-school estimates are imprecise and not statistically significant in either framework, consistent with the limited charter-school sample size, whereas traditional public schools show positive, statistically significant estimates. By SES and enrollment, effects are generally positive in both strata, with some differences in magnitude between high- and low-SES schools and between small and large schools. Overall, these subgroup results support generalizability across multiple school contexts while indicating that effect sizes may differ by baseline admissions environment and that charter-specific conclusions are limited by statistical precision.
| Subgroup | N schools | Hierarchical model: Data science OR (95% CI) | DiD: Data science effect in percentage points (95% CI) | DiD p-value |
| Overall | 682 | 1.16 [1.04, 1.29] | 1.615 [0.898, 2.333] | <0.001* |
| High-SES (low FRPM) | 341 | 1.07 [1.00, 1.16] | 1.915 [0.987, 2.843] | <0.001* |
| Low-SES (high FRPM) | 341 | 1.25 [1.02, 1.50] | 0.881 [0.105, 1.657] | 0.026* |
| Small schools (low enrollment) | 341 | 1.34 [1.08, 1.57] | 1.733 [0.370, 3.095] | 0.013* |
| Large schools (high enrollment) | 341 | 0.99 [0.93, 1.05] | 1.537 [0.719, 2.356] | <0.001* |
| Low baseline UC admission rate | 337 | 1.00 [0.95, 1.05] | 1.701 [1.181, 2.220] | <0.001* |
| High baseline UC admission rate | 337 | 1.39 [1.09, 1.79] | 0.639 [-0.307, 1.585] | 0.185 |
| Charter schools | 85 | 1.04 [0.72, 1.77] | -0.818 [-3.719, 2.083] | 0.581 |
| Traditional public schools | 597 | 1.13 [1.00, 1.27] | 1.783 [1.036, 2.531] | <0.001* |
OR = odds ratio from the hierarchical logit model; subgroup splits are at the median within the analytic sample.
*Statistically significant.
Subgroup analyses re-estimating the hierarchical model (data science odds ratio with 95% CI) and the DiD model (percentage-point effect with 95% CI) within strata defined by SES, enrollment, baseline admission rates, and charter status to assess generalizability.
Machine Learning Model
A machine learning model is used for prediction rather than causal inference, and it complements the hierarchical and DiD analyses by testing whether data science availability improves predictive performance beyond other observed school characteristics. Thus, we use the model described in the bootstrap section to train a predictive model. Specifically, we use a Random Forest regression model to capture complex interactions and nonlinearities inherent in the data30. This model works by building many decision trees. Each tree makes its prediction, and the final prediction is based on the average result from all the trees. To ensure our predictions were reliable, we use a technique called nested cross-validation. This means we divide our data into multiple groups, train the model on some of them, and test it on the others. We repeat this numerous times to ensure our model’s predictions are accurate and trustworthy. We choose Random Forest because it provides strong predictive performance with minimal functional-form assumptions, can capture nonlinearities and interactions among school-level covariates, and remains relatively robust to overfitting through ensembling. Hyperparameters (for example, the number of trees, maximum tree depth, and the number of variables considered at each split) are tuned using cross-validation on the training data. Predictive performance is reported using out-of-sample metrics including 𝑅2, mean absolute error (MAE), and root mean squared error (RMSE).
Table 5 illustrates the performance of our model. It successfully predicted about 21% of the variation in UC admission rates, with low prediction errors (RMSE = 0.08 and MAE = 0.07). These low errors indicate that our predictions were close to the actual values, suggesting that our model captured the relationships well. We report permutation-based feature importance from the tuned Random Forest model, defined as the increase in out-of-sample mean absolute error (MAE) when a feature is randomly permuted. In our fitted model, predictive accuracy is driven primarily by a small set of variables, especially applicant GPA and percent female, followed by enrollment, percent FRPM, and percent Asian; the remaining covariates contribute negligible incremental importance in this specification. Feature importance reflects predictive contribution conditional on the included feature set (and can be shared across correlated predictors) and should not be interpreted as a causal effect or mechanism. Overall, these results highlight that factors such as offering data science courses are useful indicators of future university admissions success, enabling schools to make informed decisions about their curricular offerings.
| Metric | Mean ± SD |
| R² | 0.21 ± 0.03 |
| RMSE | 0.08 ± 0.002 |
| MAE | 0.07 ± 0.002 |
Predictive performance of the tuned Random Forest model under nested cross-validation, summarized as mean ± SD across folds for R², RMSE, and MAE.
Discussion
Summary of Results
Overall, we find that introducing an A–G approved data science course is associated with approximately a two percentage-point increase in UC admission rates among UC applicants, even after controlling for school-level GPA, demographics, socioeconomic status, and other A–G course offerings. We found no meaningful evidence that this association differed by schools’ demographic, GPA, or socioeconomic composition, suggesting the relationship is not confined to a particular type of school and may be broadly relevant across academic pathways. Because our data are school-level, we interpret this as an association with expanding access to data science rather than a causal estimate for individual course-takers, consistent with the non-mutually exclusive pathways. For example, data science availability may reflect a shift in the school’s academic opportunity set, operating through a mix of direct effects on enrollees, spillovers to other UC-bound students (course planning, quantitative preparation), and changes in applicant composition.
COVID-19 disruptions during the study period may help explain year-to-year shifts in admissions patterns through changes in access to rigorous coursework, implementation and participation in new courses (including data science), and UC application behavior, so we treat the year indicators as controls for statewide disruption rather than interpreting them as causal effects17. Taken together, these results reinforce policy efforts to expand equitable access to data science coursework and to provide implementation supports, such as teacher capacity and advising, needed for schools to adopt and deliver it effectively7.
Across methods, the results are broadly consistent. The hierarchical bootstrap provides a nonparametric check that the difference is not driven by a small number of schools. At the same time, the difference-in-differences framework strengthens quasi-causal interpretation by leveraging within-school changes over time and showing no detectable differential pre-trends over the observed pre-adoption window. However, the available pre-period is limited. The timing of the divergence, which emerges after widespread adoption, is consistent with implementation ramp-up and the UC application timeline, where coursework may not appear in the evaluated record for the first affected cohort. Stratified re-estimation further suggests that the magnitude and precision of effects vary across contexts, with the most notable differences by baseline UC admission environment and charter status. Finally, the random forest model complements the explanatory analyses by showing that data science availability contributes incremental predictive signal beyond other observed school characteristics, while emphasizing that feature importance reflects predictive contribution rather than mechanism. Taken together, the alignment of results across frameworks suggests the association is stable across analytic lenses rather than an artifact of any one method.
Limitations and Future Research
Although our results are meaningful, several limitations exist. For one, we only have school-level data, meaning we cannot see exactly how individual students benefit from taking data science courses. While effects on UC admissions from data science courses offered may be applied school-wide, they do not speak to individual student admissions. On top of this, we are unable to determine how many students at a particular school were enrolled in these courses, whether or not those students applied to the UC system, and the extent to which they affected admission rates.
Despite the inclusion of several covariates, unmeasured factors such as teacher quality, school funding, or college counseling intensity may still influence both the likelihood of adopting data science and UC admission outcomes, introducing potential omitted variable bias31. Because high-performing or better-resourced schools may be more prone to implement new A–G courses, any unobserved differences of this kind would likely bias our estimates upward, overstating the true magnitude of the relationship.
Future research should use individual-level data to understand the personal impacts of these courses rather than the overall impact on all students, regardless of whether they took the courses or not. Another limitation is that our findings mainly apply to California public high schools. Since education systems vary by state and region, we do not know if our results would look the same elsewhere. Future studies should explore different geographic locations to see if these findings hold in other contexts. Additionally, we only analyzed a state university system. While the UC system provides a great representation of many other institutions across the US and the world, ultimately, it can’t fully represent all universities, such as private institutions. The UC system’s use of the A-G subject list, holistic admissions, and other unique characteristics for the admission process differs significantly from those of other universities32’23. In systems with different admissions criteria and weighting, including many private and out-of-state universities, the relevance of course availability may differ, so effect sizes may not transfer directly23.
During our study period, UC Board of Admissions and Relations with Schools clarified (July 2023) that approved high school data science courses do not validate Algebra II, although UC’s core Area C math requirement did not change33. This could affect eligibility and application behavior for the subset of students who might otherwise have substituted data science for Algebra II, potentially shifting applicant composition in later years; however, it may also have reinforced data science as a distinct, additive course taken alongside traditional math, strengthening its role as a signal of preparation among UC applicants.
Lastly, our data do not capture details such as the quality of teaching or the exact course content, which could affect the perceived benefit of the data science courses. We also do not observe variation in course quality, instructional approach, or teacher experience across schools, which could influence outcomes. Future work could incorporate measures of course implementation quality and instructor preparation to understand better how program differences shape admissions outcomes.
Conclusion
Ultimately, our study highlights the need for educational curricula to grow alongside technological advancements and changing university expectations. By incorporating data science into high school curricula, educators can better equip students for future academic and professional success, ensuring that today’s students become tomorrow’s skilled innovators and problem-solvers.
Acknowledgement
We sincerely thank the University of California Office of the President for providing essential data that made our research possible. The author gratefully acknowledges the guidance provided by a mentor throughout the project, who provided methodological advice and support throughout the research and revision process.
References
- Data science for undergraduates: Opportunities and options. National Academies of Sciences, Engineering, and Medicine, 2018, https://doi.org/10.17226/25104. [↩]
- R. Gould. Data literacy is statistical literacy. Statistics Education Research Journal. Vol. 16(1), pg. 22–25, 2017, http://iase-web.org/Publications.php?p=SERJ. [↩]
- J. Hardin, R. Hoerl, N. J. Horton, D. Nolan, B. Baumer, O. Hall-Holt, P. Murrell, R. Peng, P. Roback, D. Temple Lang, M. D. Ward. Data science in statistics curricula: preparing students to “think with data”. The American Statistician. Vol. 69, pg. 343–353, 2015, https://doi.org/10.1080/00031305.2015.1077729. [↩]
- Daro, P., H. Asturias. Branching Out: Designing High School Math Pathways for Equity. Just Equations, 2019, Retrieved from https://justequations.org/wp-content/uploads/Just-Equations-2019-Report-Branching-Out-Digital.pdf. [↩]
- P. M. Sadler, G. Sonnert. The path to college calculus: the impact of high school mathematics coursework. Journal for Research in Mathematics Education. Vol. 49, pg. 292–329, 2018, https://doi.org/10.5951/jresematheduc.49.3.0292. [↩]
- V. R. Lee, M. H. Wilkerson, K. Lanouette. A call for a humanistic stance toward K–12 data science education. Educational Researcher. Vol. 50, pg. 664–672, 2021, https://doi.org/10.3102/0013189X211048810. [↩] [↩]
- T. Weiland, C. Engledowl. Transforming curriculum and building capacity in K–12 data science education. Harvard Data Science Review. Vol. 4, 2022, https://doi.org/10.1162/99608f92.7fea779a. [↩] [↩]
- D. Donoho. 50 years of data science. Journal of Computational and Graphical Statistics. Vol. 26, pg. 745–766, 2017, https://doi.org/10.1080/10618600.2017.1384734. [↩]
- E. Schanzer, N. Pfenning, F. Denny, S. Dooman, J. G. Politz, B. S. Lerner, K. Fisler, S. Krishnamurthi. Integrated data science for secondary schools: design and assessment of a curriculum. Proceedings of the 53rd ACM Technical Symposium on Computer Science Education V. 1 (SIGCSE 2022). pg. 22–28, 2022, https://doi.org/10.1145/3478431.3499311. [↩]
- J. Boaler, K. Conte, K. Cor, J.A. Dieckmann, T. LaMar, J. Ramirez, M. Selbach-Allen. Studying the opportunities provided by an applied high school mathematics course: Explorations in data science. Journal of Statistics and Data Science Education, Vol. 33(1), pg. 26–45, 2025, https://doi.org/10.1080/26939169.2024.2333735. [↩]
- M.R. Munafò, G.D. Smith. Robust research needs many lines of evidence. Nature, Vol. 553(7689) pg. 399-401, 2018, https://doi.org/10.1038/d41586-018-01023-3. [↩]
- California Department of Education. California public schools directory. https://www.cde.ca.gov/ds/si/ds/pubschls.asp (2025). [↩]
- California Department of Education. Enrollment by school. https://www.cde.ca.gov/ds/ad/filesenrcensus.asp, 2025. [↩]
- California Department of Education. Free or reduced-price meal data files. https://www.cde.ca.gov/ds/ad/filessp.asp, 2025. [↩]
- University of California Office of the President. Admissions by source school. https://www.universityofcalifornia.edu/about-us/information-center/admissions-source-school, 2025. [↩]
- University of California Office of the President. A–G course list. https://hs-articulation.ucop.edu/agcourselist, 2025. [↩]
- M. Kuhfeld, J. Soland, B. Tarasawa, A. Johnson, E. Ruzek, J. Liu. Projecting the potential impact of COVID-19 school closures on academic achievement. Educational Researcher. Vol. 49, pg. 549–565, 2020, https://doi.org/10.3102/0013189X20965918. [↩] [↩]
- H. Goldstein. Hierarchical data modeling in the social sciences. Journal of educational and behavioral statistics. Vol. 20, pg. 201-204, 1995, https://doi.org/10.3102/10769986020002201. [↩]
- J.R. Carpenter, H. Goldstein, J. Rasbach. A novel bootstrap procedure for assessing the relationship between class size and achievement. Journal of the Royal Statistical Society Series C: Applied Statistics. Vol. 52, pg. 431-443, 2003, https://doi.org/10.1111/1467-9876.00415. [↩]
- University of California. University of California Board of Regents unanimously approved changes to standardized testing. Press release. 2020, https://www.universityofcalifornia.edu/press-room/university-california-board-regents-unanimously-approved-changes-standardized-testing. [↩]
- University of California. UC announces record-breaking admissions for fall 2024. News release. 2024. https://www.universityofcalifornia.edu/news/uc-announces-record-breaking-admissions-fall-2024. [↩]
- University of California Admissions. First-year comprehensive review. Webpage. Accessed 2025, https://admission.universityofcalifornia.edu/counselors/preparing-freshman-students/comprehensive-review.html. [↩]
- M. N. Bastedo, M. Umbricht, E. Bausch, B.-K. Byun, Y. Bai. Contextualized high school performance: Evidence to inform equitable holistic, test-optional, and test-free admissions policies. AERA Open. Vol. 9, pg. 1–19, 2023. https://doi.org/10.1177/23328584231197413. [↩] [↩] [↩]
- T. Brambor, W.R. Clark, M. Golder. Understanding interaction models: Improving empirical analyses. Vol. 14, pg. 63-82, 2006, https://doi.org/10.1093/pan/mpi014. [↩]
- C. Lee. A review of causal inference tools using education policies. NHSJS Reports. pg. 1–8, 2024, https://nhsjs.com/2024/a-review-of-causal-inference-tools-using-education-policies. [↩]
- M. Lechner. The estimation of causal effects by difference-in-difference methods. Econometrics, Vol. 4, pg. 165-224, 2011, http://dx.doi.org/10.1561/0800000014. [↩]
- University of California Admissions. GPA requirement. UC Admissions webpage. Accessed December 28, 2025, https://admission.universityofcalifornia.edu/admission-requirements/first-year-requirements/gpa-requirement.html. [↩]
- A. Kahn-Lang, K. Lang. The promise and pitfalls of differences-in-differences. Journal of Business & Economic Statistics, Vol. 38(3), pg. 613–620, 2020, https://doi.org/10.1080/07350015.2018.1546591. [↩]
- J. Fox, G. Monette. Generalized collinearity diagnostics. Journal of the American Statistical Association, Vol. 87(417), pg. 178–183, 1992, https://doi.org/10.1080/01621459.1992.10475190. [↩]
- L. Breiman. Random forests. Machine Learning, Vol. 45, pg. 5–32, 2001, https://doi.org/10.1023/A:1010933404324. [↩]
- C. Cinelli, C. Hazlett. Making sense of sensitivity: extending omitted variable bias. Journal of the Royal Statistical Society: Series B (Statistical Methodology). Vol. 82, pg. 39–67, 2020, https://doi.org/10.1111/rssb.12348. [↩]
- M. N. Bastedo, N. A. Bowman, K. M. Glasener, J. L. Kelly. What are we talking about when we talk about holistic review? Selective college admissions and its effects on low-SES students. The Journal of Higher Education. Vol. 89, pg. 782-805, 2018, https://doi.org/10.1080/00221546.2018.1442633. [↩]
- University of California Academic Senate, Board of Admissions and Relations with Schools (BOARS). Workgroup on Mathematics (Area C) Preparation, 2023–2024: Stage 2 Report. Report. 2024, https://senate.universityofcalifornia.edu/committees/boars/reports.html. [↩]


