Abstract
Background/Objective: A metabolomics study normally ends in a result table: one row per compound with an effect estimate, raw and adjusted probability values, and identification evidence. These tables circulate as spreadsheets and delimited text whose column names their authors choose, so computational review must infer the schema. We asked whether a deterministic audit program returns the outputs its own contract requires on cases fixed and hashed before it ran.
Methods: We evaluated Validex 0.2.0 at one locked commit against a synthetic benchmark of 240 cases in twelve perturbation families: 40 development, 160 held-out and 40 challenge. The held-out partition ran once. A case counted as exact only when five field mappings, five ambiguity states and the ingestion outcome matched. Post hoc we re-executed the commit, re-scored outputs across sixteen usability thresholds, and audited the benchmark for duplicates.
Results: Of 160 held-out cases, 147 matched exactly, a table-level mismatch rate of 8.125%. Ingestion succeeded in 160 of 160, spreadsheet ingestion in 26 of 26, ambiguity states in 800 of 800. All 13 mismatches came from one family, where the program suppressed probability mappings the reference expected. Re-execution reproduced all 240 output files byte for byte. Sixty-five of the 160 held-out tables are identical to a development table.
Conclusions: The program conforms to its contract on these fixtures. The benchmark is not independent of the software, so the result cannot speak to accuracy on real metabolomics tables.
Keywords: software verification, deterministic auditing, metabolomics result tables, synthetic benchmark, reproducibility, false discovery rate
Introduction
A downstream metabolomics result table links compounds or measured features to effect estimates, statistical results and annotation evidence. Reporting standards define information needed to interpret those results1,2, including levels of identification confidence3. Published data-analysis descriptions can still be incomplete4. RefMet harmonizes metabolite names5, while reviews describe persistent difficulties in annotation6. Recognizing a column in a supplementary spreadsheet requires a separate decision about its meaning.
Recent software illustrates the range of upstream operations represented in result tables. MetaboAnalyst 5.0 added spectral processing and functional analysis7; version 6.0 expanded its processing and interpretation workflows8. MetaboAnalystR 4.0 implements an LC-MS workflow spanning feature detection, identification and statistical analysis9. MZmine 3 integrates multimodal mass-spectrometry processing10, and MS-DIAL 4 combines lipid annotation with retention-time and spectral evidence11. Surveys of R packages and other freely available metabolomics tools describe their different analytical roles12,13. In environmental non-target screening, patRoon combines processing and annotation tools in an R workflow14. These tools perform upstream analyses whose scientific correctness cannot be established by checking the headers of their exported tables.
Annotation methods also produce different kinds of evidence. SIRIUS 4 infers molecular structure information from tandem mass spectra15, whereas CANOPUS predicts compound classes16. Feature-based molecular networking links aligned features through spectral similarity17; ion identity molecular networking adds relationships among ion species of the same molecule18. Spec2Vec learns spectral representations for similarity scoring19, and MS2DeepScore predicts structural similarity from spectral pairs20. HMDB 5.0 supplies metabolite reference information and spectral resources21. A field labelled annotation may therefore encode a name, a class or a score. Validex recognizes selected headers but does not verify any of these scientific assignments.
Table handling can introduce additional errors. Two empirical studies documented gene-symbol conversions in supplementary spreadsheets22,23; spreadsheet organization guidance addresses preventable formatting problems24. Statistical interpretation requires the adjustment method as well as the numbers. Benjamini-Hochberg adjusted p-values are at least their corresponding raw p-values25, but that relation is not a universal property of FDR estimates. Storey-type q-values incorporate an estimated null proportion and can be smaller than raw p-values26. Comparative work documents differences among FDR methods27. An ordering warning alone therefore cannot establish a statistical error. Errors in identifiers or statistical selections can also affect downstream pathway analysis28.
Existing standards and validators address more constrained inputs. mzTab-M defines a quantitative metabolomics exchange format29, and jmzTab-M provides its parser, writer and validator30. The mwtab library supports repository access and quality control31. COSMOS and ISA address data coordination and interoperability32,33; metabolomics standards discussions describe adoption barriers34. General validation systems test declared tabular constraints35,36. Such constraints require a known schema or an explicit mapping to one. This requirement is relevant to machine-actionable data reuse37.
Validex normalizes headers, compares them with a fixed alias registry, records ambiguity and suppresses active probability mappings when too few cells are usable. We ask whether the implementation reproduces a frozen reference on specified synthetic cases. Computational benchmarking guidance distinguishes developer-run testing from neutral comparison38,39. Here the same project produced the software and reference, so the study measures software and benchmark conformance. It does not estimate accuracy on naturally occurring metabolomics tables or agreement with domain experts.
Methods
Study design
This is a verification study of one program at one commit against one benchmark. The evaluated artefact is Validex 0.2.0 at commit 86be06dfc64e33851b61c7b5d261657fec32e778. The study separates six phases: diagnosis of the previous version, implementation of the 0.2 contracts, generation and freezing of the benchmark, a single execution of the held-out partition, analyses planned before that execution, and analyses added afterwards. Every result from the last group is labelled post hoc where it appears.
The study used synthetic benchmark files and a separate feasibility screen of public table records. It involved no recruitment, intervention or analysis of identifiable patient-level records. The screen required lawful access and resolved licensing. No clinical or biological-validity endpoint was measured.
The audit contract
Validex accepts comma-separated and tab-separated text and native XLSX workbooks, with the worksheet named explicitly when a fixture needs one. Each file is parsed into a normalized table before any field matching happens.
Five canonical fields are recognized: compound identifier, effect size, raw probability value, false discovery rate, and annotation or identification evidence. Column headers are normalized and compared against a governed registry of exact aliases, each carrying a rationale and a risk classification. Exact aliasing rather than fuzzy matching keeps the rule inspectable, at the cost of failing on synonyms nobody entered.
Ambiguity is recorded separately from emission. Four states are possible for each field: no valid candidate, one valid candidate, several candidates with a preferred selection, and several candidates with no preference. This separation matters for reading the results below, because a column can be structurally recognized and still be withheld from the active output.
Probability columns receive cell-level validation. Every cell in a recognized p_value or fdr column is classified as a valid number in the closed unit interval, missing, non-numeric, non-finite, or numeric but out of range. The valid fraction is computed over all rows rather than over the non-null subset, so missing cells count against a column. A column is usable when its valid fraction is at least 0.80, and the comparison is inclusive at the boundary. When a recognized column fails that test, the active detected field is serialized as null while the structural record of the column survives in the ambiguity output.
The frozen program computes a numeric-ordering heuristic on rows where both structurally selected probability values survive numeric coercion. Its summary is the fraction with adjusted value at least raw value; it warns when that fraction is below 0.80. Coercion does not exclude out-of-range or infinite numbers. For comparison, a post hoc restricted rule uses only pairs numeric, finite and within [0, 1] on both sides. Neither rule establishes FDR validity without knowledge of the adjustment method.
The program also emits a heuristic audit score, a three-level confidence label, completeness flags, user-facing findings, and provenance records naming the input file, the software version and the commit. All stages are deterministic for a fixed input, commit and configuration. No model or network service is called during an audit.
Benchmark construction and freezing
The v2 benchmark contains 240 synthetic cases generated by a script that defines every table in code. Cases cycle through twelve perturbation families by index: canonical CSV, supported TSV, single-sheet XLSX, XLSX requiring an explicit sheet, annotation positives, annotation negatives that collide with rejected concepts, several annotation candidates with no preference, a preferred p-value candidate, invalid probability cells, adjusted values ordered below raw values, duplicate identifiers, and a missing field. Row counts run from 8 to 14 by index. Cases 1 to 40 form the development partition, 41 to 200 the held-out partition, and 201 to 240 the challenge partition. A 20-case reserve from the earlier v1 benchmark exists but sits outside v2, was never executed, and supports no inference here.
Each case carries a seed of the form 202607240000 plus its index, so the seeds run from 202607240001 to 202607240240. The seeded generator is consumed by only two families, which use it to pick an annotation header from a short list. Every other cell value and header follows deterministically from the case index. Many cases are therefore identical to one another. The Results report how many.
Before the held-out partition ran, a hash inventory of 720 entries was written, covering 240 generated tables, 240 case specification files and 240 ground-truth records. The generator, the execution runner and the analysis script were fixed at the same time. File modification times place generation at 15:50 on 23 July 2026, the evaluated commit at 15:51:41, the development run at 15:52:29, the freeze certificate at 15:52:52, the held-out run at 15:53:00, and the analysis at 15:53:02. All of these artefacts entered version control together in a single commit the following afternoon. There is no time-stamped record external to the project. We therefore describe the reference as prospectively frozen rather than pre-registered, and we note that the ordering within 23 July rests on file timestamps, which are mutable, rather than on anything cryptographic.
Execution and outcome definitions
The held-out partition was executed once against the locked commit. Outputs were retained unchanged and were not replaced by any later run.
Exact-table agreement is the primary endpoint. For each case, the program’s output is compared against the frozen reference on five active field mappings, five ambiguity states, and the ingestion outcome. A case counts as exact only when all eleven comparisons match. There is no partial credit, and the denominator is the full 160-case held-out partition.
Field-level counts follow the same comparison. A true positive is an expected column emitted as the active mapping; a false negative is an expected column not emitted; a false positive is an emitted column that was not expected; a true negative is agreement that no column should be active. Precision, recall and F1 follow the standard definitions for these counts40. Where an interval is given for a proportion it is a Wilson score interval41,42, and we note in the Discussion why these intervals are optimistic here.
Analyses added after the initial execution
Six analyses were added after the frozen result existed. Each is post hoc and none of them changes the primary endpoint.
First, we re-executed the locked commit twice in fresh directories on all 240 frozen inputs and compared the resulting files against each other and against the July outputs, byte for byte. Second, we stratified the frozen per-case results by family, by file format and by partition. Third, we re-scored the frozen outputs across sixteen usability thresholds, using both a full re-execution of the locked code with the threshold changed and an independent reconstruction from the recorded valid fractions; the two methods had to agree for a threshold row to be reported. Fourth, we defined three ablations before running them and recorded the definitions with their hash: canonical header names only, governed aliases without the usability gate, and the full framework. Fifth, we compared the historical FDR-ordering comparison set against a restricted set containing only pairs that are numeric, finite and inside the unit interval on both sides. Sixth, we fingerprinted every case three ways, by file hash, by normalized parsed content and by normalized specification, and counted duplicates within and across partitions.
External-corpus feasibility screen
A separate screen tested whether an independent evaluation corpus could be assembled from public tables. It measured feasibility and produced no performance number.
The source archive contains 140 files from 58 studies, retrieved on 23 July 2026 through several search waves. MetaboLights provides study data and metadata43,44; Metabolomics Workbench was also consulted45. The retained registry contains 33 queries covering Europe PMC and public repositories. It is incomplete for the earliest pilot wave: queries QRY_0001 through QRY_0005 are absent. A second bounded search on 24 July screened 330 unique article records. Supporting Information S4 supplies the available queries, limits, eligibility criteria and all 195 table dispositions.
A row unit counted as resolved under the screening script when a normalized header contained a compound, metabolite, feature, gene, name or mass-to-charge term. Sample or assay headers and unresolved headers received separate dispositions. This permissive header rule does not establish metabolomics modality. An uncontaminated table had no recorded prior Validex output; eight tables with Validex 0.1.0 demonstration outputs were excluded before screening. Eligibility required a traceable study, lawful access, an archived and hashed source, a bounded table with interpretable rows, documented metabolomics or lipidomics modality, at least one in-scope field, adequate documentation, resolved licensing and reproducible extraction. Abundance-only matrices, patient-level raw data, prior-exposure cases and prohibited duplicates were excluded. Reporting recommendations describe additional scientific metadata beyond this structural screen46,47.
Sampling followed bounded repository queries and returned-record order, with no random draw or representative sampling frame. The expanded first-wave search capped records at 300 and downloads at 150; per-query limits were 12 for Europe PMC, eight for Zenodo and Figshare, and five for Dryad and OSF. It deduplicated candidates against existing and current records using lowercased DOI, accession and title tuples. The later search used Europe PMC requests under twelve source-labelled waves, capped at 500 records and 200 downloads, retaining at most 35 returned records per request. It deduplicated article identifiers and download URLs; extracted-file hashes defined table duplicates. Eligible selection was to sort by study and table identifier and allow two tables per study. No file was retrieved in that search, so table deduplication and the selection cap had no effect. These procedures support a bounded feasibility assessment, not an exhaustive search across twelve independent services.
A deterministic script assigned the 187 screening statuses from stored headers and metadata. Its second rule variant added probability-field and documentation requirements; no model was called at decision time. During revision, two authors separately verified the 13 mismatch cases and 195 screening records. The corresponding author confirmed checking original source tables and summaries. The retained records contain no paired human ratings or reconciliation log, so human inter-rater agreement and reviewer-specific decision changes cannot be calculated. The frozen screening manifest is unchanged from its first committed version; this establishes record stability, not agreement between the two authors.
Software, statistical environment and AI assistance
Analyses were written in Python 3.13.12 with pandas 3.0.5, numpy 2.5.2 and openpyxl 3.1.5 on macOS running on Apple silicon. The July 2026 execution recorded the interpreter version and the platform but not the package versions.
AI assistance is disclosed as follows. Coding assistants (Claude, Anthropic) reviewed program code, the benchmark generator, the execution runner and the analysis scripts, and assisted with the post hoc analyses. The corpus eligibility statuses reported below came from the deterministic script described above, which calls no model at run time. Separately, three isolated agent sessions (OpenAI Codex worker agents) performed a semantic review of a 188-table set on 23 July 2026 under recorded prompts with published hashes; that activity is distinct from the eligibility screen and is not the source of the corpus counts. The served model identity and the sampling controls for those sessions were not exposed by the interface, and we report that gap rather than guessing. No AI system is an author, and no AI-generated content is presented as expert judgment.
Reproducibility
The evaluated commit, the 240 frozen inputs, the 240 case specifications, the ground truth, the 720-entry hash inventory, the raw outputs, the analysis scripts, the environment record and the reproduction commands are held together in a review package with per-file checksums. The package was copied to a clean directory and its documented commands were run there, including a full re-execution and the regression tests reported below. Guidance on reproducible computational research asks for exactly these materials48,49,50. Archived research code often fails to run when someone tests it51, so we report the clean-directory run as one of the study’s results52.
Results
Benchmark composition and ingestion
The frozen benchmark holds 240 cases: 40 development, 160 held-out and 40 challenge. Within the held-out partition, four families contribute 14 cases each and eight contribute 13, which sums to 160. By format, the held-out partition holds 121 comma-separated files, 26 workbooks and 13 tab-separated files. Table 1 gives the partitions and their roles; the family breakdown appears in Table 3 with the performance results.
| Set | Cases | Use |
|---|---|---|
| v2 development | 40 | Development checks |
| v2 held-out | 160 | Primary conformance endpoint |
| v2 challenge | 40 | Separate descriptive endpoint |
| v2 total | 240 | All executed v2 cases |
| v1 reserve | 20 | Outside v2; never executed |
Every held-out file parsed without error, so ingestion succeeded in 160 of 160 cases. All 26 workbooks parsed, including the 13 that require an explicit worksheet name.
Exact-table agreement
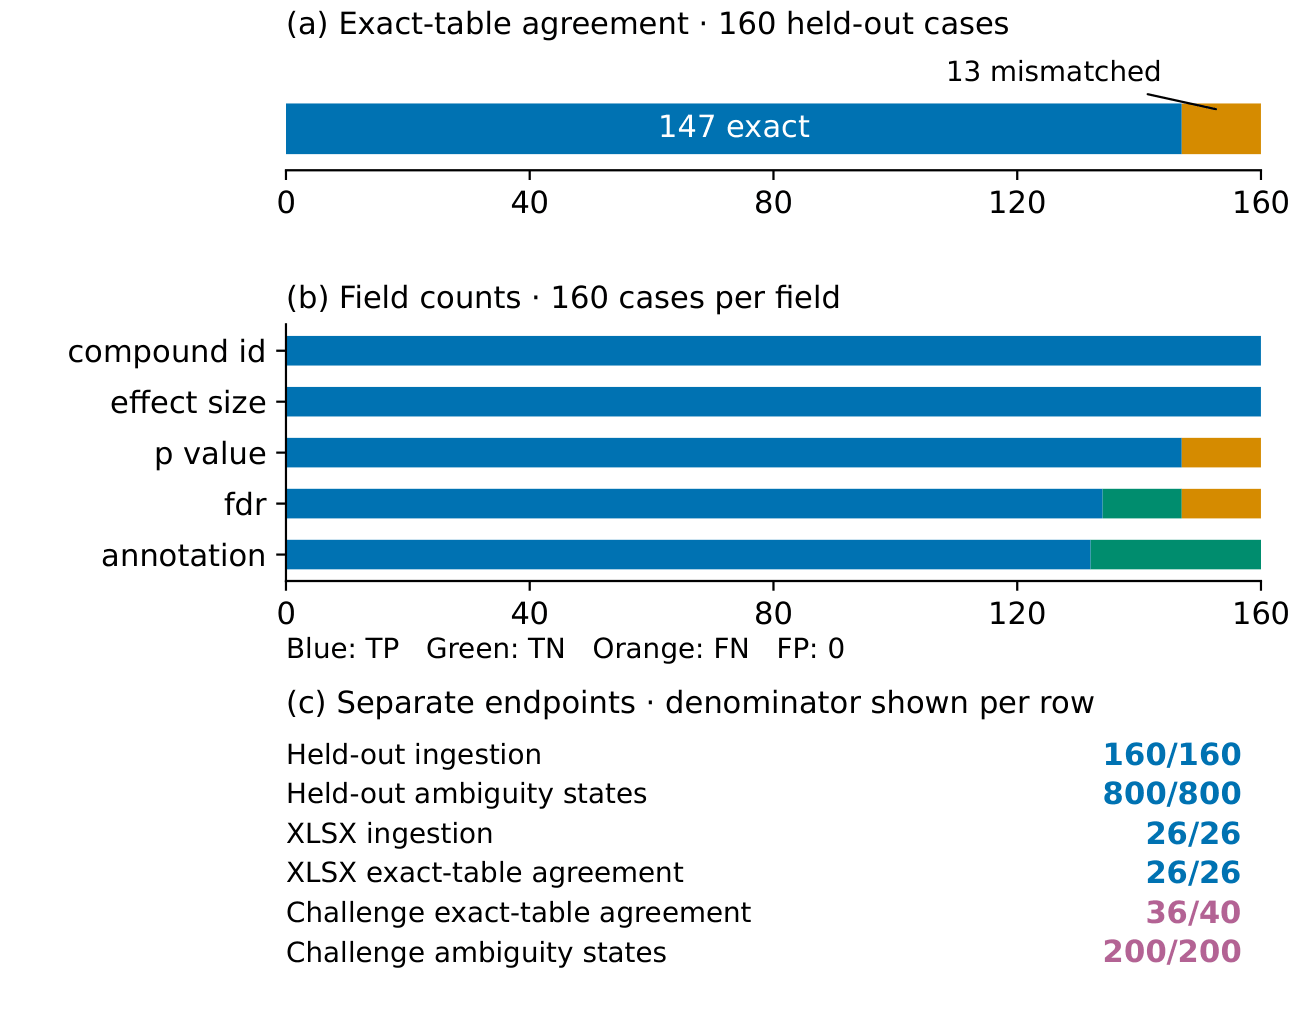
Of the 160 held-out cases, 147 matched the frozen reference exactly. Thirteen did not. The table-level mismatch rate is 8.125%. Ambiguity states agreed in all 800 comparisons, which is five states in each of 160 cases. Figure 1a shows the case-level split.
Field-level results
There were no false positives anywhere in the held-out partition: the program never emitted a field the reference did not expect. Aggregate counts across the five fields are 733 true positives, 0 false positives, 41 true negatives and 26 false negatives. The 26 false negatives are 13 suppressed p_value mappings and 13 suppressed fdr mappings, all from the same 13 cases. Table 2 gives the counts with their support, and Figure 1b shows them. Figure 1c sets out the endpoints that carry their own denominators, which should not be read against a common axis.
| Field | TP | FP | TN | FN | Present / absent |
|---|---|---|---|---|---|
| compound id | 160 | 0 | 0 | 0 | 160 / 0 |
| effect size | 160 | 0 | 0 | 0 | 160 / 0 |
| p value | 147 | 0 | 0 | 13 | 160 / 0 |
| fdr | 134 | 0 | 13 | 13 | 147 / 13 |
| annotation | 132 | 0 | 28 | 0 | 132 / 28 |
| Total | 733 | 0 | 41 | 26 | 759 / 41 |
Performance by family, format and partition
Eleven of the twelve families matched in every held-out case. The twelfth, invalid_probability_cells, matched in none of its 13. Table 3 gives the family breakdown.
| Family | Cases | Exact | Mismatch | 95% interval |
|---|---|---|---|---|
| canonical csv | 13 | 13 | 0 | 0.772-1.000 |
| tsv supported | 13 | 13 | 0 | 0.772-1.000 |
| xlsx single sheet | 13 | 13 | 0 | 0.772-1.000 |
| xlsx explicit sheet required | 13 | 13 | 0 | 0.772-1.000 |
| annotation positive | 14 | 14 | 0 | 0.785-1.000 |
| annotation negative collision | 14 | 14 | 0 | 0.785-1.000 |
| multiple annotation no preference | 14 | 14 | 0 | 0.785-1.000 |
| p value preferred candidate | 14 | 14 | 0 | 0.785-1.000 |
| invalid probability cells | 13 | 0 | 13 | 0.000-0.228 |
| fdr ordering | 13 | 13 | 0 | 0.772-1.000 |
| duplicate identifiers | 13 | 13 | 0 | 0.772-1.000 |
| missing fields | 13 | 13 | 0 | 0.772-1.000 |
| All families | 160 | 147 | 13 | 0.866-0.952 |
Stratifying by format, all 26 workbook fixtures are exact-table matches rather than ingestion successes alone, and all 13 tab-separated files matched. The 121 comma-separated files matched in 108 cases, because the 13 invalid-probability fixtures are comma-separated.
The other two partitions behave the same way. Development matched in 37 of 40 cases, challenge in 36 of 40, and in both partitions every mismatch belongs to invalid_probability_cells. Challenge ingestion succeeded in 40 of 40 cases, its six workbooks all parsed, and its ambiguity states agreed in 200 of 200 comparisons. These partitions are descriptive and are not pooled with the held-out result.
The thirteen mismatches
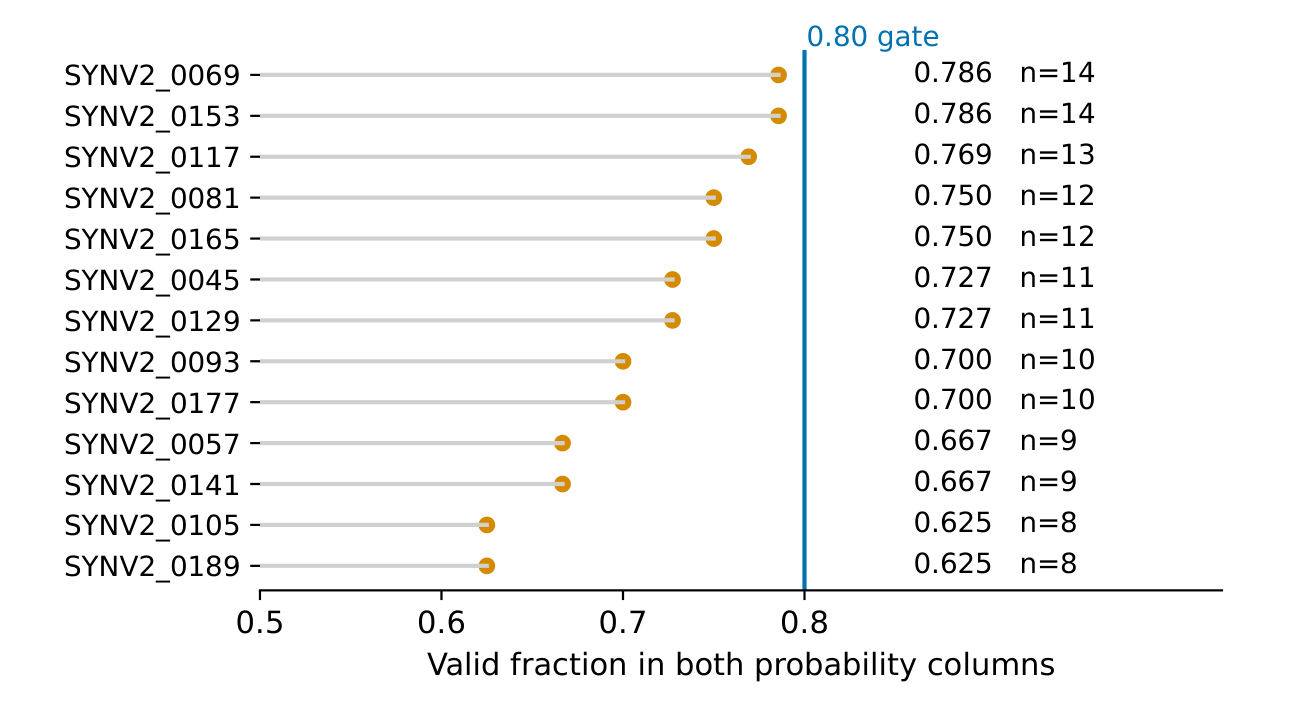
All 13 mismatches share one mechanism. Each case is built with three deliberately invalid cells in each probability column: a non-numeric string, an empty cell, and a value outside the unit interval. With row counts from 8 to 14, the valid fraction is between 0.625 and 0.786, so every case falls below the 0.80 gate. The program recognized the p_value and fdr headers, selected them as the structural candidates, flagged both columns as unusable, and serialized the active mappings as null. The frozen reference expected the column names in those active mappings. Table 4 gives the case-level detail and Figure 2 gives the valid fraction for each of them against the gate.
| Case | Rows | Valid fraction | Expected → observed p / FDR |
|---|---|---|---|
| SYNV2_0045 | 11 | 0.727 | p_value / fdr → null / null |
| SYNV2_0057 | 9 | 0.667 | p_value / fdr → null / null |
| SYNV2_0069 | 14 | 0.786 | p_value / fdr → null / null |
| SYNV2_0081 | 12 | 0.750 | p_value / fdr → null / null |
| SYNV2_0093 | 10 | 0.700 | p_value / fdr → null / null |
| SYNV2_0105 | 8 | 0.625 | p_value / fdr → null / null |
| SYNV2_0117 | 13 | 0.769 | p_value / fdr → null / null |
| SYNV2_0129 | 11 | 0.727 | p_value / fdr → null / null |
| SYNV2_0141 | 9 | 0.667 | p_value / fdr → null / null |
| SYNV2_0153 | 14 | 0.786 | p_value / fdr → null / null |
| SYNV2_0165 | 12 | 0.750 | p_value / fdr → null / null |
| SYNV2_0177 | 10 | 0.700 | p_value / fdr → null / null |
| SYNV2_0189 | 8 | 0.625 | p_value / fdr → null / null |
Re-running the same commit reproduces the same 13 mismatches. Running the later 0.2.1 patch, which changes only the classification of NaN cells, produces identical active mappings on all 13. And in each of these cases the program’s user-facing findings report the p-value and FDR fields as missing, although it had detected both columns and reported them unusable in the same output. That wording is a defect in what the program tells a reader, independent of the mapping question.
We retain all 13 mismatches as failures under the frozen endpoint, giving 147/160 exact and 8.125% mismatch. Two authors separately verified these cases during revision. This is author review after execution, not external adjudication. The proposed cause remains a mismatch between structural expectations in the reference and gated active mappings in the program. No unambiguous specification predating execution resolves the conflict: the protocol describes the 0.80 gate, while the generator expects the column name. Verification by authors does not establish an absence of product defects.
Usability-threshold sensitivity
The 0.80 gate first appears in the code on 25 June 2026, four weeks before the benchmark existed, and it was carried unchanged into 0.2.0 and 0.2.1. We searched the commit history, the design documents and the test suite for a rationale and found none. The earliest implementation computed the fraction over non-missing values; the evaluated version computes it over all rows, which is a change in meaning at the same numeric value.
Re-scoring the frozen outputs across sixteen thresholds gives the pattern in Table 5. Full re-execution and independent reconstruction agree at every threshold. Every held-out case is exact at 0.625 and below. The count falls in steps at the designed valid fractions and reaches 147 at 0.80, where it stays through 1.00.
| Threshold | Exact in both methods | Active p / FDR | Changed cases |
|---|---|---|---|
| 0.5 | 160 | 160 / 147 | 13 |
| 0.55 | 160 | 160 / 147 | 13 |
| 0.6 | 160 | 160 / 147 | 13 |
| 0.625 † | 160 | 160 / 147 | 13 |
| 0.65 | 158 | 158 / 145 | 11 |
| 0.666667 † | 156 | 156 / 143 | 9 |
| 0.7 † | 156 | 156 / 143 | 9 |
| 0.727273 † | 152 | 152 / 139 | 5 |
| 0.75 † | 152 | 152 / 139 | 5 |
| 0.769231 † | 149 | 149 / 136 | 2 |
| 0.785714 † | 149 | 149 / 136 | 2 |
| 0.8 | 147 | 147 / 134 | 0 |
| 0.85 | 147 | 147 / 134 | 0 |
| 0.9 | 147 | 147 / 134 | 0 |
| 0.95 | 147 | 147 / 134 | 0 |
| 1.0 | 147 | 147 / 134 | 0 |
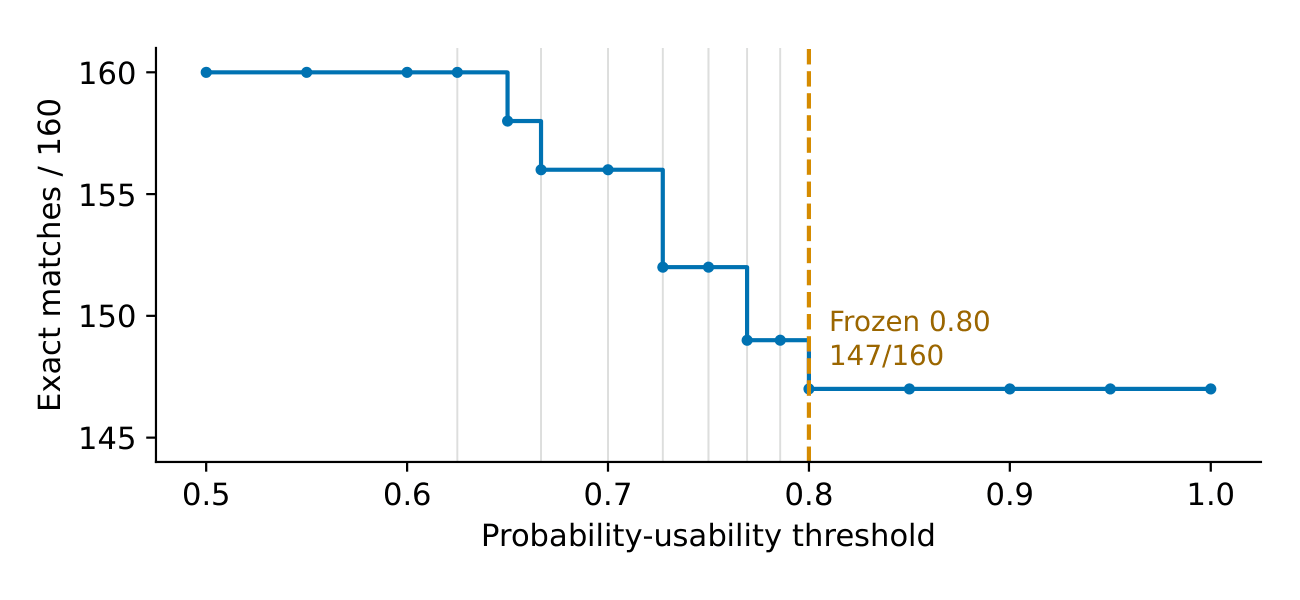
The flat region above 0.80 is a property of the benchmark, not of the program. Because the invalid family was built with exactly three bad cells in tables of 8 to 14 rows, no case has a valid fraction between 0.786 and 1.0, so these fixtures cannot distinguish a gate of 0.80 from a gate of 0.99.
Component ablation
Restricting header matching to columns whose normalized name equals the canonical field name reproduced the expected five-field mapping in 0 of 160 cases. That number describes the benchmark as much as the program: the effect-size column is never called effect_size in these fixtures, it is logFC or delta abundance, so this variant fails every case on that one field. Governed aliases without the usability gate reproduced all five active mappings in 160 of 160 cases. The full framework, aliases plus gate, reproduced them in 147. The 13-case difference between the second and third variants is the entire cost of the gate on this benchmark.
Component-level checks against the design all agree in 160 of 160 cases: ingestion outcome, parsed header set and row count, structural column selection with ambiguity states, reconstructed table dimensions, invalid-cell counts, and the FDR-ordering and duplicate-identifier flags.
The FDR-ordering comparison set
The Methods of earlier drafts of this work stated that invalid rows do not produce misleading ordering warnings. That statement is wrong. The ordering summary is computed on the raw structurally selected columns, before and independently of the usability gate, and its comparison set is every row where both values survive numeric coercion. Values outside the unit interval survive coercion. In the 20 benchmark cases that carry invalid probability cells, the pair holding 1.7 and -0.2 enters the denominator.
We compared that rule against a restricted comparison set containing only pairs that are numeric, finite and within the unit interval on both sides. Our re-implementation of the historical rule reproduces the frozen output in all 240 cases. The restricted rule changes the denominator in exactly 20 cases, three in development, 13 in held-out and four in challenge, removing one pair in each. It changes no warning decision anywhere in the benchmark. No case in the benchmark contains an infinite value, so that part of the restricted definition is exercised only by a unit test.
The separate warning threshold also lacks a recorded empirical or theoretical justification. In a post hoc sweep, both rules emitted zero warnings at 0.50 and 13 held-out warnings at 0.60, 0.70 and 0.80. At 0.90, the historical rule emitted 21 held-out warnings and the restricted rule 13; at 1.00, the counts were 26 and 13. Across all 240 cases, the corresponding historical/restricted totals were 0/0, 20/20, 20/20, 20/20, 32/20 and 40/20. Supporting Information S3 reports all partitions. Thus the comparison-set choice changes decisions at higher thresholds even though it changes none at 0.80. We retain 0.80 only to describe the evaluated version; the sweep does not calibrate it for real data.
Output coverage
The frozen endpoint covers eleven output components in each of 160 cases: five active mappings, five ambiguity states and the ingestion outcome. Coverage there is complete, with no excluded comparisons.
Several outputs described in the Methods were never scored against an expected value. The audit score, the confidence label, the completeness flags, the user-facing findings and the provenance fields have no frozen expectation, so their coverage is zero. The cell-level classification counts and the FDR-ordering and duplicate flags do have derivable expectations, and scoring them after the fact gives agreement in 160 of 160 cases for each; those results are post hoc and are not part of the primary endpoint. We therefore restrict every claim in this paper to the eleven components that were compared, and we do not describe the unscored outputs as evaluated.
Repeat execution and artefact integrity
Re-executing the locked commit twice in fresh directories produced 240 output files each time. All 240 are byte-identical between the two runs and byte-identical to the July outputs, with no differing key anywhere in the serialized results, including the confidence score, the flags and the provenance fields. All 720 freeze-inventory hashes verify against the current files, and all 240 recorded output hashes match the stored outputs, so the historical evidence has not been edited.
Regenerating the benchmark from the committed generator reproduces 200 of 240 files byte for byte. The 40 workbooks differ only in metadata bytes written by the spreadsheet library and are content-identical after parsing. The regression suite for the 13 cases passes 79 tests. The program’s own test suite passes 345 of 350 tests in the current environment with four skips and one failure, which concerns the classification of NaN cells under pandas 3 and is the defect corrected in 0.2.1; that suite passed in full in the July environment. We also note that the benchmark ships no contract test for the v2 generator: the passing generator test recorded in the command log belongs to the earlier v1 generator.
While auditing the reference we found a defect in it. In 80 ground-truth records, 53 of them in the held-out partition, the list of expected structural candidates names the generator’s default header rather than the header written into the file, because the generator builds that list before applying family-specific header substitutions. The field is not part of any scored comparison, so no reported number changes. Nothing scored that field, so the error persisted from the July freeze until these revision analyses.
Benchmark duplication
Fingerprinting every case by normalized parsed content gives 98 distinct specifications among the 240 cases and 92 distinct fingerprints within the held-out partition alone. Sixty-five of the 160 held-out tables are content-identical to a development table. One hundred and twenty are identical to a table in some other partition. Sixty-six duplicate groups span more than one partition and cover 194 of the 240 cases.
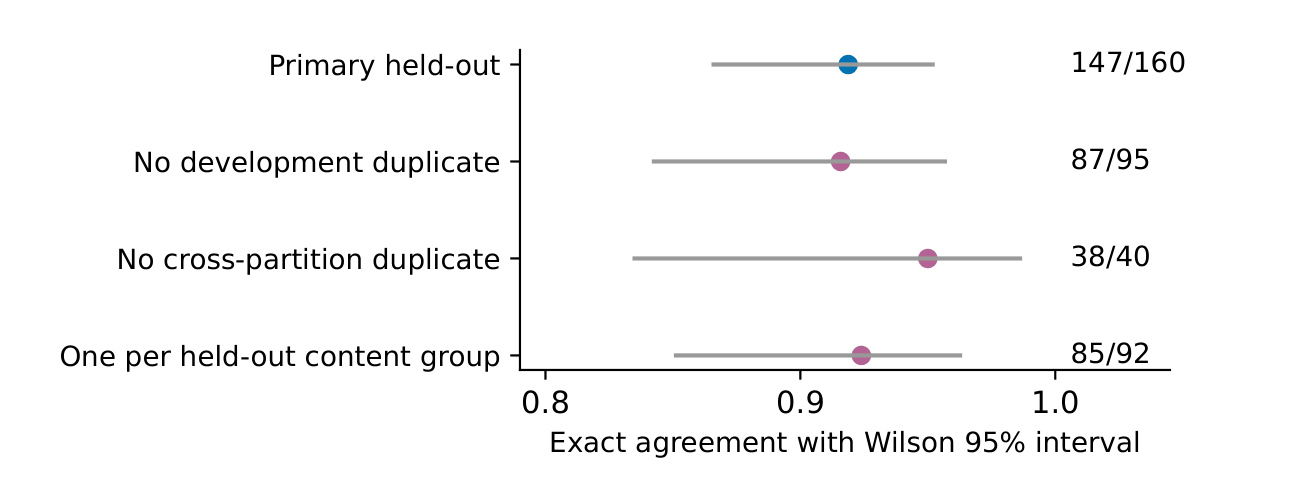
Restricting the held-out result to cases without an exact development duplicate leaves 87 exact of 95. Restricting further to cases with no duplicate in any other partition leaves 38 of 40. Collapsing each set of identical held-out tables to a single representative leaves 85 of 92. Figure 4 shows these subsets against the primary result. All of them are post hoc, none replaces the endpoint, and the qualitative picture does not move, because every mismatch has the same cause.
External-corpus feasibility screen
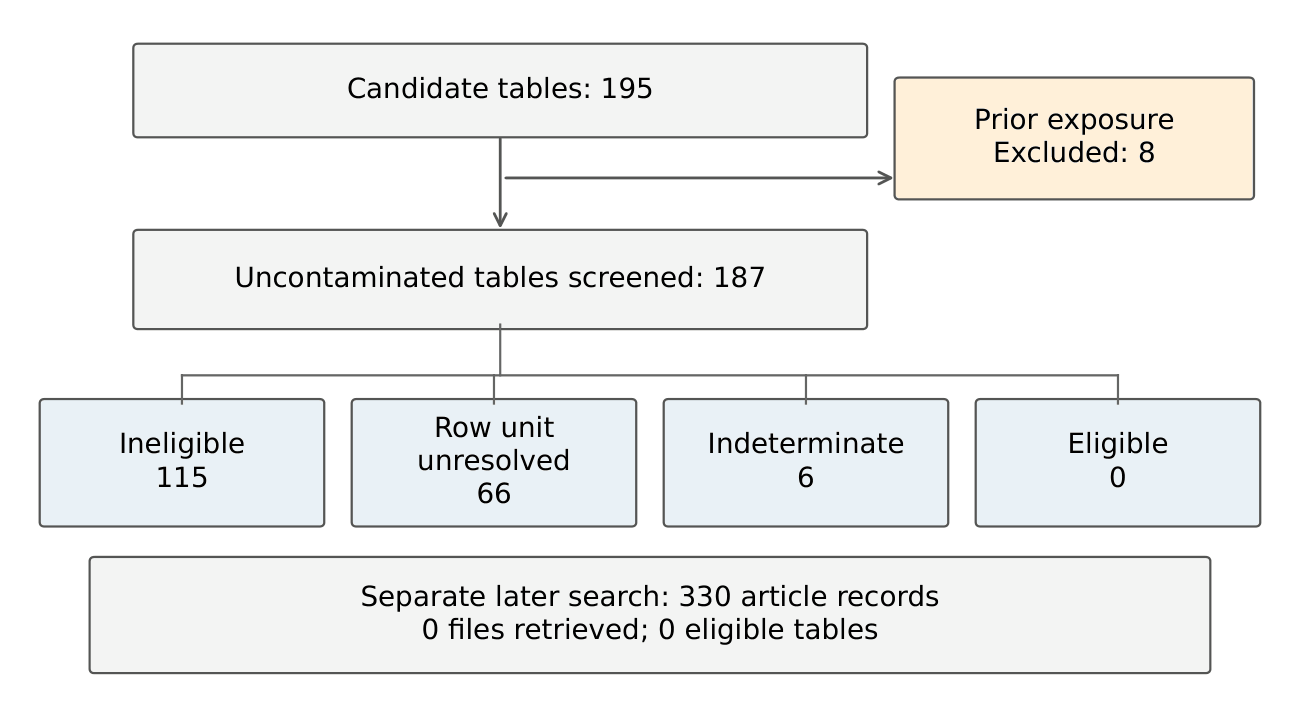
The frozen table manifest holds 195 candidate tables. Eight were removed because a Validex 0.1.0 output existed for them, leaving 187 uncontaminated candidates for eligibility screening. Of those, 115 were confirmed ineligible, 66 had an unresolved row unit, six were indeterminate on modality, and none were confirmed eligible. The four statuses sum to 187, and 195 minus 8 gives the same total. The second search screened 330 article and repository records and retrieved no usable file, because every open-access package fetch failed at the source. Table 6 and Figure 5 give the flow.
| Stage | Count |
|---|---|
| Candidate tables | 195 |
| Prior-exposure exclusions | 8 |
| Uncontaminated tables screened | 187 |
| Confirmed ineligible | 115 |
| Row unit unresolved | 66 |
| Indeterminate modality | 6 |
| Confirmed eligible | 0 |
| Later-search article records | 330 |
| Later-search files retrieved | 0 |
The statuses reflect deterministic keyword rules over recorded headers. Agreement between the two script variants is therefore dependent evidence. Two authors subsequently verified the records separately, but no paired human rating files were retained for calculating agreement. The published counts remain the frozen rule-based dispositions. They show that the recorded pool did not yield an eligible corpus under those rules, without estimating how common eligible public tables are.
Discussion
Interpretation of the primary result
Validex reproduced the frozen endpoint in 147/160 held-out cases. The endpoint contains ingestion, active mappings and ambiguity states; it does not certify the full audit output. Byte-identical repeat execution establishes determinism in the tested environment. Developer evaluations can yield optimistic results53, and a meta-analysis of published benchmarks identified shortcomings in extensibility and interoperability54. Experiments with metabolomics annotation tools show why benchmark design and train-test separation affect measured performance55. Our developer-built reference and duplicated fixtures prevent interpreting 91.875% agreement as real-world accuracy.
The thirteen failures and the two thresholds
All 13 failures involve suppressed p-value and FDR mappings below the usability gate. The interpretation that the reference expected structural names where the program emits gated mappings remains post hoc, including after author verification. The user-facing description of these columns as missing is a separate defect: the program found them but judged them unusable.
Neither 0.80 threshold has a recorded calibration rationale. The usability sweep cannot distinguish thresholds above 11/14 and at most 1.0 because no fixture has an intermediate valid fraction. The ordering sweep shows that including invalid pairs changes warning decisions at 0.90 and 1.00. A later release should distinguish absent from unusable columns and use finite in-range pairs, and name the output a numeric-ordering heuristic. Even that restricted heuristic cannot establish an error for methods whose q-values may fall below raw p-values. Changes to a later release must be evaluated separately from the frozen 0.2.0 result.
Dependence and coverage
The 240 fixtures contain 98 distinct specifications. Sixty-five held-out tables duplicate development content, and 120 duplicate content in another partition. Hash verification detects changes after an inventory was made; it does not establish independence of the original design or an externally authenticated freeze time. The reported Wilson intervals assume independent Bernoulli observations and should be treated as descriptive here. Collapsing identical held-out content gives 85/92 exact, but 92 unique fixtures are not necessarily 92 independent observations.
The benchmark covers twelve designed families and a narrow set of file structures. It does not cover encrypted workbooks, merged headers, multiple embedded tables, formula recalculation or reconstruction of damaged inputs. A fixed alias registry cannot recognize arbitrary unseen synonyms. Five output types lack frozen expected values, and an unscored structural-candidate field contained reference errors. Repetition on one platform does not establish portability.
External data and future evaluation
The screen yielded zero eligible tables from 187 uncontaminated candidates. The later search retained 330 records but retrieved no files. Missing pilot queries, bounded retrieval and keyword-based dispositions limit this feasibility result. Subsequent author verification does not create a separately retained expert reference or a measurable inter-rater agreement result. The 66 unresolved row units and six indeterminate modalities remain unresolved in the frozen record.
A real-world evaluation would require externally supplied tables, eligibility fixed before running Validex and labels set by at least two domain experts without seeing its outputs. Their initial ratings and reconciled labels should both be retained. A revised synthetic benchmark should distinguish structural recognition from active emission, remove exact duplicates and place cases around both thresholds. Metamorphic tests could check invariance under row permutation or header capitalization without requiring a new reference for every transformed input56,57.
Conclusion
Validex 0.2.0 achieved 147/160 exact agreement and an 8.125% mismatch rate on the frozen held-out endpoint, with byte-identical repeat execution. All 13 failures arose where the usability gate suppressed mappings expected by the reference. The benchmark was developed within the same project, and 120 of its 160 held-out tables duplicate content in another partition. These results establish bounded engineering conformance; they do not establish accuracy on real metabolomics tables.
Acknowledgments
The authors thank the maintainers of the public repositories consulted during the corpus screen. No external funding supported this work.
Data and Code Availability
The accompanying Validex_Review_Package.zip supplies the evaluated source snapshot, 240 frozen inputs, case specifications and ground truth, the 720-entry freeze inventory, historical and repeated outputs, analysis scripts, environment records and reproduction commands. The package includes Supporting_Information.docx and machine-readable supporting data, with per-file SHA-256 checksums. Reviewers can extract the archive and run reproduce.py from its root. This archive is supplied as the equivalent review package requested in the decision letter; access does not depend on acceptance or a future deposit.
AI Use Disclosure
AI coding assistants (Claude, Anthropic) were used to review the software, the benchmark generator, the execution runner and the analysis scripts, and to run the post hoc analyses. Corpus eligibility statuses were produced by a deterministic script that makes no model call at run time. A separate semantic review of a 188-table set used three isolated OpenAI Codex agent sessions whose served model identity was not exposed by the interface; that activity is reported as workflow evidence and not as expert review. No AI system is an author.
Conflicts of Interest
The authors declare no conflicts of interest.
Supplementary Material
References
- L. W. Sumner, A. Amberg, D. Barrett, M. H. Beale, R. Beger, C. A. Daykin, T. W. M. Fan, O. Fiehn, R. Goodacre, J. L. Griffin, T. Hankemeier, N. Hardy, J. Harnly, R. Higashi, J. Kopka, A. N. Lane, J. C. Lindon, P. Marriott, A. W. Nicholls, M. D. Reily, J. J. Thaden, M. R. Viant. Proposed minimum reporting standards for chemical analysis. Metabolomics. Vol. 3(3), pg. 211-221, 2007, https://doi.org/10.1007/s11306-007-0082-2. [↩]
- S. Alseekh, A. Aharoni, Y. Brotman, K. Contrepois, J. D’Auria, J. Ewald, J. C. Ewald, P. D. Fraser, P. Giavalisco, R. D. Hall, M. Heinemann, H. Link, J. Luo, S. Neumann, J. Nielsen, L. Perez de Souza, K. Saito, U. Sauer, F. C. Schroeder, S. Schuster, G. Siuzdak, A. Skirycz, L. W. Sumner, M. P. Snyder, H. Tang, T. Tohge, Y. Wang, W. Wen, S. Wu, G. Xu, N. Zamboni, A. R. Fernie. Mass spectrometry-based metabolomics: a guide for annotation, quantification and best reporting practices. Nature Methods. Vol. 18(7), pg. 747-756, 2021, https://doi.org/10.1038/s41592-021-01197-1. [↩]
- E. L. Schymanski, J. Jeon, R. Gulde, K. Fenner, M. Ruff, H. P. Singer, J. Hollender. Identifying small molecules via high resolution mass spectrometry: communicating confidence. Environmental Science & Technology. Vol. 48(4), pg. 2097-2098, 2014, https://doi.org/10.1021/es5002105. [↩]
- E. C. Considine, G. Thomas, A. L. Boulesteix, A. S. Khashan, L. C. Kenny. Critical review of reporting of the data analysis step in metabolomics. Metabolomics. Vol. 14(1), pg. 7, 2018, https://doi.org/10.1007/s11306-017-1299-3. [↩]
- E. Fahy, S. Subramaniam. RefMet: a reference nomenclature for metabolomics. Nature Methods. Vol. 17(12), pg. 1173-1174, 2020, https://doi.org/10.1038/s41592-020-01009-y. [↩]
- R. Chaleckis, I. Meister, P. Zhang, C. E. Wheelock. Challenges, progress and promises of metabolite annotation for LC-MS-based metabolomics. Current Opinion in Biotechnology. Vol. 55, pg. 44-50, 2019, https://doi.org/10.1016/j.copbio.2018.07.010. [↩]
- Z. Pang, J. Chong, G. Zhou, D. A. de Lima Morais, L. Chang, M. Barrette, C. Gauthier, P. É. Jacques, S. Li, J. Xia. MetaboAnalyst 5.0: narrowing the gap between raw spectra and functional insights. Nucleic Acids Research. Vol. 49(W1), pg. W388-W396, 2021, https://doi.org/10.1093/nar/gkab382. [↩]
- Z. Pang, Y. Lu, G. Zhou, F. Hui, L. Xu, C. Viau, A. F. Spigelman, P. E. MacDonald, D. S. Wishart, S. Li, J. Xia. MetaboAnalyst 6.0: towards a unified platform for metabolomics data processing, analysis and interpretation. Nucleic Acids Research. Vol. 52(W1), pg. W398-W406, 2024, https://doi.org/10.1093/nar/gkae253. [↩]
- Z. Pang, L. Xu, C. Viau, Y. Lu, R. Salavati, N. Basu, J. Xia. MetaboAnalystR 4.0: a unified LC-MS workflow for global metabolomics. Nature Communications. Vol. 15(1), pg. 3675, 2024, https://doi.org/10.1038/s41467-024-48009-6. [↩]
- R. Schmid, S. Heuckeroth, A. Korf, A. Smirnov, O. Myers, T. S. Dyrlund, R. Bushuiev, K. J. Murray, N. Hoffmann, M. Lu, A. Sarvepalli, Z. Zhang, M. Fleischauer, K. Dührkop, M. Wesner, S. J. Hoogstra, E. Rudt, O. Mokshyna, C. Brungs, K. Ponomarov, L. Mutabdžija, T. Damiani, C. J. Pudney, M. Earll, P. O. Helmer, T. R. Fallon, T. Schulze, A. Rivas-Ubach, A. Bilbao, H. Richter, L. F. Nothias, M. Wang, M. Orešič, J. K. Weng, S. Böcker, A. Jeibmann, H. Hayen, U. Karst, P. C. Dorrestein, D. Petras, X. Du, T. Pluskal. Integrative analysis of multimodal mass spectrometry data in MZmine 3. Nature Biotechnology. Vol. 41(4), pg. 447-449, 2023, https://doi.org/10.1038/s41587-023-01690-2. [↩]
- H. Tsugawa, K. Ikeda, M. Takahashi, A. Satoh, Y. Mori, H. Uchino, N. Okahashi, Y. Yamada, I. Tada, P. Bonini, Y. Higashi, Y. Okazaki, Z. Zhou, Z. J. Zhu, J. Koelmel, T. Cajka, O. Fiehn, K. Saito, M. Arita, M. Arita. A lipidome atlas in MS-DIAL 4. Nature Biotechnology. Vol. 38(10), pg. 1159-1163, 2020, https://doi.org/10.1038/s41587-020-0531-2. [↩]
- J. Stanstrup, C. Broeckling, R. Helmus, N. Hoffmann, E. Mathé, T. Naake, L. Nicolotti, K. Peters, J. Rainer, R. Salek, T. Schulze, E. Schymanski, M. Stravs, E. Thévenot, H. Treutler, R. Weber, E. Willighagen, M. Witting, S. Neumann. The metaRbolomics toolbox in Bioconductor and beyond. Metabolites. Vol. 9(10), pg. 200, 2019, https://doi.org/10.3390/metabo9100200. [↩]
- R. Spicer, R. M. Salek, P. Moreno, D. Cañueto, C. Steinbeck. Navigating freely-available software tools for metabolomics analysis. Metabolomics. Vol. 13(9), pg. 106, 2017, https://doi.org/10.1007/s11306-017-1242-7. [↩]
- R. Helmus, T. L. ter Laak, A. P. van Wezel, P. de Voogt, E. L. Schymanski. patRoon: open source software platform for environmental mass spectrometry based non-target screening. Journal of Cheminformatics. Vol. 13(1), pg. 1, 2021, https://doi.org/10.1186/s13321-020-00477-w. [↩]
- K. Dührkop, M. Fleischauer, M. Ludwig, A. A. Aksenov, A. V. Melnik, M. Meusel, P. C. Dorrestein, J. Rousu, S. Böcker. SIRIUS 4: a rapid tool for turning tandem mass spectra into metabolite structure information. Nature Methods. Vol. 16(4), pg. 299-302, 2019, https://doi.org/10.1038/s41592-019-0344-8. [↩]
- K. Dührkop, L. F. Nothias, M. Fleischauer, R. Reher, M. Ludwig, M. A. Hoffmann, D. Petras, W. H. Gerwick, J. Rousu, P. C. Dorrestein, S. Böcker. Systematic classification of unknown metabolites using high-resolution fragmentation mass spectra. Nature Biotechnology. Vol. 39(4), pg. 462-471, 2021, https://doi.org/10.1038/s41587-020-0740-8. [↩]
- L. F. Nothias, D. Petras, R. Schmid, K. Dührkop, J. Rainer, A. Sarvepalli, I. Protsyuk, M. Ernst, H. Tsugawa, M. Fleischauer, F. Aicheler, A. A. Aksenov, O. Alka, P. M. Allard, A. Barsch, X. Cachet, A. M. Caraballo-Rodriguez, R. R. Da Silva, T. Dang, N. Garg, J. M. Gauglitz, A. Gurevich, G. Isaac, A. K. Jarmusch, Z. Kameník, K. B. Kang, N. Kessler, I. Koester, A. Korf, A. Le Gouellec, M. Ludwig, C. Martin H., L. I. McCall, J. McSayles, S. W. Meyer, H. Mohimani, M. Morsy, O. Moyne, S. Neumann, H. Neuweger, N. H. Nguyen, M. Nothias-Esposito, J. Paolini, V. V. Phelan, T. Pluskal, R. A. Quinn, S. Rogers, B. Shrestha, A. Tripathi, J. J. J. van der Hooft, F. Vargas, K. C. Weldon, M. Witting, H. Yang, Z. Zhang, F. Zubeil, O. Kohlbacher, S. Böcker, T. Alexandrov, N. Bandeira, M. Wang, P. C. Dorrestein. Feature-based molecular networking in the GNPS analysis environment. Nature Methods. Vol. 17(9), pg. 905-908, 2020, https://doi.org/10.1038/s41592-020-0933-6. [↩]
- R. Schmid, D. Petras, L. F. Nothias, M. Wang, A. T. Aron, A. Jagels, H. Tsugawa, J. Rainer, M. Garcia-Aloy, K. Dührkop, A. Korf, T. Pluskal, Z. Kameník, A. K. Jarmusch, A. M. Caraballo-Rodríguez, K. C. Weldon, M. Nothias-Esposito, A. A. Aksenov, A. Bauermeister, A. Albarracin Orio, C. O. Grundmann, F. Vargas, I. Koester, J. M. Gauglitz, E. C. Gentry, Y. Hövelmann, S. A. Kalinina, M. A. Pendergraft, M. Panitchpakdi, R. Tehan, A. Le Gouellec, G. Aleti, H. Mannochio Russo, B. Arndt, F. Hübner, H. Hayen, H. Zhi, M. Raffatellu, K. A. Prather, L. I. Aluwihare, S. Böcker, K. L. McPhail, H. U. Humpf, U. Karst, P. C. Dorrestein. Ion identity molecular networking for mass spectrometry-based metabolomics in the GNPS environment. Nature Communications. Vol. 12(1), pg. 3832, 2021, https://doi.org/10.1038/s41467-021-23953-9. [↩]
- F. Huber, L. Ridder, S. Verhoeven, J. H. Spaaks, F. Diblen, S. Rogers, J. J. J. van der Hooft. Spec2Vec: improved mass spectral similarity scoring through learning of structural relationships. PLOS Computational Biology. Vol. 17(2), pg. e1008724, 2021, https://doi.org/10.1371/journal.pcbi.1008724. [↩]
- F. Huber, S. van der Burg, J. J. J. van der Hooft, L. Ridder. MS2DeepScore: a novel deep learning similarity measure to compare tandem mass spectra. Journal of Cheminformatics. Vol. 13(1), pg. 84, 2021, https://doi.org/10.1186/s13321-021-00558-4. [↩]
- D. S. Wishart, A. Guo, E. Oler, F. Wang, A. Anjum, H. Peters, R. Dizon, Z. Sayeeda, S. Tian, B. L. Lee, M. Berjanskii, R. Mah, M. Yamamoto, J. Jovel, C. Torres-Calzada, M. Hiebert-Giesbrecht, V. W. Lui, D. Varshavi, D. Varshavi, D. Allen, D. Arndt, N. Khetarpal, A. Sivakumaran, K. Harford, S. Sanford, K. Yee, X. Cao, Z. Budinski, J. Liigand, L. Zhang, J. Zheng, R. Mandal, N. Karu, M. Dambrova, H. B. Schiöth, R. Greiner, V. Gautam. HMDB 5.0: the Human Metabolome Database for 2022. Nucleic Acids Research. Vol. 50(D1), pg. D622-D631, 2022, https://doi.org/10.1093/nar/gkab1062. [↩]
- M. Ziemann, Y. Eren, A. El-Osta. Gene name errors are widespread in the scientific literature. Genome Biology. Vol. 17(1), pg. 177, 2016, https://doi.org/10.1186/s13059-016-1044-7. [↩]
- M. Abeysooriya, M. Soria, M. S. Kasu, M. Ziemann. Gene name errors: lessons not learned. PLOS Computational Biology. Vol. 17(7), pg. e1008984, 2021, https://doi.org/10.1371/journal.pcbi.1008984. [↩]
- K. W. Broman, K. H. Woo. Data organization in spreadsheets. The American Statistician. Vol. 72(1), pg. 2-10, 2018, https://doi.org/10.1080/00031305.2017.1375989. [↩]
- Y. Benjamini, Y. Hochberg. Controlling the false discovery rate: a practical and powerful approach to multiple testing. Journal of the Royal Statistical Society Series B: Statistical Methodology. Vol. 57(1), pg. 289-300, 1995, https://doi.org/10.1111/j.2517-6161.1995.tb02031.x. [↩]
- J. D. Storey, R. Tibshirani. Statistical significance for genomewide studies. Proceedings of the National Academy of Sciences. Vol. 100(16), pg. 9440-9445, 2003, https://doi.org/10.1073/pnas.1530509100. [↩]
- K. Korthauer, P. K. Kimes, C. Duvallet, A. Reyes, A. Subramanian, M. Teng, C. Shukla, E. J. Alm, S. C. Hicks. A practical guide to methods controlling false discoveries in computational biology. Genome Biology. Vol. 20(1), pg. 118, 2019, https://doi.org/10.1186/s13059-019-1716-1. [↩]
- C. Wieder, C. Frainay, N. Poupin, P. Rodríguez-Mier, F. Vinson, J. Cooke, R. P. Lai, J. G. Bundy, F. Jourdan, T. Ebbels. Pathway analysis in metabolomics: recommendations for the use of over-representation analysis. PLOS Computational Biology. Vol. 17(9), pg. e1009105, 2021, https://doi.org/10.1371/journal.pcbi.1009105. [↩]
- N. Hoffmann, J. Rein, T. Sachsenberg, J. Hartler, K. Haug, G. Mayer, O. Alka, S. Dayalan, J. T. M. Pearce, P. Rocca-Serra, D. Qi, M. Eisenacher, Y. Perez-Riverol, J. A. Vizcaíno, R. M. Salek, S. Neumann, A. R. Jones. mzTab-M: a data standard for sharing quantitative results in mass spectrometry metabolomics. Analytical Chemistry. Vol. 91(5), pg. 3302-3310, 2019, https://doi.org/10.1021/acs.analchem.8b04310. [↩]
- N. Hoffmann, J. Hartler, R. Ahrends. jmzTab-M: a reference parser, writer, and validator for the Proteomics Standards Initiative mzTab 2.0 metabolomics standard. Analytical Chemistry. Vol. 91(20), pg. 12615-12618, 2019, https://doi.org/10.1021/acs.analchem.9b01987. [↩]
- C. D. Powell, H. N. B. Moseley. The mwtab Python library for RESTful access and enhanced quality control, deposition, and curation of the Metabolomics Workbench data repository. Metabolites. Vol. 11(3), pg. 163, 2021, https://doi.org/10.3390/metabo11030163. [↩]
- R. M. Salek, S. Neumann, D. Schober, J. Hummel, K. Billiau, J. Kopka, E. Correa, T. Reijmers, A. Rosato, L. Tenori, P. Turano, S. Marin, C. Deborde, D. Jacob, D. Rolin, B. Dartigues, P. Conesa, K. Haug, P. Rocca-Serra, S. O’Hagan, J. Hao, M. van Vliet, M. Sysi-Aho, C. Ludwig, J. Bouwman, M. Cascante, T. Ebbels, J. L. Griffin, A. Moing, M. Nikolski, M. Oresic, S. A. Sansone, M. R. Viant, R. Goodacre, U. L. Günther, T. Hankemeier, C. Luchinat, D. Walther, C. Steinbeck. COordination of Standards in MetabOlomicS (COSMOS): facilitating integrated metabolomics data access. Metabolomics. Vol. 11(6), pg. 1587-1597, 2015, https://doi.org/10.1007/s11306-015-0810-y. [↩]
- S. A. Sansone, P. Rocca-Serra, D. Field, E. Maguire, C. Taylor, O. Hofmann, H. Fang, S. Neumann, W. Tong, L. Amaral-Zettler, K. Begley, T. Booth, L. Bougueleret, G. Burns, B. Chapman, T. Clark, L. A. Coleman, J. Copeland, S. Das, A. de Daruvar, P. de Matos, I. Dix, S. Edmunds, C. T. Evelo, M. J. Forster, P. Gaudet, J. Gilbert, C. Goble, J. L. Griffin, D. Jacob, J. Kleinjans, L. Harland, K. Haug, H. Hermjakob, S. J. H. Sui, A. Laederach, S. Liang, S. Marshall, A. McGrath, E. Merrill, D. Reilly, M. Roux, C. E. Shamu, C. A. Shang, C. Steinbeck, A. Trefethen, B. Williams-Jones, K. Wolstencroft, I. Xenarios, W. Hide. Toward interoperable bioscience data. Nature Genetics. Vol. 44(2), pg. 121-126, 2012, https://doi.org/10.1038/ng.1054. [↩]
- P. Rocca-Serra, R. M. Salek, M. Arita, E. Correa, S. Dayalan, A. Gonzalez-Beltran, T. Ebbels, R. Goodacre, J. Hastings, K. Haug, A. Koulman, M. Nikolski, M. Oresic, S. A. Sansone, D. Schober, J. Smith, C. Steinbeck, M. R. Viant, S. Neumann. Data standards can boost metabolomics research, and if there is a will, there is a way. Metabolomics. Vol. 12(1), pg. 14, 2016, https://doi.org/10.1007/s11306-015-0879-3. [↩]
- N. Bantilan. pandera: statistical data validation of pandas dataframes. Proceedings of the Python in Science Conference. pg. 116-124, 2020, https://doi.org/10.25080/majora-342d178e-010. [↩]
- S. Schelter, D. Lange, P. Schmidt, M. Celikel, F. Biessmann, A. Grafberger. Automating large-scale data quality verification. Proceedings of the VLDB Endowment. Vol. 11(12), pg. 1781-1794, 2018, https://doi.org/10.14778/3229863.3229867. [↩]
- M. D. Wilkinson, M. Dumontier, I. J. Aalbersberg, G. Appleton, M. Axton, A. Baak, N. Blomberg, J. W. Boiten, L. B. da Silva Santos, P. E. Bourne, J. Bouwman, A. J. Brookes, T. Clark, M. Crosas, I. Dillo, O. Dumon, S. Edmunds, C. T. Evelo, R. Finkers, A. Gonzalez-Beltran, A. J. G. Gray, P. Groth, C. Goble, J. S. Grethe, J. Heringa, P. A. C. ’t Hoen, R. Hooft, T. Kuhn, R. Kok, J. Kok, S. J. Lusher, M. E. Martone, A. Mons, A. L. Packer, B. Persson, P. Rocca-Serra, M. Roos, R. van Schaik, S. A. Sansone, E. Schultes, T. Sengstag, T. Slater, G. Strawn, M. A. Swertz, M. Thompson, J. van der Lei, E. van Mulligen, J. Velterop, A. Waagmeester, P. Wittenburg, K. Wolstencroft, J. Zhao, B. Mons. The FAIR Guiding Principles for scientific data management and stewardship. Scientific Data. Vol. 3(1), pg. 160018, 2016, https://doi.org/10.1038/sdata.2016.18. [↩]
- L. M. Weber, W. Saelens, R. Cannoodt, C. Soneson, A. Hapfelmeier, P. P. Gardner, A. L. Boulesteix, Y. Saeys, M. D. Robinson. Essential guidelines for computational method benchmarking. Genome Biology. Vol. 20(1), pg. 125, 2019, https://doi.org/10.1186/s13059-019-1738-8. [↩]
- S. Mangul, L. S. Martin, B. L. Hill, A. K. M. Lam, M. G. Distler, A. Zelikovsky, E. Eskin, J. Flint. Systematic benchmarking of omics computational tools. Nature Communications. Vol. 10(1), pg. 1393, 2019, https://doi.org/10.1038/s41467-019-09406-4. [↩]
- M. Sokolova, G. Lapalme. A systematic analysis of performance measures for classification tasks. Information Processing & Management. Vol. 45(4), pg. 427-437, 2009, https://doi.org/10.1016/j.ipm.2009.03.002. [↩]
- E. B. Wilson. Probable inference, the law of succession, and statistical inference. Journal of the American Statistical Association. Vol. 22(158), pg. 209-212, 1927, https://doi.org/10.1080/01621459.1927.10502953. [↩]
- L. D. Brown, T. T. Cai, A. DasGupta. Interval estimation for a binomial proportion. Statistical Science. Vol. 16(2), 2001, https://doi.org/10.1214/ss/1009213286. [↩]
- K. Haug, K. Cochrane, V. C. Nainala, M. Williams, J. Chang, K. V. Jayaseelan, C. O’Donovan. MetaboLights: a resource evolving in response to the needs of its scientific community. Nucleic Acids Research. Vol. 48(D1), pg. D440-D444, 2020, https://doi.org/10.1093/nar/gkz1019. [↩]
- O. Yurekten, T. Payne, N. Tejera, F. X. Amaladoss, C. Martin, M. Williams, C. O’Donovan. MetaboLights: open data repository for metabolomics. Nucleic Acids Research. Vol. 52(D1), pg. D640-D646, 2024, https://doi.org/10.1093/nar/gkad1045. [↩]
- M. Sud, E. Fahy, D. Cotter, K. Azam, I. Vadivelu, C. Burant, A. Edison, O. Fiehn, R. Higashi, K. S. Nair, S. Sumner, S. Subramaniam. Metabolomics Workbench: an international repository for metabolomics data and metadata, metabolite standards, protocols, tutorials and training, and analysis tools. Nucleic Acids Research. Vol. 44(D1), pg. D463-D470, 2016, https://doi.org/10.1093/nar/gkv1042. [↩]
- J. A. Kirwan, H. Gika, R. D. Beger, D. Bearden, W. B. Dunn, R. Goodacre, G. Theodoridis, M. Witting, L. R. Yu, I. D. Wilson, the metabolomics Quality Assurance and Quality Control Consortium (mQACC). Quality assurance and quality control reporting in untargeted metabolic phenotyping: mQACC recommendations for analytical quality management. Metabolomics. Vol. 18(9), pg. 70, 2022, https://doi.org/10.1007/s11306-022-01926-3. [↩]
- J. G. McDonald, C. S. Ejsing, D. Kopczynski, M. Holčapek, J. Aoki, M. Arita, M. Arita, E. S. Baker, J. Bertrand-Michel, J. A. Bowden, B. Brügger, S. R. Ellis, M. Fedorova, W. J. Griffiths, X. Han, J. Hartler, N. Hoffmann, J. P. Koelmel, H. C. Köfeler, T. W. Mitchell, V. B. O’Donnell, D. Saigusa, D. Schwudke, A. Shevchenko, C. Z. Ulmer, M. R. Wenk, M. Witting, D. Wolrab, Y. Xia, R. Ahrends, G. Liebisch, K. Ekroos. Introducing the Lipidomics Minimal Reporting Checklist. Nature Metabolism. Vol. 4(9), pg. 1086-1088, 2022, https://doi.org/10.1038/s42255-022-00628-3. [↩]
- G. K. Sandve, A. Nekrutenko, J. Taylor, E. Hovig. Ten simple rules for reproducible computational research. PLoS Computational Biology. Vol. 9(10), pg. e1003285, 2013, https://doi.org/10.1371/journal.pcbi.1003285. [↩]
- V. Stodden, M. McNutt, D. H. Bailey, E. Deelman, Y. Gil, B. Hanson, M. A. Heroux, J. P. A. Ioannidis, M. Taufer. Enhancing reproducibility for computational methods. Science. Vol. 354(6317), pg. 1240-1241, 2016, https://doi.org/10.1126/science.aah6168. [↩]
- R. D. Peng. Reproducible research in computational science. Science. Vol. 334(6060), pg. 1226-1227, 2011, https://doi.org/10.1126/science.1213847. [↩]
- A. Trisovic, M. K. Lau, T. Pasquier, M. Crosas. A large-scale study on research code quality and execution. Scientific Data. Vol. 9(1), pg. 60, 2022, https://doi.org/10.1038/s41597-022-01143-6. [↩]
- B. J. Heil, M. M. Hoffman, F. Markowetz, S. I. Lee, C. S. Greene, S. C. Hicks. Reproducibility standards for machine learning in the life sciences. Nature Methods. Vol. 18(10), pg. 1132-1135, 2021, https://doi.org/10.1038/s41592-021-01256-7. [↩]
- S. Buchka, A. Hapfelmeier, P. P. Gardner, R. Wilson, A. L. Boulesteix. On the optimistic performance evaluation of newly introduced bioinformatic methods. Genome Biology. Vol. 22(1), pg. 152, 2021, https://doi.org/10.1186/s13059-021-02365-4. [↩]
- A. Sonrel, A. Luetge, C. Soneson, I. Mallona, P. L. Germain, S. Knyazev, J. Gilis, R. Gerber, R. Seurinck, D. Paul, E. Sonder, H. L. Crowell, I. Fanaswala, A. Al-Ajami, E. Heidari, S. Schmeing, S. Milosavljevic, Y. Saeys, S. Mangul, M. D. Robinson. Meta-analysis of (single-cell method) benchmarks reveals the need for extensibility and interoperability. Genome Biology. Vol. 24(1), pg. 119, 2023, https://doi.org/10.1186/s13059-023-02962-5. [↩]
- N. F. de Jonge, K. Mildau, D. Meijer, J. J. R. Louwen, C. Bueschl, F. Huber, J. J. J. van der Hooft. Good practices and recommendations for using and benchmarking computational metabolomics metabolite annotation tools. Metabolomics. Vol. 18(12), pg. 103, 2022, https://doi.org/10.1007/s11306-022-01963-y. [↩]
- U. Kanewala, J. M. Bieman. Testing scientific software: a systematic literature review. Information and Software Technology. Vol. 56(10), pg. 1219-1232, 2014, https://doi.org/10.1016/j.infsof.2014.05.006. [↩]
- T. Y. Chen, F. C. Kuo, H. Liu, P. L. Poon, D. Towey, T. H. Tse, Z. Q. Zhou. Metamorphic testing. ACM Computing Surveys. Vol. 51(1), pg. 1-27, 2018, https://doi.org/10.1145/3143561. [↩]