
Abstract
Cells in tumors are rarely uniform, and this diversity plays a major role in how cancers grow and respond to treatment. In this study, single-cell RNA sequencing data from breast cancer cell lines were analyzed, focusing on genes that distinguished one cluster of cells from another. Some clusters contained thousands of marker genes, while others had only a few. Most clusters shared less than 20-30% of their markers, and many top markers were unique to a single cluster. These findings indicate that the dataset is highly heterogeneous, with each cluster representing a distinct cellular state. To place these clusters in a biological and therapeutic context, marker genes were examined for enriched pathways against GO:BP, KEGG and Reactome and checked against target tractability information (Target Development Levels) from the Pharos/TCRD database. This revealed clusters characterized by enrichment of DNA repair and cell-cycle programs, epigenetic regulators (HDAC/BET/EZH2), metabolic and stress-response pathways (e.g., HIF, glutathione), and immune-related signatures (including checkpoint modulation). Several clusters contained genes already associated with approved or chemically tractable drugs. Overall, the results highlight the extent of tumor heterogeneity and demonstrate how combining cluster-specific gene signatures with pathway analysis and drug-target mapping can help identify potential strategies for more precise and tailored treatments.
Keywords: Single-cell RNA sequencing Clustering (Leiden, PCA, UMAP), Unsupervised machine learning, Marker Genes, Cancer heterogeneity, Functional enrichment, Pathway analysis, Precision medicine, Annotated targets, Drug-target mapping, Pharos / Target Development Level (Tclin, Tchem, Tbio, Tdark)
Introduction
The human body contains trillions of cells, all carrying the same DNA. Yet somehow, each cell knows what to become such as a neuron, a skin cell, or a muscle fiber, depending on which genes it turns on or off. This selective gene expression is what gives cells their identity, and in many ways, their behavior1. In cancer, this process becomes far more chaotic. Tumors are not just clumps of identical cells; they are more like ecosystems, made up of different cell types that behave in very different ways. This variation, known as cancer heterogeneity, is one of the biggest reasons why diagnosing and treating cancer remains so difficult2.
For years, researchers used bulk RNA sequencing to study gene expression in tumors. Bulk RNA sequencing represented a major step forward at the time letting us see which genes were active in cancer tissue. However, the bulk approach averages signals from thousands, sometimes millions, of cells. As a result, while we could see general trends, we lost sight of the finer details. If there were rare but important cell types hidden in the mix, they often went unnoticed3. Other approaches, like histopathology or imaging, give structural insights and can sometimes hint at molecular differences, but they still lack the resolution to track gene expression on a cell-by-cell basis.
Newer methods like spatial transcriptomics and multi-omics have tried to bridge that gap, adding layers of context to gene expression data. They have made progress particularly in mapping where specific gene activity happens within tissues but these approaches come with their own challenges. Resolution is often limited, or the data becomes hard to interpret at scale. They are valuable, but not yet complete answers4,5.
Single-cell RNA sequencing (scRNA-seq) addresses these limitations by enabling high-resolution profiling of gene expression at the level of individual cells. It offers a far more detailed view by looking at the gene expression of individual cells. This has already led to some exciting discoveries, including the identification of transcriptionally distinct cancer cell states and rare subpopulations, and has been widely used to study tumor-immune and tumor-stromal interactions in primary tumor samples6,7. However, scRNA-seq datasets, particularly those derived from cancer cell lines, can contain technical contamination that introduces non-epithelial transcriptional signals, which may bias downstream analyses if not carefully considered. Interpretation of such data therefore requires explicit attention to potential sources of contamination, including ambient RNA, doublets, or sample cross-contamination, rather than assuming the presence of true microenvironmental populations.
One thing that seems increasingly clear is that we need more advanced analytical tools to make sense of this complexity. That is where machine learning can really make a difference. By handling high-dimensional, noisy data, it can spot subtle patterns that traditional methods might miss especially when it comes to identifying rare subpopulations or mapping out functional states, not just surface markers8.
This study uses single-cell RNA sequencing combined with unsupervised machine learning to explore heterogeneity in breast cancer cells. The goal is to better understand how tumor cells differ at the transcriptional level, identify cellular subpopulations, and relate their gene expression patterns to known and potential annotated targets. By combining high-resolution single-cell data with advanced computational analysis, this work seeks to shed light on tumor diversity and to consider how transcriptional heterogeneity may contribute to more precise and personalized annotation-based insights.
Methods
Dataset Selection
The data used in this study were obtained from previously published single-cell RNA sequencing (scRNA-seq) dataset available in the Gene Expression Omnibus (GEO) database (GSE173634)9. Specifically, the dataset includes transcriptional profiles from 35,276 individual cells drawn from 32 well-characterized breast cancer cell lines, along with one non-cancerous epithelial line (MCF12A). These cell lines represent key molecular subtypes of breast cancer including Luminal A/B, HER2-enriched, Basal-like and were originally profiled using Drop-seq. The original study that generated this dataset aimed to build a single-cell atlas of transcriptional states, which could be used to deconvolve bulk tumor biopsies and predict drug response based on cell-level heterogeneity. For the current analysis, this dataset was selected due to its depth and diversity, making it an ideal resource for exploring tumor heterogeneity at single-cell resolution.
This study was designed as a computational, observational analysis using existing scRNA-seq data. The primary goal was to investigate the transcriptional diversity present within breast cancer cell lines using unsupervised machine learning approaches. The study is cross-sectional in nature, capturing a single snapshot of gene expression across tens of thousands of cells. Since the emphasis was on the diversity of cellular states within tumors rather than between patients, no selection was made based on demographic or clinical metadata.
Data Preprocessing
The analysis was carried out in Python using Scanpy, with support from additional libraries such as scikit-learn10 and umap-learn11. Standard preprocessing steps were applied, including filtering low-quality cells, normalizing counts to account for differences in sequencing depth, and log-transforming the data to stabilize variance. Before any filtering or preprocessing, the dataset included approximately 35,276 cells and around 47,096 genes. Cells with fewer than 500 detected genes, more than 6,000 detected genes, more than 50,000 total counts, or greater than 5% mitochondrial gene expression were excluded, and genes expressed in fewer than three cells were removed. After filtering, the dataset was carefully evaluated using three standard measures: the number of genes detected per cell ngenes_by_counts, total transcript counts (totalcounts), and the proportion of mitochondrial gene expression (pctcounts_mt) to make sure only reliable cells remained. These thresholds were used to remove low-quality cells and potential doublets characterized by unusually high gene complexity or UMI counts. Following these steps, the data were normalized to account for sequencing depth and log-transformed to stabilize variance for downstream analysis. After loading the quality-controlled dataset, an additional light filtering step was applied to remove residual low-complexity cells (cells with fewer than 200 detected genes) and genes detected in fewer than three cells prior to normalization and highly variable gene selection.
As an additional quality-control step, CellTypist12 was used to assess whether the dataset contained transcriptional signatures inconsistent with an epithelial cell identity. Most cells were annotated as epithelial, as expected for breast cancer cell lines, while a smaller fraction received immune or stromal labels. Because the data were derived from established cell lines, these non-epithelial annotations were not interpreted as representing true tumor microenvironment populations. Instead, they were considered likely to arise from technical factors such as ambient RNA contamination, doublets, or sample cross-contamination. All cells were retained for downstream analyses, and non-epithelial labels were treated solely as indicators of potential technical bias rather than biologically meaningful cell states.
To enhance signal quality by increasing the signal-to-noise ratio and prioritizing biologically informative variation, highly variable genes (HVGs) were identified using the Seurat v3 method13, implemented within the Scanpy framework14. This step retains genes whose expression changes strongly from cell to cell and which are more likely to reflect real biological variation. In contrast, the genes which show little variation or are affected by technical noise are removed. By retaining more informative genes and removing background noise, this step makes it easier to find meaningful patterns in the data. After excluding low-quality cells and genes with minimal variability, 3,335 genes were retained for downstream analysis.
Dimensionality Reduction and Clustering
Principal Component Analysis (PCA)14 was used for initial dimensionality reduction on the highly variable genes. A scree plot was generated to help determine how many principal components to retain. As the curve began to level off around PC 20-25, selecting 30 components was considered a reasonable and conservative choice, ensuring that meaningful variance was captured without including excessive noise. These components served as the input for constructing a k-nearest neighbors (kNN) graph using 15 neighbors and Euclidean distance. Clustering was performed using the Leiden algorithm15 with a resolution parameter of 1.0, resulting in 36 transcriptionally distinct clusters. For visualization, Uniform Manifold Approximation and Projection (UMAP) was computed using Euclidean distance, a minimum distance of 0.5 and used to embed the data in two dimensions.
Clustering Robustness Assessment
To assess the robustness of clustering outcomes, both Euclidean and Cosine distance metrics were used to compute similarities between cells. Clustering results from both metrics were compared using the Adjusted Rand Index (ARI)16 and Normalized Mutual Information (NMI)17. The scores ARI = 0.988 and NMI = 0.993 indicate strong agreement between the two approaches, suggesting that the clustering is highly stable and not overly sensitive to the choice of distance metric. Based on this evaluation, Euclidean distance was used for all subsequent analyses, as it is commonly applied in PCA space and is particularly well-suited when absolute differences in gene expression carry biological meaning.
Marker Gene Identification
To interpret the identified clusters, marker genes were detected using a rank-based t-test, implemented via scanpy.tl.rank_genes_groups14. The t-test highlights genes that are significantly more expressed in one cluster compared to others, offering insight into the biological functions of different cell populations. We highlight that this test might lead to inflations of significance, as it treats cells as independent biological entities. However, the results were found to be approximate to the Wilcoxon rank-sum test. Visualizations such as UMAP plots, violin plots, and HVG plots were used to validate and explore these findings. While the Wilcoxon rank-sum test18 is common in single-cell studies, the t-test was chosen because, after log-normalization and variance scaling, the data more closely match its assumptions. In this setting, the t-test makes differences in average expression easier to interpret and runs faster on large datasets. To check robustness, results were compared with Wilcoxon-based rankings, and the main marker gene patterns were consistent across both methods.
Gene Annotation and Marker Filtering
To make the data easier to interpret, Ensembl gene IDs were converted into familiar gene symbols (like TP53) by querying the BioMart database via the mygene Python package. BioMart is a widely used biological database system that provides access to gene annotations and allows mapping between different gene identifiers across genomic resources. Next, to reduce false positives and focus on meaningful expression changes, the marker gene list was filtered using two criteria: an adjusted p-value below 0.05 and a log fold-change greater than 0.2519. This step ensured that only genes with statistically significant and biologically relevant differences were retained. These filtered marker genes were organized by cluster.
Functional Enrichment
To further characterize heterogeneity across clusters, several downstream analyses were performed. First, the number of unique marker genes per cluster was calculated to quantify transcriptional distinctiveness, and Jaccard similarity indices were computed to measure overlap in marker sets between clusters. Heatmaps were generated to visualize marker presence and cluster similarity patterns. Functional enrichment analysis was then used to better understand the biological roles underlying each cluster, drawing on Gene Ontology Biological Processes (GO:BP), Kyoto Encyclopedia of Genes and Genomes (KEGG), and Reactome databases via g:Profiler20. Enrichment analyses were performed separately for each cluster using the filtered marker genes as input, with multiple testing correction applied using the g:SCS method and a significance threshold of adjusted p-value < 0.05. The background gene set consisted of all genes tested in the differential expression analysis. These enrichment results provided insight into the biological pathways represented in each cluster and were used to place cluster-specific functions in the context of higher-order signaling and metabolic programs.
Therapeutic Mapping of Cluster-Specific Pathways
Building on the functional enrichment analysis, the identified pathways were grouped according to their potential therapeutic relevance. This helped classify clusters into categories such as protective, adverse, and context-dependent. Here, “protective” refers to pathways that increase treatment sensitivity or suppress tumor growth; “adverse” refers to pathways linked to resistance or progression; and “context-dependent” describes pathways whose effects- beneficial or harmful, depend on tumor lineage and microenvironment.
Drug Target Mapping and Pharos Integration
Cluster-specific marker genes were mapped to known and predicted annotated targets using the Pharos/TCRD database21. Pharos/TCRD is a public database that catalogs human protein targets and organizes them based on their biological characterization and drug development status. To achieve this, a Python client was developed to query the Pharos GraphQL API. This tool pulled information such as each gene’s Target Development Level (TDL)22, protein family, and name, compiling a clean dataset linking marker genes to their druggability classification. This step enabled the annotation of the identified gene expression patterns by linking them to existing information about known and predicted drug targets.
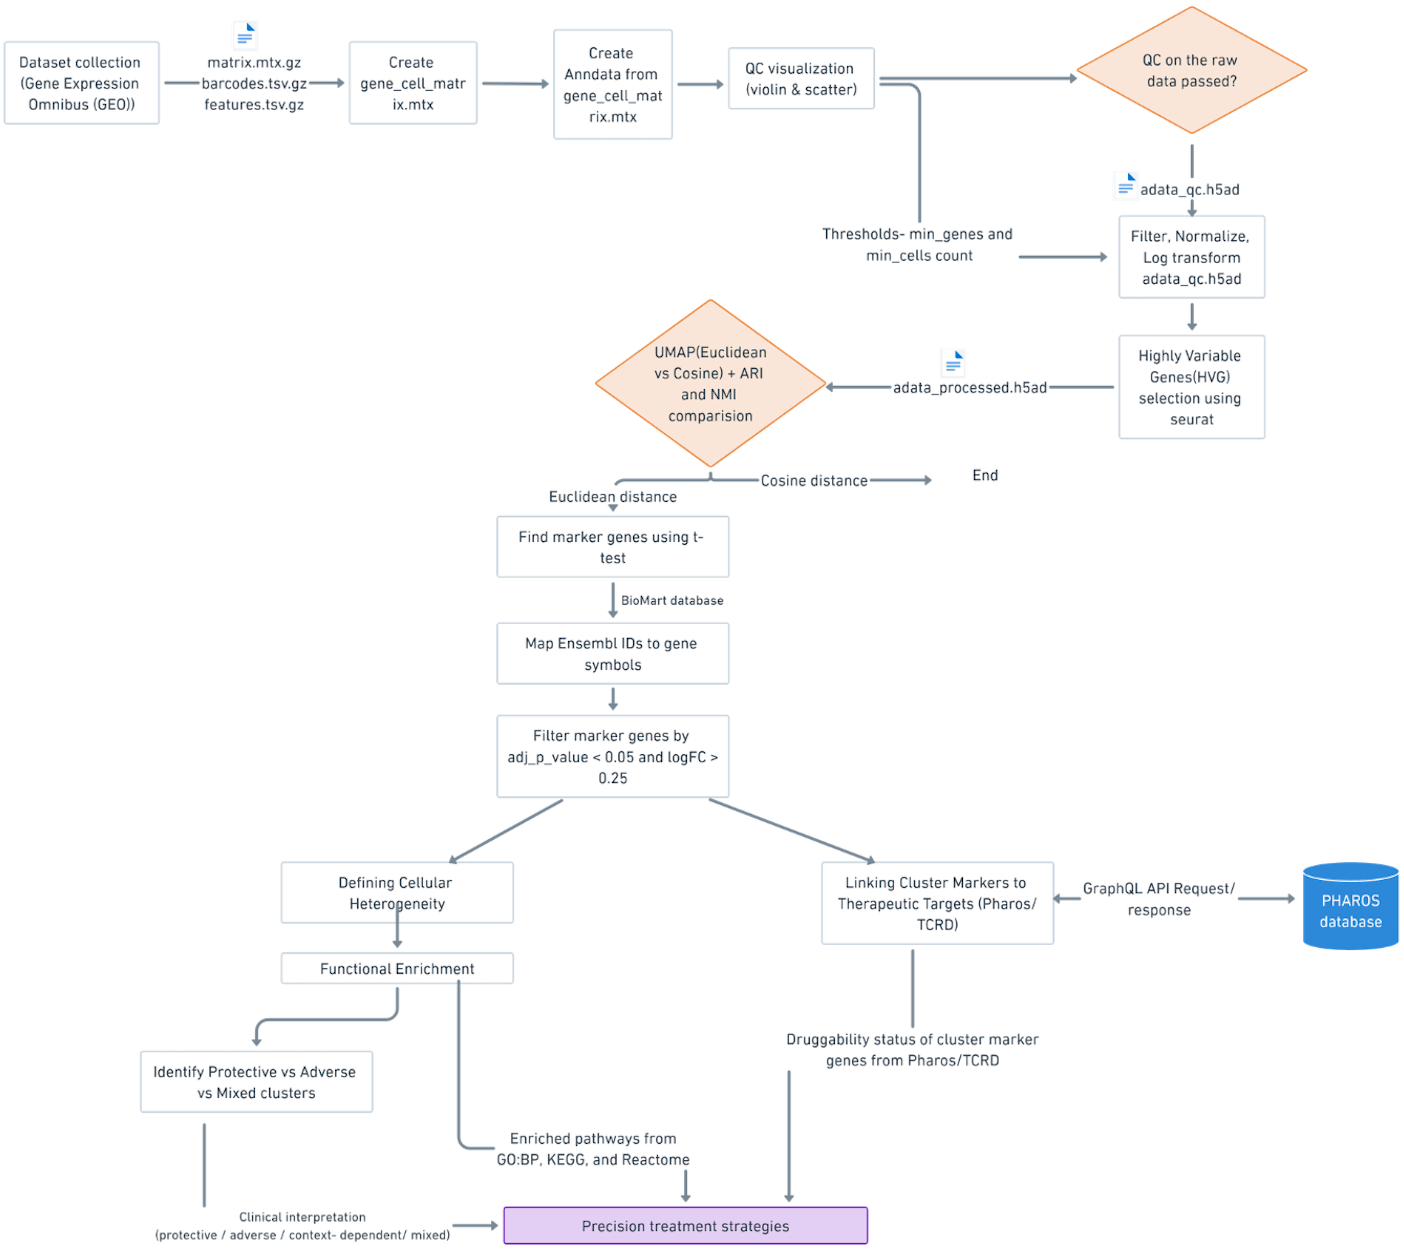
Workflow Overview
The pipeline in Figure 1 outlines the major steps of the study, from preprocessing and clustering scRNA-seq data to identifying marker genes, analyzing enriched pathways, and linking them to potential drug targets.
Results
Single-cell RNA Sequencing analysis uncovered transcriptional heterogeneity across breast cancer cells. After data processing, dimensionality reduction and clustering showed the cells organized into groups based on their gene expression pattern. Marker genes analysis and functional enrichment explained their biological relevance. Further, linking marker genes with annotated targets explained how distinct cell populations can respond to treatment.
Quality Control and Filtering
Quality control and filtering removed low-quality cells and uninformative genes. After this filtering process, approximately 34,497 high-quality cells were retained for downstream analysis. The retained cells showed a balance of gene detection and sequencing depth, indicating strong coverage across the dataset. A small fraction of potential doublets was detected, and mitochondrial gene content was consistently low, suggesting minimal contamination from stressed or dying cells. Cell-type annotation performed as part of quality control indicated that while most cells were epithelial, a minority showed immune or stromal transcriptional signatures, which were treated as technical artifacts rather than biologically meaningful populations. Together, these results confirmed the effectiveness of the filtering process: low-quality cells were successfully removed, while biologically relevant cells remained for further analysis.
To further refine the dataset on gene level and focus on the most informative gene features, highly variable genes (HVGs) were identified. This is of benefit as non-variable genes are not expected to explain a lot of variance in the dataset and can be filtered to reduce dimensionality. Instead of selecting a fixed number of top genes, we applied threshold-based filtering based on mean expression and dispersion. Genes which did not meet specific criteria (e.g., min_mean = 0.0125, max_mean = 3, min_disp = 0.5) were filtered out as invariable. This step retained 3,335 highly variable genes.
Dimensionality Reduction and Clustering
Dimensionality reduction revealed clear patterns in the dataset. Cell clustering was then carried out using the Leiden algorithm, which identified 36 cell clusters. Each cluster corresponds to a transcriptional subpopulation, reflecting the underlying heterogeneity within the tumor samples.
Visualization with UMAP
Visualization of the clustering results in a low-dimensional space using UMAP with Euclidean distance revealed well-defined separation between 36 identified clusters, indicating that the unsupervised approach effectively captured transcriptional heterogeneity in the dataset. The clusters varied in size, suggesting the presence of both dominant and less common subpopulations.
To further assess the impact of technical variation, overlays of key quality control metrics such as the number of detected genes per cell, total UMI counts, and mitochondrial gene content were applied to the UMAP projection. As shown in Figures 2, these QC features were distributed across multiple clusters without any single metric dominating the structure of the embedding, suggesting that the clustering patterns were driven primarily by biological differences rather than technical artifacts. This suggests that the clustering patterns are primarily driven by genuine biological differences, rather than artifacts related to data quality or sequencing depth.
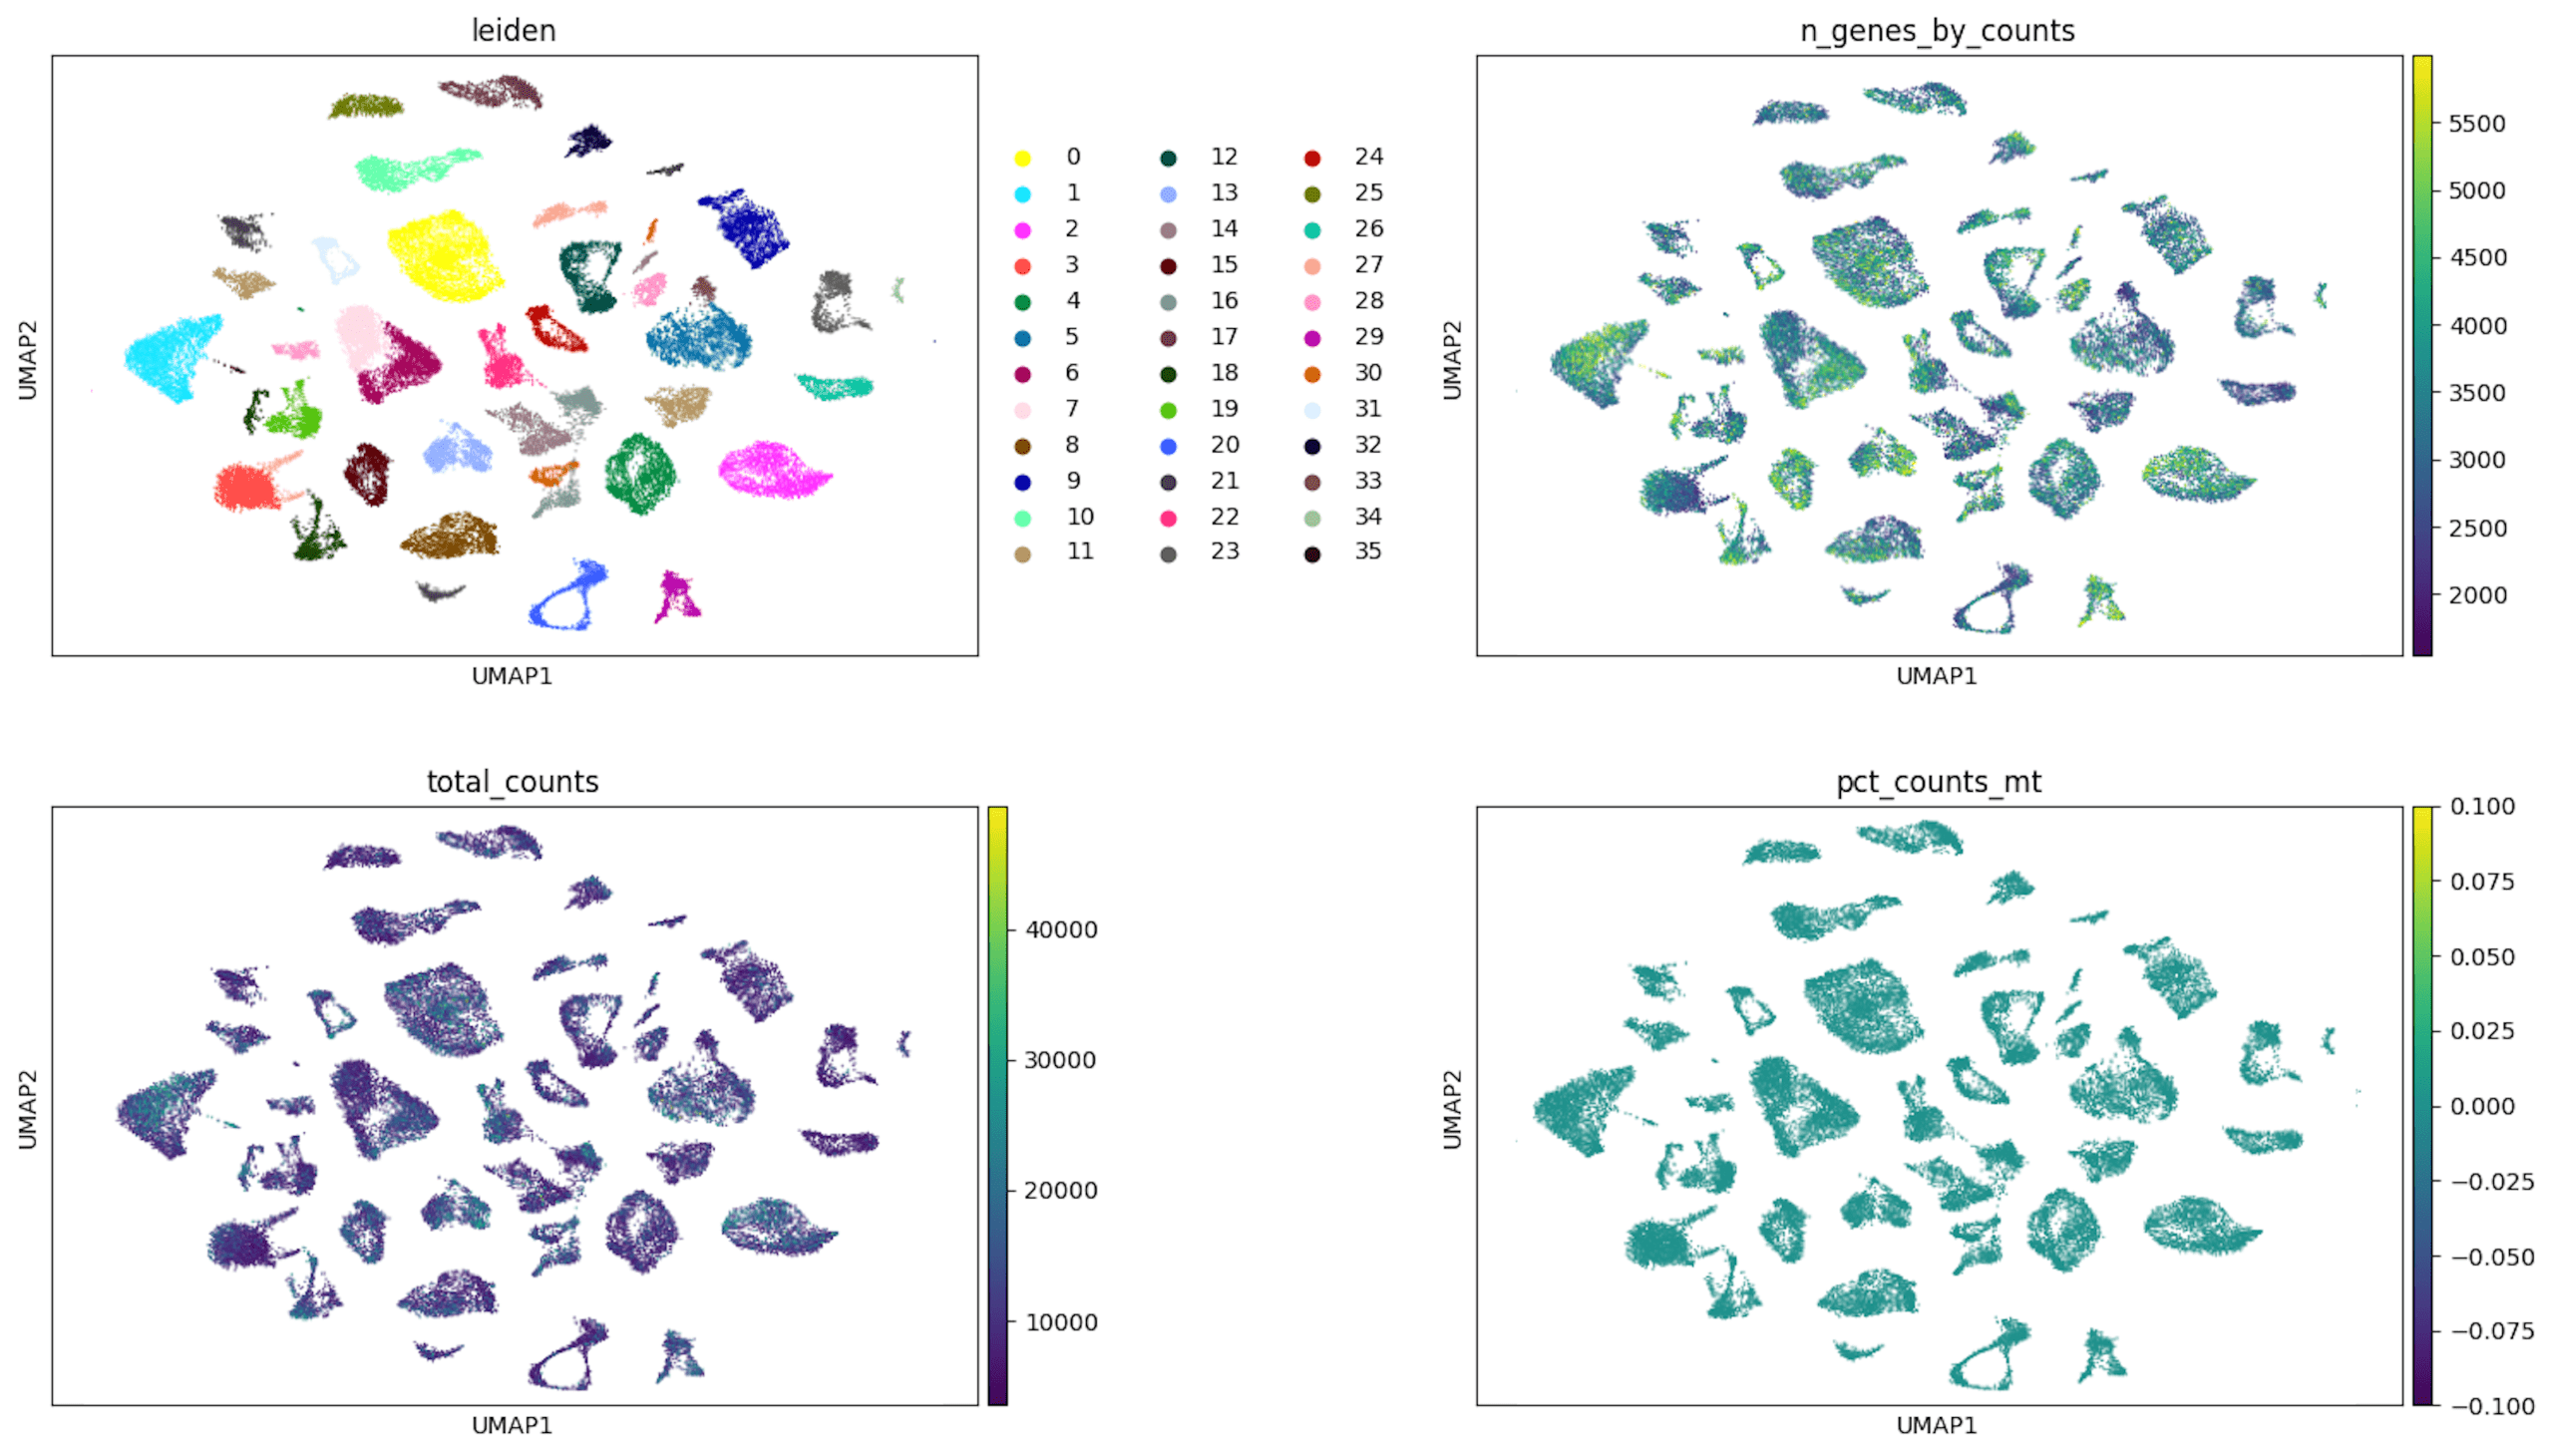
Top left: Cells are colored by Leiden cluster assignment, with each discrete color representing a distinct transcriptional cluster identified through unsupervised clustering. These clusters reflect groups of cells with similar gene expression profiles.
Top right: Cells are colored by the number of detected genes per cell (ngenes_by_counts), shown as a continuous color gradient. Higher values (lighter colors) indicate cells with greater gene detection, reflecting higher transcriptional complexity or sequencing depth.
Bottom left: Cells are colored by total transcript counts (totalcounts), also shown as a continuous gradient. This panel illustrates variation in sequencing depth across cells, with higher counts appearing in lighter colors.
Bottom right: Cells are colored by the percentage of mitochondrial gene expression (pctcounts_mt). The relatively uniform coloring across clusters indicates low and consistent mitochondrial content, suggesting minimal contribution from stressed or dying cells and supporting overall data quality.
Marker Gene Identification
To interpret the identified clusters, the top marker gene for each cluster listed in Table 1 was examined and its known biological function considered. A summary of the top marker genes for each cluster, including ranking scores, log fold-changes, and adjusted p-values, is provided in Table 1. p-values reported as 0.000000e+00 indicate values below numerical precision rather than true zero values.
Several clusters were defined by genes associated with cell proliferation and cell-cycle regulation, including H2BC11 (Cluster 25) and POTEC (Cluster 28), reflecting actively dividing cancer cell states23. Other clusters were marked by genes linked to epithelial differentiation and lineage identity, such as CLDN10 (Cluster 4), SCGB3A2 (Cluster 13), SCGB2A2 (Cluster 18), PIP (Cluster 19), and TFF1 (Cluster 22), which are commonly associated with luminal epithelial programs in breast cancer24.
Cluster 0 was characterized by expression of MAGEA4, a cancer-testis antigen commonly associated with tumor-specific transcriptional programs in malignant cells.
Additional clusters showed marker genes related to extracellular matrix organization, cell adhesion, or mesenchymal-like transcriptional programs. For example, RARRES1 (Clusters 6 and 7), POSTN (Cluster 17), TNMD (Cluster 21), and ITGB1 (Cluster 35) have been linked to cell-matrix interactions, tissue remodeling, and migratory behavior25. A small number of clusters were marked by genes with immune-associated annotations, most notably CCL19 (Cluster 11)26. Given the cell line origin of the dataset, this immune-related signal was interpreted as a technical or stress-associated transcriptional program rather than evidence of true immune cell populations.
Together, the marker genes listed in Table 1 indicate that the identified clusters capture a range of cancer cell-intrinsic transcriptional programs, including proliferative, epithelial differentiation-related, and mesenchymal-like states, providing functional context for the unsupervised clustering results.
| Cluster | Gene Symbol | Ranking Score | Log fold-change (logFC) | p-value | Adjusted p-value |
|---|---|---|---|---|---|
| 0 | C1QTNF4 | 39.76585 | 9.492082 | 0.000000e+00 | 0.000000e+00 |
| 1 | RSPO2 | 44.57847 | 10.939459 | 0.000000e+00 | 0.000000e+00 |
| 2 | FAM9C | 67.60514 | 9.344266 | 0.000000e+00 | 0.000000e+00 |
| 3 | HOXB13 | 32.237 | 5.992637 | 0.000000e+00 | 0.000000e+00 |
| 4 | CLDN10 | 39.6229 | 9.144331 | 0.000000e+00 | 0.000000e+00 |
| 5 | S100A2 | 304.42023 | 8.714493 | 0.000000e+00 | 0.000000e+00 |
| 6 | RARRES1 | 269.6609 | 6.666044 | 0.000000e+00 | 0.000000e+00 |
| 7 | RARRES1 | 235.41852 | 6.675642 | 0.000000e+00 | 0.000000e+00 |
| 8 | OBP2B | 27.886747 | 7.449968 | 0.000000e+00 | 0.000000e+00 |
| 9 | SOX17 | 36.06809 | 10.394246 | 0.000000e+00 | 0.000000e+00 |
| 10 | TAL1 | 25.73949 | 7.917273 | 0.000000e+00 | 0.000000e+00 |
| 11 | CCL19 | 14.978386 | 15.643583 | 0.000000e+00 | 0.000000e+00 |
| 12 | RPL23AP29 | 22.693521 | 11.086494 | 0.000000e+00 | 0.000000e+00 |
| 13 | SCGB3A2 | 26.973503 | 11.228862 | 0.000000e+00 | 0.000000e+00 |
| 14 | APOD | 152.06302 | 10.007493 | 0.000000e+00 | 0.000000e+00 |
| 15 | BTBD16 | 44.573856 | 10.751011 | 0.000000e+00 | 0.000000e+00 |
| 16 | FGF4 | 36.689407 | 8.942721 | 0.000000e+00 | 0.000000e+00 |
| 17 | POSTN | 138.4066 | 14.15132 | 0.000000e+00 | 0.000000e+00 |
| 18 | SCGB2A2 | 169.01219 | 10.739865 | 0.000000e+00 | 0.000000e+00 |
| 19 | PIP | 151.2719 | 9.937758 | 0.000000e+00 | 0.000000e+00 |
| 20 | FABP7 | 36.23737 | 8.100706 | 0.000000e+00 | 0.000000e+00 |
| 21 | TNMD | 30.257122 | 14.770732 | 0.000000e+00 | 0.000000e+00 |
| 22 | TFF1 | 134.33574 | 7.941581 | 0.000000e+00 | 0.000000e+00 |
| 23 | MAGEA8 | 19.786705 | 8.202033 | 0.000000e+00 | 0.000000e+00 |
| 24 | FMR1NB | 17.453014 | 5.825913 | 0.000000e+00 | 0.000000e+00 |
| 25 | H2BC11 | 47.172913 | 6.489651 | 0.000000e+00 | 0.000000e+00 |
| 26 | DCAF4L2 | 97.496 | 6.840144 | 0.000000e+00 | 0.000000e+00 |
| 27 | SKAP1-AS2 | 22.359995 | 5.000379 | 0.000000e+00 | 0.000000e+00 |
| 28 | POTEC | 34.063824 | 12.76734 | 0.000000e+00 | 0.000000e+00 |
| 29 | ARL14EPL | 49.107025 | 10.559164 | 0.000000e+00 | 0.000000e+00 |
| 30 | SCGB1B2P | 48.315758 | 13.790806 | 0.000000e+00 | 0.000000e+00 |
| 31 | DKK4 | 65.626755 | 16.803635 | 0.000000e+00 | 0.000000e+00 |
| 32 | LOC124903372 | 31.792841 | 6.824976 | 0.000000e+00 | 0.000000e+00 |
| 33 | MME | 31.743504 | 6.088414 | 0.000000e+00 | 0.000000e+00 |
| 34 | GAGE1 | 28.316442 | 8.482694 | 0.000000e+00 | 0.000000e+00 |
| 35 | ITGB1 | 28.824125 | 2.559696 | 3.1002636E-28 | 1.3082856E-27 |
Defining Cellular Heterogeneity
The analysis started with a filtered set of marker genes (p-adj < 0.05, logFC > 0.25) that included all statistically significant markers across clusters. Using this data, the number of transcriptionally distinct clusters were identified and compared to assess how clearly separated clusters are. Marker genes were unevenly distributed across subpopulations, with some clusters having thousands and others only a few. These results show the dataset is far from homogeneous, instead, it contains multiple distinct subpopulations of cells, each representing unique cellular states or subtypes. The Jaccard index was calculated using the set of significant markers from each cluster (thresholded by adjusted p-value and log-fold change), measuring the fraction of genes shared between pairs of clusters. The resulting values, typically 20-30%, indicated that most clusters shared only a minority of their marker genes. This result confirmed clear clustering and strong heterogeneity in this dataset.
Although most clusters present distinct top marker genes, there are also some overlaps. For example, clusters 6 and 7 share the same top marker gene (RARRES1) and show partial overlap in their marker gene sets, despite being identified as separate clusters. This overlap suggests that these clusters represent closely related transcriptional states rather than completely distinct cell types. Although we see clear distinctions between clusters on the UMAP, two-dimensional representation overlaps could present close biological functions and trajectories in the analyzed dataset.
| Cluster | Top 5 Marker Genes |
|---|---|
| 0 | C1QTNF4, AQP9, MAGEA4, MAGEA10, ESM1 |
| 1 | RSPO2, SPON2, CYTL1, SFRP2, CAMK4 |
| 2 | FAM9C, CES1, PIGR, S100A7, S100A8 |
| 3 | HOXB13, LINC02899, SCGN, IKZF3, SKAP1-AS2 |
| 4 | LOC100505715, CLDN10, LINC02515, ZFP42, PSPHP1 |
| 5 | KRT14, SERPINB13, S100A2, KRT6A, COL17A1 |
| 6 | RARRES1, SERPINB4, PI3, S100A7, S100A8 |
| 7 | RARRES1, SERPINB4, PI3, S100A7, S100A8 |
| 8 | ALKAL2, PCDH19, BMP5, PSLNR, OBP2B |
| 9 | SOX17, TRPC6, CALCRL, PREX2, LIX1 |
| 10 | PSG9, TAL1, MESP2, MAGEA11, CIMIP5 |
| 11 | CCL8, VCAM1, PNMA5, ODAM, CCL19 |
| 12 | RPL12P2, RPL23AP29, CLCA2, SLC1A7, RPS26P43 |
| 13 | CLDN6, SCGB3A2, TMPRSS11E, TRBC2, TNNC2 |
| 14 | APOD, CLEC3A, SLC25A18, WFIKKN2, TEX19 |
| 15 | KRT13, LYPD2, BTBD16, TRIM31, MUC4 |
| 16 | FGF4, SGCG, SYT10, DSCAM-AS1, BCAS3 |
| 17 | DCN, POSTN, SCN3A, COL1A2, COL3A1 |
| 18 | HPGD, CXCL14, CST2, OLFML3, SCGB2A2 |
| 19 | SOD3, SERPINA6, PIP, GNMT, BNIPL |
| 20 | CRABP1, FABP7, ANKRD30A, BACH1, IGFBP5 |
| 21 | A2M, SOX10, LOC105375977, S100B, TNMD |
| 22 | TFF1, TMEM64, GFRA1, DSCAM-AS1, BCAS3 |
| 23 | MAGEA8, TAT, UGT3A2, AMBP, TFF3 |
| 24 | CCDC144NL-AS1, DIO2, FMR1NB, NUDT19-DT, IGFBP5 |
| 25 | H2BC11, H1-2, H3C8, G0S2, CXCL6 |
| 26 | DCAF4L2, CPS1, DHRS2, PAGE5, MAGEA1 |
| 27 | FAM3B, MTND6P4, IKZF3, SKAP1-AS2, TFF3 |
| 28 | POTEC, ANKRD30B, LINC01087, CITED1, BCL2 |
| 29 | OXTR, CHRDL1, MAGEC2, PSORS1C2, ARL14EPL |
| 30 | HOXB-AS3, ALOX15B, SCGB1B2P, LINC02303, SCGB2A2 |
| 31 | VIP, DKK4, PRSS56, FGL2, GABRA1 |
| 32 | NPY1R, LOC124903372, SHROOM1, CYP2B7P, RIIAD1 |
| 33 | MME, VCAN, HOXA5, TGFBI, FN1 |
| 34 | SLC12A2, GPX2, GTSF1, GAGE1, TMEM132D-AS1 |
| 35 | LDHB, PAGE2, GSTP1, ITGB1, VIM |
Functional Enrichment per Cluster
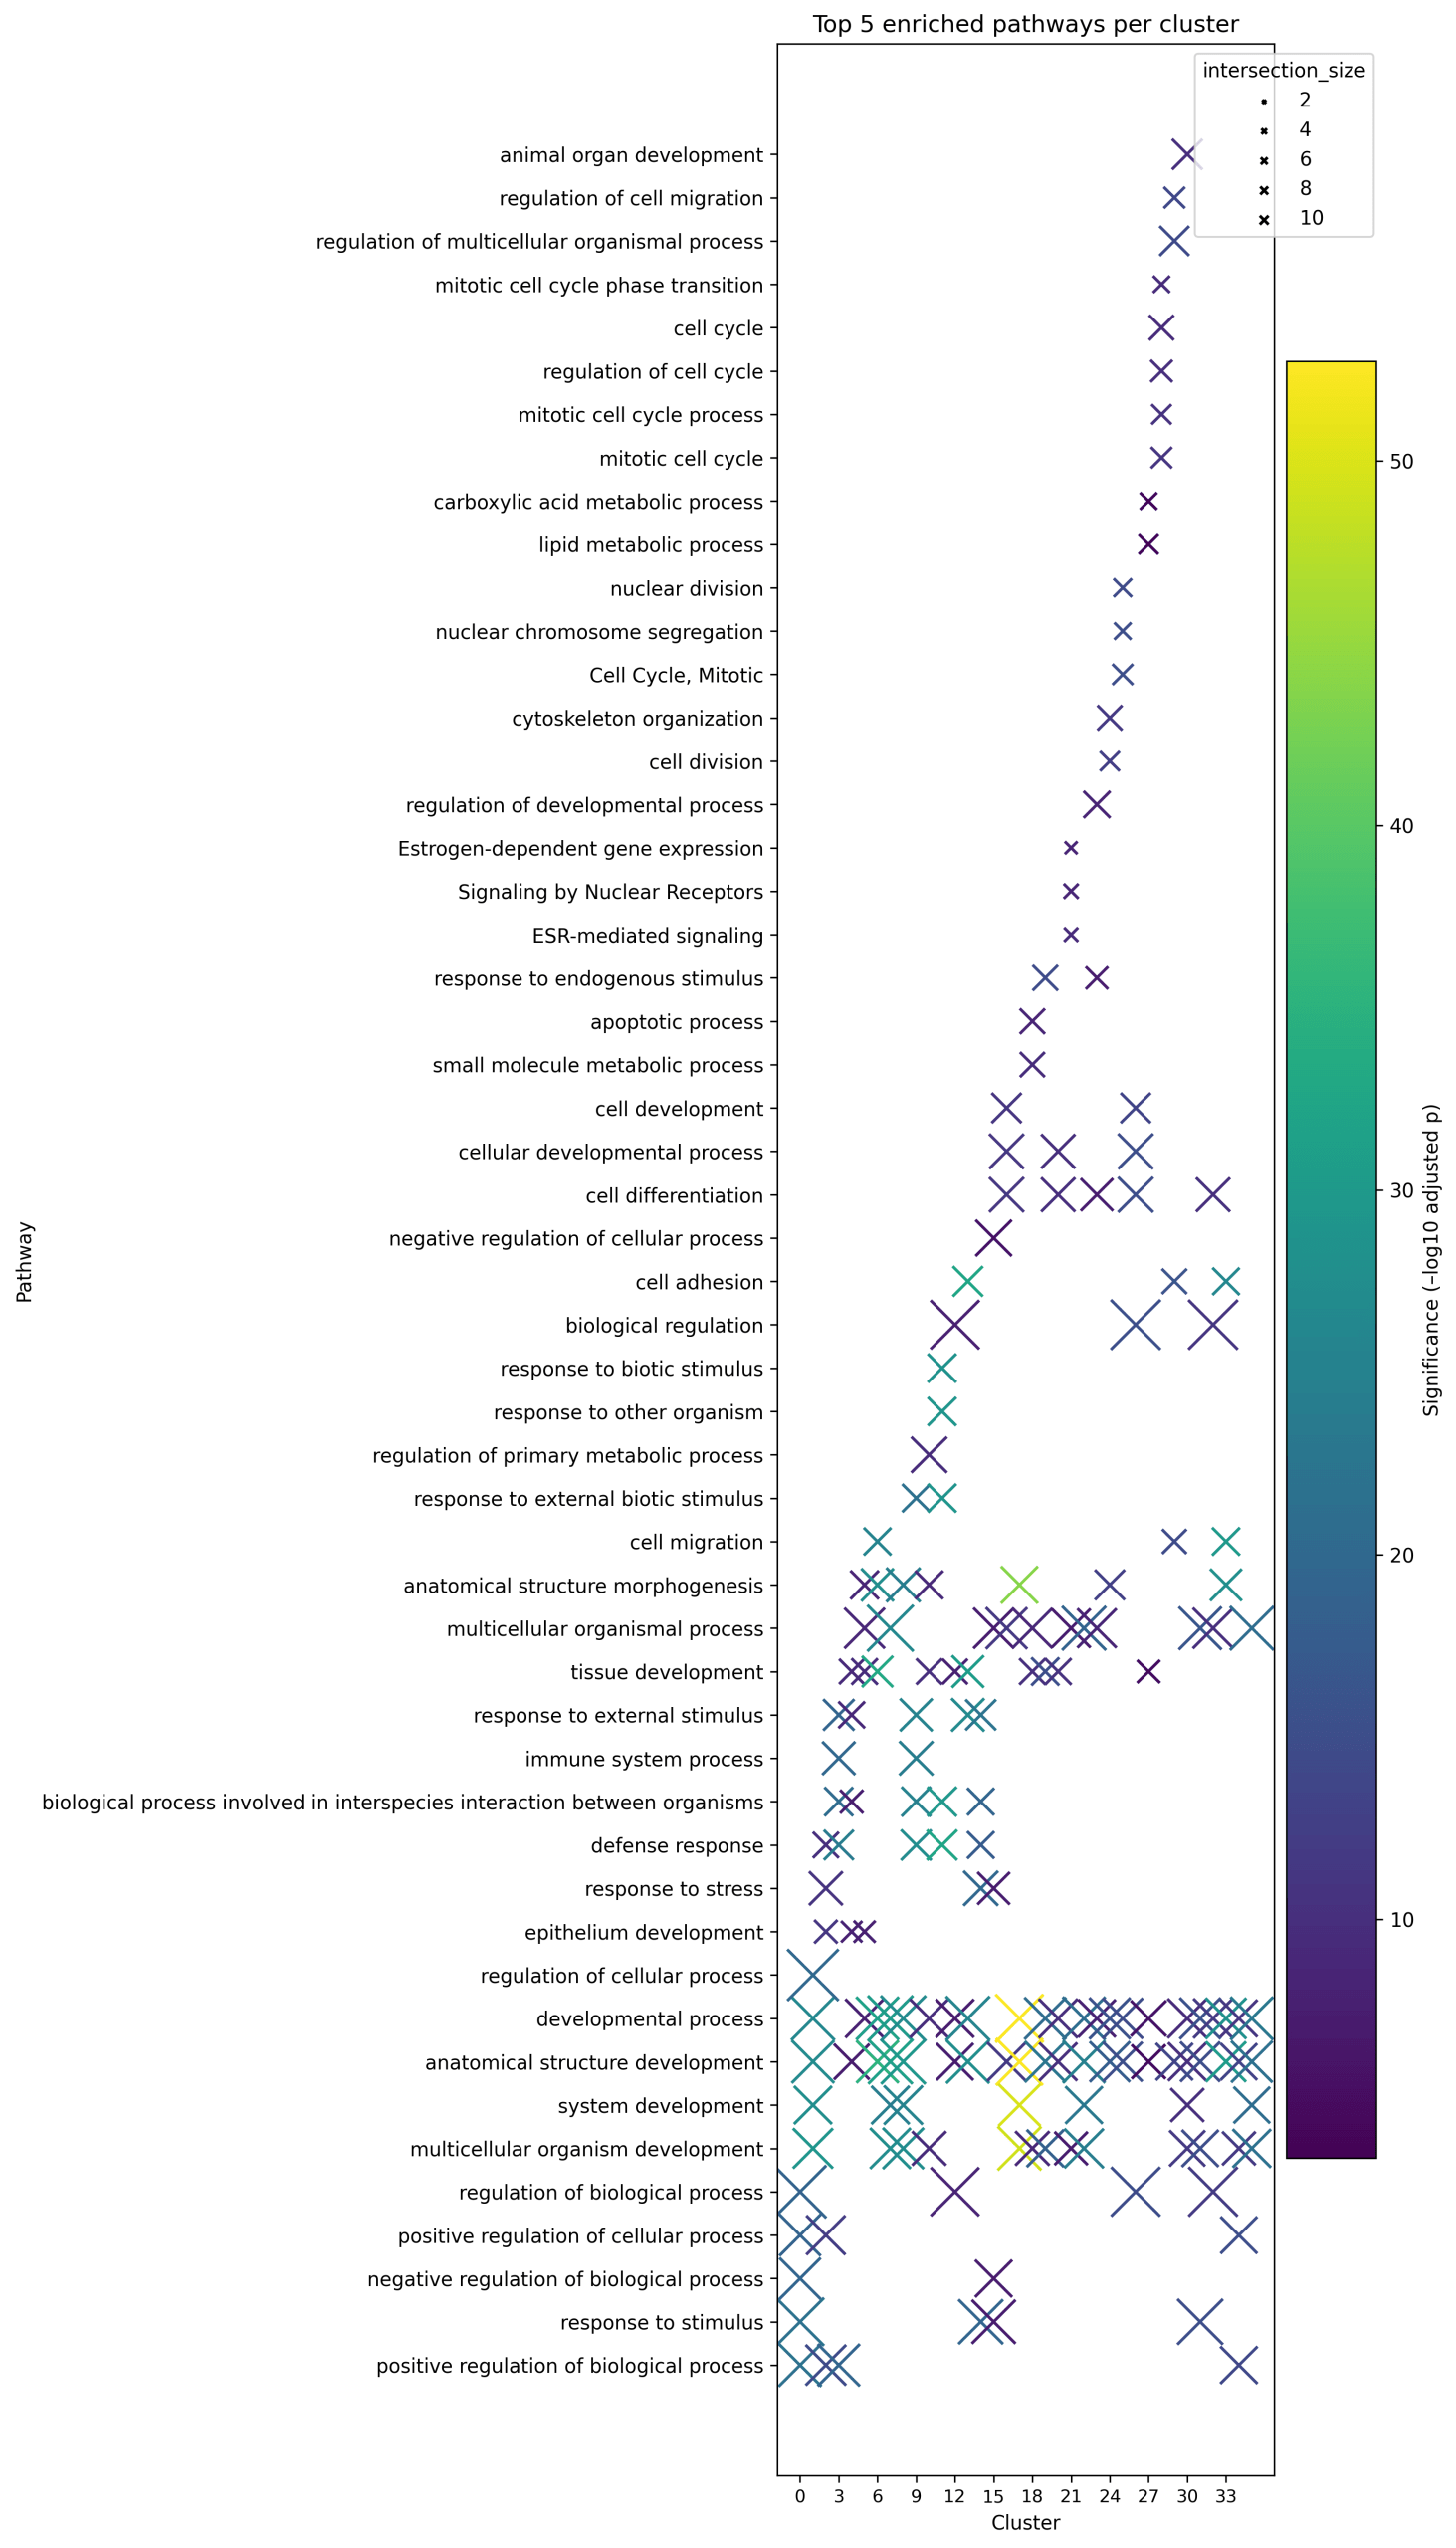
This analysis showed that clusters are not just defined by their marker genes, they also represent distinct biological programs (Table 2). Developmental pathways were notably enriched in several clusters, aligning with the well-known phenomenon of embryonic program reactivation in cancer27. Four clusters capture the key themes. Cluster 6(KRT14) reflects epidermal/keratinocyte differentiation, a pattern often linked to greater treatment sensitivity (protective). Cluster 25(H2BC11, H1-2, and H3C8) is heavy on cell-cycle control, marking an aggressive, proliferative state (adverse)28. Cluster 18(SCGB2A2 and HPGD) is anchored by SCGB2A2 (a secretory/hormone-lineage marker), with enrichment in lipid metabolism and apoptosis/cell death, consistent with a context-dependent program29. Cluster 11(CCL8, CCL19, and VCAM1) centers on immune-inflammatory signaling, which in many settings aligns with tumor-promoting inflammation30. Together, these examples capture the dataset’s biological range and therapeutic implications31. This diversity is illustrated in the dot plot showing the top five enriched pathways per cluster (Figure 3).
Therapeutic Mapping of Cluster-Specific Pathways
Protective clusters like Clusters 11, 9, 17, 13, and 3 were primarily enriched for differentiation- and development-related pathways, with Cluster 17 showing strong enrichment for cell differentiation. This aligns with existing evidence that differentiation programs can sensitize tumors to therapy by promoting more regulated cell states32.
On the other hand, adverse clusters showed enrichment for pathways linked to treatment resistance. For example, Cluster 17 was enriched for broad developmental programs including morphogenesis and migration, processes often associated with aggressive tumor phenotypes and poor therapeutic response33. Cluster 13 highlighted cell adhesion and tissue development, while Clusters 1 and 33 were associated with cell cycle regulation, motility, and migration, features that reflect environment-mediated drug resistance34. Cluster 11 was enriched for immune and inflammatory signaling, including defense and immune system processes, which are known to promote tumor survival. Together, these features align with established mechanisms of drug resistance in cancer35.
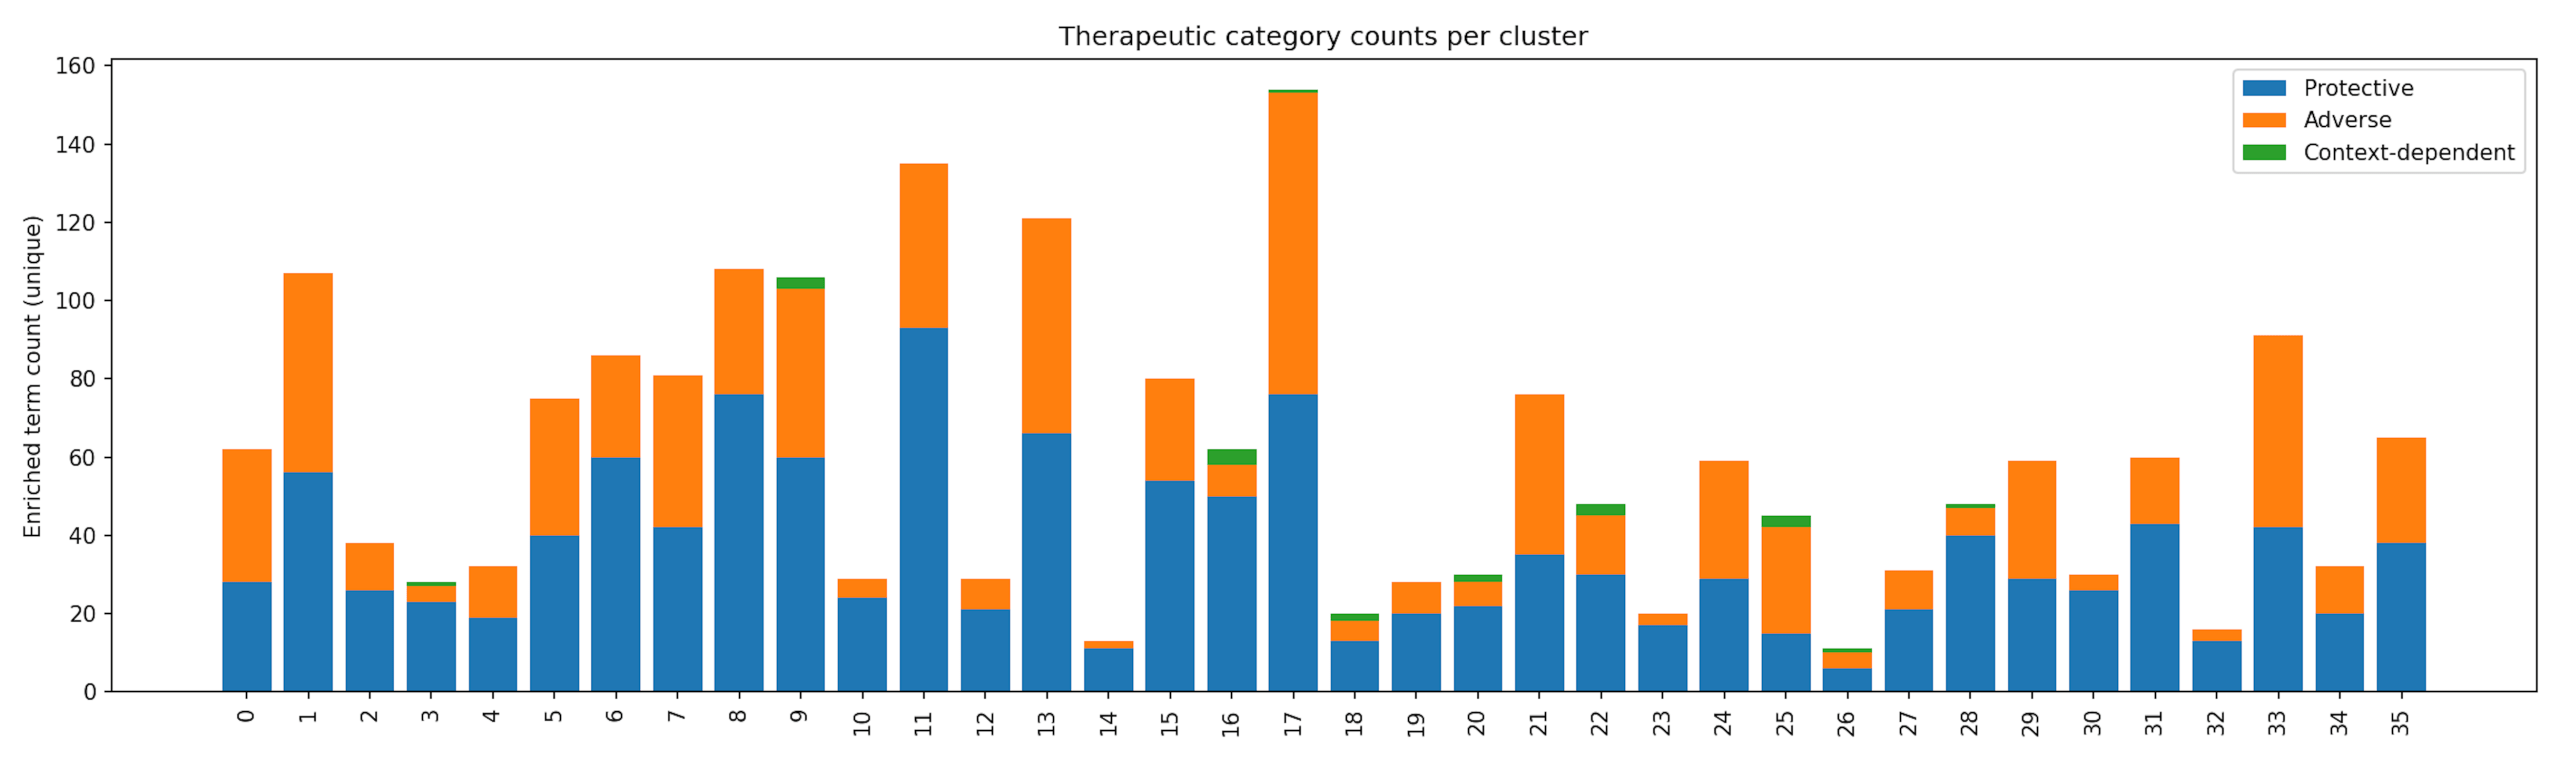
Because pathway categories were assigned at the pathway level rather than the cluster level, individual clusters may contain multiple enriched pathways and therefore appear in more than one category, reflecting biological complexity. Several clusters exhibited context-dependent enrichment patterns. For instance, Cluster 16 was enriched for smaller sets of pathways, while Clusters 8, 19, and 25 showed modest enrichment for stress and environmental response processes. These clusters likely represent cellular programs whose functional impact depends on tumor type and microenvironment, underscoring the importance of context in therapeutic responses36. The overall heterogeneity of the dataset is summarized in Figure 4 which breaks down the number of protective, adverse, and context-dependent pathways found within each cluster. The purpose of the pathway category mapping is to summarize and compare the types of enriched biological pathways across clusters.
Linking Cluster Markers to Annotated Targets (Pharos/TCRD)
Initially, the single top marker gene from each of the 36 clusters were investigated and only 1 approved drug target (Tclin), 2 chemically tractable proteins (Tchem), 22 biologically studied but no strong chemical modulators (Tbio) and 5 poorly studied proteins (Tdark) were identified. Expanding the analysis to the top 5 markers per cluster modestly increased these numbers to 9 Tclin, 17 Tchem, 106 Tbio and 13 Tdark.
While most of the top cluster markers fall outside the druggable space, this analysis identified a meaningful subset with direct therapeutic potential. Table 3 lists the marker genes classified as Tclin or Tchem, along with the corresponding transcriptional cluster in which each gene was identified, showing which genes have existing information related to drug targeting in the Pharos database.
| Gene Symbol | Target Development Level (TDL) | Gene Name | Gene Family | Cluster |
|---|---|---|---|---|
| BCL2 | Tclin | Apoptosis regulator Bcl-2 | NA | 26 |
| CALCRL | Tclin | Calcitonin gene-related peptide type 1 receptor | GPCR | 8 |
| CPS1 | Tclin | Carbamoyl-phosphate synthase [ammonia], mitochondrial | Enzyme | 27 |
| GABRA1 | Tclin | Gamma-aminobutyric acid receptor subunit alpha-1 | IC | 31 |
| ITGB1 | Tclin | Integrin beta-1 | NA | 35 |
| MME | Tclin | Neprilysin | Enzyme | 33 |
| OXTR | Tclin | Oxytocin receptor | GPCR | 29 |
| SCN3A | Tclin | Sodium channel protein type 3 subunit alpha | IC | 17 |
| SLC12A2 | Tclin | Solute carrier family 12 member 2 | Transporter | 34 |
| ALOX15B | Tchem | Arachidonate 15-lipoxygenase B | Enzyme | 30 |
| TRPC6 | Tchem | Short transient receptor potential channel 6 | IC | 8 |
| CES1 | Tchem | Liver carboxylesterase 1 | Enzyme | 2 |
| FABP7 | Tchem | Fatty acid-binding protein, brain | NA | 21 |
| FN1 | Tchem | Fibronectin | NA | 33 |
| GNMT | Tchem | Glycine N-methyltransferase | Enzyme | 20 |
| GSTP1 | Tchem | Glutathione S-transferase P | Enzyme | 35 |
| HPGD | Tchem | 15-hydroxyprostaglandin dehydrogenase [NAD(+)] | Enzyme | 18 |
| HSD17B1 | Tchem | Estradiol 17-beta-dehydrogenase 1 | Enzyme | 24 |
| VCAM1 | Tchem | Vascular cell adhesion protein 1 | NA | 11 |
| LDHB | Tchem | L-lactate dehydrogenase B chain | Enzyme | 0 |
| NPY1R | Tchem | Neuropeptide Y receptor type 1 | GPCR | 32 |
| S100B | Tchem | Protein S100-B | NA | 22 |
| SERPINA6 | Tchem | Corticosteroid-binding globulin | NA | 20 |
| SLC1A7 | Tchem | Excitatory amino acid transporter 5 | Transporter | 12 |
Integrated Pathway Enrichment and Target Annotation Across Clusters
An integrated summary of pathway enrichment and target annotation results is shown in Table 4. For each cluster, this table shows the dominant programs (prioritized across GO:BP, KEGG, and Reactome), the corresponding top enriched terms, representative TDL markers annotated in Pharos/TCRD, and a mechanism breadth label indicating whether putative pathway categories are broad (recurrent across clusters) or selective (cluster-specific). This integrated table highlights similarities and differences in biological programs across clusters and places them in the context of existing target knowledge.
| Cluster | Dominant Programs | Top Enriched Terms | Representative TDL Markers | Mechanism Breadth |
|---|---|---|---|---|
| 17 | DNA repair/Genomic stability; EMT/Stem-like/Invasion; Epigenetic/Chromatin | anatomical structure development; developmental process; system development; multicellular organism development; multicellular organismal process | CPS1, ITGB1, MME, OXTR, SCN3A | HDAC/BET/EZH2 modulation (selective); PARP/ATR/ATM pathway inhibition (broad); TGF-β/FAK pathway modulation (broad) |
| 9 | DNA repair/Genomic stability; EMT/Stem-like/Invasion; Hypoxia/Stress signaling; Metabolism (general) | anatomical structure development; multicellular organism development; system development; developmental process; anatomical structure morphogenesis | BCL2, CALCRL, ITGB1, MME, SLC12A2 | HIF/stress pathway modulation (selective); Metabolic pathway modulation (selective); PARP/ATR/ATM pathway inhibition (broad); TGF-β/FAK pathway modulation (broad) |
| 7 | DNA repair/Genomic stability; EMT/Stem-like/Invasion | anatomical structure development; developmental process; multicellular organism development; multicellular organismal process; cell differentiation | CPS1, ITGB1, OXTR | PARP/ATR/ATM pathway inhibition (broad); TGF-β/FAK pathway modulation (broad) |
| 21 | DNA repair/Genomic stability; EMT/Stem-like/Invasion; Proliferation/Cell cycle | anatomical structure development; multicellular organism development; developmental process; system development; multicellular organismal process | BCL2, CPS1, FABP7, LDHB, S100B | CDK inhibition (selective); PARP/ATR/ATM pathway inhibition (broad); TGF-β/FAK pathway modulation (broad) |
| 13 | DNA repair/Genomic stability; EMT/Stem-like/Invasion; Immune/Inflammation | cell adhesion; tissue development; response to external stimulus; anatomical structure development; cell migration | ITGB1, SLC12A2, FN1, LDHB | Immune checkpoint modulation (selective); PARP/ATR/ATM pathway inhibition (broad); TGF-β/FAK pathway modulation (broad) |
The integrated pathway analysis showed that different cell clusters were enriched for distinct biological pathways, and these patterns were organized using existing pathway annotation frameworks37. Across the 36 clusters, the analysis identified different biological pathway patterns associated with each cluster. EMT/Stem-like/Invasion programs were the most recurrent (12 clusters), followed by epigenetic/chromatin-associated processes (4), with smaller contributions from immune/inflammation-related (2) and metabolic (2) pathways38. Other pathway categories, including CDK-associated signaling, immune checkpoint-related signaling, and metabolic pathways, appeared more selectively across subsets of clusters. (Program counts reflect enrichment themes; mechanism counts reflect annotation-based pathway groupings.) Notably, every cluster contained at least one Tclin or Tchem marker (median 1 Tclin and 2 Tchem per cluster; e.g., ALOX15B, BCL2, CALCRL, CPS1), indicating overlap between cluster-specific transcriptional programs and targets cataloged in existing resources. Collectively, these patterns highlight recurring and cluster-specific pathway themes and provide a structured, annotation-based view of how transcriptional programs and existing target knowledge vary across clusters.
Discussion
This study applied single-cell RNA sequencing (scRNA-seq) combined with unsupervised machine learning to dissect the transcriptional heterogeneity of breast cancer cell lines. Analyzing over 35,000 cells 36 clusters were identified. While most clusters present unique transcriptional profiles, there were also some shared differentially expressed markers. This describes some biological similarities between distinct cell lines and sub-clusters identified here. These findings reinforce the increasingly accepted view that cancer is not a homogeneous disease but rather a mosaic of diverse cellular states coexisting within tumors2.
Functional enrichment analysis revealed that these clusters represent a broad spectrum of biological processes, including developmental programs, immune and inflammatory signaling, metabolic specialization, extracellular matrix remodeling, and epigenetic regulation. This diversity reflects the complex biology of breast cancer, where distinct subpopulations contribute variably to tumor growth, survival, and therapeutic resistance. Notably, clusters enriched for immune-related signaling or oxidative stress responses may correspond to more protective tumor states, whereas proliferative and epigenetically active clusters represent adverse subpopulations potentially driving aggressive disease progression.
Drug-target mapping demonstrated that many cluster-defining marker genes belong to structural or lineage-specific families, often outside the canonical druggable genome. Nonetheless, expanding the marker sets revealed a substantial number of approved drug targets together with many other proteins that are chemically tractable, placing these transcriptional programs in the context of existing target annotations. Linking enriched pathways to target classes provided an annotation-based framework for organizing cluster-level heterogeneity, including pathways related to amino acid metabolism, lipid and eicosanoid signaling, and epigenetic regulators. Importantly, coverage analysis indicated that some therapies have broad activity across multiple clusters, while others offer selective advantages against specific subpopulations, highlighting the complementary roles of broad-spectrum and precision-targeted interventions.
This work builds upon prior studies of intratumoral heterogeneity by systematically integrating cluster-level transcriptional profiles with therapeutic opportunities39. The framework established here bridges fundamental transcriptomic characterization with pharmacogenomic resources, offering a scalable and generalizable framework for organizing transcriptional heterogeneity in the context of existing pharmacogenomic annotations. The workflow exemplifies the power of combining scRNA-seq with unsupervised machine learning and drug-target databases to generate both biological insight and translational hypotheses.
Future research should extend this framework to primary patient tumors, integrate multi-omics datasets, and experimentally evaluate candidate therapeutic strategies in preclinical models. It should apply advanced computational and experimental approaches to mitigate technical artifacts such as batch effects and dropout events to ensure more robust and reproducible results. In addition, future studies could leverage patient single-cell RNA-seq data, incorporate spatial validation to confirm cellular context, and employ functional perturbation assays such as CRISPRi or siRNA to test cluster-specific targets.
In summary, this study set out to assess whether scRNA-seq combined with machine learning could resolve cancer heterogeneity into meaningful sub-clusters and connect them to therapeutic annotation. The analysis showed that breast cancer cells can be grouped into clusters, with some presenting distinct gene expression programs while others share overlapping biological trajectories. Some clusters carried druggable targets, while others were linked to pathway vulnerabilities that were distinct or shared between clusters.
Limitation
Several limitations should be acknowledged. First, the study is based on established cancer cell lines rather than patient-derived tumor samples, which may not fully capture the complexity and microenvironmental context of human tumors. Second, computational predictions of annotated targets and classes require experimental validation to confirm biological relevance and clinical efficacy. Third, this analysis focuses primarily on transcriptional data, omitting other regulatory layers such as epigenetic modifications, proteomics, and tumor microenvironment interactions. In addition, cell line-based transcriptomic analyses are susceptible to technical artifacts, including the presence of non-epithelial transcriptional signatures identified through automated annotation. While these signals were not biologically interpreted, their presence may introduce bias and should be considered when generalizing the results. Finally, there is a risk of over-interpreting pathway enrichment labels, as they may not fully reflect functional activity without orthogonal validation.
Conclusion
This study used single-cell RNA sequencing and computational analysis to resolve transcriptional heterogeneity within breast cancer cell lines, grouping over 35,000 cells into clusters characterized by distinct yet partially shared biological programs. Functional enrichment showed that these clusters reflect diverse processes, including developmental, immune, metabolic, structural, and epigenetic pathways. Drug-target mapping against the Pharos/TCRD database showed that while many markers are structural or lineage-specific, several markers overlapped with genes that have existing drug-target annotations, including nine approved drug targets and additional chemically tractable proteins. Pathway-level analysis further organized cluster-specific biology in relation to existing pathway and target annotation frameworks, providing a structured way to compare shared and cluster-specific biological programs across clusters. Overall, these analyses resolve intratumoral transcriptional heterogeneity into cluster-level gene programs and organize them in relation to biological pathways and existing drug-target annotations at single-cell resolution.
References
- B. Alberts, A. Johnson, J. Lewis, D. Morgan, M. Raff, K. Roberts, P. Walter. Molecular biology of the cell (6th ed.). Garland Science/Taylor & Francis, 2015, https://www.taylorfrancis.com/books/mono/10.1201/9781315735368/molecular-biology-cell-bruce-alberts. [↩]
- A. Marusyk, K. Polyak. Tumor heterogeneity: causes and consequences. Biochimica et Biophysica Acta (BBA) – Reviews on Cancer. Vol. 1805, pg. 105-117, 2010, https://doi.org/10.1016/j.bbcan.2009.11.002. [↩] [↩]
- Y. Li, C. Sun, J. Chen, R. Zhang. Applications and techniques of single-cell RNA sequencing across species. Briefings in Bioinformatics. Vol. 26, Article bbf354, 2025, https://doi.org/10.1093/bib/bbaf354. [↩]
- P. L. Ståhl, F. Salmén, S. Vickovic, A. Lundmark, J. F. Navarro, J. Magnusson, S. Giacomello, M. Asp, J. O. Westholm, M. Huss, A. Mollbrink, S. Linnarsson, S. Codeluppi, Å. Borg, F. Pontén, P. I. Costea, P. Sahlén, J. Mulder, O. Bergmann, J. Lundeberg, J. Frisén. Visualization and analysis of gene expression in tissue sections by spatial transcriptomics. Science. Vol. 353, pg. 78-82, 2016, https://doi.org/10.1126/science.aaf2403. [↩]
- C. Zhu, S. Preissl, B. Ren. Single-cell multimodal omics: the power of many. Nature Methods. Vol. 17, pg. 11-14, 2020, https://doi.org/10.1038/s41592-019-0691-5. [↩]
- I. Tirosh, B. Izar, S. M. Prakadan, M. H. Wadsworth II, D. Treacy, J. J. Trombetta, A. Rotem, C. Rodman, C. Lian, G. Murphy, M. Fallahi-Sichani, K. Dutton-Regester, J.-R. Lin, O. Cohen, P. Shah, D. Lu, A. S. Genshaft, T. K. Hughes, C. G. K. Ziegler, S. W. Kazer, A. Gaillard, K. E. Kolb, A.-C. Villani, C. M. Johannessen, A. Y. Andreev, E. M. Van Allen, M. Bertagnolli, P. K. Sorger, R. J. Sullivan, K. T. Flaherty, D. T. Frederick, J. Jané-Valbuena, C. H. Yoon, O. Rozenblatt-Rosen, A. K. Shalek, A. Regev, L. A. Garraway. Dissecting the multicellular ecosystem of metastatic melanoma by single-cell RNA-seq. Science. Vol. 352, pg. 189-196, 2016, https://doi.org/10.1126/science.aad0501. [↩]
- A. P. Patel, I. Tirosh, J. J. Trombetta, A. K. Shalek, S. M. Gillespie, H. Wakimoto, D. P. Cahill, B. V. Nahed, W. T. Curry, R. L. Martuza, D. N. Louis, O. Rozenblatt-Rosen, M. L. Suvà, A. Regev, B. E. Bernstein. Single-cell RNA-seq highlights intratumoral heterogeneity in primary glioblastoma. Science. Vol. 344, pg. 1396-1401, 2014, https://doi.org/10.1126/science.1254257. [↩]
- T. Stuart, R. Satija. Integrative single-cell analysis. Nature Reviews Genetics. Vol. 20, pg. 257-272, 2019, https://doi.org/10.1038/s41576-019-0093-7. [↩]
- G. Gambardella, G. Viscido, D. di Bernardo. Molecular phenotyping of breast cancer cell lines at the single-cell level for automated tumour diagnosis and prediction of drug sensitivity [Data set]. Gene Expression Omnibus, 2022, https://www.ncbi.nlm.nih.gov/geo/query/acc.cgi?acc=GSE173634. [↩]
- Scikit-learn Developers. scikit-learn: Machine learning in Python (Version 1.4) [Computer software], 2024, https://scikit-learn.org. [↩]
- L. McInnes, J. Healy, J. Melville. UMAP: uniform manifold approximation and projection for dimension reduction. arXiv preprint, 2018, https://arxiv.org/abs/1802.03426. [↩]
- C. Domínguez Conde, C. Xu, L. B. Jarvis, D. B. Rainbow, S. B. Wells, T. Gomes, S. K. Howlett, O. Suchanek, K. Polanski, H. W. King, L. Mamanova, N. Huang, P. A. Szabo, L. Richardson, L. Bolt, E. S. Fasouli, K. T. Mahbubani, M. Prete, L. Tuck, N. Richoz, Z. K. Tuong, L. Campos, H. S. Mousa, E. J. Needham, S. Pritchard, T. Li, R. Elmentaite, J. Park, E. Rahmani, D. Chen, D. K. Menon, O. A. Bayraktar, L. K. James, K. B. Meyer, N. Yosef, M. R. Clatworthy, P. A. Sims, D. L. Farber, K. Saeb-Parsy, J. L. Jones, S. A. Teichmann. Cross-tissue immune cell analysis reveals tissue-specific features in humans. Science. Vol. 376, Article eabl5197, 2022, https://doi.org/10.1126/science.abl5197. [↩]
- T. Stuart, A. Butler, P. Hoffman, C. Hafemeister, E. Papalexi, W. M. Mauck, Y. Hao, M. Stoeckius, P. Smibert, R. Satija. Comprehensive integration of single-cell data. Cell. Vol. 177, pg. 1888-1902.e21, 2019, https://doi.org/10.1016/j.cell.2019.05.031. [↩]
- F. A. Wolf, P. Angerer, F. J. Theis. SCANPY: large-scale single-cell gene expression data analysis. Genome Biology. Vol. 19, Article 15, 2018, https://doi.org/10.1186/s13059-017-1382-0. [↩] [↩] [↩]
- V. A. Traag, L. Waltman, N. J. van Eck. From Louvain to Leiden: guaranteeing well-connected communities. Scientific Reports. Vol. 9, Article 5233, 2019, https://doi.org/10.1038/s41598-019-41695-z. [↩]
- L. Hubert, P. Arabie. Comparing partitions. Journal of Classification. Vol. 2, pg. 193-218, 1985, https://doi.org/10.1007/BF01908075. [↩]
- A. Strehl, J. Ghosh. Cluster ensembles: a knowledge reuse framework for combining multiple partitions. Journal of Machine Learning Research. Vol. 3, pg. 583-617, 2002, https://www.jmlr.org/papers/volume3/strehl02a/strehl02a.pdf. [↩]
- F. Wilcoxon. Individual comparisons by ranking methods. Biometrics Bulletin. Vol. 1, pg. 80-83, 1945, https://doi.org/10.2307/3001968. [↩]
- HBC Data Science Team. Merged single-cell marker identification, 2021, https://hbctraining.github.io/scRNA-seq/lessons/09_merged_SC_marker_identification.html. [↩]
- U. Raudvere, L. Kolberg, I. Kuzmin, T. Arak, P. Adler, H. Peterson, J. Vilo. g:Profiler: a web server for functional enrichment analysis and conversions of gene lists. Nucleic Acids Research. Vol. 47, pg. W191-W198, 2019, https://doi.org/10.1093/nar/gkz369. [↩]
- T. K. Sheils, S. L. Mathias, K. J. Kelleher, V. B. Siramshetty, D.-T. Nguyen, C. G. Bologa, L. J. Jensen, D. Vidović, A. Koleti, S. C. Schürer, A. Waller, J. J. Yang, J. Holmes, G. Bocci, N. Southall, P. Dharkar, E. Mathé, A. Simeonov, T. I. Oprea. TCRD and Pharos 2021: mining the human proteome for disease biology. Nucleic Acids Research. Vol. 49, pg. D1334-D1346, 2021, https://doi.org/10.1093/nar/gkaa993. [↩]
- T. I. Oprea, C. G. Bologa, S. Brunak, A. Campbell, G. N. Gan, A. Gaulton, S. M. Gomez, R. Guha, A. Hersey, J. Holmes, A. Jadhav, L. J. Jensen, G. L. Johnson, A. Karlson, A. R. Leach, A. Ma’ayan, A. Malovannaya, S. Mani, S. L. Mathias, M. T. McManus, T. F. Meehan, C. von Mering, D. Muthas, D.-T. Nguyen, J. P. Overington, G. Papadatos, J. Qin, C. Reich, B. L. Roth, S. C. Schürer, A. Simeonov, L. A. Sklar, N. Southall, S. Tomita, I. Tudose, O. Ursu, D. Vidović, A. Waller, D. Westergaard, J. J. Yang, G. Zahoránszky-Köhalmi. Unexplored therapeutic opportunities in the human genome. Nature Reviews Drug Discovery. Vol. 17, pg. 377-396, 2018, https://doi.org/10.1038/nrd.2018.14. [↩]
- D. Hanahan, R. A. Weinberg. Hallmarks of cancer: the next generation. Cell. Vol. 144, pg. 646-674, 2011, https://doi.org/10.1016/j.cell.2011.02.013. [↩]
- C. M. Perou, T. Sørlie, M. B. Eisen, M. van de Rijn, S. S. Jeffrey, C. A. Rees, J. R. Pollack, D. T. Ross, H. Johnsen, L. A. Akslen, Ø. Fluge, A. Pergamenschikov, C. Williams, S. X. Zhu, P. E. Lønning, A.-L. Børresen-Dale, P. O. Brown, D. Botstein. Molecular portraits of human breast tumours. Nature. Vol. 406, pg. 747-752, 2000, https://doi.org/10.1038/35021093. [↩]
- R. Kalluri, R. A. Weinberg. The basics of epithelial-mesenchymal transition. Journal of Clinical Investigation. Vol. 119, pg. 1420-1428, 2009, https://doi.org/10.1172/JCI39104. [↩]
- R. Förster, A. C. Davalos-Misslitz, A. Rot. CCR7 and its ligands: Balancing immunity and tolerance. Nature Reviews Immunology. Vol. 8, pg. 362-371, 2008, https://doi.org/10.1038/nri2297. [↩]
- X. Ma, W. Gong, D. Matei. Cancer stem-like cells and developmental pathways. Genes & Cancer. Vol. 1, pg. 1017-1033, 2010, https://doi.org/10.1177/1947601910392986. [↩]
- M. L. Whitfield, G. Sherlock, A. J. Saldanha, J. I. Murray, C. A. Ball, K. E. Alexander, J. C. Matese, C. M. Perou, M. M. Hurt, P. O. Brown, D. Botstein. Identification of genes periodically expressed in the human cell cycle. Molecular Biology of the Cell. Vol. 13, pg. 1977-2000, 2002, https://doi.org/10.1091/mbc.02-02-0030. [↩]
- F. S. Al Joudi. Human mammaglobin in breast cancer: a brief review of its clinical utility. Indian Journal of Medical Research. Vol. 139, pg. 675-685, 2014, https://pubmed.ncbi.nlm.nih.gov/25027076/. [↩]
- A. Mantovani, P. Allavena, A. Sica, F. Balkwill. Cancer-related inflammation. Nature. Vol. 454, pg. 436-444, 2008, https://doi.org/10.1038/nature07205. [↩]
- C. E. Meacham, S. J. Morrison. Tumour heterogeneity and cancer cell plasticity. Nature. Vol. 501, pg. 328-337, 2013, https://doi.org/10.1038/nature12624. [↩]
- S. Sell. Stem cell origin of cancer and differentiation therapy. Critical Reviews in Oncology/Hematology. Vol. 51, pg. 1-28, 2004, https://doi.org/10.1016/j.critrevonc.2004.04.007. [↩]
- N. Vasan, J. Baselga, D. M. Hyman. A view on drug resistance in cancer. Nature. Vol. 575, pg. 299-309, 2019, https://doi.org/10.1038/s41586-019-1730-1. [↩]
- M. B. Meads, R. A. Gatenby, W. S. Dalton. Environment-mediated drug resistance. Nature Reviews Cancer. Vol. 9, pg. 665-674, 2009, https://doi.org/10.1038/nrc2714. [↩]
- C. Holohan, S. V. Schaeybroeck, D. B. Longley, P. G. Johnston. Cancer drug resistance: an evolving paradigm. Nature Reviews Cancer. Vol. 13, pg. 714-726, 2013, https://doi.org/10.1038/nrc3599. [↩]
- F. R. Greten, S. I. Grivennikov. Inflammation and cancer. Immunity. Vol. 51, pg. 27-41, 2019, https://doi.org/10.1016/j.immuni.2019.06.025. [↩]
- L. A. Garraway. Genomics-driven oncology. Journal of Clinical Oncology. Vol. 31, pg. 1806-1814, 2013, https://doi.org/10.1200/JCO.2012.46.8934. [↩]
- M. A. Nieto, R. Y.-J. Huang, R. A. Jackson, J. P. Thiery. EMT: 2016. Cell. Vol. 166, pg. 21-45, 2016, https://doi.org/10.1016/j.cell.2016.06.028. [↩]
- N. R. Parker, A. L. Hudson, P. Khong, J. F. Parkinson, T. Dwight, R. J. Ikin, Y. Zhu, Z. J. Cheng, F. Vafaee, J. Chen, H. R. Wheeler, V. M. Howell. Intratumoral heterogeneity in glioblastoma. Scientific Reports. Vol. 6, Article 22477, 2016, https://doi.org/10.1038/srep22477. [↩]


