
Abstract
Diabetes mellitus affects 0.17–0.64% of dogs, with small breeds at elevated risk. Current AAHA treatment guidelines inadequately address the dosing challenges specific to small-breed dogs, where optimal insulin doses fall below the precision limits of standard U-100 syringes. This case report examines whether insulin dilution and delayed post-meal injection timing may offer practical approaches for managing diabetes in a small-breed dog. Observational clinical data were collected over 2.5 years from a 5 lb, 12-year-old toy poodle treated with NPH insulin. The dataset comprised 442 blood glucose readings across 10 periods. Hypoglycemia risk was compared between injections administered with feeding versus those delayed by 1 hour. Blood glucose curves were also compared between a high-insulin regimen (approximately 1 U with kibble) and a low-insulin regimen (0.33–0.5 U with low-glycemic freeze-dried food), the latter made possible only through 1:9 insulin dilution. The likelihood of hypoglycemia decreased from 55% (6/11 instances) to 25% (11/44 instances) when insulin injection was delayed. Bayesian analysis indicated a 96.8% probability that the delayed group had a lower rate of hypoglycemia. Median blood glucose at 3 hours post-injection was 55 mg/dL in the low-insulin regimen versus 162 mg/dL in the high-insulin regimen (p = 0.002). These findings suggest that insulin dilution and injection timing adjustments may warrant consideration in the management of small-breed dog diabetes. However, because this is an N-of-1 observational study, no causal conclusions can be drawn, and controlled research is needed before modifying treatment protocols.
Keywords: case report, diabetes, dogs, small breed, insulin timing, insulin dilution
Introduction
Background and Context
Diabetes mellitus in dogs is a common endocrine disease, with prevalence estimated between 0.17% and 0.64% depending on methodology. In the US, prevalence was 0.17% in 2010 at Banfield hospitals (the PetSmart Network)1. In a US hospital setting, Guptill et al.2 found a prevalence of 0.64% in 2000, a rate that tripled from 1970. In the UK, the prevalence in 89 small-animal practices was 0.34% (2009 to 2012)3. Insurance data from an insurer that tracked 30% of dogs in Sweden found an incidence of 0.13% per year of insured dog4. Small breeds are particularly at risk of developing diabetes3,5.
Prognosis is variable and depends on both clinical presentation and owner decisions, with an overall median survival of 17 months after diagnosis3. The main causes of death are euthanasia (40% of owners chose not to treat after diagnosis)4, ketoacidosis at the time of diagnosis (15% of dogs were diagnosed with ketoacidosis when diabetes was discovered)6, and of these 30% could not be stabilized7, and long-term complications. Among dogs that survived 30 days, the Swedish study reported survival rates of 75% at 1 year, 70% at 2 years, and 65% at 3 years4, with the caveat that this included only dogs less than 10 years old when survival was measured.
Insulin therapy is the gold standard of care, with a goal to minimize complications and optimize body condition, while avoiding hypoglycemia8 and ketoacidosis, which are emergencies; success is measured by owner-perceived quality of life and owner satisfaction. AAHA has published treatment guidelines9 recommending insulin injection twice daily with meals at equal intervals, along with a detailed treatment protocol for parameter adjustment. The standard of care discusses several types of insulin. Only two veterinary insulins are available, both U-40, but human insulins, such as NPH U-100, are also commonly prescribed. The initial recommended insulin dose is 0.25 U/kg per injection, and most dogs are eventually stabilized between 0.2–1.0 U/kg. The guidelines describe a detailed protocol that alternates between measuring a full blood glucose curve (BGC) and slow adjustments to insulin dose. The goal is to keep the nadir (lowest blood glucose measurement after injection) between 80 mg/dL and 150 mg/dL to minimize the risk of hypoglycemia while achieving an average blood glucose < 250 mg/dL, ideally with no reading above 300 mg/dL. If difficult to stabilize with insulin dose adjustments, the guidelines also suggest changing the insulin type (from fast/intermediate to slow-acting) and the food type (with different glycemic indices).
Small-breed dogs are more challenging to treat because the insulin dose needed is so small that it reaches the precision limits of common delivery devices, which are typically optimized for humans. The treatment guidelines9 fail to address the issue: while they call for adjusting the insulin dose in increments of up to 10–25%, they also state that the dose should be rounded to the nearest whole unit. For a dog weighing 5 pounds, the guidelines are impractical because they require an initial dose of 0.56 U, rounded to 1 U, which can be adjusted only in 1 U increments later. The only relief that the guidelines recommend is potentially using less concentrated U-40 insulin while discouraging dilution.
In addition to the lack of precision in adjusting insulin doses as needed, a significant concern for small breeds is the risk of large-syringe error: the quantity injected may be very different than the intended amount. U-100 insulin syringes are commonly available in 0.3 ml (30 U) with 0.5 U graduations and have been shown to be highly inaccurate at low doses. Syringes have a dead space that can hold a fixed amount of insulin and be inadvertently injected. The ISO standard10 permits a +/- 1.5% error of the total nominal capacity for injected quantities less than half, which, for a 0.3 ml, is a fixed +/- 0.45 U no matter what dose is measured. The error in administering small insulin doses has been more thoroughly addressed in the pediatric literature, where the treatment of neonates also faces this issue: trained nurses injected 0.975 +/- 0.315 when intending to deliver 0.5 U, and 1.638 +/- 0.376 when intending to administer 1 U11.
The literature discusses various approaches to address errors in delivering small doses, but there is no consensus, and guidelines are conflicting and insufficient. Some veterinarians resort to unconventional methods to treat diabetic cats, which almost always require very low doses. Roomp et al.12 recommend two methods: a drop-counting method and an “insulin ruler”. In the drop-counting method, one counts the number of drops in a full syringe and then discards enough drops to reach the desired low insulin level. In the syringe-ruler method, one prints a sub-mm ruler that is then aligned with the syringe, claiming that it works to draw even 0.1 U. Both methods are futile in addressing the fixed dead-space and are also impractical (one requires counting many drops for each injection, and the other exceeds practical visual discrimination). Another advancement has been the introduction of insulin pens, which are more accurate than syringes and can dispense insulin in 0.5 U increments, thereby avoiding the dead-space issue13. However, for a small dog, a 0.5 U resolution remains insufficient for precise dose adjustments.
Dilution is a controversial topic. The official AAHA guidelines9 recommend against it, yet it is a common practice in pediatrics14, and some also recommend it for veterinary use13. Dilution is considered risky because of potential process errors15, infection risk12, and shortening the expiration date. For example, if one uses the same syringe for mixing, the dead space from the first drawing is completely flushed out by the second drawing, potentially overdosing on the insulin16. Yet, Eli Lilly sells a diluent matched to their Humulin U-100 insulin that contains an identical antibacterial preservative and sterile vials for mixing.
There is also plenty of evidence that the type of food significantly affects the blood sugar and the amount of insulin required to stabilize the dog17. Aside from the glycemic index, higher fiber content leads to better diabetes control and a lower insulin requirement18.
Regarding the timing between feeding and injection, the AAHA guideline calls for insulin and meals to be given simultaneously9. No recommendation in the literature has been found that delaying insulin after the meal would better control hypoglycemia, even though researchers have shown that blood glucose may take between 30 and 240 minutes after the meal to start increasing17, and that NPH insulin may reach peak activity as soon as 30 minutes in dogs19. Instead, the recommendations call for changing the insulin regimen or the type of food if the patient cannot be stabilized.
Problem Statement and Rationale
Small-breed diabetic dogs pose special challenges in administering insulin therapy, a fact acknowledged by the AAHA treatment protocol but not addressed with a practical method. Treatment focuses on optimizing feeding, the insulin type, and insulin dose to minimize the risk of hypoglycemia (a medical emergency) while maintaining a low average blood glucose. The limiting factor in stabilizing and optimizing the blood glucose curve in small dogs is the ability to deliver small insulin doses (<= 1 U of U-100) in small-increment adjustments (<= 0.2 U of U-100). Without such ability, caregivers are forced to administer a high insulin dose that is mismatched to the body weight. Hypoglycemia can still be avoided by feeding a higher-glycemic-index food or switching to a lower-acting insulin, but this comes at the cost of higher average and peak blood glucose and, potentially, long-term complications. Thus, any advancement in the ability to deliver low insulin doses in low increments would significantly increase the ability to stabilize diabetes in small-breed dogs. Another mitigation this article proposes is to reduce the risk of hypoglycemia by adjusting the timing between feeding and insulin injection, thereby allowing a lower average blood glucose without adjusting the food type and quantity or the insulin type.
Significance and Purpose
Diabetes in dogs is a significant disease of increasing prevalence, with a risk of 0.13% per year4 of developing the disease in the first 10 years, and even higher after that. Small breeds are particularly susceptible. Treating diabetes can impose a significant, multi-year burden on caregivers, which is worsened if the dog develops complications because of poor control of average and peak blood glucose. The gaps in AAHA treatment recommendations for small dogs leave veterinarians and home caregivers to resort to off-label, potentially ineffective protocols. The purpose of this article is to propose practical adjustments to the protocol that may meaningfully increase caregivers’ ability to treat diabetes in small dogs.
Objectives
The objective of this article is to highlight gaps in the diabetes treatment protocol for small-breed dogs and to propose sensible adjustments that were found to be effective in one dog whose treatment was followed for a period of 2.5 years. This article calls for revisiting the recommendation to avoid insulin dilution, as this technique can significantly improve the accuracy of small insulin doses, given the absence of practical alternatives, while its drawbacks can be mitigated. It also introduces a new method that was effective for this patient but has not been reported in the literature: a slight delay between feeding and insulin injection, timed to the specific effects of food and insulin type on blood glucose.
Scope and Limitations
This article discusses two potential adjustments to the diabetes treatment protocol in small-breed dogs: diluting insulin to improve low-dose precision and introducing a temporal gap between feeding and injection. The article presents an example of how these recommendations were applied to treat a 5lb toy poodle over 2.5 years and provides numerical evidence of their effectiveness. While the dataset was carefully logged and is substantial (442 glucose samples), the goals at the time were to minimize measurements that were unlikely to benefit the patient, which is different from running controlled experiments. Even with this weaker goal, there is sufficient statistical evidence in the data to argue that the two protocol adjustments were appropriate for treating this toy poodle and improved his blood glucose control. However, this is an N-of-1 observational case, and no causal inference beyond this patient can be drawn. Further testing is required before committing to modifying the treatment protocol.
Theoretical Framework
Blood Glucose Model
The theoretical model of how blood glucose varies throughout the day is well understood. This article refers to a simplified model20 that is appropriate for Type 1 diabetic dogs and sufficient for analyzing the three techniques in question. Blood glucose depends primarily on two effects: the metabolism of carbohydrates after a meal, and the absorption of insulin after a subcutaneous injection. Let g(t) denote the blood glucose above the basal level at time t, and i(t) represent the quantity of blood insulin above the basal level (if there is any residual insulin capacity left). The blood insulin i(t) does not act directly on g(t), but via a remote insulin quantity X(t), which represents the insulin that permeated from plasma and reached tissues. The equations that describe how blood glucose varies with time according to this model are:
![\[\frac{dg}{dt} = -S_g\, g(t) - X(t)\, g(t) + R_a(t)\\\]](https://nhsjs.com/wp-content/ql-cache/quicklatex.com-d1079b14d574b3152a1dbe4050ceab02_l3.png "Rendered by QuickLaTeX.com")
![\[\frac{dX}{dt} = -kX(t) + S_I\, i(t)\]](https://nhsjs.com/wp-content/ql-cache/quicklatex.com-7d84c87bd7a6a81372fdd3458f157270_l3.png "Rendered by QuickLaTeX.com")
 is the rate at which glucose from the meal is released into blood,
  is the glucose effectiveness (which causes glucose to subside on its own eventually),
  the insulin sensitivity index21, and k the decay rate of insulin action. With respect to the metabolism of food into glucose (the term), a simple model with a fixed period after meal when
  , followed by a strong peak and subsequent gradual decay, is assumed, consistent with existing literature22. Modeling blood insulin after subcutaneous injection i(t) is more challenging23, as it depends on the insulin type and varies between dogs. NPH insulin in dogs lasts for more than 4 hours, with a peak (nadir) at 1–10 hours24.
The model provides a solid basis for understanding the dynamics between the timing and quantity of feeding and insulin injection, and the resulting glucose curve. Specifically, feeding starts to impact glucose only after a delay, followed by a quick, strong peak and a gradual decay. NPH insulin starts to act rapidly after injection, counteracting the effects of the meal, with the most significant effect (nadir) a few hours after injection. Eventually, the effects of both the meal and the NPH insulin injection subside within 12 hours, on time for the next meal and injection. This simplified model does have limitations: a few glucose curves exhibited the Somogyi effect25, in which the organism responds to a hypoglycemic event by increasing glucose levels via internal mechanisms unrelated to feeding, resulting in excessive glucose. Explaining Somogyi requires more complex models than the one presented above.
Insulin Syringe Error Model
It is helpful to introduce an error model for the amount of insulin delivered via a syringe, consistent with the ISO Standard10 and studies of the actual amount delivered11,15,16,26.
Let  be the insulin volume at the intended graduation,
  the actual amount delivered, and C the nominal capacity of the syringe (maximum volume), all measured in U. Then, according to the standard
![\[V_{\text{del}} \in \left( V_{\text{grad}}(1-\alpha),\, V_{\text{grad}}(1+\alpha) \right)\quad \text{if } V_{\text{grad}} \ge \frac{C}{2} \]](https://nhsjs.com/wp-content/ql-cache/quicklatex.com-99b955aa6168ffa5024475d755b3a5d4_l3.png "Rendered by QuickLaTeX.com")
![\[V_{\text{del}} \in \left( V_{\text{grad}}(1-\beta),\, V_{\text{grad}} + C\gamma \right)\quad \text{if } V_{\text{grad}} < \frac{C}{2}\]](https://nhsjs.com/wp-content/ql-cache/quicklatex.com-a50d904c382c4c5578e0550684559a9e_l3.png "Rendered by QuickLaTeX.com")
where α=5%,β=2%,δ=1.5%. That is, if the measured amount is less than half the syringe’s capacity, the allowed upper-bound error in the delivered amount is a proportion of the syringe’s total capacity, which can be quite large. Aside from the systematic error due to the syringe’s specifications, there is also measurement error because the caregiver may not place the piston exactly on the intended graduation. If V is the intended amount to be delivered, then
![\[V_{\text{grad}} = V \pm \varepsilon g\]](https://nhsjs.com/wp-content/ql-cache/quicklatex.com-61817a8173b128ecedb4e16fc5cde2ed_l3.png "Rendered by QuickLaTeX.com")
where g is the scale interval of the syringe, and a reasonable ε value would be 20% (a caregiver is not expected to hit the intended graduation mark better than 20% above or below every time).
For example, according to this model, if a caregiver wants to inject 1 U on a 0.3 ml U-100 syringe with 0.5 graduations, the delivered amount could be anywhere between 0.88 U and 1.55 U; if the intended amount is 0.5 U, then the actual amount could be between 0.39 U and 1.05 U. On the other hand, if one draws the maximum amount on a large syringe for dilution purposes, the error is much lower: on a 100 ml syringe with 1 U graduations, if one intends to draw 100 U, the actual amount could be between 94.81 U and 105.21 U.
Dilution reduces the error by minimizing the impact of the reading error and of the fixed error Cγ that is independent of the intended amount at low volumes. If the insulin is diluted perfectly by a factor of N, the accuracy of the delivered amount is thus:
![\[V_{\text{del}} \in \left(\left(V - \frac{\varepsilon g}{N}\right)(1-\beta),\;V + \frac{\varepsilon g}{N} + \frac{C\gamma}{N}\right)\]](https://nhsjs.com/wp-content/ql-cache/quicklatex.com-e86a0c90bead51b8827751033b0d08ed_l3.png "Rendered by QuickLaTeX.com")
This means that if insulin has been diluted perfectly by 10, on a 0.3 ml U-100 syringe with 0.5 graduations, delivering 0.5 U could result in a delivered amount between 0.48 U and 0.55 U (as opposed to between 0.39 U and 1.05 U undiluted). Moreover, the 0.5 gradations allow the intended amount to be adjusted by 0.05 U post-dilution.
There is also, however, an error in the dilution factor potentially introduced by the dilution procedure that may need to be accounted for. To dilute insulin, one must draw insulin and diluent multiple times with a larger syringe (100 U) at the syringe’s maximum capacity (1 times insulin, N-1 times diluent). Each draw potentially introduces an error. If the process is followed correctly, the main source of error during dilution is the random measurement error ε. The systematic multiplicative measurement error α cancels out because it applies in the same way to all N draws. On 100 U syringes, with 1 U graduations, and ±20% of a unit measurement error, the error in each draw amounts to 0.2%, which is a negligible impact on the final dilution factor (10±0.3% if intending to dilute by a factor of 10).
Case Presentation and Description
A 5 lb, 12-year-old toy poodle diagnosed with diabetes was treated at home with NPH U-100 insulin injected twice daily, and followed for 2.5 years with careful logging of blood glucose curves and treatment adjustments. The patient was started at 1 U per injection; after diluting the insulin 1:9, the caregivers optimized the treatment and administered only 0.33 U. The caregivers also found that it was easier to prevent hypoglycemia if insulin was injected 1 hour after the meal rather than with the meal. The article analyzes the collected blood glucose data statistically to show that the patient had more optimal blood glucose curves at the lower insulin dose and that the data support delaying insulin after meals.
Methods
Research Design
The study comprises observational clinical data collected by the pet’s owners over 2.5 years on a small-breed diabetic dog to stabilize the diabetes and optimize treatment. Blood glucose curves were collected, and the insulin dose, food type and amount, and timing of the insulin were adjusted until the treatment was deemed satisfactory. The research question is whether the data support treatment choices such as insulin dilution and introducing a delay between feeding and the insulin injection. Although the data were collected during clinical care, with the dog’s welfare prioritized and blood glucose sampling minimized whenever possible, there is enough signal to reach a conclusion for this patient.
Participants
The participant was a toy poodle named Toto, weighing approximately 5 lb. He was diagnosed with Type 1 diabetes at around 12 years of age (he was a rescue dog, approximately 2 years old at the time of rescue, so his age is not known precisely). The diabetes was triggered by an overdose of prednisone27, which first caused Cushing’s Syndrome28, then diabetes after prednisone was discontinued without weaning. Toto’s diabetes went untreated for 3 months, during which time he developed excessive thirst, polyuria, and cataracts. The diagnosis was made by the veterinarian based on a single blood glucose value above 600 mg/dL.
Therapeutic intervention
Toto was placed on Humulin N U-100 NPH injectable insulin twice daily post-meals. Toto was fed at exact 12-hour intervals (7 am and 7 pm). The adjustable parameters of the treatment were:
| Variable | N | Mean | SD | Min | P25 | Median | P75 | Max |
| Blood glucose (mg/dL) | 442 | 182.04 | 100.29 | 22.0 | 99.0 | 168.0 | 247.0 | 550.0 |
| Weight (oz) | 25 | 89.38 | 6.6 | 80.8 | 81.28 | 89.5 | 92.5 | 103.0 |
| Insulin dose (units) | 132 | 0.94 | 0.27 | 0.3 | 1.0 | 1.0 | 1.0 | 1.5 |
| Food (kcal) | 147 | 83.54 | 30.15 | 14.0 | 57.29 | 101.05 | 101.05 | 173.0 |
| Period timespan (days) | 10 | 12.1 | 18.18 | 1.0 | 1.0 | 2.0 | 16.75 | 51.0 |
| Glucose readings / Period | 10 | 44.2 | 61.42 | 1.0 | 6.25 | 14.5 | 63.25 | 183.0 |
| Injection-feeding time (min) | 55 | 57.36 | 30.4 | 0.0 | 30.0 | 64.0 | 76.0 | 126.0 |
- F – type (kibble, freeze-dried protein) and amount of food (kilocalories)
- T – time between feeding and the insulin shot (minutes)
- I – insulin amount (units)
The starting parameters were 100 kcal / feeding of kibble and 1 U of insulin administered immediately after eating. The veterinarian instructed the owners to bring the dog back after 1 week for a full-day glucose curve at the clinic to adjust treatment parameters as needed.
Additional instructions were to inject 0.5 U if Toto ate less than half of his food, and to keep Karo HFCS on hand if Toto exhibited hypoglycemia symptoms in case of insulin overdose.
Concerned about the dog’s health, the owners also purchased a canine blood glucose monitor to verify the effectiveness of the home treatment regimen and to propose further adjustments in consultation with Toto’s veterinarian.
Data Collection
The pet’s owners collected clinical data as the treatment progressed over 2.5 years. Toto’s weight, food quantity, feeding time, insulin amount, and periodic blood glucose samples or full blood-glucose curves. Additionally, the owners logged changes to the food type, insulin preparation procedure, and rationale behind any adjustments to treatment parameters.
10 distinct collection periods (Table 1) were identified, yielding a total of 442 blood glucose samples. 3 of the 10 collection periods were intensive (51 days, 21 days, and 37 consecutive days of collection), and the remainder were for spot checking only. Only data from intensive periods include full glucose curves, as caregivers were actively optimizing treatment parameters. Between collection periods, the treatment regimen was deemed satisfactory, and no data were collected.
Toto’s weight was relatively stable throughout the treatment (less than 0.25 oz/week), except for when the food was changed from kibble to freeze-dried after period 8, when the weight decreased from 103 oz to 92.5 oz in 66 days. To address this, Toto’s caregivers increased the amount of food by 33% in period 10, as well as the insulin dose from 0.33 U to 0.45 U to match.
Variables and Measurements
Blood glucose was measured by ear pricking using an AlphaTrak 3 blood glucose monitor, calibrated for dogs according to the manufacturer’s instructions.
Insulin was injected using U-100 0.3 ml syringes with 0.5-unit graduations. The caregivers had difficulty measuring insulin with precision, as even a slight variation in drawing the syringe piston could result in ±10% variability in insulin quantity at a 1 U dose, or even larger at lower doses. As a result, the owners eventually opted to dilute the insulin. As the treatment progressed, insulin was first undiluted, then diluted in concentrations 1:2, 1:4, and eventually 1:9 (i.e., diluted by a factor of 10). Diluted insulin was prepared beforehand in bulk and refrigerated for up to 28 days, enabling delivery of small quantities such as 0.33 U.
Food kilocalories were measured by weighing the food and converting to kilocalories using the nutritional information printed on the box. Toto ate Orijen Regional Red kibble (19% carbohydrate) in periods 1-7 and was switched to Orijen Tundra Freeze-Dried Medallions in periods 8-10, which have a lower glycemic index (9% carbohydrate).
The weight was measured with a scale with 0.1 lb accuracy.
Procedure
Once Toto was started on insulin treatment, the goal was to adjust the treatment parameters (amount and type of food, timing between feeding and insulin, and insulin units injected) to achieve optimal results. The treatment was deemed to be satisfactory if the following goals were met, in order of priority, as per guidelines9:
- Hypoglycemic readings (glucose < 80 mg/dL) were avoided as much as possible. Hypoglycemia due to insulin overdose is a medical emergency that can result in sudden death.
- The fraction of the day with 300 mg/dL was minimized.
- The average of a blood glucose curve, given the above constraints, was minimized, ideally to below 250 mg/dL. Hyperglycemia eventually leads to chronic conditions and shortened life span, but it is not a medical emergency.
- Weight was maintained.
Full blood glucose curves were collected, recording the feeding time, insulin injection time, and several blood glucose readings at regular intervals after the injection to identify the nadir (the time at which blood glucose is lowest after the insulin injection) and to verify whether the treatment goals are met. If the nadir was found to be below 60 mg/dL (clear hypoglycemia), or frequently below 80 mg/dL (risk of hypoglycemia), insulin was reduced to the next available increment.
The caregivers noted that, even with reduced insulin doses, hypoglycemic events persisted. Glucose curves showed that the food did not affect blood glucose in the first hour, whereas Humulin N insulin acted almost immediately, as observed in other dogs, even though Humulin N is formulated to be intermediate-acting in humans24. Reducing the insulin dose alone was presumed to have still resulted in hypoglycemia due to the mismatch between the food and insulin glucose profiles. The caregivers settled on delaying the insulin dose by 1 hour after the meal, which addressed this mismatch without significantly increasing the risk of hyperglycemia, a much lower concern.
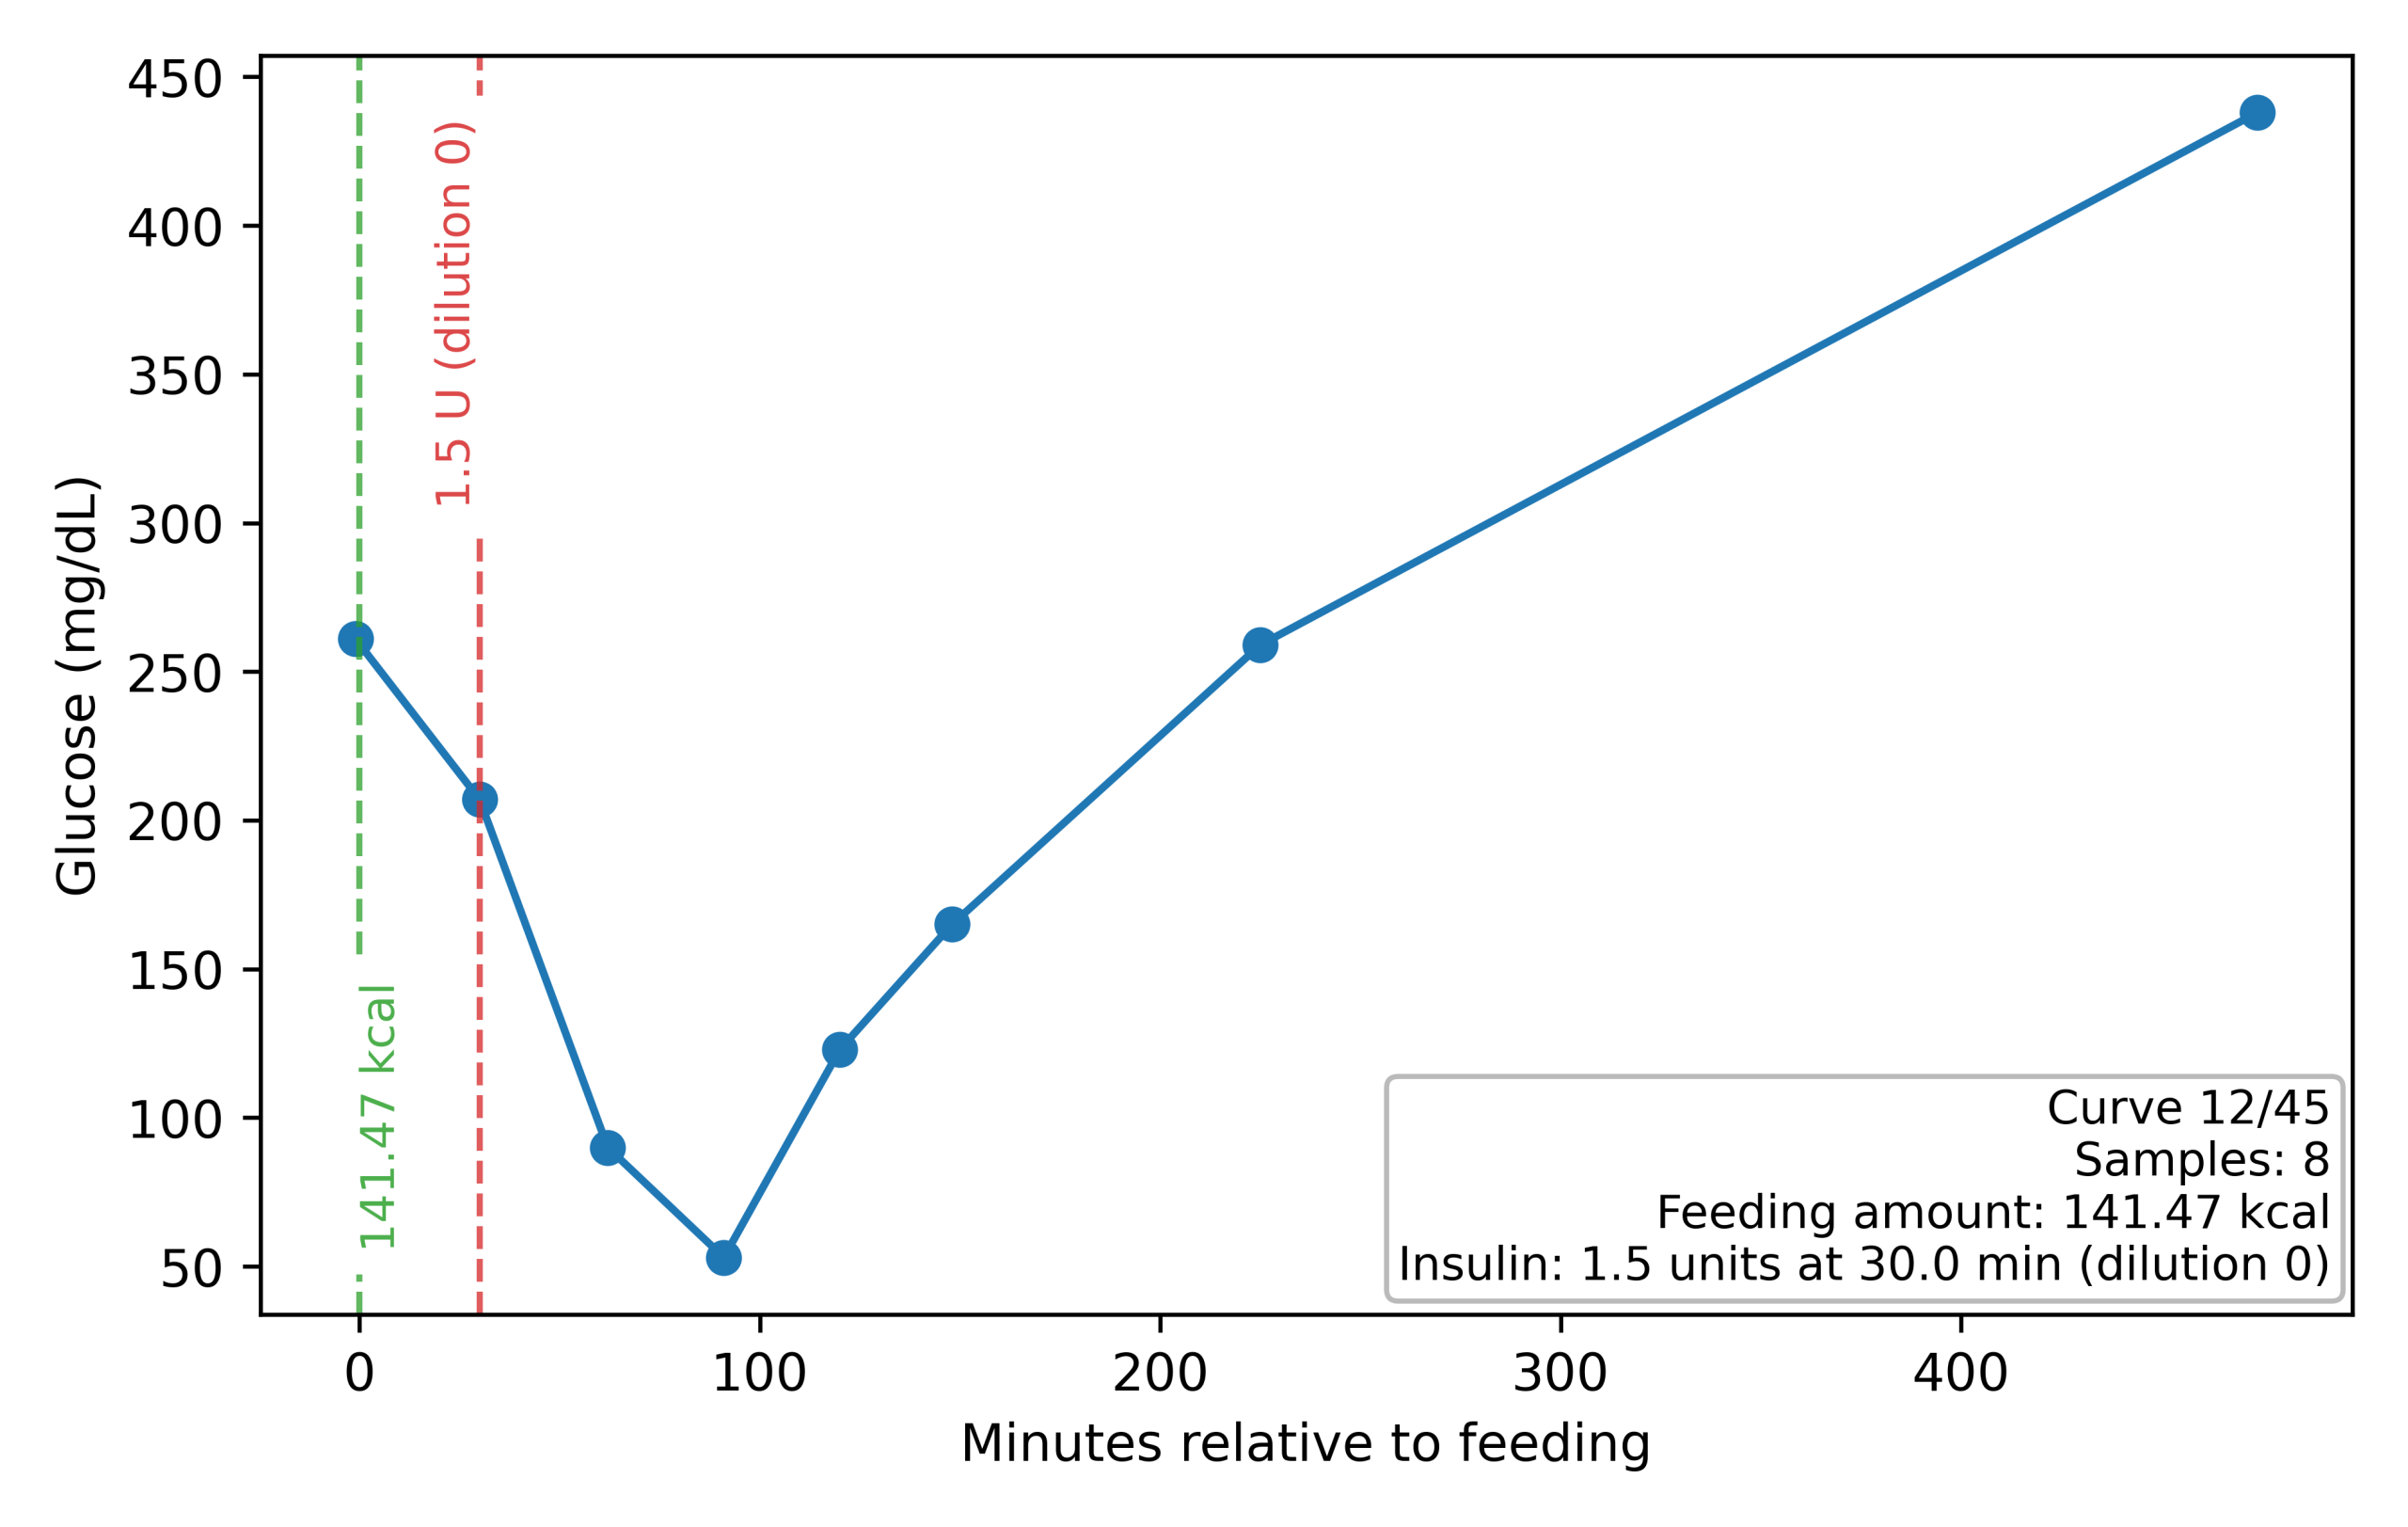
High readings above 300 mg/dL were also recorded, but the insulin dose was not increased unless a full blood glucose curve was taken. High readings can result from the Somogyi effect25, in which hypoglycemia causes hyperglycemia, and the correct action in that case is to lower the insulin dose, not raise it. For example, in Figure 1 the maximum is above 400 mg/dL, but the nadir is below 60 mg/dL.
As the treatment progressed, the following major treatment adjustments were made:
- Increased time between feeding and insulin from 0 to 60 minutes in period 1
– Administering insulin right after feeding seemed to produce hypoglycemic events, and a decision was made to inject 1 hour after feeding. This report tests this hypothesis and checks its statistical validity. - Switched from kibble to freeze-dried food in period 8, and decreased insulin from 1 to 0.33.
– Changing the food type is one of the levers recommended in the treatment guidelines9, and the caregivers found that Toto required a lower insulin dose under this new regimen. Lowering the insulin dose was only possible because it was diluted by a factor of 10.
– This report presents statistical analysis demonstrating that Toto’s blood glucose was more optimal under the new regimen, supporting the conclusion that diluting insulin was beneficial. - Increased food by 33% and insulin to 0.45 units in period 10 due to low weight.
Insulin Dilution
Since Toto was started on an insulin dose of 1 U and the syringes had graduations of 0.5 U, the caregivers found it difficult to make small dose adjustments. With the 0.3 mL syringe, it would only have been possible to increase or decrease the dose by 50% (to 0.5 U or 1.5 U). Given that at 1 U the patient had some hypoglycemic readings, the only choice was 0.5 U. With no other adjustment possible, this would have left other treatment parameters suboptimal (such as the average blood glucose).
Instead, the caregivers chose to dilute the insulin to achieve finer control over incremental dosing, following the procedure recommended by Eli Lilly (the manufacturer of the insulin), using Eli Lilly Humulin diluent, and sterile vials. To dilute by a factor of 10, the caregivers used a larger 1 mL syringe and drew the maximum capacity of Humulin N 1 time and the diluent 9 times, multiple times, until a sufficient quantity was obtained. The diluted vial was stored in the fridge for up to 28 days, as recommended by Eli Lilly29.
While the caregivers found dilution absolutely necessary to administer the treatment, it is not without risks15. Most insulins do not have a matching diluent, and diluting with saline solution would significantly shorten the shelf life and increase the risk of infection if stored. And the dilution procedure itself requires many steps with as many opportunities for mistakes. For example, if the amount drawn is small (relative to the syringe size), the dead space can introduce significant errors, as it is completely flushed out in all but the last syringe draw. Keeping these risks in mind, dilution can still significantly decrease the error in the amount drawn, as demonstrated in the Insulin Syringe Model above.
Data Analysis
The caregivers made two decisions that this article is putting forward for the diabetes treatment of small-breed dogs: introducing a delay between feeding and the insulin shot, and diluting insulin to enable more precise dosing. This article analyzes the collected clinical data to determine whether the two recommendations were substantiated. Specifically, the following hypotheses are tested:
- When a delay was introduced between feeding and insulin injection, hypoglycemia was less likely to occur.
- The patient’s diabetes was better controlled with feeding lower-glycemic index food and sub-1 U insulin dose, which required dilution for administration. Specifically, the test is whether the average daily glucose was lower in this treatment regimen.
Hypoglycemia and the Time Between Feeding and the Insulin Shot
Hypoglycemia due to insulin overdose8 can starve the brain and cause a medical emergency, and a primary goal in optimizing insulin therapy is to minimize such risk. Formally, a blood glucose reading < 60 mg/dL is hypoglycemic, but because a blood glucose curve with hourly readings may miss the nadir, the guidelines9 call for lowering insulin for any reading < 80 mg/dL.
In Period 1, the caregivers found that the hypoglycemic readings occurred within 1 hour of feeding. Frequent sampling after feeding showed that glucose did not increase in the first hour, and that the insulin shot acted immediately (within 30 minutes). This is consistent with the Blood Glucose Model discussed in the Theoretical Framework section for some dogs on NPH insulin. Because hypoglycemia is a life-threatening condition, the caregivers decided to change the protocol and delay the insulin injection to 1 hour after feeding. This is not a standard recommendation in the literature, but it made sense to the caregivers that injecting insulin that acts quickly when food has not yet raised blood glucose may result in hypoglycemia.
Thus, the dataset contains instances in Period 1 in which the insulin shot is administered immediately after the feeding, and instances thereafter with a 1-hour delay after feeding. In data processing, a 30-minute cutoff accurately discriminated between the two periods.
To verify the hypothesis, feedings with correctly recorded feeding and insulin times that were non-hypoglycemic (blood glucose > 80 mg/dL) at feeding and had at least one glucose reading between 30 min and 300 min after feeding were selected. There were 66 feedings that satisfied this constraint. The feedings were labeled same time if the shot was within 30 minutes of the feeding (median time 14 minutes), and with delay if the shot was more than 30 minutes after the feeding (median time 65 minutes). 14 feedings were hypoglycemic (the minimum glucose reading after feeding was < 60 mg/dL), whereas 22 feedings were likely-hypoglycemic (< 80 mg/dL).
The likely-hypoglycemic rule of < 80 mg/dL is more appropriate for flagging problematic curves, given that glucose was sampled at 1-2 hour intervals and may have missed the true nadir. For this very reason, the guidelines9 recommend the threshold < 80 mg/dL as a marker of likely hypoglycemia. Initially, a more complex method was used to estimate whether the true nadir was likely < 60 mg/dL, interpolating a probable curve between readings. That method agreed with the simple < 80 mg/dL rule in 64 out of 66 feedings, and was thus dropped.
Furthermore, in the with delay group the last periods 8-10 were separated out because the insulin dose and food type were very different in those periods.
Did Low Insulin Dosage Enable Better Blood Glucose Control?
In period 8, Toto was switched from kibble to freeze-dried food, which has a lower glycemic index and thus requires a much lower insulin dose. This was only possible because insulin was diluted by a factor of 10, allowing a starting dose of 0.33 U, which would otherwise not have been measurable with a 0.3 mL U-100 syringe. The food amount and insulin dose were increased in period 10 to compensate for a decrease in body weight, ultimately settling at 33% more food and 0.45 U of insulin.
To strengthen the argument that such low insulin doses were useful for optimal treatment, the collected data were analyzed to provide statistical evidence that the blood glucose curves were more optimal under the new food/insulin regimen.
For this test, blood glucose curves were selected and grouped into high-insulin and low-insulin regimens. The high-insulin regimen curves were from Periods 1-7, during which insulin was above 0.85 U, and Toto was fed kibble. The low-insulin regimen curves were from Periods 8-10, during which insulin was 0.33-0.5 U, and Toto was fed freeze-dried food. Curves from Period 1 in which the feeding and insulin shot were administered at the same time were excluded, as those were at higher risk of hypoglycemia, and none of them were low-insulin. Furthermore, only blood glucose curves with at least two readings were selected, with one within 30 minutes of the insulin shot and one 120 minutes or more after. The final dataset consisted of 35 blood glucose curves, 27 in the high-insulin regimen, and 8 in the low-insulin regimen.
To assess treatment effectiveness, the blood glucose curves were compared on the [0, 3]-hour time interval after the insulin shot. A longer-interval comparison was not possible due to data sparsity: only a few blood glucose curves would have had readings beyond 3 hours. Each blood glucose curve was linearly interpolated over the [0, 3]-hour interval between consecutive readings, with the lines extending to 0h and 3h if no other readings were known outside the interval. After linear interpolation, the average blood glucose for each curve was computed as the area under the curve over time. The results are discussed in detail in the next section.
All statistical analyses were performed using Python 3.9.6 with SciPy 1.13.0 and NumPy 1.26.4.
Ethical Considerations
The pet’s owners conducted all data collection and adjusted treatment parameters to achieve the best clinical outcome for Toto, with no other scientific purpose. The data were collected in accordance with the principle of minimizing interventions—blood samples were obtained only when necessary to improve Toto’s treatment and to inform expected clinical outcomes. Treatment parameters were adjusted only if deemed in Toto‘s best interest. The data was analyzed scientifically only after the fact, to share with the community any findings that could save other dogs. The author of this article is one of the pet’s owners who actively collected data and treated Toto, and he has full rights to use this data.
Results
Toto’s caregivers recorded 442 glucose readings over 2.5 years, which can be separated into 10 periods. 3 were intensive, capturing relatively complete glucose curves for optimizing treatment parameters (51, 21, and 37 consecutive days), while the other periods only recorded glucose readings sparingly, to verify that the treatment is still working (Table 1). Of the glucose readings, 37 were hypoglycemic (< 60 mg/dL), and 60 were hyperglycemic (> 300 mg/dL).
Hypoglycemia and the Time Between Feeding and the Insulin Shot
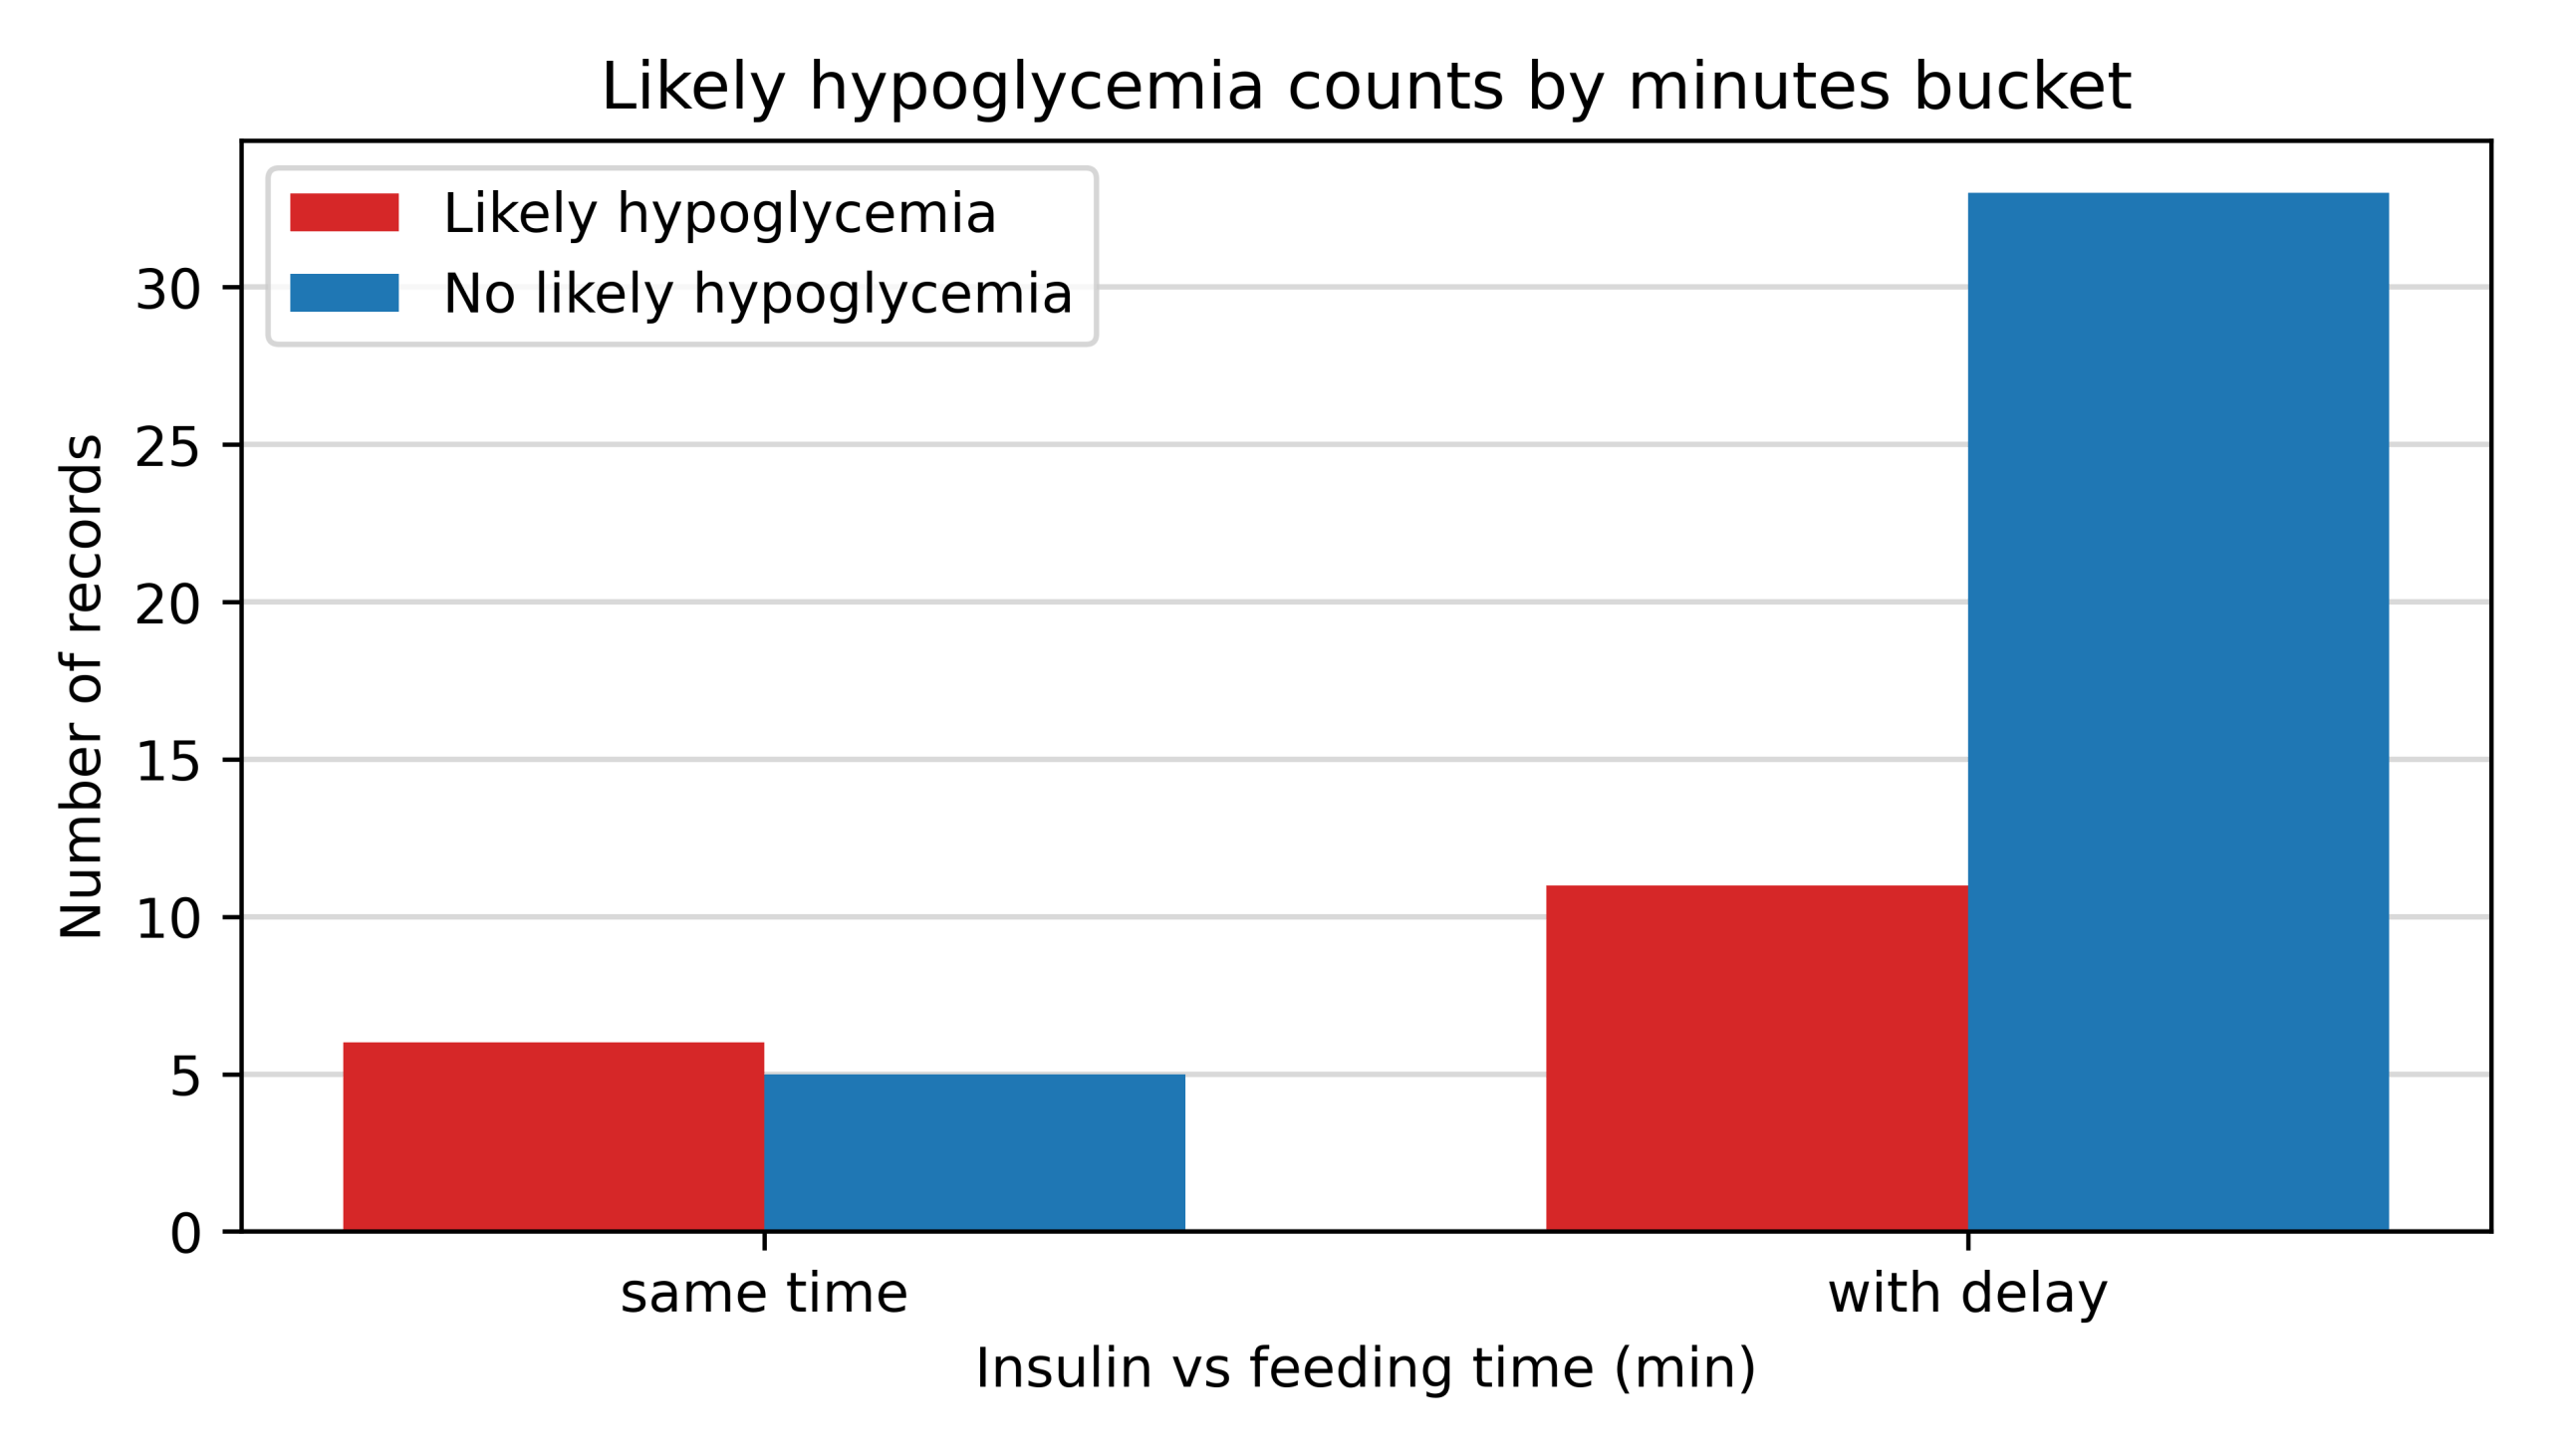
The data included 66 insulin injection instances with sufficient metadata and blood glucose readings, labeled as likely hypoglycemic or not-likely hypoglycemic, as described in the Data Analysis section. The data was separated into three groups: same time, with delay, and with delay (low insulin), depending on whether the insulin was injected at the same time as the food, or with a 1-hour delay. The low insulin group is shown for reference, but it is not comparable because the food type and insulin dose were very different. There were 11 same time instances, 44 with delay, and 11 with delay (low insulin). The three groups had 6 (55%), 11 (25%), and 5 (45%) likely hypoglycemic readings, respectively.
Does the data support that delaying the insulin shot by 1 hour after the feeding was a reasonable technique to reduce the risk of hypoglycemia? To answer this question, one needs to compare the likely-hypoglycemic rate in the same time group with the rate in the with delay group, keeping in mind that the samples were not independent (they are drawn from the same patient), and that the 1-hour delay was introduced because of the observations in the same time group. Another challenge is that the number of samples within the same time group was low because caregivers did not want to take life-threatening risks, and once the protocol was changed, there was no further exploration of the delay. The with delay (low insulin) group had to be excluded from this analysis because the treatment protocol underwent significant changes, and the insulin dose was repeatedly adjusted to the highest possible dose that did not induce hypoglycemia.
The data summarized in Figure 2 show that the likely-hypoglycemic rate dropped from 55% to 25% with the introduction of the delay, a large drop. To give a sense of how significant this difference is, given the small number of samples, one can use a Bayesian statistics approach30. Assuming that the hypoglycemic outcome can be modeled as a Bernoulli trial with a weak non-informative prior , the posterior likelihood of hypoglycemia would be distributed as in the same time group, and in the with delay group. Then the probability that the likely hypoglycemic rate is lower in the with delay group is 96.8% (computed by drawing Monte Carlo samples from the two distributions in Python from the built-in random.betavariate). This shows that the number of samples is sufficient to assert that the 25% hypoglycemic rate in the with delay group was lower than the 55% rate in the same time group, noting that no claim of causality is made.
High-insulin Versus Low-insulin Treatment Regimens
As described in the Data Analysis section, 35 blood glucose curves were extracted, of which 27 belonged to the high-insulin treatment regimen, and 8 belonged to the low-insulin one. The curves were compared in the [0, 3]-hour post-injection interval by computing average blood glucose using linear interpolation between consecutive readings. Table 2 shows the average blood glucose median of the curves for each treatment regimen over the entire [0, 3]-hour period, as well as in the 1st, 2nd, and 3rd hour subintervals. The 95% confidence intervals for the medians were computed using the bootstrap method (using the scipy.stats.bootstrap Python function). A p-value for the difference being greater than 0 was obtained using a nonparametric permutation test31 using the scipy.stats.permutation_test Python library function.
| Comparison period (hours since insulin shot) | ||||
| 0-3 h | 0-1 h | 1-2 h | 2-3 h | |
| high-insulin | 157 (142, 180) | 187 (148, 209) | 122 (109, 169) | 162 (123, 203) |
| low-insulin | 132 (75, 223) | 222 (128, 267) | 122 (47, 218) | 55 (41, 166) |
| Difference | 25 | -35 | 1 | 107 |
| p-value | 0.32 | 0.27 | 0.98 | 0.002 |
According to this analysis, the average blood glucose was similar in the 1st and 2nd hours post-injection, but meaningfully different in the 3rd hour, when it changed from a median of 162 mg/dL in the high-insulin regimen to 55 mg/dL in the low-insulin regimen, with a p-value of the difference test of 0.002. Unfortunately, data after the 3rd hour is too sparse for a meaningful comparison of the average blood glucose until the next injection (12th hour). That said, the fact that blood glucose is meaningfully lower at the 3rd hour is a strong indicator that the overall daily average blood glucose is also lower. This is because the 3rd hour is already post-nadir for this patient and this insulin type, and blood glucose typically increases post-nadir gradually until the next feeding and injection.
While the data are sparse due to careful curation to avoid bias, there is sufficient evidence to at least suggest that the ability to treat with low insulin doses enables more optimal treatment regimens.
Discussion
Key Findings
This paper contributes to understanding the challenges in treating small-breed dogs by presenting one case of a 5-lb toy poodle that was successfully stabilized and maintained for 2.5 years using insulin dilution and a novel technique that delays NPH insulin injection by 1 hour after feeding.
The caregivers avoided common insulin dilution pitfalls: they matched the insulin with the official diluent sourced from the manufacturer, which does not change the expiration date, and maintains sterility; used sterile vials (also sourced from the manufacturer); used the largest available syringes in mixing drawn to the maximum position; and used a careful counting mechanism to avoid process errors. With all these precautions, dilution could be used safely, addressing the main concerns raised in the literature.
This article also introduces a theoretical model of dilution consistent with the known error in delivered insulin10 to show that dilution can reduce the error in delivering 0.5 U from (0.39, 1.05) U to (0.48, 0.55) U, a difference between impossible to treat and practical.
To demonstrate the utility of insulin dilution for this patient, the article compares two treatment regimens: one with kibble and ~1 U/dose, and a later one with a low-glycemic-index food and ~0.5 U/dose. The second regimen was only feasible with insulin dilution, as injecting and adjusting a ~0.5 U dose in fine increments would not be feasible with undiluted U-100 insulin. The article shows that the lower-insulin treatment regimen reduced blood glucose from a median of 162 mg/dL to 55 mg/dL in the third hour after the injection (based on 27 blood glucose curves from the first treatment regimen and 8 from the second), a significant difference (p = 0.002). This is a strong indicator that the low-glycemic-index/low-insulin regimen was likely associated with lower average daily blood glucose, although a definitive conclusion is not possible because the curves were tracked and compared for only 3 hours. Either way, without insulin dilution, caregivers would not have been able to experiment with feeding the dog low-glycemic-index food; therefore, dilution was useful.
The article also proposes addressing the difficulty of treating small-breed dogs by delaying the insulin injection after meals by up to 1 hour. The theoretical justification for introducing such a delay is based on well-understood separate effects of food and insulin shots on blood glucose, as described in the Introduction. The effect of food on blood glucose may be delayed, whereas insulin can act more rapidly. This presents an opportunity to match these curves to reduce the risk of hypoglycemia, not only by adjusting the insulin type (fast, intermediate, long-acting, or combinations) but also by adjusting the timing between feeding and insulin administration. The specific timing is, of course, highly dependent on the food, insulin type, and patient, and should be experimented with on a patient-by-patient basis. This additional tool, not reported in the literature, is particularly relevant for small-breed dogs, for whom it may not be feasible to further reduce the insulin dose to mitigate the risk of hypoglycemia.
In the case of Toto, the caregivers determined that delaying the insulin injection by 1 hour after feeding reduced the risk of hypoglycemia because NPH insulin appeared to act quickly, whereas food’s effect on blood glucose took at least 30 minutes to manifest. To demonstrate this, the article analyzed recorded blood glucose readings and found that the risk of hypoglycemia decreased from 55% to 25% after introducing a 1-hour delay. The decrease was significant (96.8% probability), despite the small number of instances in the same time group (11 curves), owing to caregivers’ discontinuation of experimentation to avoid hypoglycemia.
Implications and Significance
Diabetes in dogs is a common chronic disease that is treated via twice-daily insulin therapy, requiring a significant commitment from caregivers to administer it correctly. Once the immediate risks of ketoacidosis and hypoglycemia are under control, the focus is on minimizing excessive blood glucose, which, if suboptimal, eventually leads to systemic complications and poor quality of life. Small-breed dogs not only have a higher prevalence but are also especially difficult to treat because the medications and delivery equipment are designed for humans or larger animals. The AAHA treatment guidelines9 acknowledge the issue but do not offer easy solutions, aside from potentially changing the food or insulin type; they do not recommend dilution.
The need to administer small insulin doses in small dogs is well documented, as evidenced by non-standard approaches reported in the literature, such as drop-counting or aligning the syringe with a micrometric printed rule12. Given that syringes are highly inaccurate at low doses11, these methods are likely futile. Dilution is not officially endorsed but is sometimes used off-label in dogs13 and is common in pediatric settings. The main challenge in dilution is controlling process risks, which can lead to a concentration that is too high, loss of potency, or even infection.
Without the ability to deliver low doses of insulin, veterinarians and caregivers of small-breed dogs are bound to settle on addressing only the primary risks of the disease – ketoacidosis and hypoglycemia – compromising on the long-term consequences of elevated average blood glucose.
Recommendations
The findings of this article, although based on a single patient, indicate that the treatment flexibility afforded by insulin dilution may be beneficial when the procedural risks associated with it are addressed. This calls for re-evaluating the guidelines for treating small dogs and, after further testing, introducing dilution as an option. In addition, experimenting with delaying the insulin dose after feeding as part of the treatment protocol can provide caregivers with an additional strategy to reduce the risk of hypoglycemia, thereby permitting easier-to-administer larger doses.
To modify the guidelines on dilution, a study could measure the error between the delivered and intended insulin quantity after dilution in a home setting, similar to studies that quantify such errors without dilution11. The suggestion is that, at low doses, syringe errors predominate over potential errors arising from the insulin dilution process itself; as a result, it is beneficial to dilute. Such research on delivered vs intended amount would provide a definitive answer. In addition, dilution and its associated risks could be completely avoided if pharmaceutical companies released U-10 insulin for veterinary use (rather than U-40, the least potent available).
The recommendation to delay the insulin dose relative to feeding should be tested in a larger cohort of patients using different insulin types. It is likely appropriate for insulins such as NPH, which, although intermediate-acting in humans, have been found to act quickly in some dogs24. One of the challenges with implementing such a recommendation is that it adds burden to caregivers, who may not have time to wait after feeding, twice a day, for years in a row, or may forget about the delay and reintroduce the risk of hypoglycemia; for this reason, changing the insulin type to a slower-acting one may be more appropriate if available.
Limitations
The obvious limitation of this study is that it was based on a single patient. While it was possible to demonstrate that the recommendations were reasonable for this patient, based on data collected over many years, other dogs may respond very differently. Even for this patient, the data were collected for clinical, not research, purposes, and required significant processing to enhance the signal and reduce bias. For example, the comparison of glucose curves between the high-insulin and low-insulin treatment regimens was possible only for the first 3 hours post-injection, raising uncertainty about the full-day glucose averages. In addition, both analyses were before/after, not randomized controlled experiments; the results could have been influenced by other factors that changed between periods, such as the dog’s aging or deterioration. As such, the conclusions from the data analyses are not definitive, but merely indicate that dilution and insulin injection delay may be beneficial in small dogs and warrant further controlled investigation.
In conclusion, caring for a diabetic dog entails many difficulties and compromises, for which current best practices offer suboptimal solutions. The protocol is particularly challenging for small-breed dogs, as insulin types and delivery mechanisms have been primarily adapted from humans to larger dogs. Practical techniques to bridge this gap can make a significant difference for the large number of small dogs treated at home and for their caregivers, and building a scientific and clinical foundation for these techniques is a worthwhile goal. This article takes a step in this direction by placing greater emphasis on dilution and proposing that delaying the insulin injection after feeding may be beneficial. However, further research is needed to elevate these techniques to best-practice recommendations.
Acknowledgments
Treating Toto was a significant team effort, and I would like to thank my parents for helping with veterinarian visits, securing treatment supplies, and brainstorming treatment options. I would also like to thank our pet sitter, who administered the treatment without interruption during brief vacations.
References
- JAVMA news. Journal of the American Veterinary Medical Association. Vol. 238, pg. 1520–1549, 2011, https://doi.org/10.2460/javma.238.12.1520. [↩]
- L. Guptill, L. Glickman, N. Glickman. Time trends and risk factors for diabetes mellitus in dogs: analysis of veterinary medical data base records (1970–1999). The Veterinary Journal. Vol. 165, pg. 240–247, 2003, https://doi.org/10.1016/S1090-0233(02)00242-3. [↩]
- M. Mattin, D. O’Neill, D. Church, P. D. McGreevy, P. C. Thomson, D. Brodbelt. An epidemiological study of diabetes mellitus in dogs attending first opinion practice in the UK. Veterinary Record. Vol. 174, pg. 349–349, 2014, https://doi.org/10.1136/vr.101950. [↩] [↩] [↩]
- T. Fall, H. H. Hamlin, Å. Hedhammar, O. Kämpe, A. Egenvall. Diabetes mellitus in a population of 180,000 insured dogs: incidence, survival, and breed distribution. Journal of Veterinary Internal Medicine. Vol. 21, pg. 1209–1216, 2007, https://doi.org/10.1111/j.1939-1676.2007.tb01940.x. [↩] [↩] [↩] [↩]
- R. S. Hess, P. H. Kass, C. R. Ward. Breed distribution of dogs with diabetes mellitus admitted to a tertiary care facility. Journal of the American Veterinary Medical Association. Vol. 216, pg. 1414–1417, 2000, https://doi.org/10.2460/javma.2000.216.1414. [↩]
- R. S. Hess, H. M. Saunders, T. J. Van Winkle, C. R. Ward. Concurrent disorders in dogs with diabetes mellitus: 221 cases (1993–1998). Journal of the American Veterinary Medical Association. Vol. 217, pg. 1166–1173, 2000, https://doi.org/10.2460/javma.2000.217.1166. [↩]
- D. Z. Hume, K. J. Drobatz, R. S. Hess. Outcome of dogs with diabetic ketoacidosis: 127 dogs (1993–2003). Journal of Veterinary Internal Medicine. Vol. 20, pg. 547–555, 2006, https://doi.org/10.1111/j.1939-1676.2006.tb02895.x. [↩]
- O. Idowu, K. Heading. Hypoglycemia in dogs: causes, management, and diagnosis. The Canadian Veterinary Journal = La Revue Veterinaire Canadienne. Vol. 59, pg. 642–649, 2018, https://pubmed.ncbi.nlm.nih.gov/29910479. [↩] [↩]
- E. Behrend, A. Holford, P. Lathan, R. Rucinsky, R. Schulman. 2018 AAHA diabetes management guidelines for dogs and cats. Journal of the American Animal Hospital Association. Vol. 54, pg. 1–21, 2018, https://doi.org/10.5326/JAAHA-MS-6822. [↩] [↩] [↩] [↩] [↩] [↩] [↩] [↩] [↩]
- ISO 8537. Sterile single-use syringes, with or without needle, for insulin. 2016, https://www.iso.org/standard/60510.html. [↩] [↩] [↩]
- S. J. Casella, M. K. Mongilio, L. P. Plotnick, M. P. Hesterberg, C. A. Long. Accuracy and precision of low-dose insulin administration. Pediatrics. Vol. 91, pg. 1155–1157, 1993, https://doi.org/10.1542/peds.91.6.1155. [↩] [↩] [↩] [↩]
- K. Roomp, J. S. Rand. Management of diabetic cats with long-acting insulin. Veterinary Clinics of North America: Small Animal Practice. Vol. 43, pg. 251–266, 2013, https://doi.org/10.1016/j.cvsm.2012.12.005. [↩] [↩] [↩]
- A. Thompson, P. Lathan, L. Fleeman. Update on insulin treatment for dogs and cats: insulin dosing pens and more. Veterinary Medicine (Auckland, N.Z.). Vol. 6, pg. 129–142, 2015, https://doi.org/10.2147/VMRR.S39984. [↩] [↩] [↩]
- K. Keith, D. Nicholson, D. Rogers. Accuracy and precision of low-dose insulin administration using syringes, pen injectors, and a pump. Clinical Pediatrics. Vol. 43, pg. 69–74, 2004, https://doi.org/10.1177/000992280404300109. [↩]
- R. Richey. The manipulation of dosage forms of medications, with the aim of achieving the required dose, for administration to children. 2014, https://doi.org/10.17638/00015475. [↩] [↩] [↩]
- L. P. Ainscough, J. L. Ford, C. W. Morecroft, M. Peak, M. A. Turner, A. J. Nunn, M. Roberts. Accuracy of intravenous and enteral preparations involving small volumes for paediatric use: a review. European Journal of Hospital Pharmacy. Vol. 25, pg. 66–71, 2018, https://doi.org/10.1136/ejhpharm-2016-001117. [↩] [↩]
- L. C. Holste, R. W. Nelson, E. C. Feldman, G. D. Bottoms. Effect of dry, soft moist, and canned dog foods on postprandial blood glucose and insulin concentrations in healthy dogs. American Journal of Veterinary Research. Vol. 50, pg. 984–989, 1989, https://doi.org/10.2460/ajvr.1989.50.06.984. [↩] [↩]
- R. W. Nelson, C. A. Duesberg, S. L. Ford, E. C. Feldman, D. J. Davenport, C. Kiernan, L. Neal. Effect of dietary insoluble fiber on control of glycemia in dogs with naturally acquired diabetes mellitus. Journal of the American Veterinary Medical Association. Vol. 212, pg. 380–386, 1998, https://pubmed.ncbi.nlm.nih.gov/9470048. [↩]
- L. A. Goeders, L. A. Esposito, M. E. Peterson. Absorption kinetics of regular and isophane (NPH) insulin in the normal dog. Domestic Animal Endocrinology. Vol. 4, pg. 43–50, 1987, https://doi.org/10.1016/0739-7240(87)90037-3. [↩]
- R. N. Bergman. Origins and history of the minimal model of glucose regulation. Frontiers in Endocrinology. Vol. 11, pg. 583016, 2021, https://doi.org/10.3389/fendo.2020.583016. [↩]
- D. T. Finegood, G. Pacini, R. N. Bergman. The insulin sensitivity index: correlation in dogs between values determined from the intravenous glucose tolerance test and the euglycemic glucose clamp. Diabetes. Vol. 33, pg. 362–368, 1984, https://doi.org/10.2337/diab.33.4.362. [↩]
- R. Gillis, C. C. Palerm, H. Zisser, L. Jovanovic, D. E. Seborg, F. J. Doyle. Glucose estimation and prediction through meal responses using ambulatory subject data for advisory mode model predictive control. Journal of Diabetes Science and Technology. Vol. 1, pg. 825–833, 2007, https://doi.org/10.1177/193229680700100605. [↩]
- J. Wong, J. G. Chase, C. E. Hann, G. M. Shaw, T. F. Lotz, J. Lin, A. J. Le Compte. A subcutaneous insulin pharmacokinetic model for computer simulation in a diabetes decision support role: model structure and parameter identification. Journal of Diabetes Science and Technology. Vol. 2, pg. 658–671, 2008, https://doi.org/10.1177/193229680800200417. [↩]
- C. A. Palm, R. C. Boston, K. R. Refsal, R. S. Hess. An investigation of the action of neutral protamine hagedorn human analogue insulin in dogs with naturally occurring diabetes mellitus. Journal of Veterinary Internal Medicine. Vol. 23, pg. 50–55, 2009, https://doi.org/10.1111/j.1939-1676.2008.0249.x. [↩] [↩] [↩]
- A. K. Cook. Monitoring methods for dogs and cats with diabetes mellitus. Journal of Diabetes Science and Technology. Vol. 6, pg. 491–495, 2012, https://doi.org/10.1177/193229681200600302. [↩] [↩]
- M. A. Jordan, D. Choksi, K. Lombard, L. R. Patton. Development of guidelines for accurate measurement of small volume parenteral products using syringes. Hospital Pharmacy. Vol. 56, pg. 165–171, 2021, https://doi.org/10.1177/0018578719873869. [↩]
- A. M. Heeley, D. C. Brodbelt, D. G. O’Neill, D. B. Church, L. J. Davison. Assessment of glucocorticoid and antibiotic exposure as risk factors for diabetes mellitus in selected dog breeds attending UK primary‐care clinics. Veterinary Record. Vol. 192, pg. e2785, 2023, https://doi.org/10.1002/vetr.2785. [↩]
- H. Huang, H. Yang, S. Liang, Y. Lien, K. Chen. Iatrogenic hyperadrenocorticism in 28 dogs. Journal of the American Animal Hospital Association. Vol. 35, pg. 200–207, 1999, https://doi.org/10.5326/15473317-35-3-200. [↩]
- Eli Lilly and Company. Humulin R (insulin human) injection, for subcutaneous or intravenous use: prescribing information. https://pi.lilly.com/us/humulin-r-pi.pdf, 2023. [↩]
- A. Gelman, J. B. Carlin, H. S. Stern, D. B. Dunson, A. Vehtari, D. B. Rubin. Bayesian data analysis. CRC Press, Taylor & Francis Group, Boca Raton London New York, 2014. [↩]
- P. I. Good. Permutation, parametric and bootstrap tests of hypotheses. Springer Science+Business Media, Inc, New York, NY, 2005, https://doi.org/10.1007/b138696. [↩]


