Abstract
The population of Cube Satellites in Low Earth Orbit (LEO) has been steadily increasing since 2016, and is expected to increase even more in 2026, prompting concerns of potential orbital debris damage. This study presents an easy-to-implement computational system to calculate collision risks for small satellites with various shapes and altitudes. In the system, the debris flux is estimated by the altitude, the collision probability is modelled using the Poisson distribution, the yearly collision rate is calculated, the probability that at least one impact occurs in a year is calculated, the energy distribution caused by the impact is calculated, and the fraction of the impact energy that could be catastrophic to 1U, 3U and 6U CubeSats at the altitudes of 400 km, 550 km and 800 km is calculated. Debris sizes are assumed to follow a power-law distribution and the energy caused by the impact is assumed to scale with the typical collision speed in LEO is calculated. The results in turn are shown to be that the collision probability is highest at the highest altitude and highest with the largest area of the satellite exposed. The number of impacts with high energy causes a strong skewing of the distribution, and thus a few high-energy impacts can significantly affect mission risk. This model is a simplified version that is not intended to be used in place of more detailed models such as ORDEM or MASTER but is a reproducible and convenient tool to use as an aid to early CubeSat mission planning.
Introduction
The background state of the environment of orbital debris has been the subject of several studies that have introduced complementary methods of describing that environment. The long-term evolutionary models that were developed, like LEGEND and other population models, simulate processes of source/sink populations, fragmentation events, orbital degradation, and future collision activity1,2,3,4,5,6. Studies for individual fragmentation events have also shown that fragmentation events, such as the Fengyun-1C breakup and the Cosmos/Iridium collision, can significantly alter debris distributions in significant altitude bands7,8.
When it comes to providing high fidelity estimates of debris-flux, operational models like NASA’s ORDEM family or ESA’s MASTER related modelling tradition are helpful for mission design, shielding analysis and risk assessment9,10,11. At the same time, research into hypervelocity impact and ballistic limit equations has demonstrated that the susceptibility of satellite modules is also influenced by impacts’ velocity, angle, size, material, and shield architecture12,13,14,15,16.
New challenges arise from the rapid advances of cube satellite, small-satellite and NewSpace missions. CubeSats are frequently deployed in congested regions of LEO, have constrained propulsion/manoeuvring capabilities, and are typically constrained by small mass limits for shielding and backup systems17,18,19,20. Other recent research on satellite constellations and sustainability demonstrates that many satellites can raise collision risk and impact the long-term debris environment if post mission disposal is not robust enough and reliability is not sufficiently high18,21,22,23,24.
Research gap
Advanced debris-environment tools give a higher level of reliability, but may be difficult to use and adapt to simple mission comparisons. The tools don’t always provide a convenient or obvious method for linking the debris estimates at altitude, the area of the spacecraft, collision probabilities and impact severity into a single flow. This means that the early-stage CubeSat designer might not be able to use it to make a comparison of risks without further detailed analysis.
Objectives
This study aims to fill this void by developing a simple and repeatable computational procedure to estimate collision probability for 1U, 3U, and 6U CubeSats at common LEO altitudes, the sensitivity of annual collision frequencies to debris flux and satellite area, simulated debris impact-energy distributions using a power-law size model and a typical collision speed, and comparing the results with published work on debris environments, hypervelocity impacts, CubeSats, constellations and mission design.
Background Information
Orbital Debris Environment
Orbital debris consists of inactive spacecraft, rocket bodies, items left behind from spacecraft missions, spacecraft break-up, and fragments resulting from spacecraft collisions in LEA. The debris density at each altitude varies depending on previous launches, breakups, atmospheric drag, and launch angles and completion of missions4,7,8,18,19.
The results of fragmentation studies suggest that there is typically approximate power-law behaviour: small fragments are much more common than large fragments5,6,25. This is significant for CubeSats, as particles as small as sub-centimetres and millimetres can have hypervelocity impacts12,13,14 that can still damage the satellite.
Collision Hazard Modelling
If the flux of debris is not too high, and impact events are uncorrelated, spacecraft-debris collisions may be considered random events. The anticipated number of impacts per year in this instance is  where the debris flux,
  , is impacts per square meter per year and
  is the effective cross-sectional area of the spacecraft in square meters.
  is the probability that at least one collision occurs in one year. This approach is meant to be simple, and is not a substitute for more detailed analysis such as conjunction assessment, orbit tracking, shielding studies or advanced debris modelling. The model does provide a clear method for comparing the risk due to elevation and exposed area, however, at an early design stage.
Methodology
Overview of the Simulation Framework
The main steps of the simulation are: (1) defining the shape and size of the CubeSat, (2) assigning typical debris flux for each altitude, (3) applying Monte Carlo procedures, sampling debris sizes and masses, (4) calculating impact energies, (5) estimating collision probability using the Poisson method, and (6) comparing results for different altitudes and satellite sizes. The analysis of each CubeSat/altitude configuration was done independently.
Satellite Configurations
There are three different types of CubeSat studied. The cross-sectional areas are approximate and do not account for solar panels, antennae, changes in orientation or other attachments.
| Configuration | Assumed effective cross-sectional area |
| 1U CubeSat | 0.01 m² |
| 3U CubeSat | 0.03 m² |
| 6U CubeSat | 0.06 m² |
Orbital Altitudes and Debris-Flux Assumptions
| Altitude | Assumption based relative debris flux |
| 400 km | 5.0 × 10⁻⁵ impacts m⁻² yr⁻¹ |
| 550 km | 1.2 × 10⁻⁴ impacts m⁻² yr⁻¹ |
| 800 km | 3.5 × 10⁻⁴ impacts m⁻² yr⁻¹ |
Debris Size, Mass, and Impact-Energy Model
The sizes of the debris were distributed following a power law with a range of particle diameters between  m and
m and  m, and each debris was assumed to be a solid aluminium sphere with a density of 2700 kg/m
 , and its mass was calculated as
  . Using 10,000 m/s as a typical collision speed in LEO and the formula
  , collision energy was calculated. A threshold of 1000 J was adopted for small satellites, corresponding to a loss of a mission. This number is only an estimation because factors like shielding, impact angle, location, materials and back-up systems can affect the chances of survival of a spacecraft12,13,14,15,16.
Computational Deployment
The random seed of 42 was used in all simulations, which were performed in Python 3.11 with NumPy for numerical calculations and Matplotlib for plotting figures. In addition, 100,000 debris samples were used for each of the 100 CubeSat/altitudes. It was then used to choose debris sizes by random sampling, after setting the values of the inputs. From the data produced, additional calculations can be performed as follows: compute the mass (m) and the energy (E) for each case; determine the fraction of impacts exceeding the catastrophic threshold (E  Ecat); compute the value of for each case; and convert
  to . To assess the sensitivity of the catastrophic-impact fraction to the random seed, the tests were repeated 30 times using different random seeds. The standard deviation was much smaller than the average, showing that the sample size was large enough for this comparison.
Summary of Adopted Parameters
| Parameter | Symbol | Adopted value | Rationale |
| Relative collision velocity | v | 10,000 m s⁻¹ | Representative LEO debris-collision velocity |
| Debris density | ρ | 2700 kg m⁻³ | Aluminium-like fragment approximation |
| Power-law exponent | α | 2.8 | Fragmentation-inspired size distribution |
| Minimum debris diameter | dmin | 3.0 × 10⁻⁴ m | Lower sampling boundary |
| Maximum debris diameter | dmax | 1.0 × 10⁻² m | Upper sampling boundary |
| Catastrophic-impact threshold | Ecat | 1000 J | Conceptual mission-ending threshold |
| Samples per configuration | N | 100,000 | Convergence-tested sample size |
| Random seed | – | 42 | Reproducibility |
Limitations of the Framework
This method includes several approximations. Debris flux only depends on altitude, no consideration is made for the orbit’s inclination, collision speed is assumed, spacecraft orientation is not taken into account, not detailed modelling of shielding effects, no use of real debris catalogues. Thus, the results should be regarded as approximate comparisons, and not as official risk values for missions.
Data analysis
Expected Annual Collision Rate
The expected collision rate for 1U, 3U, and 6U CubeSats for each year is shown in Figure 1. Under this model, the rate of collision would increase with increasing altitude and area exposed, because λ is proportional to debris flux and area.
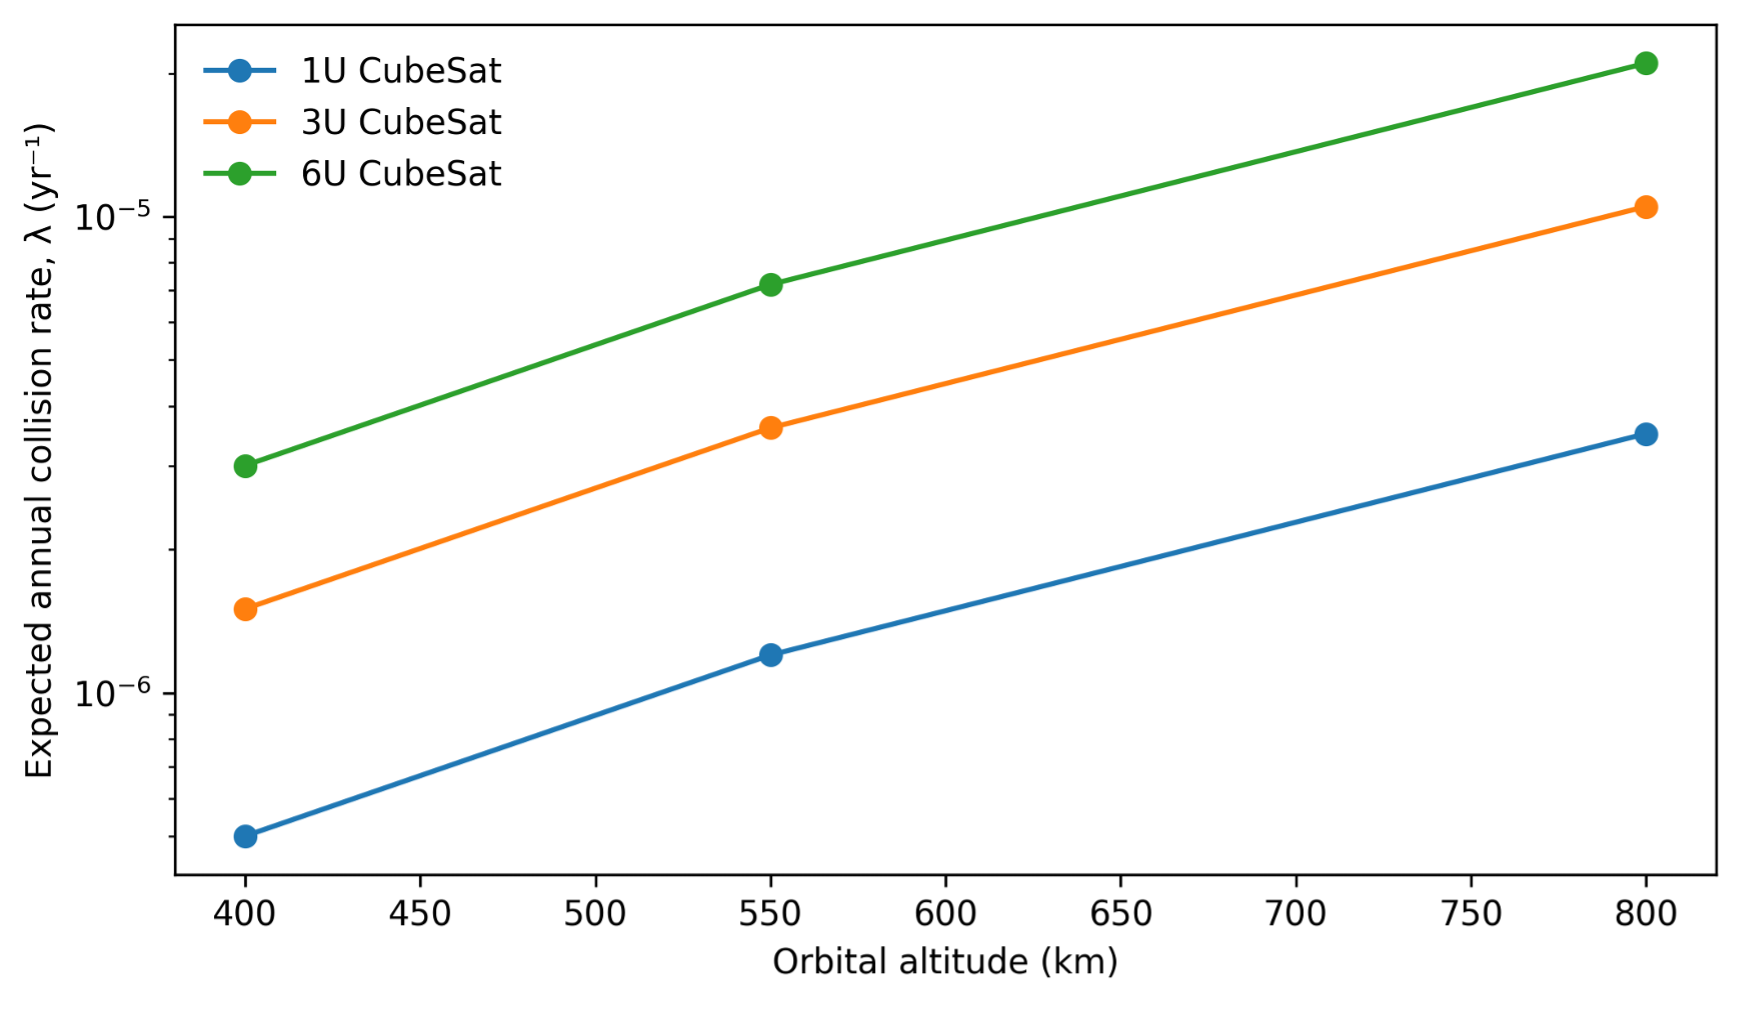
| Altitude | CubeSat | Debris flux (m⁻² yr⁻¹) | Area (m²) | Expected rate λ (yr⁻¹) | P(≥1 collision per year) |
| 400 km | 1U | 5.0e-05 | 0.01 | 5.00e-07 | 5.00e-07 |
| 400 km | 3U | 5.0e-05 | 0.03 | 1.50e-06 | 1.50e-06 |
| 400 km | 6U | 5.0e-05 | 0.06 | 3.00e-06 | 3.00e-06 |
| 550 km | 1U | 1.2e-04 | 0.01 | 1.20e-06 | 1.20e-06 |
| 550 km | 3U | 1.2e-04 | 0.03 | 3.60e-06 | 3.60e-06 |
| 550 km | 6U | 1.2e-04 | 0.06 | 7.20e-06 | 7.20e-06 |
| 800 km | 1U | 3.5e-04 | 0.01 | 3.50e-06 | 3.50e-06 |
| 800 km | 3U | 3.5e-04 | 0.03 | 1.05e-05 | 1.05e-05 |
| 800 km | 6U | 3.5e-04 | 0.06 | 2.10e-05 | 2.10e-05 |
While the probabilities here in this simple one-year model are low, the trend is unmistakable. The 6U CubeSat at 800km will have the greatest collision probability annually due to the largest area and greatest debris flux, while the 1U CubeSat at 400km will have the least collision probability annually, having the smallest area and debris flux.
Catastrophic-Impact Fraction
The percentage of impacts having an impact energy greater than 1000 J is shown in Figure 2. Since for all the cases the debris size, debris speed and energy threshold remain the same, catastrophic-impact fraction remains almost constant. This is because it is constructed, not because the actual catastrophic impact risk is equal at all heights.
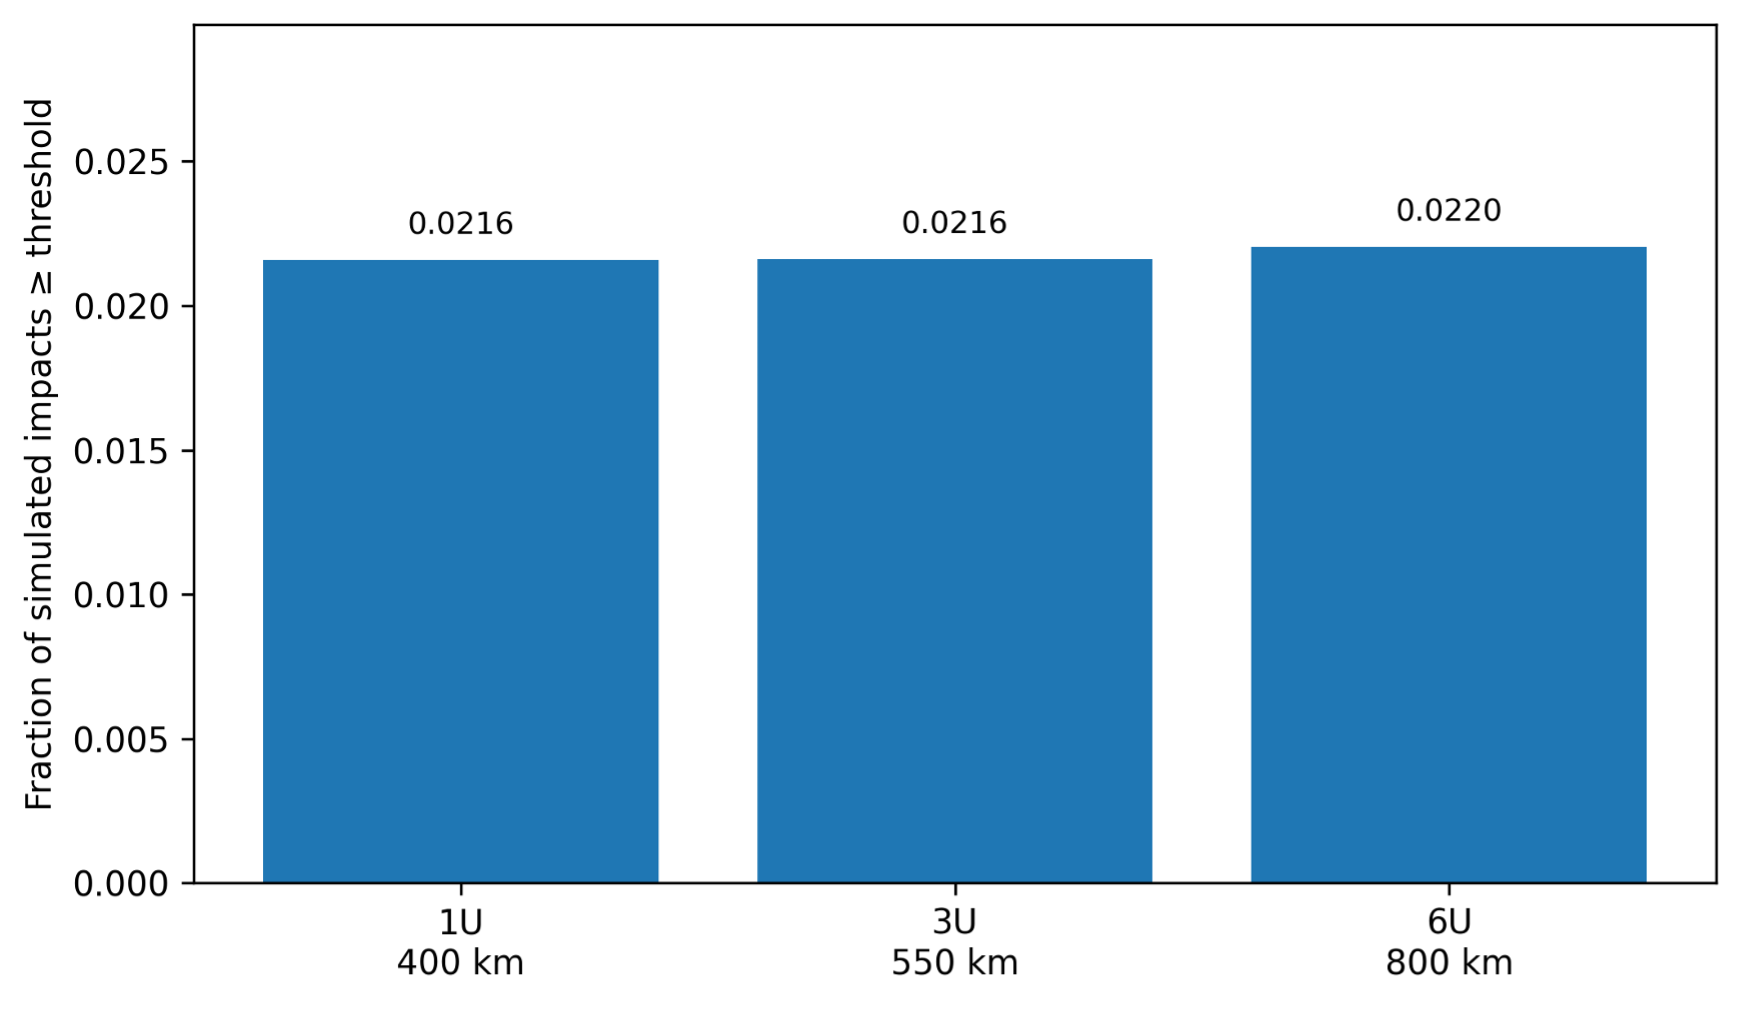
| Altitude | CubeSat configuration | Catastrophic-impact fraction |
| 400 km | 1U | 0.0216 |
| 550 km | 3U | 0.0216 |
| 800 km | 6U | 0.0220 |
Impact-Energy Distribution
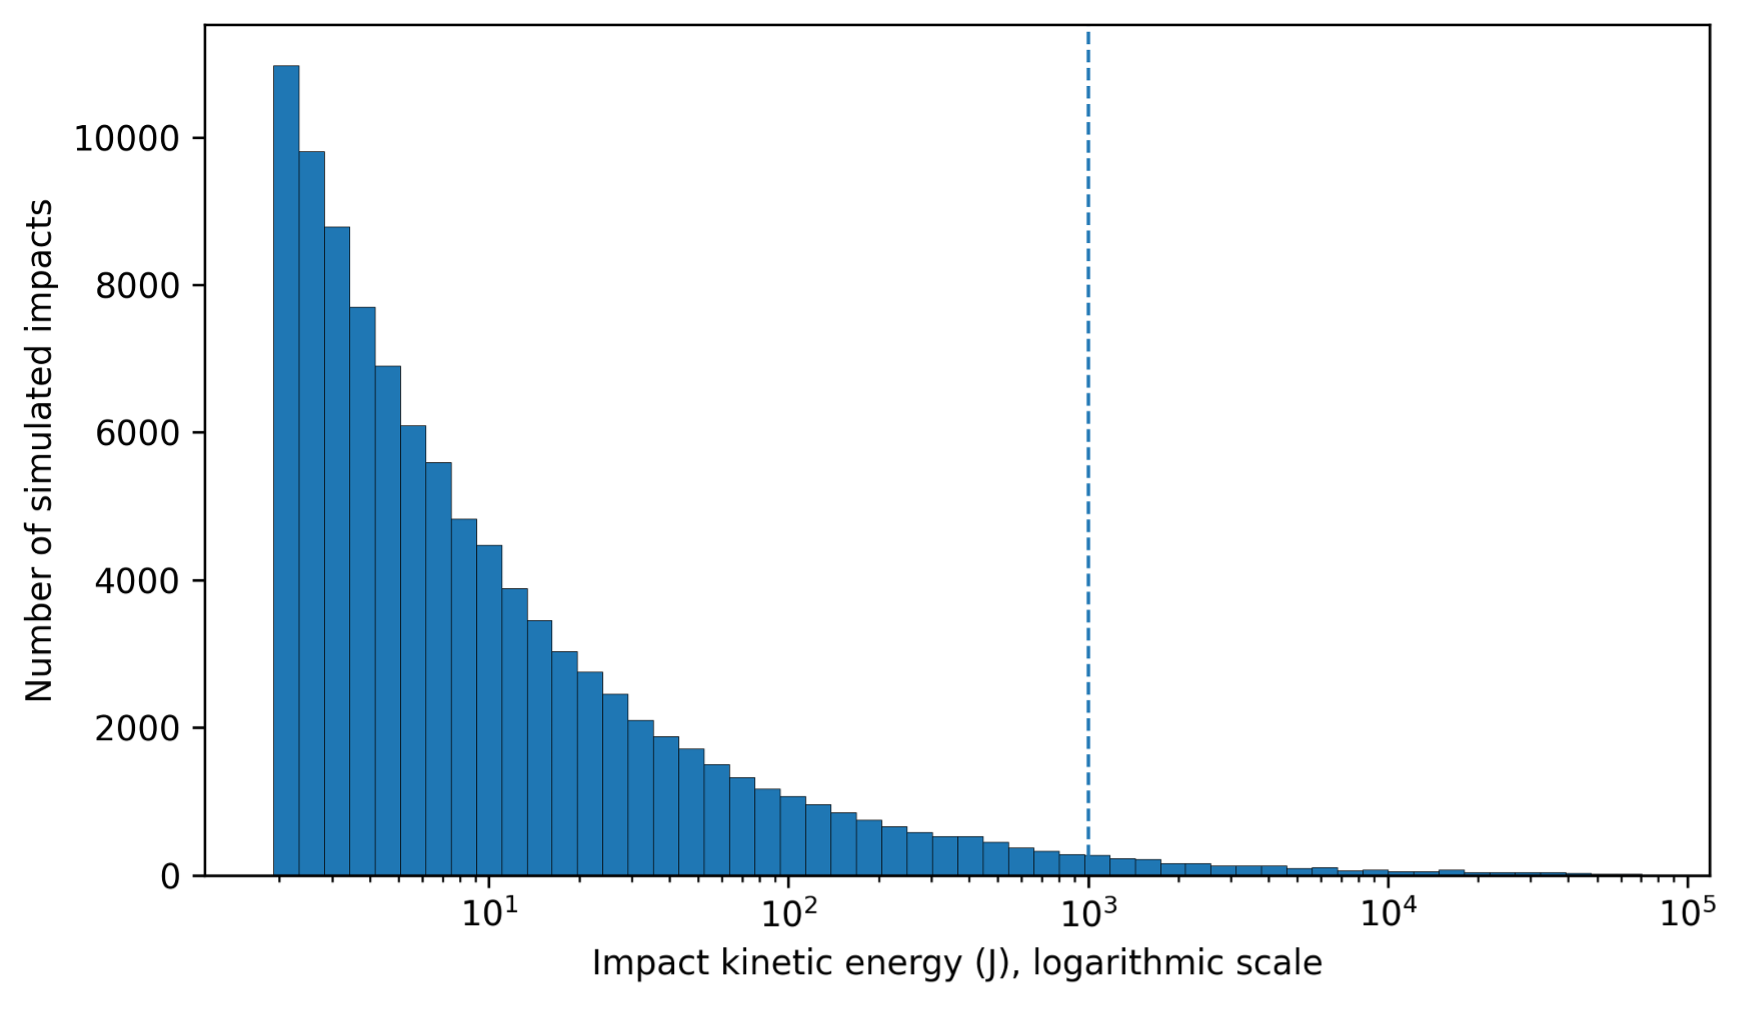
| Statistical quantity | Simulated value |
| Median impact energy | 6.1 J |
| Mean impact energy | 190.7 J |
| 95th percentile energy | 269.2 J |
| Maximum simulated energy | 70281.6 J |
| Catastrophic threshold | 1000 J |
Fraction  threshold threshold | 0.0216 |
Statistical Variability and Convergence Across
The average catastrophic impact fraction was 0.0216 with a standard deviation of 0.0005 in 30 different Monte-Carlo runs of 100,000 samples each. This illustrates that uncertainty due to random sampling is not a major source of uncertainty compared to the large uncertainty due to the simple assumptions used in the model.
| Quantity | Value |
| Number of independent runs | 30 |
| Samples per run | 100,000 |
| Mean catastrophic-impact fraction | 0.0216 |
| Standard deviation | 0.0005 |
Discussion
Comparative Review with Published Work
This study’s trends with respect to altitude and area are comparable to that of other debris-risk studies. Kessler and Cour-Palais demonstrated that the more orbiting objects there are and the larger their cross-section, the more collisions there will be. This model demonstrates this with the dependence of λ on debris flux and satellite area. Total collision activity is also found to be affected by the objects in space and their populations evolution over time by Liou’s studies1,2,3,4.
This is a typical model that matches the results of more detailed debris-environment tools, but it is considerably easier. More sophisticated models, such as ORDEM, MASTER, LEGEND and DELTA, are based on actual data, follow orbits and incorporate changes with time, breakup events etc.4,5,9,11. However, this system is more useful for early comparisons than for the official mission approval; it only requires three flux values for different altitudes. The simulated energy distribution agrees with the results of hypervelocity impact simulations, which shows that the size, speed and protection of the spacecraft play a significant role in the risk from hypervelocity impacts12,13,14,15,16.
The simulation shows that the high-energy end of the tail is quite large, which means that even though the yearly probability of a high energy impact is small, any such impact can have a significant effect on mission outcome. The limited protection, propulsion and fault tolerance of small spacecraft could render them more susceptible if deployed in dense altitude bands for extended missions17,26,18,24.
Practical Mission Design Implications
Results demonstrate several practical CubeSat mission design tips. Coverage and performance should not be the only considerations when selecting altitude; risk should be considered. This model assumes greater annual exposure at higher elevations due to increased debris flux. Additionally, exposed surface area is important: increased exposed surface area, solar panel areas, and certain orientations can all increase collision risk. The designer also needs to consider the protection of subsystems and where to locate critical subsystems for multi-year missions, particularly on high exposure surfaces. Finally, when spacecraft have propulsion or drag-augmentation capability, then conjunction monitoring, a reliable deorbit strategy, and compliance with post mission disposal should also be included in the operational planning. Sometimes, simple models such as this can be used to help identify when a more complex analysis is required. If an early study indicates a large risk at a particular altitude, area, or mission duration, further use of sophisticated tools and particular mission aspects should be considered prior to final decisions.
This approach is done step-by-step, following recommendations in space-debris and mission analysis research27,28. This catastrophic-impact fraction remains nearly constant across the altitudes shown in this model, but this is not the case in LEO because the size of the debris and speed of the collision are assumed constant in the model. In fact, severity of impact would vary depending on other factors such as orbit, angle of encounter, type of object, materials, and protection. What is important to remember is that impact energy is as important as collision frequency in determining risk.
Conclusion
In this study, a simple simulation-based framework is presented to compare risks of debris collisions for CubeSat class spacecraft in LEO. The model allows for clear estimates of the annual collision rate, probability of at least one impact, catastrophic impact fraction, and impact energy distribution by using a combination of altitude-based flux estimates, Poisson collision probability and a Monte Carlo approach to impact energy.
The results further showcase that collision probability increases with both altitude and the satellite’s exposed area. This simulated energy distribution is heavily skewed in the high energy end and this means that even unusual impacts can be devastating. The data indicate that this method could be employed in the early mission planning stages, when all these parameters must be taken into account, and this system is purposely designed to be simple and not a substitute for a detailed debris-environment system or official risk certification. Additional features that would be helpful for future improvements include direct comparisons to ORDEM or MASTER results, detailed shielding models, and evolving debris populations, among others.
References
- J.-C. Liou. An active debris removal parametric study for LEO environment remediation. Advances in Space Research. Vol. 47, pg. 1865-1876, 2011, https://doi.org/10.1016/j.asr.2011.02.003. [↩] [↩]
- J.-C. Liou, D. T. Hall, P. H. Krisko, J. N. Opiela. LEGEND – A three-dimensional LEO-to-GEO debris evolutionary model. Advances in Space Research. Vol. 34, pg. 981-986, 2004, https://doi.org/10.1016/j.asr.2003.02.027. [↩] [↩]
- N. L. Johnson, P. H. Krisko, J.-C. Liou, P. D. Anz-Meador. NASA’s new breakup model of EVOLVE 4.0. Advances in Space Research. Vol. 28, pg. 1377-1384, 2001, https://doi.org/10.1016/S0273-1177(01)00423-9. [↩] [↩]
- P. H. Krisko. Proper implementation of the 1998 NASA breakup model. Orbital Debris Quarterly News. Vol. 15, pg. 1-10, 2011. [↩] [↩] [↩] [↩]
- C. Pardini, L. Anselmo. Assessment of the consequences of the Fengyun-1C breakup in low Earth orbit. Advances in Space Research. Vol. 44, pg. 545-557, 2009, https://doi.org/10.1016/j.asr.2009.04.014. [↩] [↩] [↩]
- L. Anselmo, C. Pardini. Analysis of the consequences in low Earth orbit of the collision between Cosmos 2251 and Iridium 33. Proceedings of the 21st International Symposium on Space Flight Dynamics, Toulouse, France, 2009. [↩] [↩]
- E. L. Christiansen. Design and performance equations for advanced meteoroid and debris shields. International Journal of Impact Engineering. Vol. 14, pg. 145-156, 1993, https://doi.org/10.1016/0734-743X(93)90016-Z. [↩] [↩]
- E. L. Christiansen, J. H. Kerr. Ballistic limit equations for spacecraft shielding. International Journal of Impact Engineering. Vol. 26, pg. 93-104, 2001, https://doi.org/10.1016/S0734-743X(01)00070-7. [↩] [↩]
- S. Ryan, M. Bjorkman, E. L. Christiansen. Whipple shield performance in the shatter regime. International Journal of Impact Engineering. Vol. 38, pg. 504-510, 2011, https://doi.org/10.1016/j.ijimpeng.2010.10.022. [↩] [↩]
- M. Swartwout. The first one hundred CubeSats: A statistical look. Journal of Small Satellites. Vol. 2, pg. 213-233, 2013. [↩]
- K. Woellert, P. Ehrenfreund, A. J. Ricco, H. Hertzfeld. CubeSats: Cost-effective science and technology platforms for emerging and developing nations. Advances in Space Research. Vol. 47, pg. 663-684, 2011, https://doi.org/10.1016/j.asr.2010.10.009. [↩] [↩]
- J.-C. Liou. Collision activities in the future orbital debris environment. Advances in Space Research. Vol. 38, pg. 2102-2106, 2006, https://doi.org/10.1016/j.asr.2005.06.021. [↩] [↩] [↩] [↩]
- J.-C. Liou, N. L. Johnson. A sensitivity study of the effectiveness of active debris removal in LEO. Acta Astronautica. Vol. 64, pg. 236-243, 2009, https://doi.org/10.1016/j.actaastro.2008.07.009. [↩] [↩] [↩] [↩]
- B. Bastida Virgili, J. C. Dolado, H. G. Lewis, J. Radtke, H. Krag, B. Revelin, C. Cazaux, C. Colombo, R. Crowther, M. Metz. Risk to space sustainability from large constellations of satellites. Acta Astronautica. Vol. 126, pg. 154-162, 2016, https://doi.org/10.1016/j.actaastro.2016.03.034. [↩] [↩] [↩] [↩]
- L. Olivieri, A. Francesconi. Large constellations assessment and optimization in LEO space debris environment. Advances in Space Research. Vol. 65, pg. 351-363, 2020, https://doi.org/10.1016/j.asr.2019.09.048. [↩] [↩] [↩]
- S. D. Diserens, H. G. Lewis, J. Fliege. Assessing collision algorithms for the NewSpace era. Journal of Space Safety Engineering. Vol. 7, pg. 274-281, 2020, https://doi.org/10.1016/j.jsse.2020.07.021. [↩] [↩] [↩]
- S. D. Diserens, H. G. Lewis, J. Fliege. NewSpace and its implications for space debris models. Journal of Space Safety Engineering. Vol. 7, pg. 502-509, 2020, https://doi.org/10.1016/j.jsse.2020.07.027. [↩] [↩]
- Y. Liu, X. Zhang, X. Xu. Analytical propagation of space debris density for space situational awareness. Space: Science & Technology. Vol. 2022, pg. 9825763, 2022, https://doi.org/10.34133/2022/9825763. [↩] [↩] [↩] [↩]
- H. Zhang, Z. Li, W. Wang, Y. Zhang, H. Wang. Geostationary orbital debris collision hazard after a collision. Aerospace. Vol. 9, pg. 258, 2022, https://doi.org/10.3390/aerospace9050258. [↩] [↩]
- Y. Ruan, L. Chen, Y. Zhang. Assessing short-term and long-term collision risks in low Earth orbit satellite constellations. Applied Sciences. Vol. 14, pg. 2953, 2024, https://doi.org/10.3390/app14072953. [↩]
- A. Pai, R. Divakaran, S. Anand, S. B. Shenoy. Advances in the Whipple shield design and development: A brief review. Journal of Dynamic Behavior of Materials. Vol. 8, pg. 1-18, 2022, https://doi.org/10.1007/s40870-021-00314-7. [↩]
- S. Ryan. pyBLOSSUM: An open-source Python repository for assessing the ballistic limit of spacecraft structures under space debris impact. International Journal of Impact Engineering. Vol. 203, pg. 105365, 2025, https://doi.org/10.1016/j.ijimpeng.2025.105365. [↩]
- M. Shan, J. Guo, E. Gill. Review and comparison of active space debris capturing and removal methods. Progress in Aerospace Sciences. Vol. 80, pg. 18-32, 2016, https://doi.org/10.1016/j.paerosci.2015.11.001. [↩]
- J. R. Wertz, W. J. Larson. Space mission analysis and design. 3rd ed., Microcosm Press, 1999. [↩] [↩]
- K. Nomura, M. Jah, A. Rao. Tipping points of space debris in low Earth orbit. International Journal of the Commons. Vol. 18, pg. 110-126, 2024, https://doi.org/10.5334/ijc.1275. [↩]
- N. Cimmino, F. Letizia, C. Colombo, A. Francesconi, A. Rossi. Tuning of NASA Standard Breakup Model for fragmentation events in LEO. Aerospace. Vol. 8, pg. 185, 2021, https://doi.org/10.3390/aerospace8070185. [↩]
- H. Klinkrad. Space debris: Models and risk analysis. Springer, 2006. [↩]
- European Space Agency Space Debris Office. ESA’s annual space environment report. European Space Agency, Darmstadt, 2025. [↩]